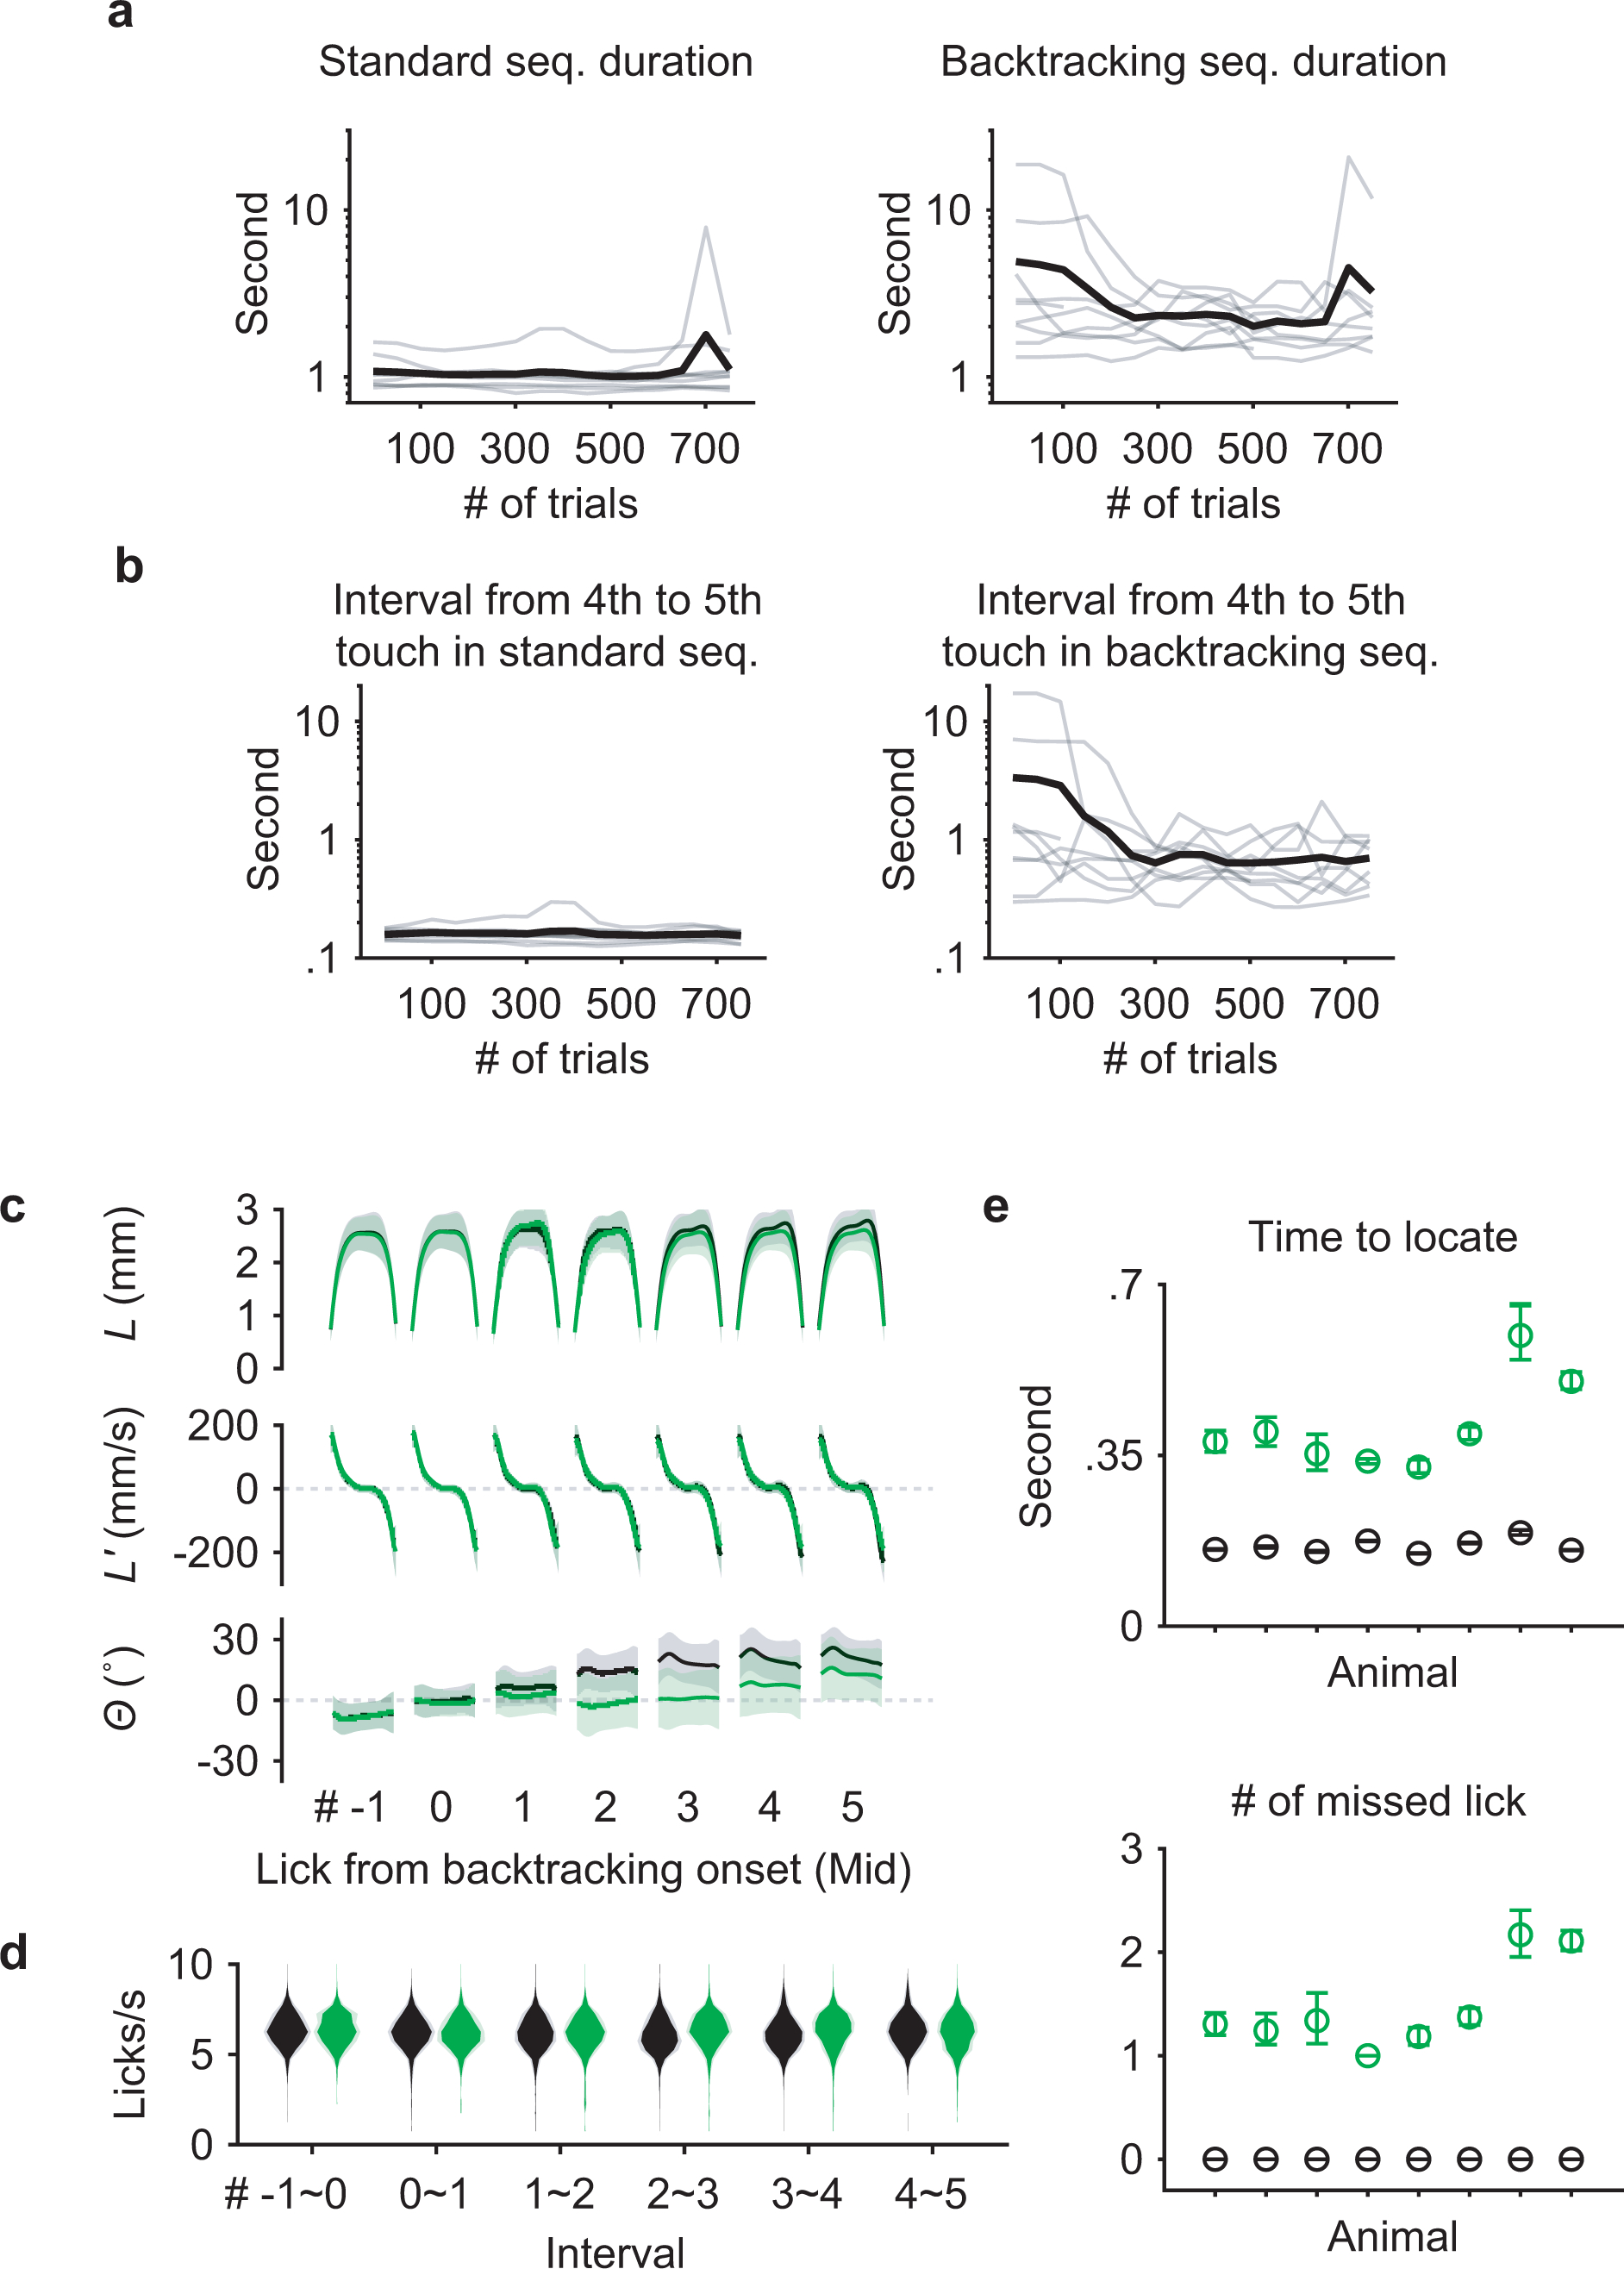
Extended Data Fig. 2. Performance in backtracking sequences.

a, Learning curves for 9 individual mice (gray) and the mean (black) showing the duration of time spent to perform standard (left) and backtracking (right) sequences.
b, Similar to (a) but limited to the interval following the middle lick in standard (left) or backtracking (right) sequences.
c, L, L’ and Θ patterns for seven consecutive licks aligned at the Mid touch (#0). Licks in standard sequences (n = 7458 trials) are shown in black, those in backtracking sequences (n = 2695 trials) are in green. Mean ± SD.
d, Probability distributions of instantaneous lick rate for each interval separating consecutive pairs of the seven licks during standard (black) or backtracking (green) sequences (n = 8 mice; mean ± SD).
e, Top, time to locate the port at its next position during the 4th interval, for standard sequences (black) or for sequences when the port backtracked (green). Bottom, the number of missed licks during the 4th interval. Mean ± 95% bootstrap confidence interval. n = 7458 standard and 2695 backtracking sequences from 47 total sessions.
