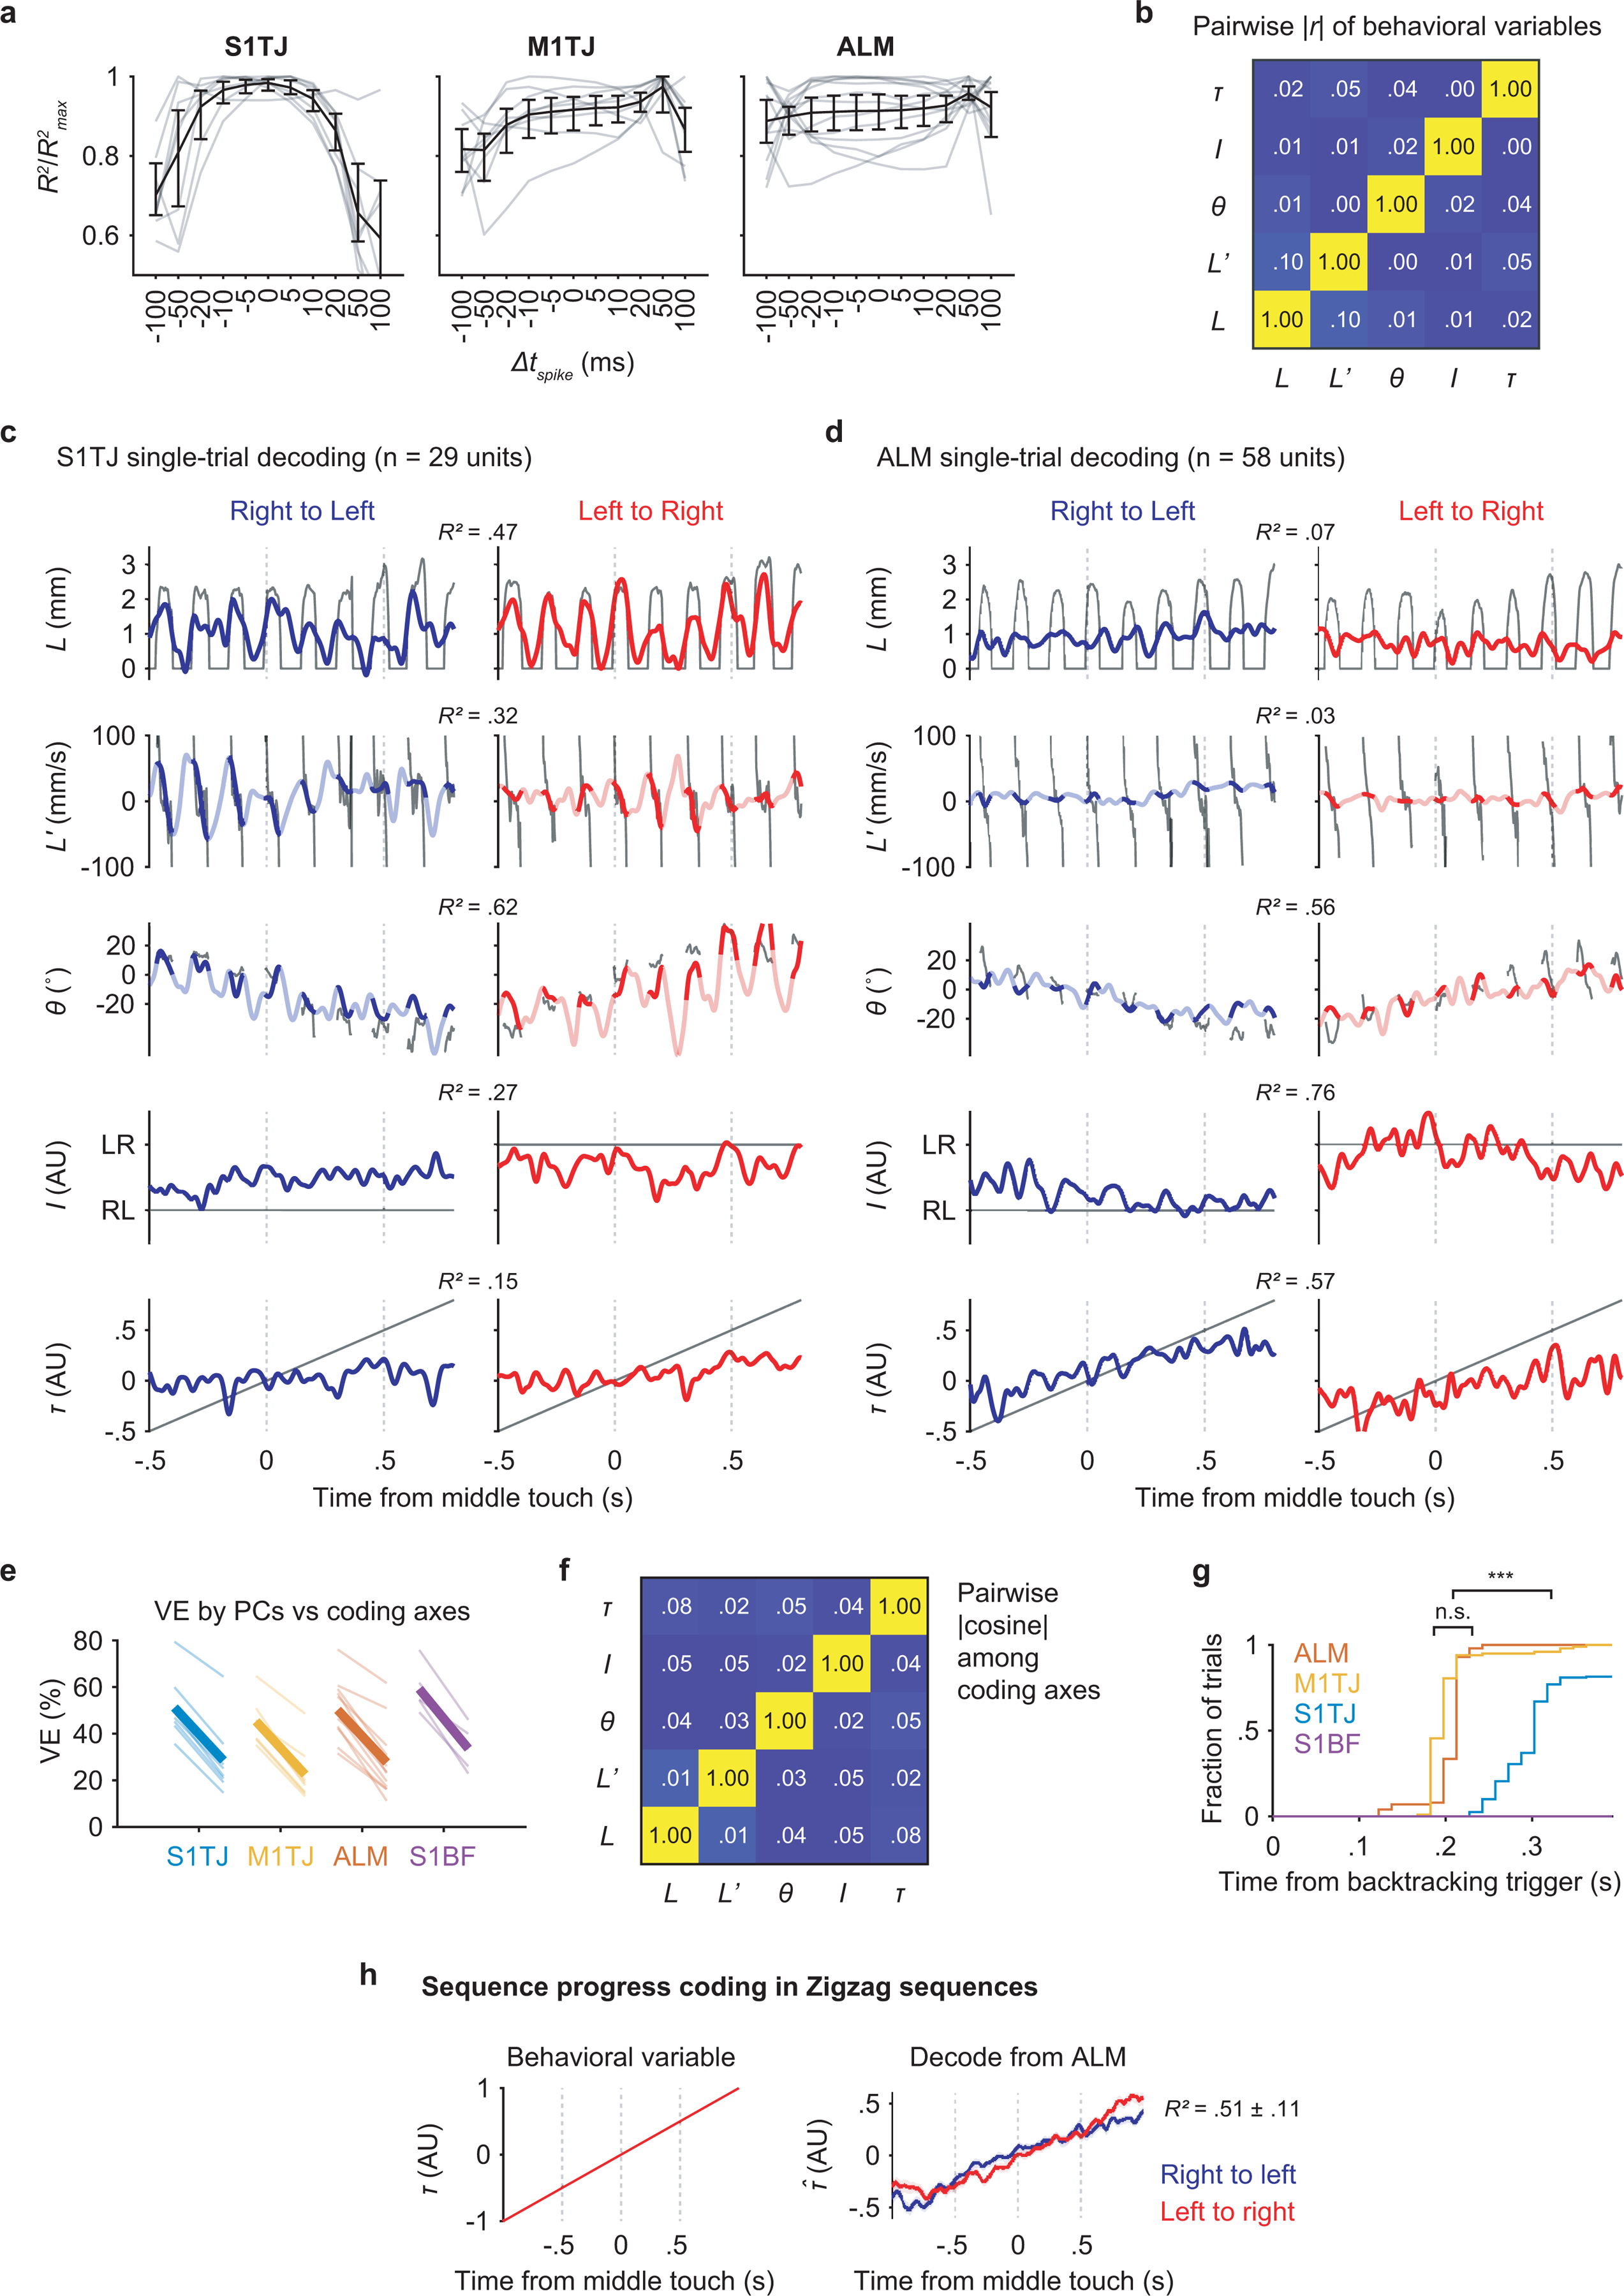
Extended Data Fig. 5. Additional analyses for population coding.

a, Relative goodness of fit of tongue angle regressions with a range of shifts in spike times. Black traces and error bars show mean ± 95% bootstrap confidence interval. Lighter traces show individual recordings. (S1TJ, n = 8 sessions; M1TJ, n = 9 sessions; ALM, n = 13 sessions)
b, Absolute pairwise Pearson’s correlation coefficients among the five behavioral variables (mean; n = 35 sessions).
c, Single-trial decoding of the five behavioral variables (rows; black traces) from 29 simultaneously recorded S1TJ units in a right-to-left (left) and a left-to-right (right) sequence.
d, Same as (c) but decoding from 58 simultaneously recorded units in ALM.
e, Total percent variance explained (VE) by the first five principal components (left in each region) versus that by the five coding axes (right in each region) during sequence execution. Lighter lines show individual recording sessions and thicker lines show the means.
f, Absolute pairwise cosine values among coding axes (mean; n = 35 sessions).
g, Cumulative time histograms showing the fraction of trials that could be correctly classified as a standard vs backtracking sequence as time progresses. Two-tailed bootstrap test, ∗∗∗ p ≈ 0, n.s. p = 0.91.
h, Same as sequence progress in Fig. 3a,b, but for “zigzag” sequences.
