

Abstract
Motor cortical representations reorganize following cervical spinal cord injury (SCI). The functional role of this reorganization remains largely unknown. Using neuronavigated transcranial magnetic stimulation, we examined motor cortical maps during voluntary contraction in humans with chronic cervical SCI and age-matched controls. We constructed motor maps in the first dorsal interosseous (FDI) muscle at rest and during voluntary contraction of the FDI with and without voluntary contraction of the biceps brachi (BB). The role of sensory input into this reorganization was examined by muscle-tendon vibration. We found, at rest, that motor maps were larger in SCI (22.3 cm2) compared with control (12.6 cm2, P < 0.001) participants. Motor map area increased during voluntary contraction of the FDI (120.7%) and further increased during contraction of the BB (143.9%) compared with rest in control subjects; however, motor map area decreased during voluntary contraction of the FDI (69.5%) and further decreased during contraction of the BB (55.5%) in individuals with SCI. SCI participants with larger decreases in map area during voluntary contraction of the FDI were those with larger sensory deficits in the hand and 10 minutes of hand muscle-tendon vibration increased motor map area. These results provide the first evidence of abnormal changes in motor cortical maps in humans with chronic SCI during voluntary contraction, suggesting that sensory input can help to reshape this reorganization.
Introduction
Animal models of traumatic spinal cord injury (SCI) have demonstrated changes in the topographic organization in the motor cortex, showing that cortical areas occupied by still intact axons are enlarged and occupy retracted regions (Fouad et al. 2001; Nishimura et al. 2007; Martinez et al. 2010; Kambi et al. 2011; Tandon et al. 2013). In agreement, electrophysiological studies in humans with SCI using transcranial magnetic stimulation (TMS) over the primary motor cortex revealed larger motor cortical maps in muscles where motoneurons are located close to the injury site compared with uninjured control subjects (Levy et al. 1990; Cohen et al. 1991; Topka et al. 1991; Jurkiewicz et al. 2007). Despite these numerous reports of cortical reorganization, the extent of reorganization on motor cortical representations during voluntary contraction following SCI remains largely unknown.
In uninjured humans, the area of motor maps examined by TMS changes during voluntary contraction. For example, the area of motor maps in distal arm muscles increase in area during tonic isometric voluntary contraction compared with rest (Ridding et al. 1995; Wilson et al. 1995; Classen et al. 1998; Ngomo et al. 2012; van de Ruit & Grey, 2016). These changes have been interpreted as the unmasking of silent corticospinal neurons responsible for muscle activity due to increased excitability in the corticospinal pathway (Classen et al. 1998; van de Ruit & Grey, 2016). Intrinsic connections exist between distal and proximal representations of the primary motor cortex (Gould et al. 1986; Huntley & Jones, 1991) and there is a large overlap between distal and proximal motor maps (Devanne et al. 2002). In agreement, functional magnetic resonance imaging (fMRI) (Grafton et al. 1993) and TMS (Devanne et al. 2002; Dominici et al. 2005; Ginanneschi et al. 2005) studies in humans showed that motor tasks that involve distal and proximal arm muscles engage overlapping motor cortical regions. Furthermore, a voluntary contraction of a proximal arm muscle increases the area of a motor map in a hand muscle (Tyč & Boyadjian, 2011). Thus, it is expected that motor maps in a hand muscle will increase during voluntary contraction and will further increase during additional contraction of a proximal arm muscle.
Although no information exists about changes in motor maps during a voluntary behavior following SCI, other available data allows us to make some predictions. The size of motor evoked potentials (MEPs) elicited by cortical (Davey et al. 1999; Bunday et al. 2014) and subcortical (Vastano & Perez, 2020) stimulation in intrinsic hand muscles, which are used to construct motor maps, increases during tonic voluntary contraction in humans with SCI but to a much lesser extent compared with control subjects. Additionally, in contrast to controls, the size of MEPs in hand muscles remains unchanged by voluntary contraction of proximal arm muscles in people with SCI (Bunday & Perez, 2012). Motor cortical map area is reduced after loss of sensory input at rest (Rossini et al. 1996) and during voluntary contraction (Rossi et al. 1998) and people with SCI show deficits in sensory function (Ozdemir & Perez, 2017). We hypothesized that in humans with chronic incomplete cervical SCI, a voluntary contraction results in reduced facilitatory effects on motor maps compared with control subjects related, at least part, to changes in sensory input.
Methods and Methods
Participants.
Twenty-two individuals with SCI (54.4 ± 14.5 years, three females; Table 1) and 17 age-matched uninjured controls (48.1 ± 15.6 years, six females) participated in the study. All participants gave informed consent to experimental procedures, which were approved by the local ethics committees at the University of Miami (IRB protocol number 20150069). The study was performed in accordance with the Declaration of Helsinki. SCI participants had a chronic injury (≥ 1 year) and were classified using the International Standards for Neurological Classification of Spinal Cord Injury (ISNCSCI) exam as having a C2–C8 SCI and by the American Spinal Cord Injury Association Impairment Scale (AIS) as AIS A (n = 2), AIS C (n = 12) or AIS D (n = 8; Table 1). Two of the SCI participants were classified as AIS A (complete injury) due to the lack of sacral sparing (Marino et al. 2003) despite being able to perform voluntary contraction with finger and arm muscles.
Table 1.
Demographics of SCI subjects
| Participants | Age | Gender | Level | AIS | Aetiology | Time since injury (yrs) | EPT (mA) | ||
|---|---|---|---|---|---|---|---|---|---|
| C6 | C7 | C8 | |||||||
| 1 | 52 | M | C5 | D | T | 3 | 1.00 | 1.10 | 0.95 |
| 2 | 61 | F | C5 | C | T | 15 | 1.30 | 1.70 | 2.40 |
| 3 | 39 | M | C5 | C | T | 2 | n/k | n/k | n/k |
| 4 | 65 | M | C4 | D | T | 8 | 1.55 | 1.35 | 1.20 |
| 5 | 34 | M | C7 | C | T | 11 | n/k | n/k | n/k |
| 6 | 57 | M | C8 | D | T | 2 | 1.40 | 1.75 | 1.30 |
| 7 | 79 | M | C8 | C | T | 6 | 2.45 | n/k | n/k |
| 8 | 45 | F | C7 | A | T | 23 | 1.85 | 1.35 | 1.70 |
| 9 | 54 | M | C3 | C | T | 1 | 0.9 | 2.15 | 2.30 |
| 10 | 43 | M | C5 | C | T | 8 | n/k | n/k | n/k |
| 11 | 59 | M | C5 | D | T | 2 | 1.40 | 1.70 | 1.80 |
| 12 | 49 | M | C3 | D | T | 28 | 0.9 | 1.10 | 0.82 |
| 13 | 64 | M | C5 | C | T | 5 | 2.35 | 2.25 | 2.45 |
| 14 | 68 | M | C4 | C | T | 5 | n/k | n/k | n/k |
| 15 | 72 | M | C2 | C | T | 5 | n/k | n/k | n/k |
| 16 | 53 | F | C5 | C | T | 14 | n/k | n/k | n/k |
| 17 | 65 | M | C4 | C | T | 5 | n/k | n/k | n/k |
| 18 | 20 | M | C2 | C | T | 4 | n/k | n/k | n/k |
| 19 | 33 | M | C3 | D | T | 9 | n/k | n/k | n/k |
| 20 | 69 | M | C3 | D | T | 6 | n/k | n/k | n/k |
| 21 | 66 | M | C5 | A | NT | 5 | n/k | n/k | n/k |
| 22 | 49 | M | C4 | D | NT | 3 | n/k | n/k | n/k |
M = Male, F = Female, T = Trauma, NT = Non-trauma, AIS = American Spinal Cord Injury Association Impairment Scale, EPT = Electrical perceptual threshold (dermatomes C6-C8 in the side tested by TMS)
EMG recordings.
EMG was recorded from the first dorsal interosseous (FDI), abductor digiti minimi (ADM), and biceps brachi (BB) muscles of the right side (dominant side) in controls and the less affected side in SCI participants through surface electrodes (Ag-AgCl, 10 mm diameter), secured to the skin over the muscle belly (Fig. 1B). EMG signals were amplified and filtered (bandwidth 30–2000 Hz) with a bioamplifier (NeuroLog System, Digitimer, Welwyn Garden City, UK) and then converted to digital data with a sampling rate of 5 kHz with an A/D converter (CEDMicro 1401 with Signal software, Cambridge Electronic Design, Cambridge, UK) and stored on a computer for off-line analysis.
Figure 1.
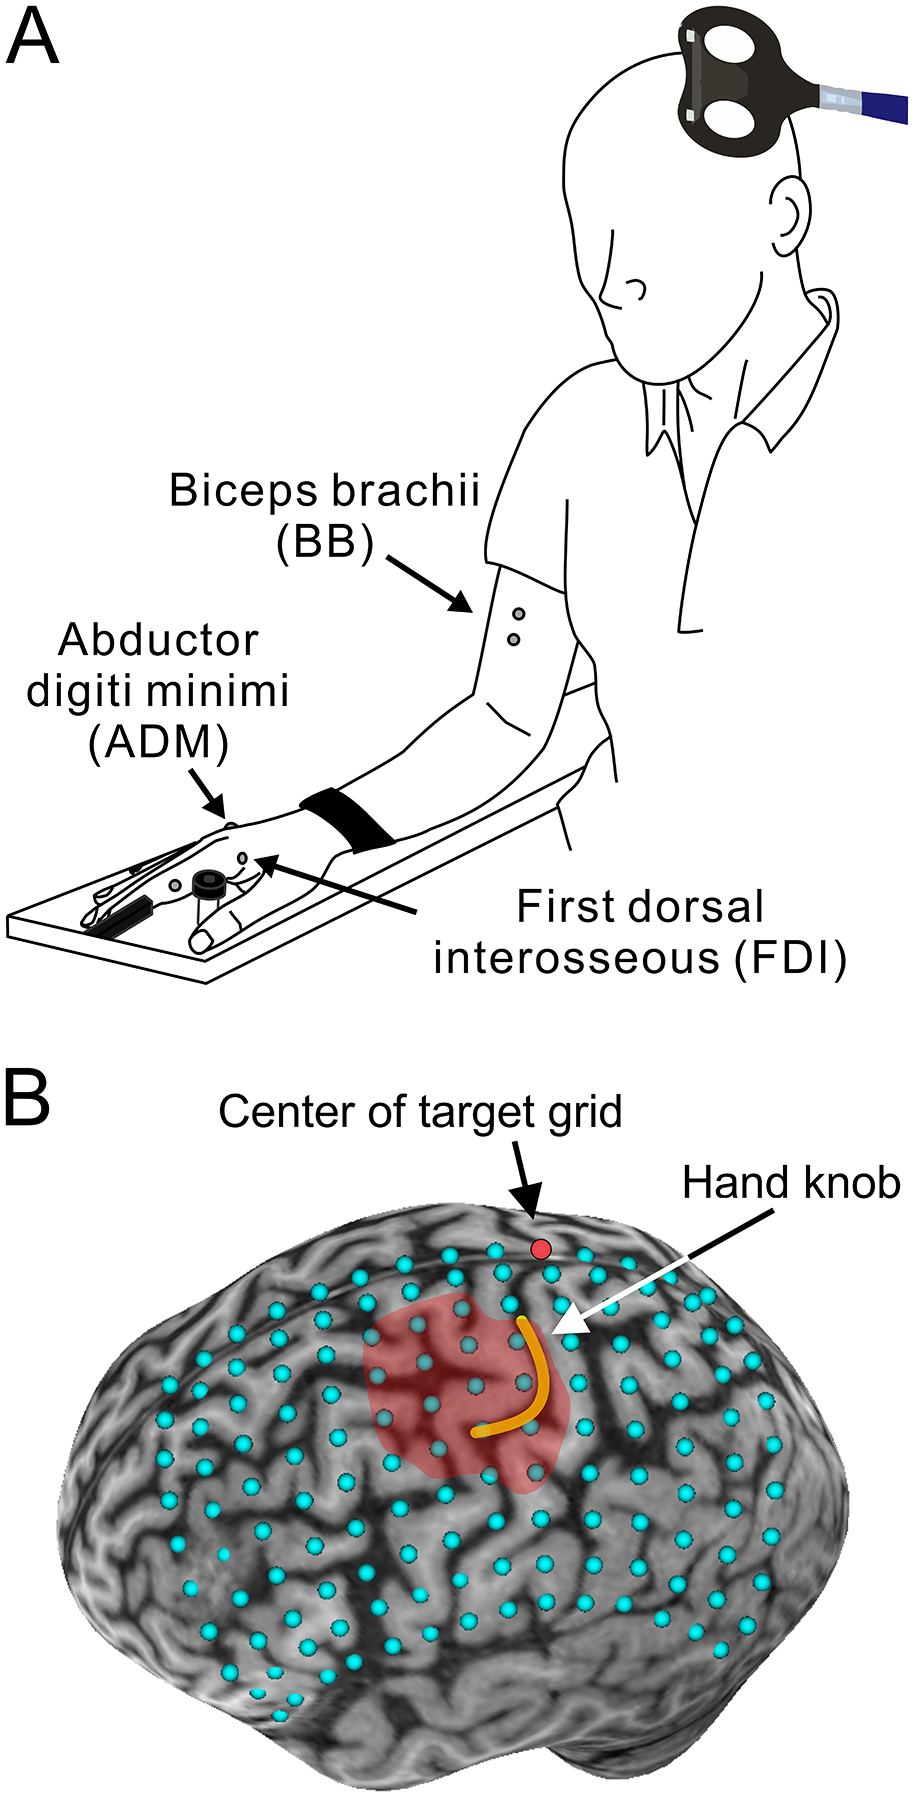
Experimental setup. A. Schematic illustration of the participant’s posture during the experiments. B. Transcranial magnetic stimulation (TMS) targets superimposed on the reconstructed 3D brain image (14 × 10 grid with 1 cm gaps). The red dot indicates the center of grid located at the intersection where the central sulcus meets up with the longitudinal fissure. The yellow line draws the central sulcus folding hand knob area on the precentral gyrus. The red shaded area represents a motor map of the first dorsal interosseous (FDI) muscle.
Experimental procedures.
Participants sat on an experimental chair with the elbow flexed by 90°, the forearm pronated, and the wrist strapped to an armrest (Fig. 1A). At the beginning of each experiment, three maximum voluntary contractions (MVCs) were performed for 3–5 s into index finger abduction (controls = 702.2 ± 191.3 μV, SCI = 354.6 ± 200.2 μV; P < 0.001), little finger abduction (controls = 976.2 ± 251.9 μV, SCI = 393.4 ± 438.6 μV; P = 0.03), and elbow flexion (controls = 724.8 ± 307.9 μV, SCI = 796.3 ± 416.2 μV; P = 0.6) separated by 30 s of rest. MVC values were used to normalize the level of contraction across muscles and participants. We selected the FDI muscle to examine motor maps in the hand representation of the primary motor cortex because of its strong corticomotoneuronal projections (Buys et al. 1986; Ziemann et al. 2004), extensive information existing about corticospinal control of this muscle in people with and without SCI (Barry et al. 2013; Bunday et al. 2014; Cirillo et al. 2016; Federico & Perez, 2017; Jo & Perez, 2019), and its low TMS threshold. To avoid unwanted muscle contractions of the BB during tasks involving only FDI muscle contraction, we tested motor maps in the FDI during 5% of isometric MVC. Note that this low level of voluntary contraction with a hand muscle minimizes activation of proximal arm muscles (Soteropoulos & Perez, 2013). Motor maps in the FDI were tested in a randomized order with the FDI muscle at rest (condition referred as ‘rest’; controls, n = 17; SCI, n = 15), during 5% of FDI isometric MVC (condition referred to as ‘FDI’; controls: FDI = 5.1 ± 0.3% of MVC, n = 17; SCI: FDI = 5.2 ± 1.0% of MVC, n = 15) and during 5% of FDI isometric MVC and 5% of BB isometric MVC (condition referred to as ‘FDI + BB’; controls: FDI = 5.4 ± 0.5% of MVC, BB = 5.5 ± 5.0% of MVC, n = 10; SCI: FDI = 5.0 ± 0.5% of MVC, BB = 7.1 ± 4.8% of MVC, n = 11). To assess if our effects were specific to interactions between distal and proximal cortical representations, in an additional control experiment, we tested if muscle contraction of the ADM affected motor maps in the FDI. Thus, FDI motor maps were tested during 5% of FDI isometric MVC and 5% of ADM isometric MVC (condition referred to as ‘FDI + ADM’; controls, FDI = 5.4 ± 0.5% of MVC, ADM = 5.3 ± 4.0% of MVC, n = 6; SCI, FDI = 5.1 ± 0.5% of MVC, ADM = 6.7 ± 2.6% of MVC, n = 7). As in previous studies (Bunday et al. 2014; Vastano & Perez, 2020), EMG activity from each muscle tested was displayed continuously on an oscilloscope and verbal feedback was provided to ensure that physiological measurements were acquired at similar EMG activity at all times. A familiarization trial was completed at the beginning of each experiment to ensure that subjects were able to match EMG activity in each muscle tested during each task.
TMS.
We delivered TMS using a Magstim 2002 stimulator (Magstim, Whitland, UK) through a figure-eight coil (custom made loop diameter, 70 mm; type number SP15560) with a monophasic current waveform. The hot spot for eliciting the largest MEP in the FDI was determined with the coil held tangential to the scalp and the handle pointing backward, 45° away from the midline of the brain to induce the currents in the brain flowing in a posterior-anterior direction. At the hot spot, we measured resting (RMT) and active (AMT) motor threshold. RMT was defined as the minimal stimulus intensity required to induce MEPs > 50 μV peak-to-peak amplitude above the background EMG in 5/10 consecutive trials in the relaxed muscle. AMT was defined as the minimal stimulus intensity required to induce MEPs > 200 μV peak-to-peak amplitude above the background EMG in 5/10 consecutive trials during 5% of MVC (Table 2) (Rothwell et al. 1999). The maximal MEP (MEP-max) was quantified by increasing stimulus intensities in 5% steps of maximal device output until the MEP amplitude did not show additional increases. The maximal motor response (M-max) was evoked by supramaximal electrical stimulation of the ulnar nerve at rest (Table 2).
Table 2.
Motor threshold, MEP-max, M-max, MVC
| Uninjured controls | Spinal cord injury | |
|---|---|---|
| RMT (% MSO) | 43.2 ± 10.4 | 56.2 ± 10.2* |
| AMT (% MSO) | 39.7 ± 10.5 | 53.5 ± 9.6* |
| MEP-max amplitude (mV) | ||
| Rest | 4.84 ± 1.7 | 1.79 ± 1.8* |
| Voluntary contraction | 9.36 ± 2.5 | 3.51 ± 2.8* |
| MEP-max latency (ms) | ||
| Rest | 22.3 ± 1.5 | 26.8 ± 2.4* |
| Voluntary contraction | 21.4 ± 1.4 | 25.0 ± 2.2* |
| M-max amplitude (mV) | 18.7 ± 3.3 | 10.7 ± 6.3* |
| M-max latency (ms) | 4.44 ± 0.5 | 4.55 ± 0.5 |
Values are mean ± standard deviation,
p < 0.05.
Motor maps.
To generate motor maps in the FDI muscle, we used a frameless stereotactic neuronavigation system (Brainsight, Rogue Research, Montreal, Canada) that allowed us to position the TMS coil over specified mapped targets. TMS targets were presented on a grid superimposed on a 3D brain image for each participant (Fig. 1B). The grid was centered at the intersection where the central sulcus met the longitudinal fissure on the dorsal aspect of the brain (red grid point in Fig. 1B) and extended 10 cm lateral, 9 cm anterior, and 3 cm posterior from the center with 1 cm spacing (Kleim et al. 2007; Freund et al. 2011b). Ten single pulses were given at each grid point at 4 s intervals with intensity at 120% of RMT [controls = 52.0 ± 12.4% of the maximal stimulator output (MSO), SCI = 67.1 ± 12.3% of MSO, P = 0.001]. Stimulation started at the grid point closest to the hot spot where the RMT was measured, and the motor map area was defined as adjacent points in all directions until 10 TMS pulses did not elicit ≥ 5 MEPs according to the criterion for RMT and AMT (Rest: controls = 24.2 ± 2.4 points; SCI = 39.5 ± 6.9 points, P < 0.001; FDI: controls = 31.3 ± 4.4 points, SCI = 31.7 ± 7.0 points, P = 0.8; FDI + BB: controls = 33.6 ± 4.5 points, SCI = 26.5 ± 5.4 points, P = 0.004; FDI + ADM: controls = 32.0 ± 4.6 points, SCI = 32.3 ± 6.9 points, P = 0.9). Background EMG was measured 100 ms before the TMS stimulus artifact. Motor maps were constructed with MATLAB 7.10 (MathWorks, Natick, MA, USA) using an interpolated method based on the MEP amplitude in all grid points stimulated (Uy et al. 2002). The center of gravity (CoG) of each motor map was calculated using the following formula (Wassermann et al. 1992):
where x, y, and z are grid points transformed into the Montreal Neurological Institute coordinate frame. MEP is the peak-to-peak amplitude of the MEP.
Electrical perceptual threshold (EPT).
We used the EPT to assess residual sensory function in hand muscles (Macklin et al. 2016). Testing was conducted using constant current square wave electrical pulses (0.5 ms pulse width duration, 3 Hz stimulation frequency, DS7A, Digitimer). Stimuli were delivered to the skin over the sensory key point of dermatomes C6, C7, and C8, which corresponded to the index (C6), long (C7), and ring and little (C8) fingers, by using disposable adhesive electrodes. The cathode was positioned over the sensory key point of the dermatome tested and the anode was placed on the ipsilateral arm of the applied stimulus. The stimulus intensity was manually increased in increments of 0.1 mA up to 10 mA. Each subject was given a familiarization trial run in order to recognize the electrical pulses. Subjects were asked to report verbally when the first sensation was felt. The procedure was repeated three times on each dermatome, and the EPT (mA) was calculated as the mean of the intensities when sensation just disappeared during each trial (lowest descending stimulus intensity). The perceived stimulus was described as a light ‘tapping’ or gentle ‘pulsing’ sensation, and was not reported as painful by any of the subjects. Subjects were blind to the amplitude of the stimulus current.
Tendon vibration.
To examine the contribution of afferent input to changes in motor cortical maps in SCI participants, we tested the effect of vibration of the FDI tendon (n = 7) using a previously established protocol (Marconi et al. 2008, 2011). Muscle spindle primary endings (Ia fibers) respond optimally to vibration at frequencies of 60–120 Hz (Roll et al. 1989). Vibration was applied over the tendon of the FDI muscle during 10% of MVC for 10 min at a frequency of 66 Hz. The vibrator was transcutaneously attached to the distal FDI tendon and fixed to keep vibratory amplitude low so any kinesthetic illusion or tonic vibrator reflex were not induced (Marconi et al. 2008, 2011). Before and immediately after vibration, motor cortical maps were measured at rest, during FDI contraction, and during FDI and BB contraction, in a randomized order. To minimize the testing duration for acquiring each motor map, we used a random-walk stimulation technique (van de Ruit et al. 2015; van de Ruit & Grey, 2016). In 8 × 9 cm of a target space (8 cm lateral, 7 cm anterior, and 2 cm posterior from grid center), five sets of 20 TMS pulses at an intensity of 120% of the RMT were randomly delivered with an inter-stimulus interval of 2 s.
Data analysis.
Normal distribution of data was tested by the Shapiro-Wilk’s test. When normality was not assumed, data were transformed to a logarithmic scale for later statistical analysis (Cirillo et al. 2016). Sphericity was tested using Mauchly’s test. When sphericity could not be assumed, the Greenhouse-Geisser correction statistics was used. Repeated-measures ANOVA were performed to determine the effect of GROUP (controls, SCI) and TASK (rest, FDI) on motor map area, CoG, and mean background EMG activity. Repeated-measures ANOVAs as a mixed model were also performed to determine the effect of GROUP and TASK (rest, FDI, FDI + BB) on motor map area, CoG, and mean background EMG activity. Repeated-measures ANOVA was also performed to determine the effects of TASK (rest, FDI, FDI + BB) and TIME (before, after) of tendon vibration on motor map area. Repeated-measures ANOVAs as a mixed model were also performed to determine the effect of GROUP and CONTROL TASK (rest, FDI, FDI + ADM) on motor map area, CoG, and mean background EMG activity. Motor map area and CoG at rest, RMT, AMT, MEP-max, M-max, and MVCs were compared between GROUPs by an independent-samples t test. Post hoc comparisons were conducted with multiple t tests with Bonferroni’s correction. Pearson’s correlation analysis was conducted as needed. Statistical significance was set at alpha < 0.05. Group data are presented as the mean ± standard deviation in the text.
Results
MVC
During MVC, EMG activity in the FDI [controls = 702.2 ± 191.3 μV, SCI = 354.6 ± 200.2 μV, t = 5.2, d.f. = 30, P < 0.001, Cohen’s d effect size (d) = 0.6] and ADM (controls = 976.2 ± 251.9 μV, SCI = 393.4 ± 438.6 μV, t = 2.4, d.f. = 10, P = 0.03, d = 1.4) was significantly smaller in SCI participants compared with control subjects. However, EMG activity in the BB muscle was similar across groups (controls = 724.8 ± 307.9 μV, SCI = 796.3 ± 416.2 μV, t = −0.54, d.f. = 19, P = 0.6).
Motor maps at rest
Figures 2A and B show motor maps in the FDI muscle at rest in a representative SCI and control participant. Note that the map was larger in the SCI compared with the control participant. Group comparisons revealed that motor map area was larger in SCI (22.3 ± 6.6 cm2) compared with control (12.6 ± 2.5 cm2, t = 6.8, d.f. = 30, P < 0.001, d = 2.2; Fig. 2C) participants. Larger areas were observed in the majority of SCI participants (11/15, 180.4 ± 49.6% of rest, range from 116.1 to 280.3% of rest). Mean background EMG was similar between groups (controls = 2.0 ± 0.5 μV, SCI = 2.1 ± 0.7 μV, t = −0.6, d.f. = 30, P = 0.6).
Figure 2. Motor maps at rest.
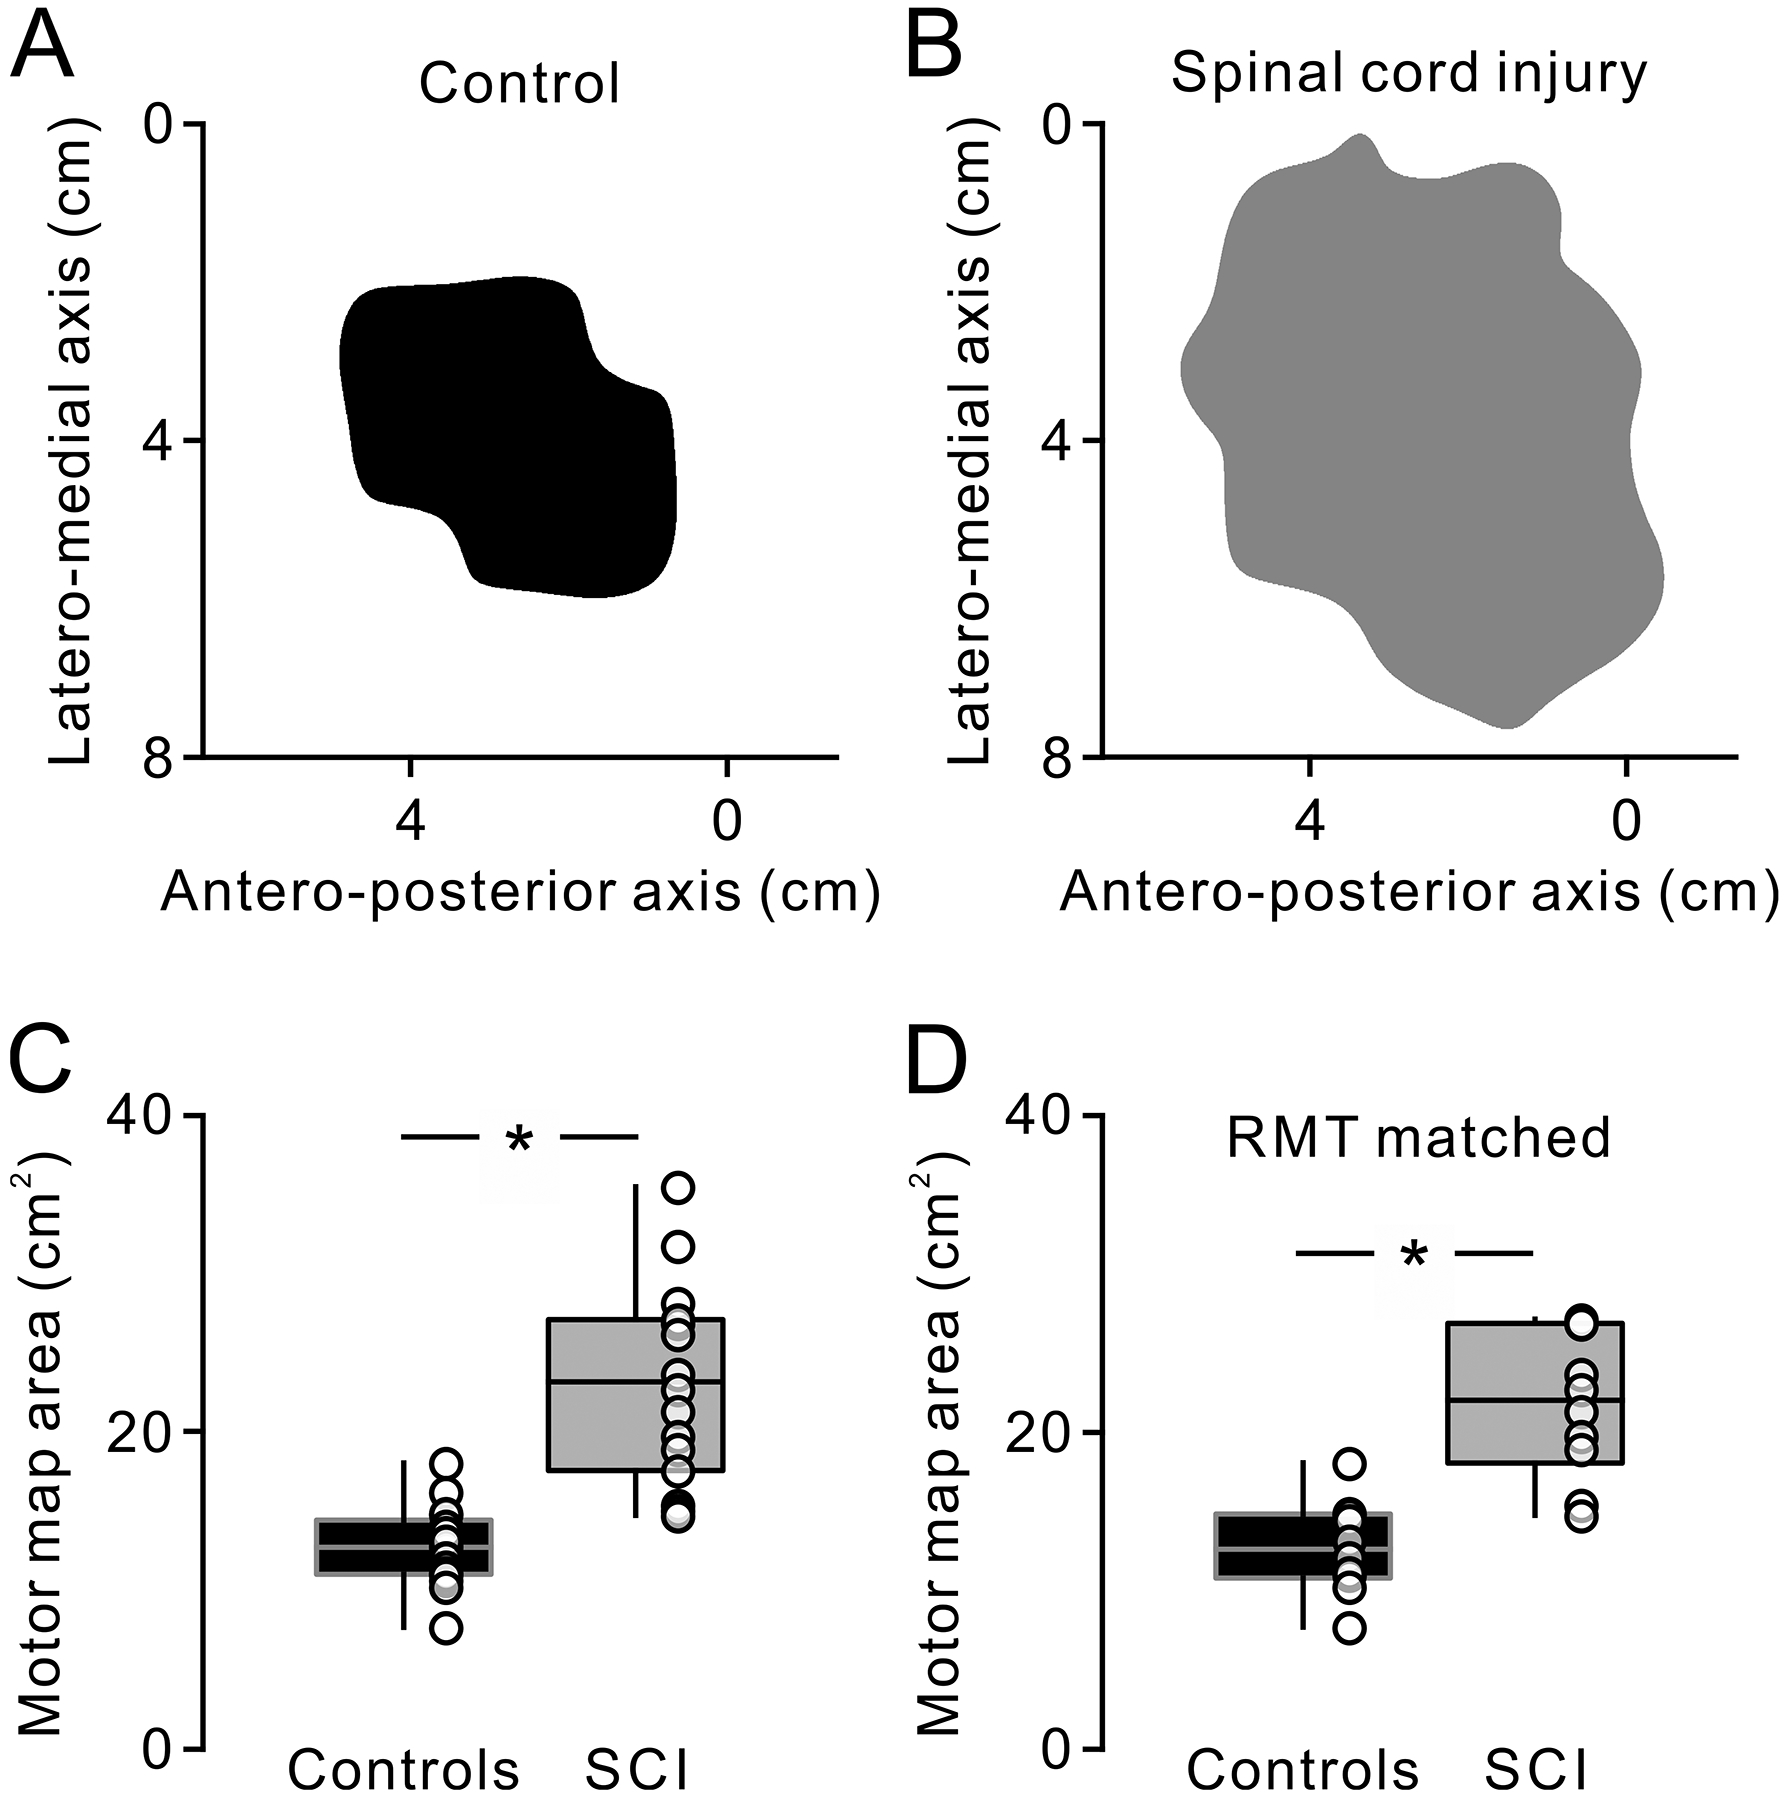
Top figures show motor maps in the relaxed FDI muscle in a representative control (A, black) and spinal cord injury (SCI) (B, gray) participant. Box plots show the group data from all participants (C; controls, n = 17; SCI, n = 15) and from participants who exhibited comparable resting motor threshold (RMT) across groups (D; controls, n = 10; SCI, n = 10). The abscissa shows groups tested (controls = black, SCI = gray). The ordinate shows motor maps area (cm2). Bottom, top, and middle lines in the box represent 1st and 3rd quartiles and median, respectively. The two vertical bars extend to the minimum to maximum values. * P < 0.05.
Because the stimulus intensity used to construct motor maps was higher in SCI (67.1 ± 12.3% of MSO) compared with controls (52.0 ± 12.3% of MSO, d.f. = 30, t = −3.5, P < 0.001, d = 1.2), in an additional control experiment (controls, n = 10; SCI, n = 10), we compared motor maps in participants with similar RMT (controls = 48 ± 11.1% of MSO, SCI = 49.4 ± 7.3% of MSO, t = −0.3, d.f. = 18, P = 0.8). Here, we also found that motor map area was larger in SCI (21.7 ± 4.6 cm2) compared with controls (12.7 ± 2.9 cm2, t = −5.2, d.f. = 18, P < 0.00, d = 2.3; Fig. 2D). The axes of the CoG were also similar across groups (x-axis, controls = −39.3 ± 5.0 mm, SCI = −37.5 ± 3.9 mm, t = −1.1, d.f. = 30, P = 0.3; y-axis, controls = −12.1 ± 5.9 mm, SCI = −9.7 ± 8.5 mm, t = −0.9, d.f. = 30, P = 0.2; z-axis, control = 57.7 ± 4.4 mm, SCI = 56.2 ± 4.4 mm, P = 0.2).
Motor maps during voluntary contraction
Figure 3 shows motor maps in the FDI muscle at rest and during isolated voluntary contraction in representative participants from each group. Note that motor map area was larger during voluntary contraction compared with rest in the control subject but decreased in the SCI participant. Importantly, we observed similar changes in the control participant when the area of the resting motor map was matched to the SCI participant.
Figure 3. Motor maps at rest and during voluntary activity.
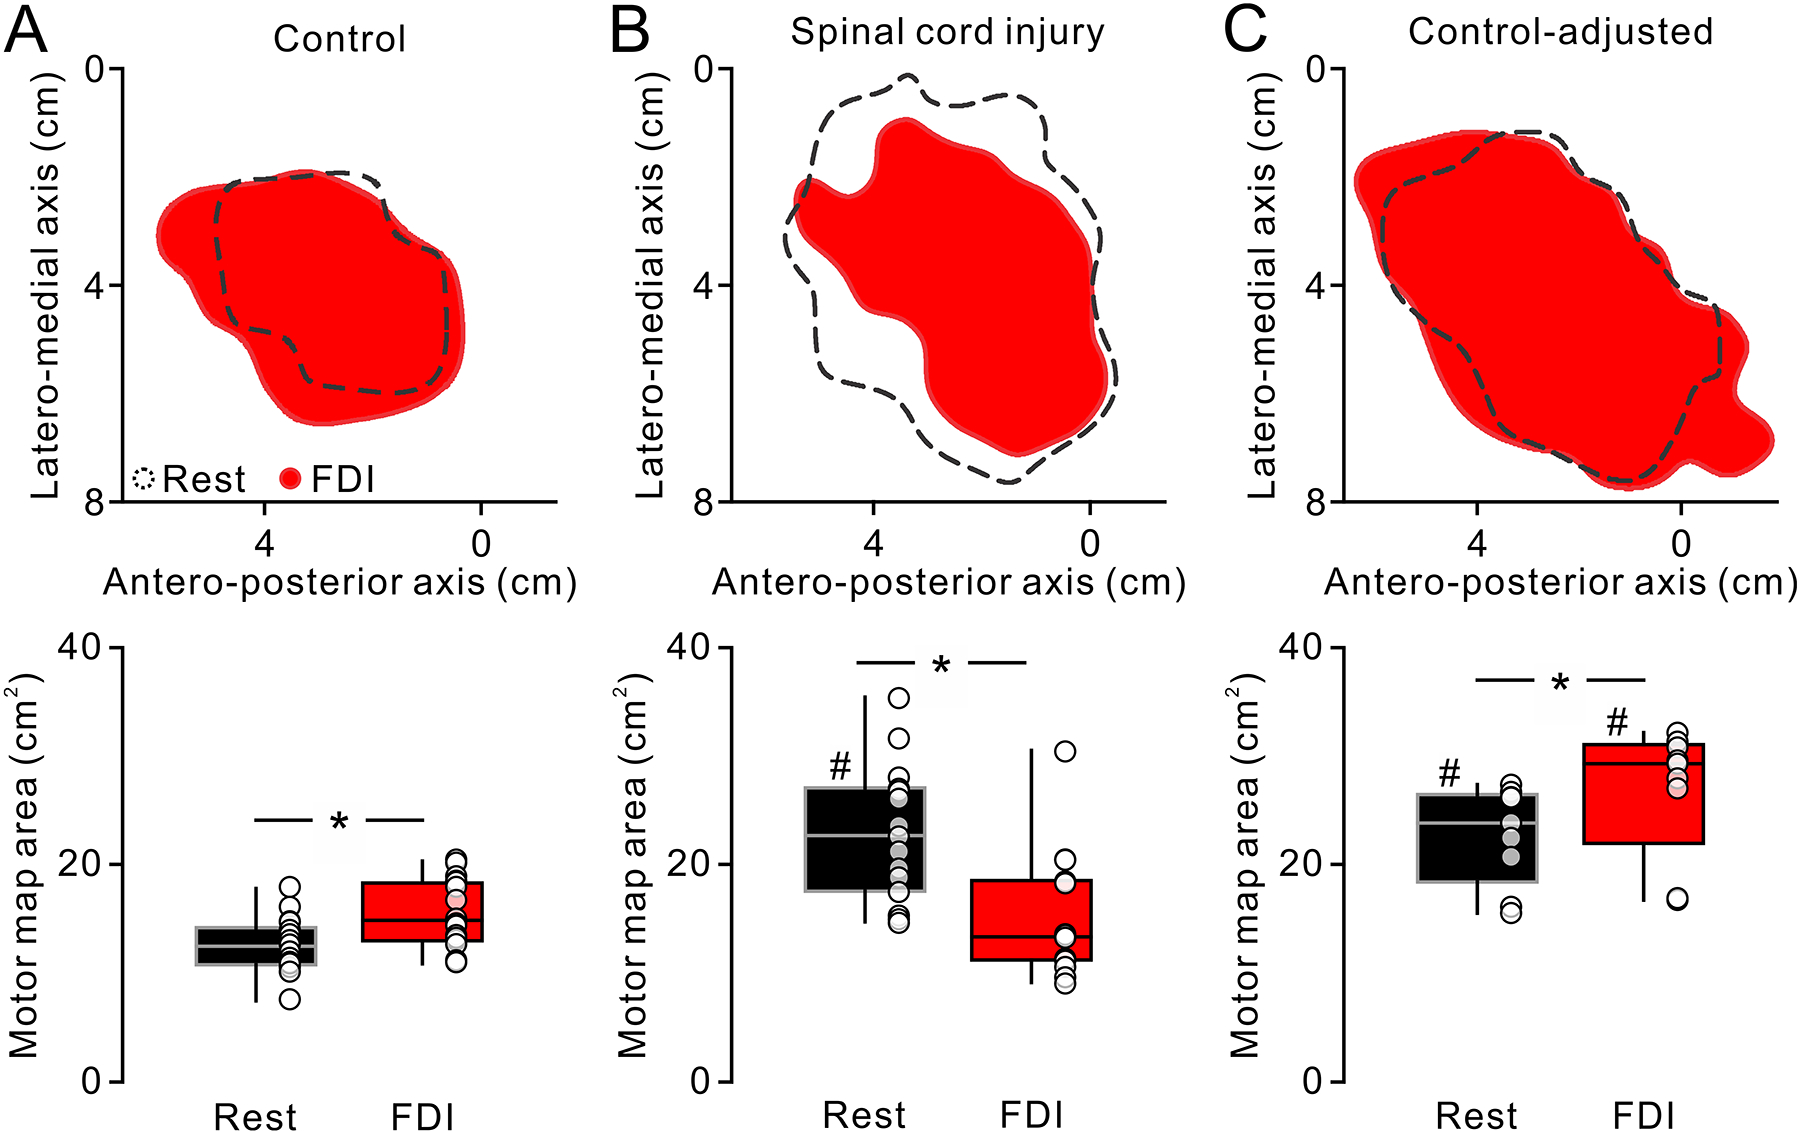
Motor maps in the FDI muscle in a representative participant of control (A) and SCI (B). Open areas outlined by black broken lines and red filled areas show motor maps obtained at rest and during isolated voluntary contraction of the FDI muscle (FDI), respectively. Note that motor maps area increased during voluntary activity compared with rest in the control whereas the motor maps decreased during voluntary activity in the SCI participant. Box plots below show group data in controls (B, n = 17) and SCI (D, n = 15). The abscissa represents the task tested (rest = black, FDI = blue). The ordinates represent the motor maps area (cm2). The boxes and whiskers were arranged in the same manner as in figure 2. Additional testing revealed that controls preserved the motor map expansion during voluntary contraction with higher TMS intensity, at which the motor map at rest exhibited similar area with SCI participants (C, controls-adjusted, n = 9). * P < 0.05. # P < 0.05 in comparison with controls.
Repeated-measures ANOVA showed an effect of GROUP (F1,30 = 10.42, d.f. = 1, P = 0.003), TASK (F1,30 = 4.91, d.f. = 1, P = 0.03) and in their interaction (F1,30 = 48.48, d.f. = 30, P < 0.001) on motor map area. We found that motor map area in the FDI increased during voluntary contraction compared with rest in 16/17 control subjects (15.8 ± 3.1 cm2, range from 11.0 to 20.5 cm2, P = 0.002, d = 1.1; Fig. 3A). In contrast, motor map area in the FDI decreased during voluntary contraction compared with rest in 14/15 SCI participants (15.2 ± 5.7 cm2, range from 9.1 to 30.5 cm2, P < 0.001, d = 1.3; Fig. 3B). During voluntary contraction the absolute area of motor maps (controls = 15.8 ± 3.1 cm2, SCI = 15.2 ± 5.7 cm2, P = 0.4) and the mean background normalized EMG (controls = 5.1 ± 0.3% of MVC, SCI = 5.26 ± 1.0% of MVC; P = 0.6) were similar between groups. Because the RMT in the FDI muscle was higher in SCI compared with control participants, in an additional control experiment, we examined motor maps in controls (n = 9) when the stimulus intensity was increased to match the intensity used in SCI participants (controls = 60.4 ± 9.8% of MSO, SCI = 67.1 ± 12.3% of MSO, t = −1.4, d.f. = 22, P = 0.1). Similar to our previous results, here we found that maps obtained during voluntary contraction in the FDI were larger compared with rest (rest = 22.8 ± 4.5 cm2, range from 15.6 to 26.7 cm2, FDI = 26.9 ± 5.9 cm2, range from 16.8 to 32.2 cm2, t = −4.2, d.f. = 8, P = 0.003, d = 0.8; Fig. 3C). Because the FDI was weaker in SCI compared with control participants, in an additional control experiment, we also matched FDI EMG levels during the acquisition of motor maps across groups (control = 28.3 ± 8.5 μV, SCI = 28.0 ± 5.3 μV, t = 0.1, d.f. = 15, P = 0.9) and similar results were found [effect of GROUP (F1,15 = 14.0, P = 0.002), TASK (F1,15 = 2.58, P = 0.1) and in their interaction (F1,15 = 17.4, P < 0.001)]. In controls maps increased 12.7 ± 2.9 cm2 (range from 7.6 to 18.0 cm2) to 16.1 ± 3.4 cm2 (range from 11.0 to 20.5 cm2, P = 0.04, d = 1.1). In SCI, maps decreased 24.9 ± 7.8 cm2 (range from 15.3 to 35.4 cm2) to 17.1 ± 3.8 cm2 (range from 11.4 to 20.5 cm2, P = 0.003, d = 1.3).
Figures 4A and B show motor maps at rest and during voluntary contraction of the FDI and during voluntary contraction of the FDI and BB muscles (FDI + BB) in representative participants from each group. Note that in the control subject, motor map area increased during FDI contraction and further increased during contraction of the FDI and BB compared with rest. In contrast, the motor map area gradually decreased in the SCI participant. Repeated-measures ANOVA showed an effect of TASK (F1.292,24.552 = 6.20, ε = 0.65, P = 0.005) and not GROUP (F1,19 = 3.47, P = 0.08), but in their interaction (F2,38 = 32.32, P < 0.001) on motor map area. We found that motor map area was larger during FDI (15.3 ± 2.9 cm2, range from 11.2 to 19.0 cm2, P = 0.03, d = 0.8) and FDI + BB (17.8 ± 3.3 cm2, range from 12.5 to 22.7 cm2, P = 0.01, d = 1.6) voluntary contractions compared with rest (12.9 ± 2.9 cm2; Fig. 3C). Note that motor maps area increased largely during contraction of FDI and BB compared with isolated contraction of the FDI (P = 0.01, d = 0.8).
Figure 4.
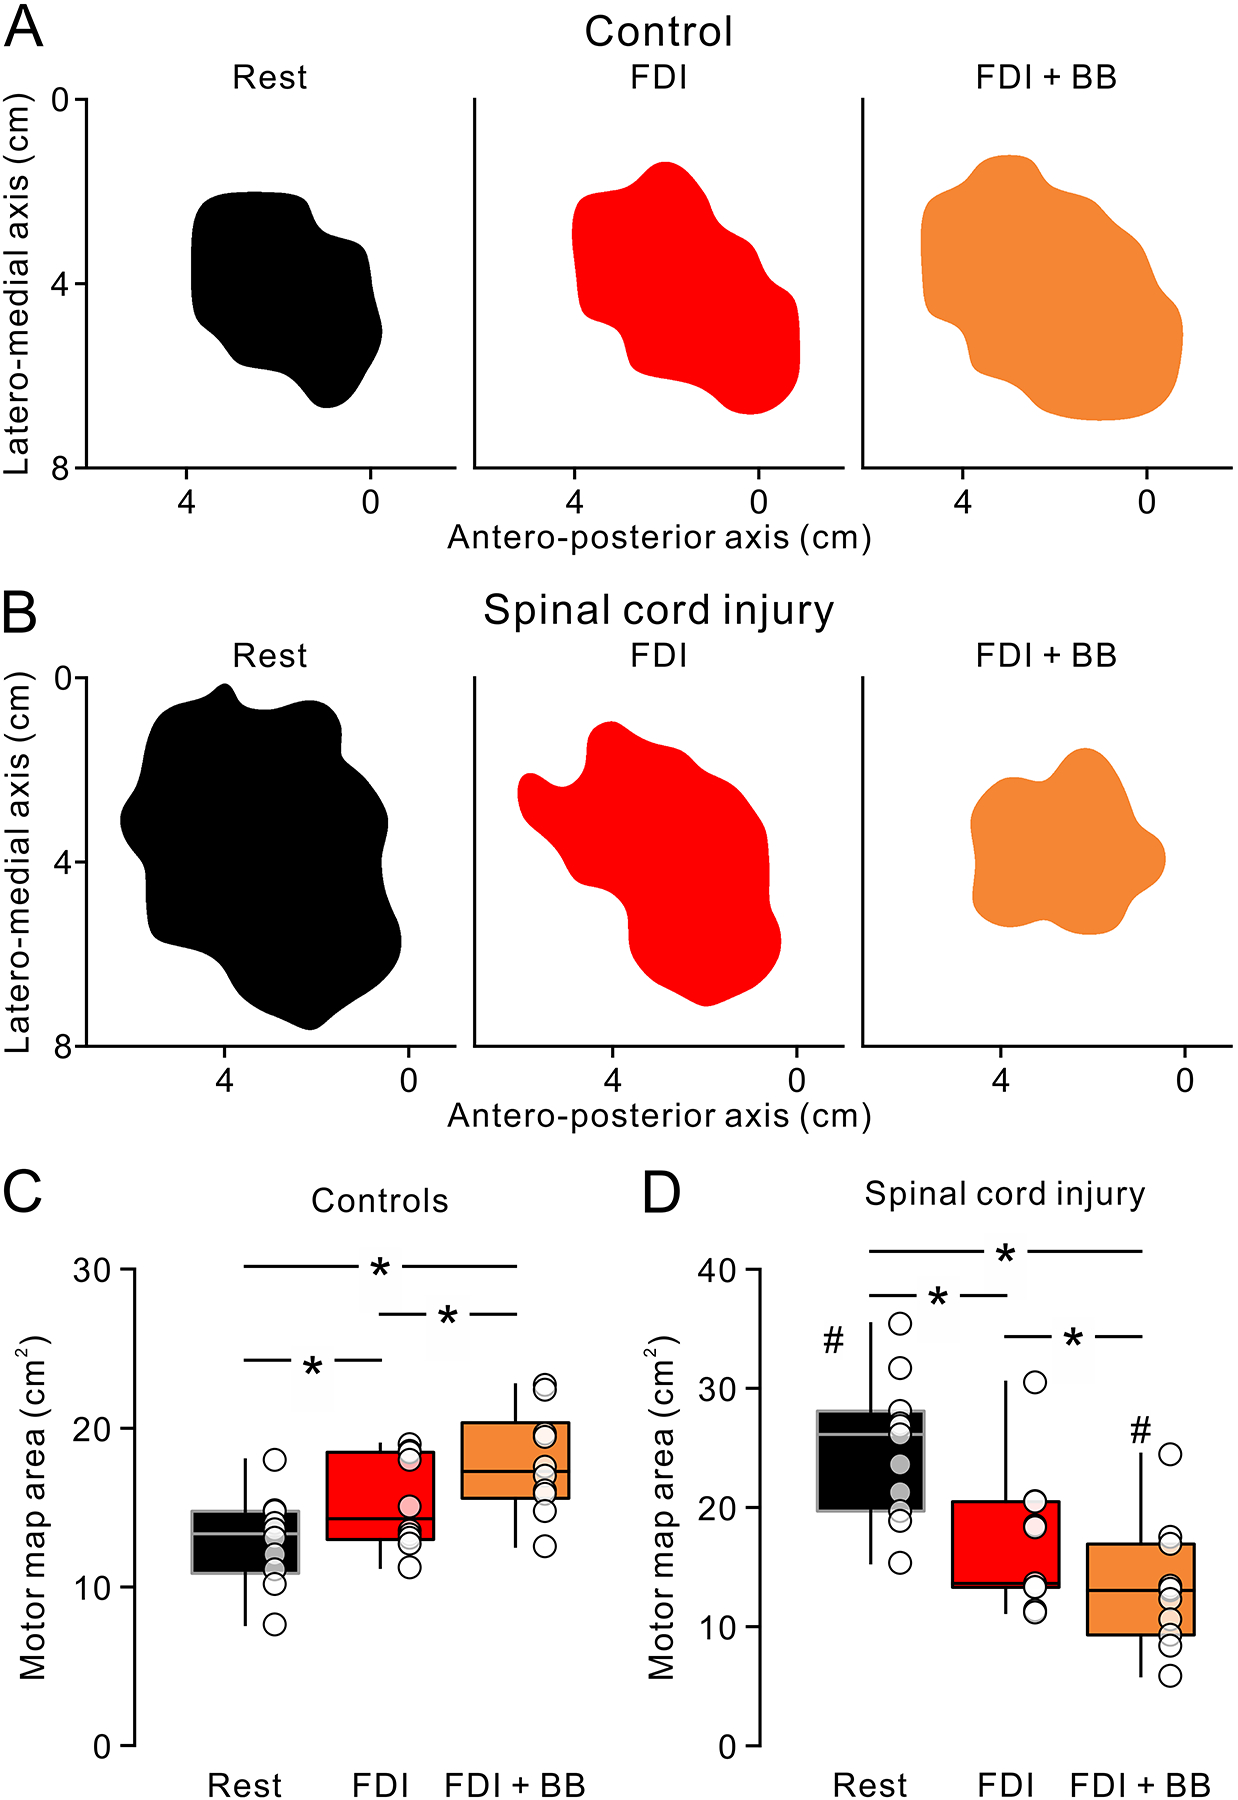
Motor maps at rest and during isolated voluntary contraction and contraction of proximal and distal muscles. Motor maps for the FDI muscle in a representative control (A) and SCI (B) participant. From left to right, the motor maps obtained at rest (Rest, black) during isolated FDI contraction (FDI, red) and contraction of FDI and BB muscles (FDI + BB, orange). Note that the motor map increased in area during FDI and further increased during FDI + BB compared to rest in the control. In contrast, motor maps area decreased during FDI and further decreased during FDI + BB in the SCI participant. Box plots represent group data in controls (B, n = 10) and SCI (D, n = 11). The abscissas show the tasks tested (Rest = black, FDI = red, FDI + BB = orange), respectively. The ordinates present the motor map area (cm2). The boxes and whiskers were arranged in same manner as in figure 2. * P < 0.05. # P < 0.05 in comparison with controls.
In SCI participants, motor map area decreased during FDI (16.8 ± 5.7 cm2, range from 11.2 to 30.5 cm2, P = 0.009, d = 1.4) and FDI + BB (13.2 ± 5.1 cm2, range from 5.9 to 24.5 cm2, P = 0.001, d = 2.1) voluntary contraction compared with rest (24.9 ± 5.9 cm2; Fig. 4D). Notably, motor map area decreased largely during contraction of FDI and BB compared with isolated contraction of the FDI (P = 0.01, d = 0.7). In comparisons across groups, we found that the area of motor maps during contraction of FDI and BB muscles was smaller in SCI compared with controls (P = 0.02, d = 1.1), but the motor map area at rest was larger in SCI compared with controls (P < 0.001, d = 2.6). Mean background EMG was similar across groups at rest (t = −1.2, d.f. = 19, P = 0.24) and during voluntary contractions (F1,19 = 0.4, d.f. = 1, P = 0.6). Motor map CoGs were also similar across groups (x-axis, F1,19 = 0.05, P = 0.8; y-axis, F1,19 = 0.06, P = 0.8; z-axis, F1,19 = 0.7, P = 0.4) and between rest, FDI and FDI + BB voluntary contractions (x-axis, F2,38 = 2.4, P = 0.1; y-axis, F2,38 = 0.6, P = 0.6; z-axis, F2,38 = 1.8, P = 0.2) along each axis.
We also compared motor maps at rest, during voluntary contraction of the FDI muscle and during voluntary contraction of the FDI and ADM (FDI + ADM) muscles. Repeated-measures ANOVA showed an interaction of CONTROL TASK × GROUP (F2,22 = 16.63, P < 0.001) but not an effect of CONTROL TASK (F1,11 = 4.41, P = 0.1) or GROUP (F2,22 = 0.38, P = 0.7) on motor maps area. We found in control subjects that motor maps area increased during FDI (15.5 ± 3.2 cm2, P = 0.02, d = 1.1) and FDI + ADM (15.6 ± 4.4 cm2, P = 0.03, d = 1.9) compared with rest (11.6 ± 2.5 cm2). No differences in maps area were observed across voluntary contractions (P = 0.9). However, in SCI participants, motor map area decreased during FDI (17.3 ± 6.7 cm2, P = 0.001, d = 1.1) and FDI + ADM (17.1 ± 5.5 cm2, P = 0.001, d = 1.7) compared with rest (24.7 ± 6.6 cm2) with no differences across voluntary contractions (P = 0.9). We also found that during voluntary contraction, motor map area was similar during FDI (P = 0.7) and FDI + ADM (P = 0.6) across groups although maps area at rest was larger in SCI compared with control participants (P < 0.001, d = 2.6). Mean background EMG was similar across groups at rest (t = −0.4, df = 11, P = 0.3) and during voluntary contraction (F1,11 = 1.8, P = 0.2). Motor map CoGs were similar across groups (x-axis, F1,11 = 2.0, P = 0.2; y-axis, F1,11 = 0.9, P = 0.8; z-axis, F1,11 = 0.2, P = 0.6) and between rest, FDI, and FDI + ADM (x-axis, F2,22 = 2.6, P = 0.1; y-axis, F2,22 = 1.3, P = 0.3; z-axis, F2,22 = 0.7, P = 0.5) along each axis.
Sensory function and muscle-tendon vibration
We examined the relationship between changes in motor map area during voluntary contraction and sensory function in SCI participants (n = 11). We found a negative correlation between EPT at C6 and changes in motor map area during FDI and FDI and BB voluntary contractions (r = −0.6, P = 0.002, Fig. 5A). However, the changes of motor map area during voluntary contraction were not significantly correlated with the EPT measured at dermatomes C7 (r = −0.05, P = 0.9, Fig. 5B) or C8 (r = −0.1, P = 0.8, Fig. 5C). Note that individuals with larger decreases in motor map area during voluntary contraction compared with rest were those needing higher intensity during EPT testing in the index finger dermatome.
Figure 5.
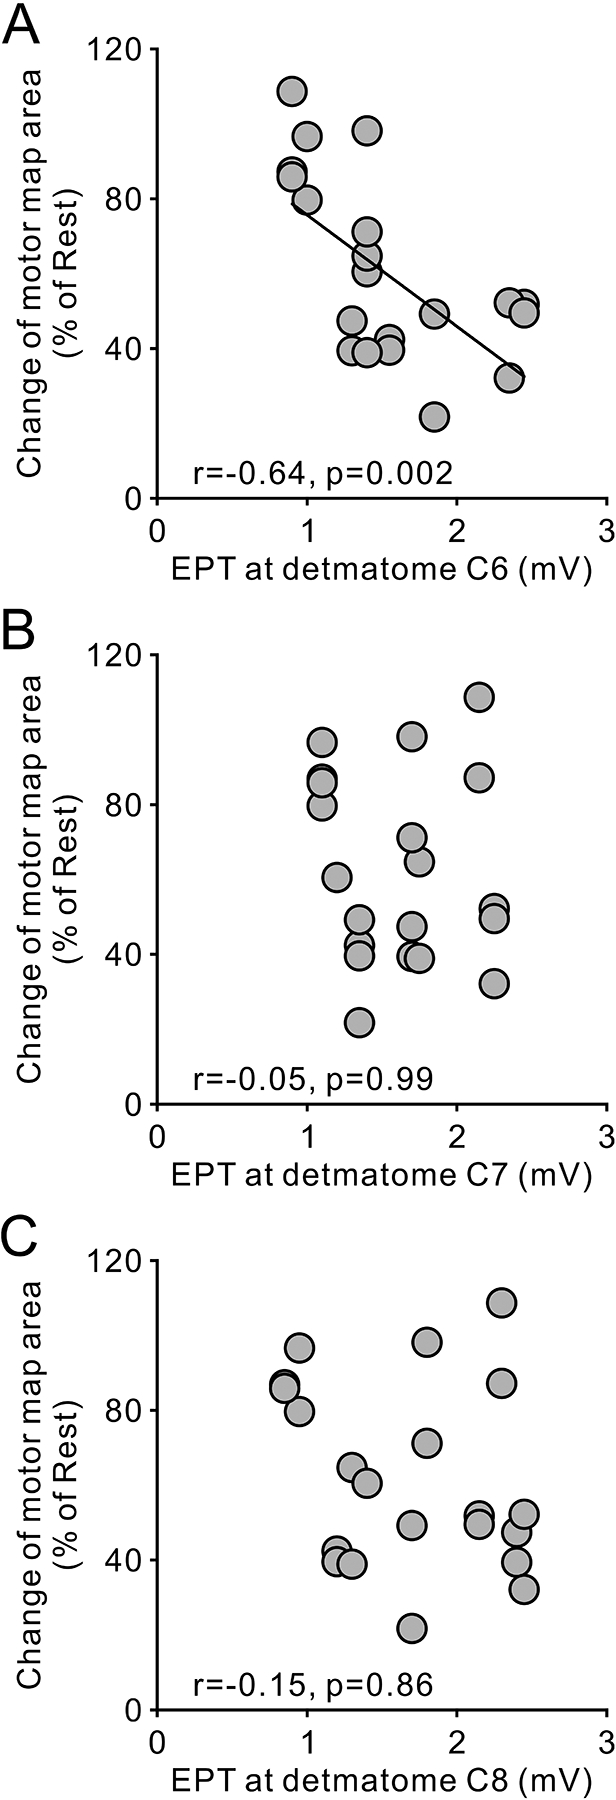
Correlation of changes of motor maps area and sensory impairment in individuals with SCI (n = 10). Ordinate shows the change of motor map area during isolated FDI contraction and contraction of FDI and BB muscle. Abscissa shows electrical perceptual threshold measured at dermatomes C6 (A), C7 (B), and C8 (C) in the tested upper limb. Note that negative correlations indicate that individuals showing a greater extent of reduction in motor map area were those in whom somesthetic sensation of the index finger was impaired more.
Figure 6A shows motor maps at rest, as well as during FDI and FDI + BB voluntary contractions before and after 10 min of FDI muscle-tendon vibration in a representative SCI participant. Note that before vibration, motor map area decreased during FDI voluntary contraction and further decreased during FDI + BB voluntary contraction compared with rest (Fig. 6B upper graph). After vibration, motor map areas during voluntary contraction increased compared with rest. Repeated-measures ANOVA revealed an effect of TASK (F1.11,6.67 = 6.1, ε = 0.5, P = 0.04), no TIME (F1,6 = 3.3, P = 0.1) but in their interaction (F2,12 = 31.4, P < 0.001) on motor map area. A post hoc test revealed that motor maps area decreased during voluntary contraction compared with rest (FDI, P = 0.03, d = 1.2; FDI + BB, P = 0.008, d = 1.8) before vibration (Fig. 6B upper graph). Consistent with our previous results, we found that maps were smaller during FDI + BB compared with FDI voluntary contraction (P = 0.02, d = 0.8). After vibration, motor maps obtained during voluntary contraction increased in area (FDI = 129.3 ± 31.6%, P = 0.03, d = 0.8; FDI + BB = 153.5 ± 36.0%, P = 0.004, d = 1.7, Fig 6B lower graph), although motor maps at rest did not show any changes (89.0 ± 18.1%, P = 0.13). Motor map areas were similarly increased during FDI and FDI + BB voluntary contractions after vibration (P = 0.08).
Figure 6.
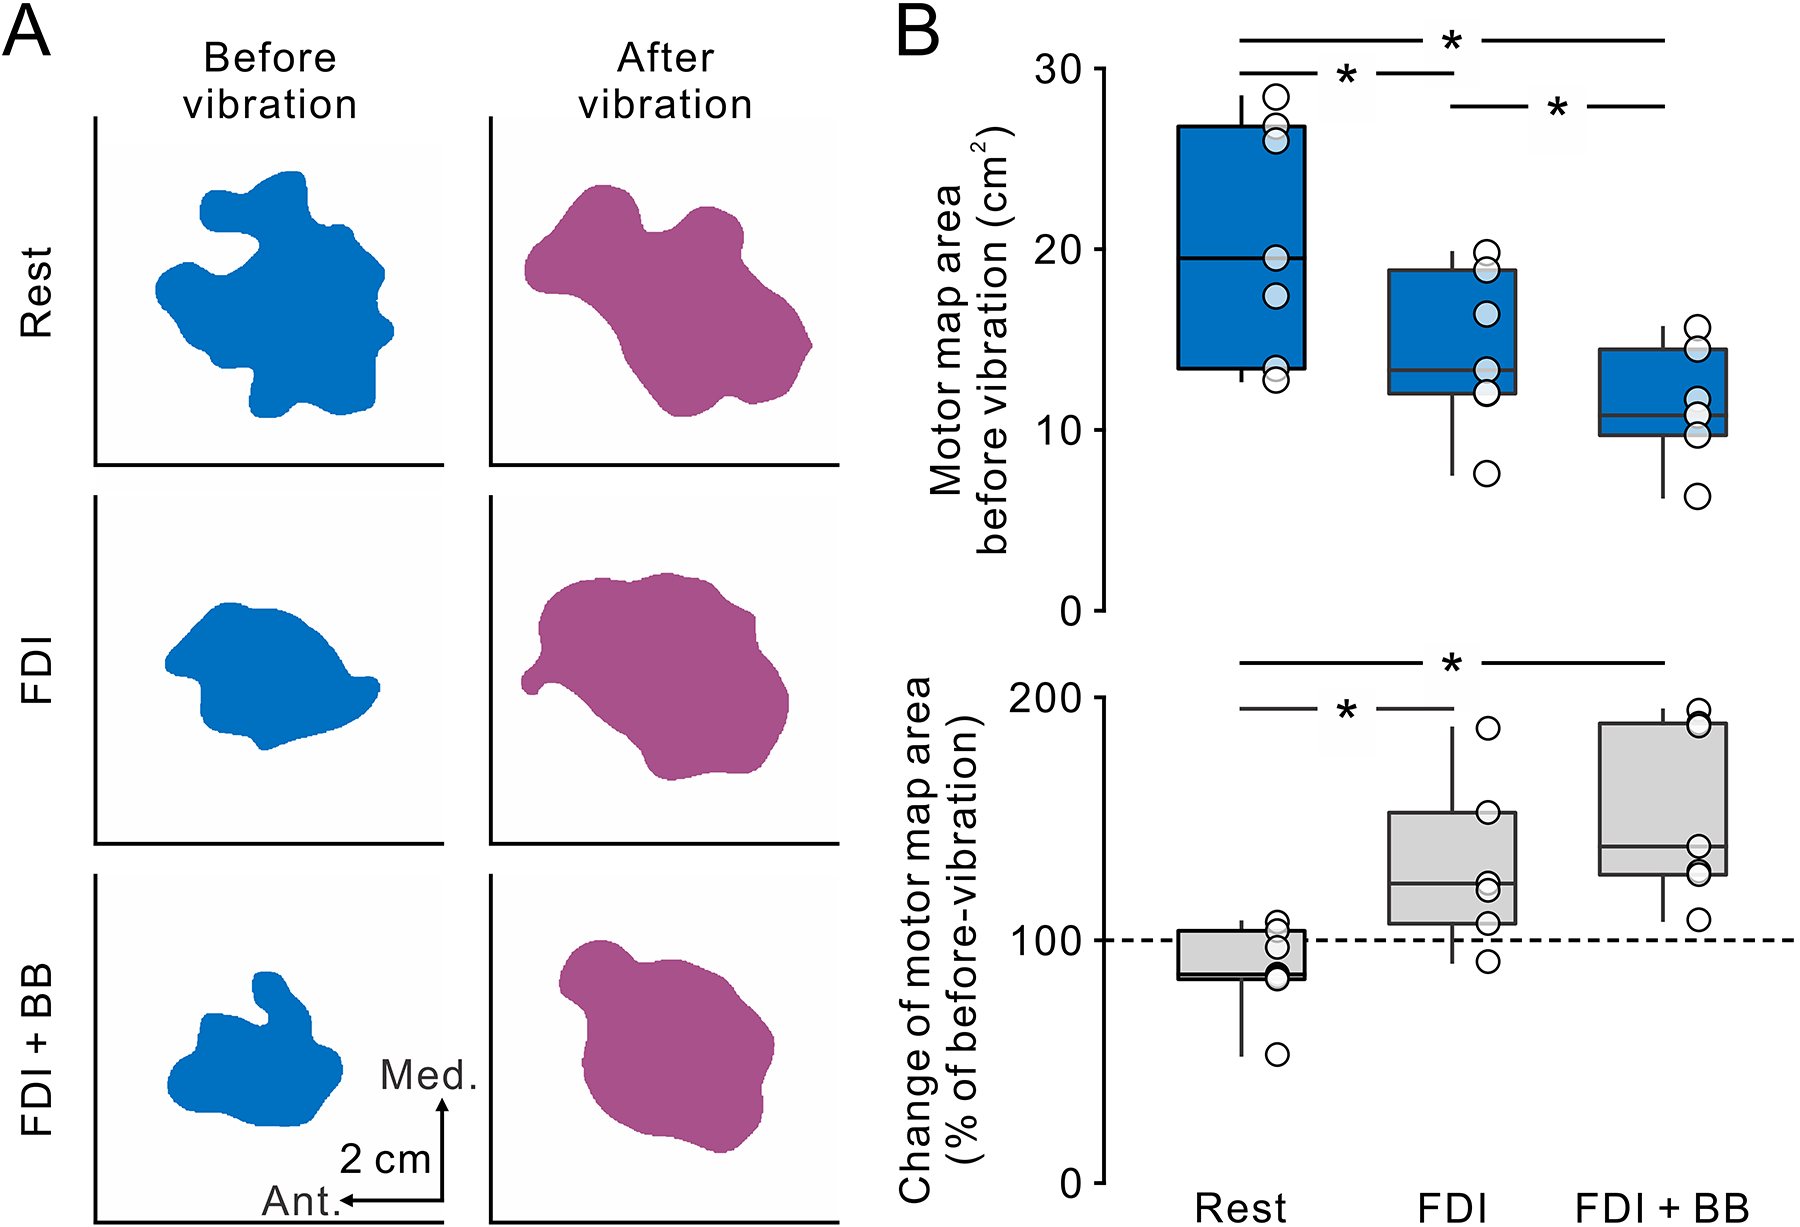
The effect of sustained tendon vibration on the motor cortical maps in the SCI participants. A. Motor cortical maps for the FDI muscle in a representative participant with SCI before (left, blue) and after (right, purple) the intervention of tendon vibration of the index finger. From top to bottom, the motor maps obtained at rest, during isolated FDI contraction (FDI) and contraction of FDI and BB muscles (FDI + BB). Note that before tendon vibration, the motor maps gradually decreased in area from FDI to FDI + BB compared to rest. After tendon vibration, the motor maps increased in area during FDI and FDI + BB whereas no change was observed at rest. B. Box plots show group data of the motor map area before vibration (top) and the changes of motor map area normalized by the motor maps before vibration (bottom). The abscissas represent the task tested (Rest, FDI + BB, FDI + ADM). The ordinates represent the motor map area (cm2) and the change of motor map area (% of before-vibration). The box and whiskers were arranged in the same manner as in figure 2. * P < 0.05.
Discussion
Our novel findings demonstrate abnormal changes in motor maps during voluntary contraction in humans with chronic incomplete cervical SCI. In control subjects, motor maps area in a hand muscle increased during voluntary contraction and further increased when a proximal arm muscle was contracting compared with rest. We found the opposite effect in people with SCI. In SCI participants, the area of motor maps in a hand muscle decreased with voluntary contraction and further decreased when a proximal arm muscle was contracting. No additional changes in map area occurred when adjacent distal hand muscles were contracting in both groups, suggesting that changes in motor cortical representations were related to voluntary contraction of proximal and distal arm muscles. People with SCI with larger decreases in map area during voluntary contraction were those with larger sensory deficits in the hand and, 10 min of hand muscle-tendon vibration increased motor map area. We hypothesized that sensory stimulation might represent a strategy to restore reorganization of motor cortical maps after chronic injuries to the spinal cord.
Reorganization of motor maps at rest and during voluntary contraction
At rest, we elicited MEPs in the FDI muscle from a larger number of cortical sites in SCI compared with control participants, which is consistent with results showing expansion of motor maps after SCI (Levy et al. 1990; Cohen et al. 1991; Topka et al. 1991; Streletz et al. 1995). This agrees with neuroimaging studies showing expansion in the primary motor cortex within the first months after SCI (Jurkiewicz et al. 2007). Studies integrating TMS mapping with fMRI have demonstrated good co-validation between these methods (Wassermann et al. 1996; Krings et al. 1997; Classen et al. 1998), suggesting that TMS mapping is sensitive enough to detect changes in cortical reorganization. For example, TMS mapping studies have demonstrated a somatotopical arrangement of cortical upper limb muscle representations (Brasil-Neto et al. 1992; Wilson et al. 1993) that agrees with the traditional homunculus extended over the lateral surface of the precentral gyrus (Penfield & Boldrey, 1937). We found that the mean CoG of the FDI muscle was located on the posterior lip of the precentral gyrus. This location corresponds to the location of the highest density of corticospinal neurons in the posterior bank of the precentral gyrus (Porter & Lemon, 1995). The fact that the location of the CoG was similar in both groups supports the view that expanded motor maps after SCI resulted from adaptive changes within residual motor cortical regions rather than infiltration of spared muscle representations to fulfill retracted areas. If enlarged motor maps resulted from invasion from other spinal segment representation, we might expect that the CoG location would have shifted towards the invaded area (Streletz et al. 1995; Bruehlmeier et al. 1998; Lotz et al. 1999, 2006; Freund et al. 2011a, b).
A critical question is how motor maps in SCI participants changed during voluntary contraction. Our findings in control subjects agree with previous studies reporting that motor map area increases during tonic voluntary contraction compared with rest (Ridding & Rothwell, 1995; Classen et al. 1998; van de Ruit & Grey, 2016). Notably, performance of the same motor task resulted in smaller motor maps in people with SCI. We favor the hypothesis that sensory input played a role in the suppression of motor cortical maps in SCI participants. This is consistent with our results showing that SCI participants with larger sensory deficits showed a larger decrease in motor map area during voluntary contraction. This also agrees with evidence in adult monkeys showing that, after chronic lesions of the dorsal columns, movements can be elicited from a significantly fewer number of sites in the primary motor cortex compared with uninjured monkeys (Kambi et al. 2011). In control subjects, deprivation of sensory input reduces motor map area at rest (Rossini et al. 1996) and during voluntary contraction (Rossi et al. 1998). We also found that 10 min of FDI muscle-tendon vibration increased the area of motor maps during voluntary contraction in SCI participants, as previously found in control subjects (Hamdy et al. 1998; Ridding et al. 2000, 2001; Kaelin-Lang et al. 2002; Charlton et al. 2003). It still remains unclear how sensory tendon-vibration modifies motor maps in humans. Sensory input is filtered (‘gated’) at different levels of the ascending sensory pathway during voluntary contraction (Ghez & Pisa, 1972; Chapman et al. 1988; Seki & Fetz, 2012; Lei & Perez, 2017). If afferents from somatosensory areas terminating in the primary motor cortex (Jones et al. 1978; Pons & Kaas, 1986; Ghosh et al. 1987; Darian-Smith et al. 1993) reorganize after spinal lesions (Jain et al. 1998; Tandon et al. 2009), the hand region of the motor cortex will receive abnormal inputs from the somatosensory cortex. A possibility is that this reorganization affected our results.
Another intriguing observation is that the area of motor maps acquired during voluntary contraction of a hand muscle further increased when a proximal arm muscle was contracting in controls but decreased in SCI participants. This is consistent with evidence showing that voluntary contraction of a proximal arm muscle has facilitatory effects on MEPs recorded in distal hand muscles in controls (Soteropoulos & Perez, 2011) but not in people with SCI (Bunday et al. 2012). Intrinsic connections exist between regions within the forelimb representation of the primary motor cortex (Gould et al. 1986; Huntley & Jones, 1991). fMRI (Grafton et al. 1993) and TMS (Devanne et al. 2002; Dominici et al. 2005; Ginanneschi et al. 2005) studies in humans showed that motor tasks that involve distal and proximal arm muscles engage overlapping motor cortical regions. Therefore, our changes in motor map area might be related to interactions between distal and proximal cortical representations. Indeed, in controls, voluntary contraction of distal and proximal arm muscles results in further expansion of motor maps compared with contraction of hand muscles alone (Tyč & Boyadjian, 2011). This is also supported by our results showing no additional changes in the area of a hand motor map when another hand muscle was contracting in both groups, consistent with previous findings (Aimonetti & Nielsen, 2002; Jono et al. 2015).
Functional implications
These results suggest that sensory input can help to re-establish motor map dimensions during voluntary contraction in people with SCI. This is consistent with previous studies suggesting that additional sensory input might contribute to improve hand and upper limb function after SCI (Backus et al. 2014; Hoffman & Field-Fote, 2013; Gad et al. 2018; Benavides et al. 2020). Although the role of motor maps remains debatable, there are clear demonstrations that changes in motor maps are associated with learning and functional recovery (Xerri, 2012). Several interpretations of our data are possible. One possibility is that the reduction in motor map area during voluntary contraction in participants with SCI reflects an active process that contributes to maximize the control of residual connections from the primary motor cortex after SCI. Improvements in performance after practice in specific cases have been associated with increases in cortical inhibition (Perez et al. 2007). If spinal networks contribute to these results, this might relate to the reduced responsiveness of motor neurons during voluntary contraction found in SCI compared with control subjects (Vastano & Perez, 2019). Another possibility is that changes in motor maps reflect a passive process caused by parts of the cortex being deprived of sensory input and/or descending signals reaching their targets. This deprivation may simply unmask latent connections that have been there to begin with, or lead to a gain change that can be detected by TMS. The observed expansion (controls) or reduction (SCI) of the motor maps during voluntary contraction could just reflect changes in excitability in neural elements responsible for inducing MEP (Ridding & Rothwell, 1995; Classen et al. 1998) without a change in the underlying map. It is important to keep in mind that our definition of a motor map threshold is largely different from the definition used in animal studies following SCI where threshold is usually defined by an evoked movement by cortical stimulation (Tandon et al. 2009, 2013) or by changes in cerebral blood flow during a motor behavior (Nishimura et al. 2007).
Limitations
Note that individuals with SCI have a higher MEP threshold compared with control subjects and previous studies showed that higher stimulus intensities result in larger maps (van de Ruit & Grey, 2016). However, it is unlikely that the larger map area at rest in SCI participants was related to higher motor thresholds because we found similar results when matching stimulus intensities across groups. Although previous fMRI studies showed larger activation patterns in the primary motor cortex in SCI compared with control participants during voluntary contraction (Bruehlmeier et al. 1998; Corbetta et al. 2002; Curt et al. 2002), it is difficult to compare these results with our findings. In these studies, repeated movements were performed without necessarily matching movement characteristics across populations. Note that simple variables such as movement difficulty (Winstein et al. 1997; Buetefisch et al. 2014), degree of muscle contraction (Dettmers et al. 1995) and movement speed (Shirinbayan et al. 2019) can change fMRI activity. Because in our study motor maps were tested during matched levels of voluntary contraction, it is less likely that changes in motoneuronal excitability (Burke & Pierrot-Deseilligny, 2010) affected our results. It is also less likely that decreases in map area in SCI participants related to the stimulus intensities, because similar results were observed at matched intensities across groups.
Summary
These electrophysiological results provide the first evidence of abnormal changes in motor maps in humans with chronic SCI during voluntary contraction and suggest that sensory input can help to reshape this reorganization.
Key points summary.
The functional role of motor cortical reorganization following spinal cord injury (SCI) remains largely unknown. Here, we tested motor maps in a hand muscle at rest and during voluntary contraction of the hand with and without voluntary contraction of a proximal arm muscle.
Motor map area in participants with SCI decreased during hand voluntary contraction and further decreased during additional contraction of a proximal arm muscle compared with rest. In contrast, motor map area in controls increased during the same motor tasks. Participants with SCI with more severe sensory deficits in the hand showed larger decreases in motor map area.
Ten minutes of hand muscle-tendon vibration increased the motor map area during voluntary contraction in SCI participants.
These novel findings indicate that abnormal changes in motor cortical maps during voluntary activity after SCI can be reshaped by sensory input; a knowledge that can have implications for rehabilitation.
Funding
This study was supported by Paralyzed Veterans of America (2955) and Japan Society for the Promotion of Science (18H03141) to TT, and the National Institute of Neurological Disorders and Stroke (R01NS076589, R01NS090622) and Department of Veterans Affairs (I01RX000815, I01RX001807) to MAP.
Biography

Toshiki Tazoe is chief researcher at Tokyo Metropolitan Institute of Medical Science, Japan. He received his PhD from Tokyo Gakugei University, Japan. He has been working with Dr. Monica A. Perez to understand the neural mechanisms of motor control in humans and motor recovery in individuals with spinal cord injury. His work focuses on the basic mechanisms of neuroplasticity to develop novel neurorehabilitation therapy.
Footnotes
Competing interests
The authors have no competing interests to declare.
Data Availability Statement
The data that support the findings of this study are available from the corresponding author upon reasonable request.
References
- Aimonetti JM, Nielsen JB (2002) Cortical excitability and motor task in man: an investigation of the wrist extensor motor area. Exp Brain Res 143: 431–439. [DOI] [PubMed] [Google Scholar]
- Backus D, Cordo P, Gillott A, Kandilakis C, Mori M, Raslan AM (2014) Assisted movement with proprioceptive stimulation reduces impairment and restores function in incomplete spinal cord injury. Arch Phys Med Rehabil 95: 1447–1453. [DOI] [PubMed] [Google Scholar]
- Barry MD, Bunday KL, Chen R, Perez MA (2013) Selective effects of baclofen on use-dependent modulation of GABAB inhibition after tetraplegia. J Neurosci 33: 12898–12907. [DOI] [PMC free article] [PubMed] [Google Scholar]
- Benavides FD, Jo HJ, Lundell H, Edgerton VR, Gerasimenko Y, Perez MA (2020) Cortical and subcortical effects of transcutaneous spinal cord stimulation in humans with tetraplegia. J Neurosci 40: 2633–2643. [DOI] [PMC free article] [PubMed] [Google Scholar]
- Brasil-Neto J, McShane LM, Fuhr P, Hallett M, Cohen LG (1992) Topographic mapping of the human motor cortex with magnetic stimulation: factors affecting accuracy and reproducibility. Electroencephalogr clin Neurophysiol 85: 9–16. [DOI] [PubMed] [Google Scholar]
- Bruehlmeier M, Dietz V, Leenders KL, Roelcke U, Missimer J, Curt A (1998) How does the human brain deal with a spinal cord injury? Eur J Neurosci 10: 3918–3922. [DOI] [PubMed] [Google Scholar]
- Buetefisch CM, Revill KP, Shuster L, Hines B, Parsons M (2014) Motor demand-dependent activation of ipsilateral motor cortex. J Neurophysiol 112: 999–1009. [DOI] [PMC free article] [PubMed] [Google Scholar]
- Bunday KL, Perez MA (2012) Impaired crossed facilitation of the corticospinal pathway after cervical spinal cord injury. J Neurophysiol 107: 2901–2911. [DOI] [PMC free article] [PubMed] [Google Scholar]
- Bunday KL, Tazoe T, Rothwell JC, Perez MA (2014) Subcortical control of precision grip after human spinal cord injury. J Neurosci 34: 7341–7350. [DOI] [PMC free article] [PubMed] [Google Scholar]
- Burke D, Pierrot-Deseilligny E (2010) Caveats when studying motor cortex excitability and the cortical control of movement using transcranial magnetic stimulation. Clin Neurophysiol 121: 121–123. [DOI] [PubMed] [Google Scholar]
- Buys EJ, Lemon RN, Mantel GW, Muir RB (1986) Selective facilitation of different hand muscles by single corticospinal neurones in the conscious monkey. J Physiol 381: 529–549. [DOI] [PMC free article] [PubMed] [Google Scholar]
- Charlton CS, Ridding MC, Thompson PD, Miles TS (2003) Prolonged peripheral nerve stimulation induces persistent changes in excitability of human motor cortex. J Neurol Sci 208: 79–85. [DOI] [PubMed] [Google Scholar]
- Chapman CE, Jiang W, Lamarre Y (1988) Modulation of lemniscal input during conditioned arm movements in the monkey. Exp Brain Res 72: 316–334. [DOI] [PubMed] [Google Scholar]
- Cirillo J, Calabro FJ Perez MA (2016) Impaired organization of paired-pulse TMS-induced I-waves after human spinal cord injury. Cereb Cortex 26: 2167–2177. [DOI] [PMC free article] [PubMed] [Google Scholar]
- Classen J, Knorr U, Werhahn KJ, Schlaug G (1998) Multimodal output mapping of human central motor representation on different spatial scales. J Physiol (Lond) 512: 163–179. [DOI] [PMC free article] [PubMed] [Google Scholar]
- Cohen LG, Roth BJ, Wassermann EM, Topka H, Fuhr P, Schultz J, Hallett M (1991) Magnetic stimulation of the human cerebral cortex, an indicator of reorganization in motor pathways in certain pathological conditions. J Clin Neurophysiol 8: 56–65. [DOI] [PubMed] [Google Scholar]
- Corbetta M, Burton H, Sinclair RJ (2002) Functional reorganization and stability of somatosensory-motor cortical topography in a tetraplegic subject with late recovery. Proc Natl Acad Sci USA 99: 17066–17071. [DOI] [PMC free article] [PubMed] [Google Scholar]
- Curt A, Bruehlmeier M, Leenders KL, Roelcke U, Dietz V (2002) Differential effect of spinal cord injury and functional impairment on human brain activation. J Neurotrauma 19: 43–51. [DOI] [PubMed] [Google Scholar]
- Darian-Smith C, Darian-Smith I, Burman K, Ratcliffe N (1993) Ipsilateral cortical projections to areas, 3a, 3b, and 4 in the macaque monkey. J Comp Neurol 335: 200–213. [DOI] [PubMed] [Google Scholar]
- Davey NJ, Smith HC, Savic G, Maskill DW, Ellaway PH, Frankel HL (1999) Comparison of input-output patterns in the corticospinal system of normal subjects and incomplete spinal cord injury patients. Exp Brain Res 127: 382–390. [DOI] [PubMed] [Google Scholar]
- Dettmers C, Fink GR, Lemon RN, Stephan KM, Passingham RE, Silbersweig D, Holmes A, Ridding MC, Brooks DJ, Frackowiak RS (1995) Relation between cerebral activity and force in the motor areas of the human brain. J Neurophysiol 74: 802–815. [DOI] [PubMed] [Google Scholar]
- Devanne H, Cohen LG, Kouchtir-Devanne N, Capaday C (2002) Integrated motor cortical control of task-related muscles during pointing in humans. J Neurophysiol 87: 3006–3017. [DOI] [PubMed] [Google Scholar]
- Dominici F, Popa T, Ginanneschi F, Mazzocchio R, Rossi A (2005) Cortico-motoneuronal output to intrinsic hand muscles is differentially influenced by static changes in shoulder positions. Exp Brain Res 164: 500–504. [DOI] [PubMed] [Google Scholar]
- Federico P, Perez MA. Distinct corticortical contributions to human precision and power grip. Cereb Cortex 27: 5070–5082. [DOI] [PMC free article] [PubMed] [Google Scholar]
- Freund P, Weiskopf N, Ward NS, Hutton C, Gall A, Ciccarelli O, Craggs M, Friston K, Thompson AJ (2011a) Disability, atrophy and cortical reorganization following spinal cord injury. Brain 134: 1610–1622. [DOI] [PMC free article] [PubMed] [Google Scholar]
- Freund P, Rothwell JC, Craggs M, Thompson AJ, Bestmann S (2011b) Corticomotor representation to a human forearm muscle changes following cervical spinal cord injury. Eur J Neurosci 34: 1839–1846. [DOI] [PubMed] [Google Scholar]
- Fouad K, Pedersen V, Schwab ME, Brösamle C (2001) Cervical sprouting of corticospinal fibers after thoracic spinal cord injury accompanies shifts in evoked motor responses. Curr Biol 11: 1766–1770. [DOI] [PubMed] [Google Scholar]
- Gad P, Lee S, Terrafranca N, Zhong H, Turner A, Gerasimenko Y, Edgerton VR (2018) Non-Invasive Activation of Cervical Spinal Networks after Severe Paralysis. J Neurotrauma 35: 2145–2158. [DOI] [PMC free article] [PubMed] [Google Scholar]
- Ghez C, Pisa M (1972) Somatosensory transmission during voluntary movement. II. Inhibitory mechanisms in the cuneate nucleus. Boll Soc Ital Biol Sper 48: 11–13. [PubMed] [Google Scholar]
- Ghosh S, Brinkman C, Porter R (1987) A quantitative study of the distribution of neurons projecting to the precentral motor cortex in the monkey (M. fascicularis). J Comp Neurol 259: 424–444. [DOI] [PubMed] [Google Scholar]
- Ginanneschi F, Del Santo F, Dominici F, Gelli F, Mazzocchio R, Rossi A (2005) Changes in corticomotor excitability of hand muscles in relation to static shoulder positions. Exp Brain Res 161: 374–382. [DOI] [PubMed] [Google Scholar]
- Gould HJ 3rd, Cusick CG, Pons TP, Kaas JH (1986) The relationship of corpus callosum connections to electrical stimulation maps of motor, supplementary motor, and the frontal eye fields in owl monkeys. J Comp Neurol 247: 297–325. [DOI] [PubMed] [Google Scholar]
- Grafton ST, Woods RP, Mazziotta JC (1993) Within-arm somatotopy in human motor areas determined by positron emission tomography imaging of cerebral blood flow. Exp Brain Res 95: 172–176. [DOI] [PubMed] [Google Scholar]
- Hamdy S, Rothwell JC, Aziz Q, Singh KD, Thompson DG (1998) Long-term reorganization of human motor cortex driven by short-term sensory stimulation. Nat Neurosci 1: 64–68. [DOI] [PubMed] [Google Scholar]
- Hoffman L, Field-Fote E (2013) Effects of practice combined with somatosensory or motor stimulation on hand function in persons with spinal cord injury. 19: 288–299. [DOI] [PMC free article] [PubMed] [Google Scholar]
- Huntley GW, Jones EG (1991) Relationship of intrinsic connections to forelimb movement representations in monkey motor cortex: a correlative anatomic and physiological study. J Neurosci 66: 390–413. [DOI] [PubMed] [Google Scholar]
- Jain N, Florence SL, Kaas JH (1998) Reorganization of somatosensory cortex after nerve and spinal cord injury. Physiology 13: 143–149. [DOI] [PubMed] [Google Scholar]
- Jo HJ, Perez MA (2019) Changes in motor-evoked potential latency during grasping after tetraplegia. J Neurophysiol 122: 1675–1684. [DOI] [PMC free article] [PubMed] [Google Scholar]
- Jones EG, Coulter JD, Hendry SH (1978) Intracortical connectivity of architectonic fields in the somatic sensory, motor and parietal cortex of monkeys. J Comp Neurol 181: 291–347. [DOI] [PubMed] [Google Scholar]
- Jono Y, Chujo Y, Nomura Y, Tani K, Nikaido Y, Hatanaka R, Hiraoka K (2015) The effect of tonic contraction of the finger muscle on the motor cortical representation of the contracting adjacent muscle. Somatosens Mot Res 32: 114–121. [DOI] [PubMed] [Google Scholar]
- Jurkiewicz MT, Mikulis DJ, McIlroy WE, Fehlings MG, Verrier MC (2007) Sensorimotor cortical plasticity during recovery following spinal cord injury: a longitudinal fMRI study. Neurorehabil Neural Repair 21: 527–538. [DOI] [PubMed] [Google Scholar]
- Kaelin-Lang A, Luft AR, Sawaki L, Burstein AH, Sohn YH, Cohen LG (2002) Modulation of human corticomotor excitability by somatosensory input. J Physiol (Lond) 540: 623–633. [DOI] [PMC free article] [PubMed] [Google Scholar]
- Kambi N, Tandon S, Mohammed H, Lazar L, Jain N (2011) Reorganization of the primary motor cortex of adult macaque monkeys after sensory loss resulting from partial spinal cord injuries. J Neurosci 31: 3696–3707. [DOI] [PMC free article] [PubMed] [Google Scholar]
- Kleim JA, Kleim ED, Cramer SC (2007) Systematic assessment of training-induced changes in corticospinal output to hand using frameless stereotaxic transcranial magnetic stimulation. Nat Protoc 2: 1675–1684. [DOI] [PubMed] [Google Scholar]
- Krings T, Buchbinder BR, Butler WE, Chiappa KH, Jiang HJ, Cosgrove GR, Rosen BR (1997) Functional magnetic resonance imaging and transcranial magnetic stimulation: complementary approaches in the evaluation of cortical motor function. Neurology 48: 1406–1416. [DOI] [PubMed] [Google Scholar]
- Lei Y, Perez MA (2017) Cortical contributions to sensory gating in the ipsilateral somatosensory cortex during voluntary activity. J Physiol (Lond) 595: 6203–6217. [DOI] [PMC free article] [PubMed] [Google Scholar]
- Levy WJ Jr., Amassian VE, Traad M, Cadwell J (1990) Focal magnetic coil stimulation reveals motor cortical system reorganized in humans after traumatic quadriplegia. Brain Res 510: 130–134. [DOI] [PubMed] [Google Scholar]
- Lotze M, Laubis-Herrmann U, Topka H, Erb M, Grodd W (1999) Reorganization in the primary motor cortex after spinal cord injury - A functional magnetic resonance (fMRI) study. Restor Neurol Neurosci 14: 183–187. [PubMed] [Google Scholar]
- Lotze M, Laubis-Herrmann U, Topka H (2006) Combination of TMS and fMRI reveals a specific pattern of reorganization in M1 in patients after complete spinal cord injury. Restor Neurol Neurosci 24: 97–107. [PubMed] [Google Scholar]
- Macklin RA, Brooke VJ, Calabro FJ, Ellaway PH, Perez MA (2016) Discrepancies between clinical assessments of sensory function and electrical perceptual thresholds after incomplete chronic cervical spinal cord injury. Spinal Cord 54: 16–23. [DOI] [PMC free article] [PubMed] [Google Scholar]
- Marconi B, Filippi GM, Koch G, Pecchioli C, Salerno S, Don R, Camerota F, Saraceni VM, Caltagirone C (2008) Long-term effects on motor cortical excitability induced by repeated muscle vibration during contraction in healthy subjects. J Neurol Sci 275: 51–59. [DOI] [PubMed] [Google Scholar]
- Marconi B, Filippi G, Koch G, Giacobbe V, Pecchioli C, Versace V, Camerota F, Saraceni VM, Caltagirone C (2011) Long-term effects of cortical excitability and motor recovery induced by repeated muscle vibration in chronic stroke patients. Neurorehabil Neural Repair 25: 48–60. [DOI] [PubMed] [Google Scholar]
- Martinez M, Delcour M, Russier M, Zennou-Azogui Y, Xerri C, Coq J-O, Brezun G-M (2010) Differential tactile and motor recovery and cortical map alteration after C4-C5 spinal hemisection. Exp Neurol 221: 186–197. [DOI] [PubMed] [Google Scholar]
- Ngomo S, Leonard G, Moffet H, Mercier C (2012) Comparison of transcranial magnetic stimulation measures obtained at rest and under active conditions and their reliability. J Neurosci Methods 205: 65–71. [DOI] [PubMed] [Google Scholar]
- Nishimura Y, Onoe H, Morichika Y, Perfiliev S, Tsukada H, Isa T (2007) Time-dependent central compensation mechanisms of finger dexterity after spinal cord injury. Science 318: 1150–1155. [DOI] [PubMed] [Google Scholar]
- Ozdemir RA, Perez MA (2017) Afferent input and sensory function after human spinal cord injury. J Neurophysiology 119: 134–144. [DOI] [PMC free article] [PubMed] [Google Scholar]
- Penfield W, Boldrey E (1937) Somatic motor and sensory representation in the cerebral cortex of man as studied by electrical stimulation. Brain 60: 389–443. [Google Scholar]
- Perez MA, Wise SP, Willingham DT, Cohen LG (2007) Neurophysiological mechanisms involved in transfer of procedural knowledge. 27: 1045–1053. [DOI] [PMC free article] [PubMed] [Google Scholar]
- Petersen NT, Pyndt HS, Nielsen JB (2003) Investigating human motor control by transcranial magnetic stimulation. Exp Brain Res 152: 1–6. [DOI] [PubMed] [Google Scholar]
- Pons TP, Kaas JH (1986) Corticocortical connections of area 2 of somatosensory cortex in macaque monkeys: a correlative anatomical and electrophysiological study. J Comp Neurol 248: 313–335. [DOI] [PubMed] [Google Scholar]
- Porter R, Lemon R (1995) Corticospinal function and voluntary movement. Clarendon Press. [Google Scholar]
- Ridding MC, Rothwell JC (1995) Reorganization in human motor cortex. Can J Physiol Pharmacol 73: 218–222. [DOI] [PubMed] [Google Scholar]
- Ridding MC, Brouwer B, Miles TS, Pitcher JB, Thompson PD (2000) Changes in muscle responses to stimulation to the motor cortex induced by peripheral nerve stimulation in human subjects. Exp Brain Res 131: 135–143. [DOI] [PubMed] [Google Scholar]
- Ridding MC, McKay DR, Thompson PD, Miles TS (2001) Changes in corticomotor representations induced by prolonged peripheral nerve stimulation in humans. Clin Neurophysiol 112: 1461–1469. [DOI] [PubMed] [Google Scholar]
- Roll JP, Vedel JP, Ribot E (1989) Alteration of proprioceptive messages induced by tendon vibration in man: a microneurographic study. Exp Brain Res 76: 213–222. [DOI] [PubMed] [Google Scholar]
- Rossi S, Pasqualetti P, Tecchio F, Sabato A, Rossini PM (1998) Modulation of corticospinal output to human hand muscles following deprivation of sensory feedback. NeuroImage 8: 163–175. [DOI] [PubMed] [Google Scholar]
- Rossini PM, Rossi S, Tecchio F, Pasqualetti P, Finazzi-Agrò A, Sabato A (1996) Focal brain stimulation in healthy humans: motor maps changes following partial hand sensory deprivation. Neurosci Lett 214: 191–195. [DOI] [PubMed] [Google Scholar]
- Rothwell JC, Hallett M, Berardelli A, Eisen A, Rossini P, Paulus W (1999) Magnetic stimulation: motor evoked potentials. The International Federation of Clinical Neurophysiology. Electroencephalogr Clin Neurophysiol Suppl 52: 97–103. [PubMed] [Google Scholar]
- Seki K, Fetz EE (2012) Gating of sensory input at spinal and cortical levels during preparation and execution of voluntary movement. J Neurosci 32: 890–902. [DOI] [PMC free article] [PubMed] [Google Scholar]
- Shirinbayan SI, Dreyer AM, Rieger JW (2019) Cortical and subcortical areas involved in the regulation of reach movement speed in the human brain: An fMRI study. Hum Brain Mapp 40: 151–162. [DOI] [PMC free article] [PubMed] [Google Scholar]
- Soteropoulos DS, Perez MA (2011) Physiological changes underlying bilateral isometric arm voluntary contractions in healthy humans. J Neurophysiol 105: 1594–1602. [DOI] [PMC free article] [PubMed] [Google Scholar]
- Soteropoulos DS, Perez MA (2013) Reciprocal interactions between distal and proximal upper-limb segments in humans. Soc for Neurosci abst. [Google Scholar]
- Streletz LJ, Belevich JKS, Jones SM, Bhushan A, Shah SH, Herbison GJ (1995) Transcranial magnetic stimulation: cortical motor maps in acute spinal cord injury. Brain Topogr 7: 245–250. [DOI] [PubMed] [Google Scholar]
- Tandon S, Kambi N, Lazar L, Mohammed H, Jain N (2009) Large-scale expansion of the face representation in somatosensory areas of the lateral sulcus after spinal cord injuries in monkeys. J Neurosci 29: 12009–12019. [DOI] [PMC free article] [PubMed] [Google Scholar]
- Tandon S, Kambi N, Mohammed H, Jain N (2013) Complete reorganization of the motor cortex of adult rats following long-term spinal cord injuries. Eur J Neurosci 38: 2271–2279. [DOI] [PubMed] [Google Scholar]
- Topka H, Cohen LG, Cole RA, Hallett M (1991) Reorganization of corticospinal pathways following spinal cord injury. Neurology 41: 1276–1283. [DOI] [PubMed] [Google Scholar]
- Tyč F, Boyadjian A (2011) Plasticity of motor cortex induced by coordination and training. Clin Neurophysiol 122: 153–162. [DOI] [PubMed] [Google Scholar]
- Uy J, Ridding MC, Miles TS (2002) Stability of maps of human motor cortex made with transcranial magnetic stimulation. Brain Topogr 14: 293–297. [DOI] [PubMed] [Google Scholar]
- van de Ruit M, Grey MJ (2016) The TMS map scales with increased stimulation intensity and muscle activation. Brain Topogr 29: 56–66. [DOI] [PMC free article] [PubMed] [Google Scholar]
- van de Ruit M, Perenboom MJL, Grey MJ (2015) TMS brain mapping in less than two minutes. Brain Stimul 8: 231–239. [DOI] [PubMed] [Google Scholar]
- Vastano R, Perez MA (2019) Changes in motoneuron excitability during voluntary muscle activity in humans with spinal cord injury. J Neurophysiol 123: 454–461. [DOI] [PMC free article] [PubMed] [Google Scholar]
- Wassermann EM, McShane LM, Hallett M, Cohen LG (1992) Noninvasive mapping of muscle representations in human motor cortex. Electroencephalogr clin Neurophysiol 85: 1–8. [DOI] [PubMed] [Google Scholar]
- Wassermann EM, Wang B, Zeffiro TA, Sadato N, Pascual-Leone A, Toro C, Hallett M (1996) Locating the motor cortex on the MRI with transcranial magnetic stimulation and PET. NeuroImage 3: 1–9. [DOI] [PubMed] [Google Scholar]
- Wilson SA, Thickbroom GW, Mastaglia FL (1995) Comparison of the magnetically mapped corticomotor representation of a muscle at rest and during low-level voluntary contraction. Electroencephalogr clin Neurophysiol 97: 246–250. [DOI] [PubMed] [Google Scholar]
- Wilson SA, Thickbroom GW, Mastaglia FL (1993) Transcranial magnetic stimulation mapping of the motor cortex in normal subjects. J Neurol Sci 118: 134–144. [DOI] [PubMed] [Google Scholar]
- Winstein C, Grafton ST, Pohl PS (1997) Motor task difficulty and brain activity: investigation of goal-directed reciprocal aiming using positron emission tomography. J Neurophysiol 77: 1581–1594. [DOI] [PubMed] [Google Scholar]
- Xerri C (2012) Plasticity of cortical maps: multiple triggers for adaptive reorganization following brain damage and spinal cord injury. Neuroscientist 18: 133–148. [DOI] [PubMed] [Google Scholar]
- Ziemann U, Ilić TV, Alle H, Meintzschel F (2004) Estimated magnitude and interactions of cortico-motoneuronal and Ia afferent input to spinal motoneurones of the human hand. Neurosci Lett 364: 48–52. [DOI] [PubMed] [Google Scholar]
Associated Data
This section collects any data citations, data availability statements, or supplementary materials included in this article.
Data Availability Statement
The data that support the findings of this study are available from the corresponding author upon reasonable request.