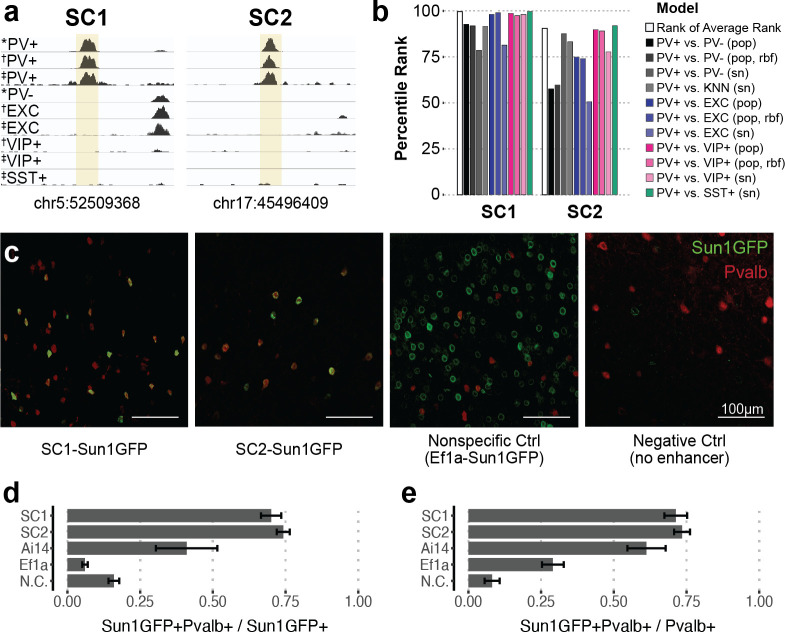
Figure 2. Two sequence candidates selectively activate adeno-associated virus (AAV) expression in parvalbumin-expressing (PV+) neurons.
(a) Genome browser visualization of PV+-specific ATAC-seq signal at sequence candidates SC1 and SC2. * cSNAIL data, † INTACT data from Mo et al., 2015, ‡ snATAC-seq from Li et al., 2021. (b) Percentile rank of support vector machine (SVM) scores among 1755 true PV+-specific enhancer sequence candidates that scored positively across all models. Linear population-derived models are denoted with ‘pop,’ nonlinear population-derived models are denoted with ‘pop, rbf,’ and linear single-nucleus-derived models are denoted with ‘sn.’ (c) Example images of AAV Sun1GFP expression against parvalbumin (Pvalb) antibody staining. (d, e) Quantification of AAV Sun1GFP or Pvalb-2A-Cre/Ai14 reporter overlap with Pvalb+ cells. Bar heights represent the mean among images, and the error of the mean is shown. N cells = 1322 (SC1), 2570 (SC2), 1340 (Ai14), 2013 (Ef1a), and 504 (N.C.). N.C., negative control.

