

Abstract
Rice is the staple food for more than 3.5 billion people worldwide. The sensitivity of rice to heat, drought, and salinity is well documented. However, rice response to combinations of these stresses is not well understood. A contrasting set of rice genotypes for heat (N22, Gharib), drought (Moroberekan, Pusa 1121) and salinity (Pokkali, IR64) were selected to characterize their response under drought, and combination of drought with heat and salinity at the sensitive seedling stage. Sensitive genotypes (IR64, Pusa 1121, Gharib) recorded higher reactive oxygen species accumulation (20–40%), membrane damage (8–65%) and reduction in photosynthetic efficiency (10–23%) across the stress and stress combinations as compared to stress tolerant checks. On the contrary, N22 and Pokkali performed best under drought + heat, and drought + salinity combination, respectively. Moreover, gene expression pattern revealed the highest expression of catalase (CAT), ascorbate peroxidase (APX) and GATA28a in N22 under heat + drought, whereas the highest expression of CAT, APX, superoxide dismutase (SOD), DEHYDRIN, GATA28a and GATA28b in Pokkali under drought + salinity. Interestingly, the phenotypic variation and expression level of genes highlighted the role of different set of physiological traits and genes under drought and drought combination with heat and salinity stress. This study reveals that rice response to stress combinations was unique with rapid readjustment at physiological and molecular levels. Moreover, phenotypic changes under stress combinations showed substantial adaptive plasticity in rice, which warrant further investigations at molecular level.
Supplementary Information
The online version contains supplementary material available at 10.1007/s12298-022-01162-y.
Keywords: Drought, Salinity, Stress combinations, Heat, Rice, ROS scavenging, Tolerance
Introduction
Drought stress is a leading constrain to global food productivity, accounting for nearly 10% reduction in global crop production, and one of the most damaging abiotic stresses affecting the growth and yield of crop plants (Kadam et al. 2014; Lesk et al. 2016; Leng and Hall 2019). Climate change in the past few decades has further intensified the occurrence of drought. Moreover, drought accompanied by other stresses such as heat and salinity has been documented as frequently co-occurring abiotic stresses in the natural field conditions (Rizhsky et al. 2004; Prasad et al. 2008; Mittler & Blumward 2010; Pradhan et al. 2012; Trenberth et al. 2014; Paul et al. 2019). Nevertheless, crops growing in natural field conditions usually face more than one stress at a time and collective effect of two or more stresses is not simply additive but defined as a new stress type (Mittler 2006). It has been documented that crop losses under stress combination are more severe and catastrophic to crop growth and productivity than the individual stress (Kadam et al. 2014). Crop improvement programs in the past have been majorly focused on the integration of traits contributing to tolerance against single abiotic stress (Choudhary et al. 2018). However, with the advancement in our understanding of molecular mechanism(s) of stress responses, it is now evident that a comprehensive approach is required to investigate multiple abiotic stress tolerance in crop plants (Mittler 2006; Bahuguna et al., 2018a). Moreover, successful adaptation of the crops to different stress combination is warranted to sustain food production in the changing climate.
Drought stress majorly disrupts the photo-assimilate production (photosynthesis in source) and poor source-sink communication leading to reduced sink strength, which ultimately impact crop yield under water deficit conditions (Rodrigues et al. 2019). Conversely, heat stress dynamically impacts plants at the physiological and molecular level, altering membrane composition, protein confirmation, DNA-histone interaction, function of enzymes, hormones and pheno-phase transition, eventually affecting growth and reproductive development (Mittler at al. 2012; Bahuguna and Jagadish 2015). On the contrary, salinity reduce plant’s ability to take water from soil and results in an increased accumulation of both Na+ and Cl- ions, which impairs metabolic processes substantially resulting in reduced crop yield (Wungrampha et al. 2018). Thus, absence of salinity defense mechanisms such as osmotic adjustment and cellular detoxification by exclusion and compartmentalization of Na+ ions could lead to catastrophic impact on plant growth and yield (Deinlein et al. 2014). Interestingly, drought, heat and salinity give rise to several changes in the molecular makeup of the cell for its adaptation. The overall expression pattern of stress-related genes, metabolite accumulation (both primary and secondary), ion uptake and sequestrations processes, and metabolic pathways (respiration and photosynthesis) are reprogrammed under stress (Zhao et al. 2014; Xie et al. 2020; Billah et al. 2021). As a primary response, plants produce an excess amount of reactive oxygen species (ROS) under abiotic stresses such as drought, salinity, heat, ultraviolet light, air pollutants, toxic metals, and herbicides (Bray 2000; Das et al. 2015; Negrão et al. 2017; Billah et al. 2021). While low levels of ROS act as molecular messenger involved in plant’s adaptation, excess production of ROS has been documented to cause membrane damage, oxidation of proteins and other molecules present in the cells that ultimately lead to the programmed cell death (Stadtman and Levine 2000; Fruhwirth and Hermetter 2008). Plants have developed a defined mechanism to efficiently scavenge ROS at the cellular level through non-enzymatic products such as glutathione (GSH), ascorbate and involvement of antioxidant enzymes such as superoxide dismutase (SOD), catalase (CAT), and peroxidases (POX). These mechanisms collectively protect the plants from oxidative damage caused by excessive ROS production under stress conditions (Mittler 2006; Gallego et al. 2012; Iannone et al. 2012; Das and Roy Choudhary 2014; Hasanuzzaman et al. 2020).
Rice (Oryza sativa L.) is the world’s most important staple food crop. Drought, salinity, and heat stress are well-documented to limit global rice productivity and production (Venuprasad et al. 2008; Todaka et al. 2012; Kadam et al. 2014; Liu et al. 2021). The sub-aquatic nature of rice makes it more prone to drought conditions as compared to other cereal crops, such as wheat and maize (Ji et al. 2012). Although efforts have been undertaken to improve the rice cultivars for the tolerance against several abiotic stresses such as drought (Cui et al. 2018), heat (Shah et al. 2011), and salinity (Kumari et al. 2009a, b), limited studies have dealt with rice response to a combination of these stresses (Kadam et al. 2014; Bahuguna et al. 2018a). Moreover, physiological traits such as transpirational water losses (water use efficiency), root length, root angle, which are documented to be effective under drought (Kadam et al. 2014, 2015, 2017) or/and salinity (Kitomi et al. 2020) in isolation, may not be effective to similar extent under combination stresses for example drought + heat (D + H) and drought + salinity (D + S), which show negative interaction (Suzuki et al. 2014; Bahuguna et al. 2018a). Thus, crop breeding programs need to be oriented towards developing cultivars for multiple abiotic stresses, which would require identification and characterization of promising donors and molecular mechanisms that can help rice plants thrive under different combinations of co-occurring abiotic stress. Hence, the present study was focused to explore (i) phenotypic response of a contrasting set of rice cultivars to a combination of drought with heat and salinity stress and (ii) the differential characteristics of the stress tolerance mechanism(s) in rice cultivars at the seedling stage under drought and combination of drought with heat and salinity.
Material and Method
Plant material, growth condition, and stress treatment
Seeds of a contrasting set of rice genotypes were procured from the International Rice Research Institute, Manila (Supplementary Table S1) comprising Pusa 1121 (drought sensitive), Gharib (heat sensitive), IR64 (salinity sensitive), Moroberekan (drought tolerant), N22 (heat tolerant) and Pokkali (salinity tolerant), respectively (Kumari et al. 2009a; Jagadish et al. 2007; 2010; Bahuguna et al. 2015, 2018b; Sampangi-Ramaiah et al. 2020; Das et al. 2021).
Seeds of all genotypes were sterilized with 0.05% Bavistin and sown in soil taken in pots (5 cm diameter x 10 cm height). The soil (~ 50 gm) in each pot was saturated with tap water and weighed. All the seedlings (3 seedlings per pot) were grown under optimal conditions (29 °C/26°C Day/night temperature, 70% relative humidity (RH) with 25,000 lx light at 12 h/12 h day/night cycle) in growth chamber. Stress treatment was given to the 14-d old rice seedlings to compare the changes in their physiological parameters with the control ones. Seedlings were either subjected to drought stress alone or in combination with heat or salinity stress. Four sets of pots were prepared for stress imposition, each set containing 12 pots. For control, 12 pots were kept under optimum growth conditions and regularly irrigated to maintain 100% field capacity (FC) for each genotype. For drought stress treatment, 14 days old seedlings were withheld from irrigation, and continuous weighing (twice a day) was done using digital balance (Sartarius 35A224S-CW Göttingen, Germany) until the moisture level reached at 30–40% FC (Bahuguna et al. 2018b). For D + H stress treatment, 12 pots containing 14 days old seedlings were kept in a growth chamber maintained at 35 °C/26°C Day/night temperature with 70% relative humidity and 25,000 lx light intensity at 12 h/12 h day/night cycle. Pots were withheld from irrigation, and continuous weighing (twice a day) was done until 30–40% FC was achieved before sampling. For salinity + drought stress, pots were enriched with 60 ml of 200 mM NaCl (HiMedia Maharashtra, India) solution in a pot containing 50 g soil {equivalent to 14 mg NaCl per gram of soil, thus, maintaining soil salinity close to 20 ds/m; Rani and Sharma (2015)} after which pots were withheld from irrigation, and continuous weighing was done until 30–40% FC was achieved before sampling. All the experiments were done with 12 pots (3 seedlings in each pot) of each genotype for every stress treatment.
Measurement of physiological and biochemical parameters
Seedlings were uprooted to observe the impact of stress on the root growth, shoot growth, and fresh weight. Shoot length (SL) and root length (RL) were measured for stressed plants along with their control samples. For dry weight (DW) measurements, seedlings were kept in an oven at 65ºC up to 24 h before weighing. For each treatment, the standard deviation was also calculated.
Measurement of chlorophyll fluorescence (Fv/Fm)
The chlorophyll fluorescence was measured on leaves by Fluorometer PAM-2000 (Heinz-Walz, Effeltrich, Germany) as per the manufacturer’s instructions and protocol given (Wungrampha et al. 2019) after dark adapting the plants for 30 min. Maximum quantum yield (as inferred from Fv/Fm ratio) was measured from these plants by exposing them to saturated actinic light of 5000 µmol photons m− 2 s− 1 for one second.
Measurement of lipid peroxidation
TBARS (Thiobarbituric Acid Reactive Substances) assay were performed to determine the extent of lipid peroxidation by analyzing the amount of malondialdehyde (MDA) as described by (Mishra et al. 2020). About 100 mg shoot tissue was homogenized in 0.15(w/v) trichloroacetic acid (TCA) (Sigma-Aldrich, USA) and was centrifuged for 10 min at 15,000×g at 4 °C. The supernatant was mixed with 0.5% thiobarbituric acid (TBA) (Sigma-Aldrich, USA) diluted in 20% TCA and incubated in a hot water bath for 25 min. After terminating the reaction, the samples were centrifuged for 5 min at 15,000×g, and the absorbance of the supernatant at 532 and 600 nm was recorded (extinction coefficient of MDA at 532 nm was taken as 155 mM− 1 cm− 1). Measurements were corrected for unspecific turbidity by subtracting the absorbance at 600 nm. All reactions were carried out in triplicate, and values were shown as µmoles of MDA per gram of fresh weight.
H2O2 measurement
Hydrogen peroxide was measured spectrophotometrically after reaction with potassium iodide (KI) (Merck Millipore, USA) as described (Velikova et al. 2000). The reaction mixture consisted 0.5 ml 0.1% trichloroacetic acid (TCA) (Sigma-Aldrich, USA) leaf extract (100 mg shoot tissue) supernatant, 0.5ml of 100mM K-phosphate buffer (pH -7.6) and 2ml reagent (1 M KI w/v in fresh double-distilled water). The blank probe consisted of 0.1% of TCA in the absence of leaf extract. The reaction was developed for 1 h in darkness and absorbance measured at 390 nm. The amount of hydrogen peroxide was calculated using a standard curve prepared with known concentration of H2O2 (Merck Millipore, USA). All reactions were carried out in triplicate, and values were reported as µmoles of H2O2 per gram of fresh weight.
K+/Na+ estimation
For the estimation of Na+ and K+, 100 mg of fresh shoot tissue was digested by boiling it with 10 ml of 0.1% HNO3 (Merck Millipore, USA) for 30 min in a water bath. After cooling, the solution was filtered with Whatman 40 (Kumari et al. 2015), and the extract thus obtained was used for measuring ions using Atomic Absorption Spectrometer (iCE 3000 Series, USA). The experiment was done by using three biological samples, and the standard error was calculated (n = 3).
Isolation of total RNA and cDNA synthesis
Total RNA was isolated from shoot tissues using TRIzol reagent (Life Technologies, USA) as per manufacturer instructions. The quality and integrity of total RNA was analyzed as described earlier by (Gupta et al. 2017). The first-strand cDNA was synthesized using Revert Aid™ cDNA synthesis kit (Thermo Fisher Scientific Inc, USA) following the manufacturer’s protocol.
Quantitative real-time PCR
The primers for qRT-PCR were designed using Primer3 software from the 3’-UTR regions of each gene (Supplementary table S2). Each primer pair was further validated for its uniqueness to amplify the selective amplicon of a particular gene using Primer-BLAST (http://www.ncbi.nlm.nih.gov/tools/primer-blast/). Rice eukaryotic elongation factor 1α (OseEF-1α) was taken as the reference gene for the analysis. ABI Prism 7500 Sequence Detection System and software (PE Applied Biosystems) was used for performing the qRT-PCR. Three technical replicates were taken for each cDNA sample.
Statistical analysis
The experiments were designed as completely randomized design (CRD) with genotype and treatments as main factors. Two factorial analysis of variance (ANOVA) was employed to determine genotype (G), treatment (T), and their interaction (GxT), and the significance was calculated with Fisher’s least significant difference (LSD) test at P < 0.05 using GenStat release 12.1 (Rothamsted Experimental Station). The mean values of percentage change and qRT-PCR data of Morobrekan, N22 and Pokkali, were compared to IR64, Pusa 1121 and Gharib to determine the statistical difference between them (Supplementary table S3-5). Relative change in a trait was calculated as difference between a treatment and its respective control with respect to the control (Relative change = Treatment-control/control). Conversely, stress tolerance index was calculated as mean fresh weight of seedlings under a stress divided by mean fresh weight of seedling under control condition.
Results
Physiological and biochemical response to drought stress alone
Relative growth of seedlings of four rice genotypes was measured in terms of shoot length (SL), root length (RL), fresh weight (FW), and dry weight (DW) under control, drought, D + H, and D + S stress (Fig. 1). Seedlings of all three sensitive genotypes (IR64, Pusa 1121, Gharib) showed tip kinking, loss of turgidity and turned brown under drought stress. All the physiological and biochemical traits showed significant variation across the genotypes (Supplementary table S3, S4). IR64, Pusa 1121 and Gharib recorded significant (P < 0.001) reduction in FW (~ 14%) and DW (~ 9%) while all three checks showed no significant change in FW (Fig. 2a). Under drought stress, N22 and Moroberekan recorded least reduction in DW (3.4% and 4%, respectively) while IR64, Pusa 1121, Gharib and Pokkali showed around 9% reduction, respectively, as compared to their respective controls (Fig. 2b). A significant effect of drought stress was documented on RL, where IR64, Gharib and Pusa 1121 recorded 10%, 14% and 16% reduction, respectively as compared to the control. While Pokkali showed only 8% reduction in RL, Moroberekan did now show any significant change in RL. Interestingly, an increase in RL was seen in N22 (8%) under drought stress as compared to the control plants (Fig. 2c). Conversely, decrease in SL was significant (P < 0.001) across the genotypes, where IR64 recorded maximum reduction (11%) in SL followed by Pusa 1121 (9%) and Gharib (6%), respectively (Fig. 2d).
Fig. 1.

Effect of drought, (D + H) and (D + S) on the seedling growth of rice genotypes IR64, Pusa 1121, Gharib, Moroberekan, N22 and Pokkali. Fourteen-day-old seedlings were exposed to drought by withholding watering and maintained at 30%–40% soil moisture content, while for the (D + H) stress treatment seedlings were kept inside the growth chamber preset at 35°C/26°C day/night temperature and exposed to drought by withholding watering and maintained at 30%–40% soil moisture content. For (D + S) treatment pots were enriched with 60 ml of 200 mM NaCl solution followed by imposition of drought (30–40% FC).
Fig. 2.

Effect on growth traits viz. fresh weight (FW; a), dry weight (DW; b), root length (RL; c), and shoot length (SL; d) of rice genotypes N22, Moroberekan, Pokkali, Gharib, Pusa 1121 and IR64 under drought (D), drought + heat (D + H) and drought + salinity (D + S) at seedling stage. Each vertical column represents mean data of trait for a genotype calculated from three biological replicates. Bars indicate ± SE (standard error of mean). Comparison of means within a genotype was done with Fisher’s least significant difference (LSD) test, where symbol ‘*’ indicates significant difference (P < 0.05) between respective treatment and control.
All the physiological and biochemical traits showed significant variation across the genotypes (Supplementary table S4). Chlorophyll fluorescence (Fv/Fm ratio) reduced significantly under drought stress across the genotypes and Pusa 1121 recorded a maximum reduction (12%) followed by IR64 and Gharib (11%) as compared to their respective controls. On the contrary, N22, Pokkali and Moroberekan did not show significant reduction in Fv/Fm ratio under drought stress (Fig. 3a). A significant (P < 0.05) increase in MDA (Fig. 3b) and H2O2 content (Fig. 3c) was recorded across the genotypes with IR64, Gharib and Pusa 1121 recording the highest levels of MDA (~ 92 µmol g− 1 FW) and H2O2 (~ 25 µmol g− 1 FW). Moreover, IR64 recorded the highest K+/Na+ ratio under drought stress (Fig. 3d). Stress tolerance showed a strong negative correlation with MDA (R2 = 0.94), H2O2 (R2 = 0.94) and K+/Na+ ratio (R2 = 0.42) under drought stress (Fig. 4a, d, g).
Fig. 3.

Effect on physiological and biochemical traits viz. chlorophyll florescence (Fv/Fm ratio, a) malondialdehyde (MDA, b), hydrogen peroxide (H2O2; c), K+/Na+ ratio (d) of rice genotypes N22, Moroberekan, Pokkali, Gharib, Pusa 1121 and IR64 under drought (D), drought + heat (D + H) and drought + salinity (D + S) at seedling stage. Each vertical column represents mean data of trait for a genotype calculated from three biological replicates. Bars indicate ± SE (standard error of mean). Comparison of means within a genotype was done with Fisher’s least significant difference (LSD) test, where symbol ‘*’ indicates significant difference (P < 0.05) between respective treatment and control.
Fig. 4.
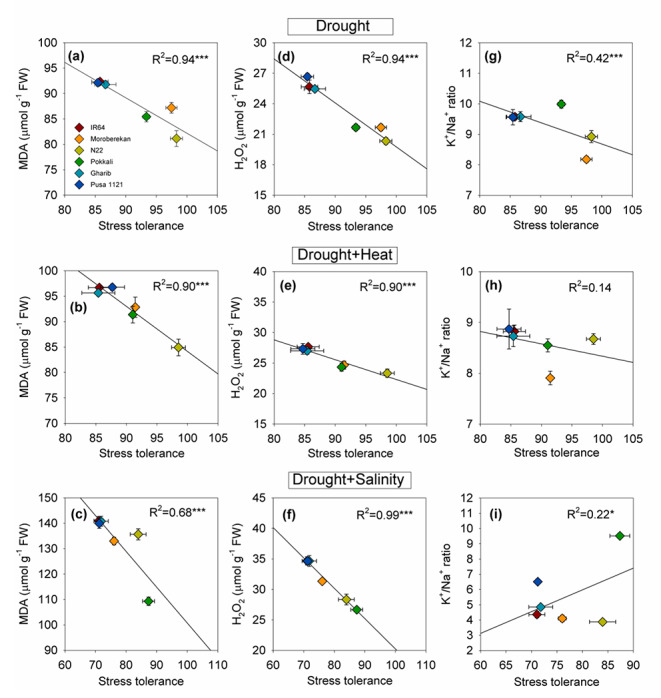
Linear regression of stress tolerance index with malondialdehyde content (MDA, a-c), reactive oxygen species (H2O2 content, d-f) and K+/Na+ ratio (g-i) under drought (a, d, g), (D + H; b, e, h) and (D + S; c, f, i). Stress tolerance index was calculated as mean fresh weight of seedlings under a stress divided by mean fresh weight of seedling under control condition. *** indicate significance level at P ≤ 0.001, * indicate significance level at P ≤ 0.05
Physiological and biochemical response to drought + heat (D + H) stress
The representative seedlings of each genotype grown under control and D + H stress conditions are shown in Fig. 1. IR64, Gharib, Pusa1121 and Moroberekan seedlings showed browning of tips along with a loss of turgidity. All the physiological and biochemical traits showed significant change under D + H across the genotypes (Supplementary Table S3, S4). A significant decrease in FW was observed in all the genotypes (10 to 17%) except in N22. Pokkali recorded highest reduction in FW (17%) followed by IR64, Pusa 1121 and Gharib as compared to their respective controls (Fig. 2a). Under D + H, highest decline in DW was recorded for Gharib (25%) followed by IR64 and Pusa 1121 (~ 22%). Although, Pokkali and Moroberekan showed ~ 18% reduction in DW, N22 showed lowest reduction (5%) in DW (Fig. 2b). RL was decreased in case of all cultivars except Pokkali in which RL increased by 1% (Fig. 2c). Similarly, a significant decline was recorded in SL across the genotypes, with highest reduction noted in Pokkali (30%) (Fig. 2d). A significant reduction (9 to 24%) was recorded in chlorophyll fluorescence across the genotypes under D + H stress with Gharib and N22, showing highest and least decline, respectively (Fig. 3a). Relative change in MDA (Fig. 3b) and H2O2 content (Fig. 3c) was the higher among the sensitive genotypes IR64, Gharib and Pusa 1121 (13 to 15%) and Moroberekan (12%) as compared to their respective controls. Conversely, the lowest MDA were observed in N22 (~ 9%) under D + H stress, however, H2O2 content was 19 to 33% across the tolerant and sensitive genotypes (Fig. 3b, c). A significant negative correlation was observed between stress tolerance and MDA content (R2 = 0.90***), and H2O2 content (R2 = 0.90***). However, there was no significant correlation between stress tolerance and K+/Na+ ratio under D + H stress (Fig. 4 h).
Physiological and biochemical response to combined drought + salinity (D + S) stress
Rice seedlings showed browning of tips and loss of turgidity in all the genotypes except Pokkali under combined D + S stresses (Fig. 1). All the physiological and biochemical traits showed significant variation across the genotypes (Supplementary table S3, S4). A significant decrease in FW (Fig. 2a) and DW (Fig. 2b) was observed across the genotypes, with > 28%, > 49% decline noted in sensitive genotypes (IR64, Pusa 1121, Gharib), under D + S as compared to their respective controls, respectively. Conversely, Pokkali recorded lowest decline in FW (14%) and DW (16%) under D + S stress (Fig. 2a,b). Under the D + S stress condition, 3 to 8% decrease in RL was observed with highest reduction in Pusa 1121 and Gharib (~ 8%), whereas Pokkali showed an 9% increase in RL (Fig. 2c). Moreover, a significant (P < 0.001) decrease (9 to 20%) in shoot length was observed across the genotypes under D + S except Pokkali which showed 5% increase in SL under D + S (Fig. 2d). There was a significant decrease in chlorophyll fluorescence across the genotypes (9 to 23%) under D + S as compared to control (Fig. 3a), with IR64 and Pokkali showing maximum and minimum decline in the Fv/Fm ratio. Relative change in MDA content was highest for N22 followed by Gharib, IR64 and Pusa 1121 under D + S stress (Fig. 3b). Conversely, IR64 recorded highest relative change for H2O2 content, while Pokkali showed the least (Fig. 3c). Pokkali showed highest K+/Na+ ratio (9.5), while all other genotypes showed significantly lower level of K+/Na+ ratio (4 to 5) under D + S stress (Fig. 3d). Stress tolerance index showed a negative correlation with MDA (R2 = 0.68***) and a strong negative correlation with H2O2 content (R2 = 0.99) (Fig. 4c, f). Conversely, a weak but significant (P < 0.05) correlation (R2 = 0.22) was observed between K+/Na+ ratio and stress tolerance under D + S (Fig. 4i).
The transcript abundance for ROS scavenging enzymes showed a physiological relevance to tolerance and susceptibility among the rice genotypes
To understand the mechanistic basis of stress tolerance among the rice genotypes under drought and combination of drought with heat and salinity, the transcript level of ROS scavenging enzymes such as ascorbate peroxidase (APX), superoxide dismutase (SOD), and catalase (CAT) were analyzed. In addition, the transcript level of DEHYDRIN and splice variants of GATA28 transcription factor were also analyzed (Fig. 5a-f).
Fig. 5.
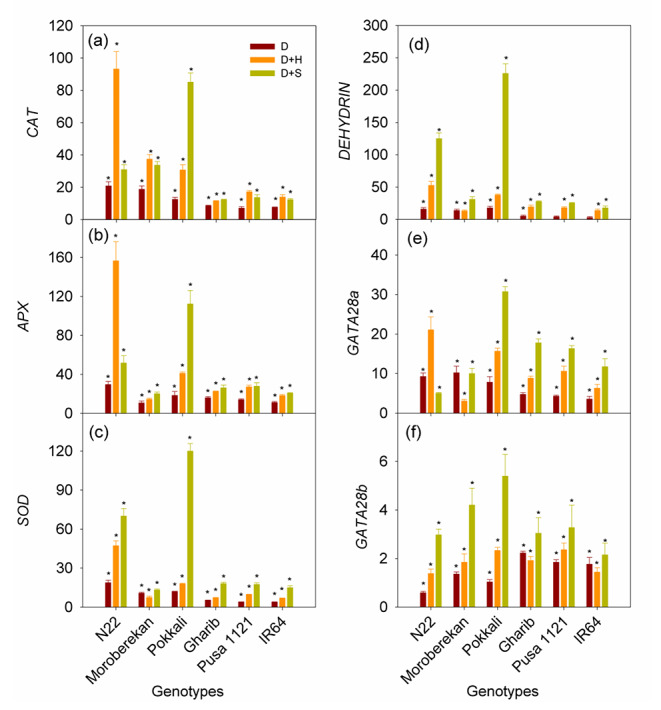
Expression profile (depicts fold change in terms of log base two values) of CATB, APX, SOD, DEHYDRIN and splice variants of GATA28 in rice genotypes IR64, Pusa 1121, Gharib, Moroberekan, N22 and Pokkali in response to drought (D), drought + heat (D + H) and drought + salinity (D + S) at seedling stage. Each vertical column represents fold change in trait measured as compared to respective control. The mean data of each trait for a genotype was calculated from three biological replicates. Bars indicate ± SE (standard error of mean). Comparison of means within a genotype was done with Fisher’s least significant difference (LSD) test, where symbol ‘*’ indicates significant difference (P < 0.05) between respective treatment and control. The actual values of data presented are given in the supplementary table S5). The fold change in the expression level of each gene due to stress has been calculated by using 2-ddCT method. OseEF-1α has been taken as the reference gene and three biological replicates of each sample were taken
A significant change in the gene expression pattern has been observed across the genotypes and the treatments (Supplementary Table S5). The expression level of ROS scavenging enzymes was significantly increased across the genotypes as well as across the stress conditions (Fig. 5a). However, the highest increase in CAT (90- fold; Fig. 5a) and APX (148-fold, Fig. 5b) transcripts was observed in N22 under drought, and D + H, respectively. SOD showed the highest increase in the transcripts level in Pokkali under D + S (Fig. 5c). Moreover, DEHYDRIN transcript was highest in Pokkali (224-fold) (Fig. 5d) under D + S. Similarly, the GATA28a and GATA28b transcripts were highest in Pokkali under D + S condition (Fig. 5e, f). However, the scale of change of GATA28a was 3 to 5 folds higher compared to GATA28b. All the sensitive genotypes recorded significantly lower levels of expression of selected genes across the stress conditions. However, combination stresses D + H and D + S influenced gene expression significantly higher as compared to drought alone across the genotypes (Fig. 5e, f).
Discussion
Different mechanism(s) have been proposed to be working under single stress and stress combinations as evidenced by different set of morphological and physiological traits, and unique molecular characteristics (genes and metabolites) enhanced or suppressed (Mittler 2006; Mitter and Blumward, 2010; Mittler at al. 2012; Deinlein et al. 2014; Shuzuki et al. 2014; Rodrigues et al. 2019; Shailani et al. 2021). Thus, identification of potential traits, their phenotypic expression and characterization of key genes under stress combinations would help in understanding the links, which work under stress combinations. Moreover, there are no known donor genotypes and traits reported for D + H and D + S stress combination in rice, which is hampering the efforts to breed rice for multiple abiotic stress tolerance. Hence, this study was carried out to explore the potential traits and key gene(s) working under combination of drought stress with heat and salinity.
Different physiological traits regulate rice response under drought and combination stress
The phenotypic changes in sensitive IR64, Pusa 1121 and Gharib seedlings showed browning of the shoots, kinking of the shoot tips, and a significant reduction in FW, DW, RL, and SL under drought stress (Fig. 2). This effect could be most likely due to the loss of turgidity, reduced photosynthesis efficiency (Fv/Fm), functioning of photosystems (PSI and PSII), reducing overall photo-assimilation (Farooq et al. 2009; Zlatev 2009; Mishra and Panda 2017; Gupta et al. 2020; Zhu et al. 2020), and causing cellular damage due to higher production of ROS (Fig. 3). The photosynthesis machinery in higher plants is generally sensitive to drought and directly influence the crop growth and yield (Chaves et al. 2011; Lahkar and Tanti 2017; Rodrigues et al. 2019; Hussain et al. 2021). Conversely, the overproduction of ROS could prompt lipid peroxidation and, subsequently, chlorophyll degradation and decrease in photosynthesis efficiency (Ranjbarfordoei et al. 2000; Hirt and Shinozaki 2003; Chaves et al. 2011). As compared to the sensitive cultivars, N22, Morobrekan, and Pokkali performed better in terms of SL, FW, and DW under drought stress (Fig. 2). However, both N22 and Moroberekan seedlings showed better performance under drought stress with least effect of stress observed on SL, FW, and DW (Fig. 2). On the contrary, N22 showed a significant increase in RL under drought stress (Fig. 2c). Root length is a well-documented adaptive trait for drought avoidance as increased root length could help in more water uptake from the deeper layers of soil (Henry 2013; Kadam et al. 2015, 2017). Nevertheless, rice genotypes with extensive root system and high root-shoot ratio showed better adaptability in drought across the studies (Mishra et al. 2019; Kim et al. 2020). Interestingly, this important trait was not effective under D + H combination, where N22 recorded decline in root length, similar to the sensitive genotypes (Fig. 2c). It has been reported that high transpirational cooling is a very affective trait under heat to keep canopy and tissue temperature cooler, while higher root length helps in maintaining the plant water status and the water use efficiency under drought condition (Bahuguna et al. 2015; 2018a, b). These contrasting features could not work efficiently when drought and heat co-occurred. Thus, this important observation indicates a shifting in the mechanism at cellular to plant level, which could allow better growth of N22 seedlings under D + H combination, where avoidance strategy could not ensure protection against stress. Conversely, despite a significant decline in SL, Pokkali did not show any reduction in RL under D + H combination. Moreover, Pokkali seedlings recorded higher SL and RL under D + S (Fig. 2c, d) indicating a different strategy from N22 functional in Pokkali under stress combinations. Roots are very sensitive to surrounding environment and change in root length and angle has been associated with salinity tolerance (Deinlein et al. 2014; Fu et al. 2019; Kitomi et al. 2020). Higher RL in Pokkali coupled with lower Na+ accumulation (Fig. 3c) demonstrates its ability to harvest more soil water and exclude Na+ ions from the root cells as a plausible mechanism reported under salinity (Deinlein et al. 2014; Negrão et al. 2017), helped to thrive under D + S combination, which was not visible in any other genotypes in comparison (Figs. 2 and 3).
Biochemical traits estimate severity of stress under drought and combination stress
Stress markers such as MDA and H2O2 content, which are indicators of increased lipid peroxidation level and membrane damage under stress (Møller et al. 2007), were significantly higher in sensitive genotypes IR64, Pusa 1121 and Gharib as compared to the tolerant checks across the stress treatments. However, all the genotypes except Pokkali recorded high MDA and H2O2 content under D + S stress (Fig. 3a, b), which indicates exclusive mechanism(s) working in Pokkali under D + S stress. Conversely, both N22 and Pokkali showed differential responses under combination stress, where N22 maintained lower accumulation of H2O2 and MDA and higher Fv/Fm ratio under D + H stress, and Pokkali accumulated lowest levels MDA, H2O2 and Na+ under D + S (Fig. 3a-c). Conversely, N22, Morobrekan, and Pokkali plants showed a higher Fv/Fm ratio indicating less damage to photosynthesis machinery across the stress treatments, as compared to the sensitive genotypes (Fig. 3d). It has been documented that poor ROS scavenging machinery could result in higher ROS accumulation and membrane damage (Rawat et al. 2021). However, a robust antioxidant defense system, as evident from higher expression levels of SOD, APX and CAT, plays significant role in the oxidative stress management at cellular level by reducing ROS accumulation and its impact on different cellular components such as photosynthetic machinery, membranes, proteins and enzymes (Gill and Tuteja, 2010; Faize et al. 2011; Kamarudin et al. 2018; Billah et al. 2021; Hussain et al. 2021).
Gene expression reveal unique pattern across the genotypes and stress type
We have selected a key set of genes that are well documented to play important role under drought, heat and salinity stress (Selote and Khanna-Chopra 2004; Sharma and Dubey 2005; Shehab et al. 2010; Verma et al. 2017; Gupta et al. 2017). Role of CAT, SOD and APX is well known as master regulators of ROS detoxification system under abiotic stresses such as heat, drought and salinity (Sofo et al. 2015; Sarker and Oba 2018; Hasanuzzaman et al. 2020). Conversely, DEHYDRIN, and GATA transcription factors are well characterized for their roles under different abiotic stress tolerance (Hanin et al. 2011; Gupta et al. 2017; Yu et al. 2018). Despite their documented role under different abiotic stresses, their response under combinations of these stresses is not well-understood. In this study, sensitive genotypes (IR64, Pusa 1121, Gharib) showed lower expression levels of most of the genes selected in this study, however, tolerant checks viz. Moroberekan, N22 and Pokkali showed elevated but differential pattern of gene expression across the stress treatments (Fig. 5a-f). Expression levels of antioxidant enzymes and transcription factor genes (CAT, APX, SOD, DEHYDRIN and GATA28a, b) increased multi-fold as compared to their expression under drought stress alone. The activity of APX (Selote & Khanna‐Chopra 2004), SOD (Sharma and Dubey 2005), CAT (Shehab et al. 2010), DEHYDRIN (Verma et al. 2017) and GATA28a (Gupta et al. 2017) has been reported to increase in rice under various abiotic stresses and associated with increased levels of abiotic stress tolerance. In particular, the increase in antioxidant enzymes (APX and SOD) indicates the defensive activity required to counterbalance the oxidative damage caused by abiotic stresses (Lum et al. 2014; Yang et al. 2014). Moreover, DEHYDRIN has been considered as a molecular chaperone for protection of proteins, enzyme activities, nucleic acids, and membrane structure under stress conditions (Bray 1993; Close 1996; Peng et al. 2008; Hara et al. 2009). Interestingly, the level of gene expression in genotypes varied with the type of stress (Fig. 5) where N22 recorded highest expression of CAT, APX, SOD, DEHYDRIN and GATA28a under D + H, and Pokkali showed highest expression of CAT, APX, SOD, DEHYDRIN and GATA28a under D + S stress. Interestingly, despite its tolerance under D + H, N22 remained sensitive to D + S, whereas Pokkali remained sensitive to D + H despite its tolerance to D + S, which was in line with the variations observed in the physiological and biochemical traits (Figs. 1, 2 and 3). These results indicate that the perception of stress, its type, and the genetic background of the plant cumulatively determine the ultimate response under different combination of stresses.
Differential response of rice genotypes to stress and stress combinations
N22 performed best under drought and D + H combination. While, avoidance strategy was evident in N22 with increased root length, a more reliable antioxidant defense machinery could replace the defense strategy under D + H stress combination, where avoidance at physiological level was no more effective. Indeed, N22 has been documented to show both avoidance (Bahuguna et al. 2015; Kadam et al. 2015) and augmented antioxidant defense machinery (Bahuguna et al. 2015) under heat stress and drought stress. However, this study highlights how rice plants shifted from the avoidance under drought to more robust cellular level defense (elevated expression antioxidant genes and transcription factors) under D + H stress combination. These findings suggest, traits such as antioxidative defense enzymes and cellular mechanisms leading to dehydration tolerance such as accumulation of osmolytes, robust photosynthetic machinery (Mittler 2012; Nahar et al. 2018; Hussain et al. 2021) would be more relevant under D + H stress, which would need more energy input as compared to avoidance strategy (Mittler 2012). Recently, Li et al. (2021) reported that rice abscisic acid drought- ROS3 (OsADR3), confers drought stress tolerance by enhancing antioxidant defense, which advocates important role of antioxidant enzymes under combination stresses where preferred avoidance mechanism fails to be effective. Conversely, drought and salinity, often co-occur in agricultural fields (Pandey et al. 2015). Plants mostly experience an overlapping response for salinity and drought except for the ion toxicity, which occurs only under salinity (Parida and Das 2005). Dehydration or osmotic imbalance are major physiological problems that leads to plant growth reduction (Alam et al. 2004). Due to less water availability and decreased water potential, salinity disrupts the plant water relation and create ion toxicity (Rawat et al. 2022). Thus, the combination of drought with salinity is an illustration of negative interaction (Ahmed et al. 2013; Suzuki et al. 2014). The cellular level damage as indicated by MDA and ROS contents was noticed to be higher under combination stress as compared to drought alone and showed a negative correlation with stress tolerance (R2 = 0.68 to 0.99) (Fig. 4a-f). Conversely, K+/Na+ ratio decreased significantly across the genotypes under D + S except Pokkali, which was able to maintain the highest K+/Na+ ratio (> 9), which was positively correlated (R2 = 0.22) with stress tolerance (Figs. 3 and 4 g-i). Under saline conditions, plants accumulate high concentrations of Na+ in tissues to cope up with osmotic imbalance, although it leads to significant cellular damage and decrease in fresh weight (Wilson et al. 2000). When salinity was present along with the drought, it led to more severe effects that cause disruption in fluidity of membrane, which further affect ion transport and pumps (Conde et al. 2011). Interestingly, Pokkali was able to manage low concentration of Na+ and efficient ROS scavenging machinery, which are key traits for salinity tolerance (Deinlein et al. 2014; Negrão et al. 2017), thus, making it the best performing genotype under combination of D + S stress. However, similar stress tolerance mechanism did not work under D + H stress combination for Pokkali. Conversely, despite showing high tolerance to D + H stress, N22 was a poor performer under D + S, which could be attributed to possible ion toxicity caused by high amount of Na+ under the salinity stress (Deinlein et al. 2014). All the genotypes showed differential pattern in the physiological, biochemical, and molecular responses under drought stress and its combination with heat and salinity stress. While Morobrekan, Pokkali, and N22 genotypes showed tolerance to drought stress, N22 and Pokkali showed tolerance under D + H and D + S stress, respectively (Fig. 6a). Thus, successful adaptation of a genotype to a combination of stresses would require perception of stress combination, and subsequently genetic ability to shift and readjust strategies contributing to avoidance and cellular level tolerance to achieve optimum growth and yield (Fig. 6b). Moreover, augmented defense at cellular level, would also help in the protection of different components of photosynthetic machinery, which are crucial to maintain growth and productivity under frequently changing climate (Hussain et al. 2021). Recently, Avni et al. (2020) explained how plants can shift the avoidance route through CK-dependent signaling that ultimately alter the perception of environmental stimuli, and allow normal growth and metabolic maintenance under stress condition. Thus, a fine balance between the avoidance and tolerance strategies would allow phenotypic plasticity in plants to adapt under dynamically changing environment.
Fig. 6.
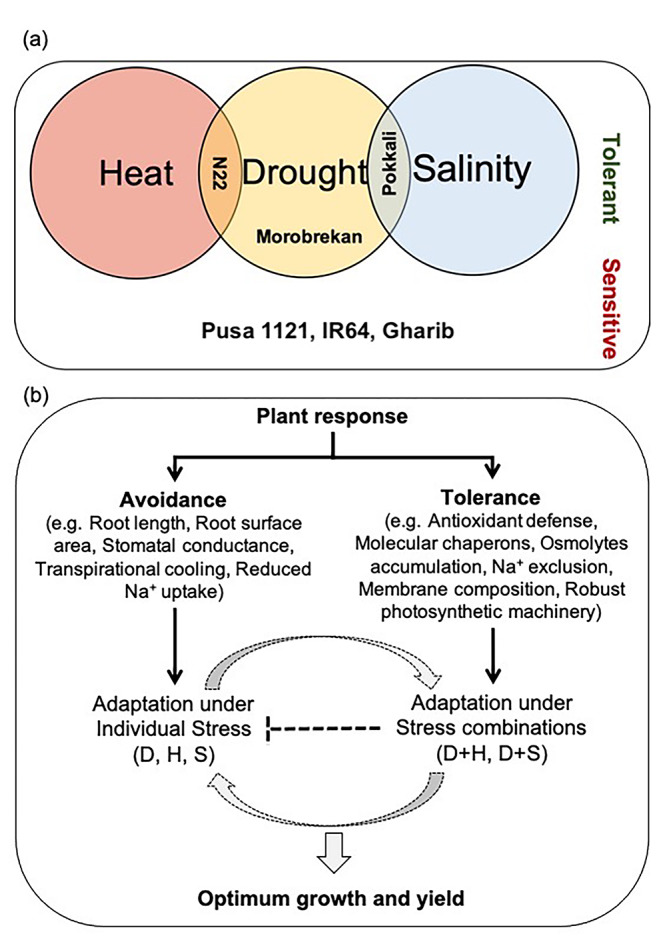
Vein diagram showing sensitive and tolerant cultivars under individual drought stress and its combination with heat and salinity (a), and schematic diagram showing adaptive plasticity in plant response to individual and combination stresses (b). [H, heat; D, drought; S, salinity]
In conclusion, crops growing in natural fields usually face a combination of different abiotic stresses. Our study concludes that combined or simultaneous occurrence of two stresses is more devastating to rice as compared to single isolated stress. The interaction between drought and heat (or salinity) led to severe reduction in growth traits in sensitive genotypes. However, this study suggests that genotypes could display different adaptive strategies to survive under combination of stresses such as D + H and D + S. These findings highlight that N22 and Pokkali could have distinct mechanisms to adapt and thrive under different stress combinations, which can be utilized for mechanistic understanding of tolerance to multiple abiotic stresses. Moreover, exploring genetic diversity by using diverse germplasm under combination stress could reveal novel alleles and QTLs that would help in explaining the precise mechanism(s) under combination stresses and signaling of stress perception that shift plant response across different stress combinations in the natural environment (Karan et al. 2009).
Electronic Supplementary Material
Below is the link to the electronic supplementary material.
Acknowledgements
University Grant Commission (UGC) to CY is gratefully acknowledged. RNB acknowledges DST Core Research Grant (CRG/2020/001935) from Department of Science and Technology, Government of India. Work in the lab of AP is supported by grants from International Atomic Energy Agency (Vienna), Indo-US Science and Technology Forum and Department of Biotechnology, Gov. of India.
Authors’ contributions
AP conceived the study. AP, OPD, RNB and SLS-P contributed to the experimental design and supervision of the project. CY carried out the experiments. All authors have been involved in writing and revision of the manuscript. All authors read and approved the final manuscript.
Data Availability Statement
All data generated or analyzed during this study are included in this published article and its Supplementary material.
Declarations
Conflict of interest
The authors declare no conflict of interest.
Footnotes
Chhaya Yadav and Rajeev Nayan Bahuguna contributed equally.
Publisher’s Note
Springer Nature remains neutral with regard to jurisdictional claims in published maps and institutional affiliations.
References
- Ahmed IM, Dai H, Zheng W, Cao F, Zhang G, Sun D, Wu F. Genotypic differences in physiological characteristics in the tolerance to drought and salinity combined stress between Tibetan wild and cultivated barley. Plant Physiol Biochem. 2013;63:49–60. doi: 10.1016/j.plaphy.2012.11.004. [DOI] [PubMed] [Google Scholar]
- Alam MZ, Stuchbury T, Naylor RE, Rashid MA (2004) Effect of salinity on growth of some modern rice cultivars. J Agron
- Avni A, Golan Y, Shirron N, Shamai Y, Golumbic Y, Danin-Poleg Y, Gepstein S, Gupta P, Bagri J, Singh D, Dewi AK, Tao L, Islam M, Sarsu F, Singla-Pareek SL, Pareek A (2020) (2018a) Forward and reverse genetics approaches for combined stress tolerance in rice. Indian J Plant Physiol 23(4):630 – 46
- Bahuguna RN, Jagadish KS. Temperature regulation of plant phenological development. Environ Exp Bot. 2015;111:83–90. doi: 10.1016/j.envexpbot.2014.10.007. [DOI] [Google Scholar]
- Bahuguna RN, Jha J, Pal M, Shah D, Lawas LM, Khetarpal S, Jagadish KS. Physiological and biochemical characterization of NERICA-L‐44: a novel source of heat tolerance at the vegetative and reproductive stages in rice. Physiol Plant. 2015;154(4):543–559. doi: 10.1111/ppl.12299. [DOI] [PubMed] [Google Scholar]
- Bahuguna RN, Tamilselvan A, Muthurajan R, Solis CA, Jagadish SV. Mild preflowering drought priming improves stress defences, assimilation and sink strength in rice under severe terminal drought. Funct Plant Biol. 2018;5(8):827–839. doi: 10.1071/FP17248. [DOI] [PubMed] [Google Scholar]
- Billah M, Aktar S, Brestic M, Zivcak M, Khaldun ABM, Uddin M, Bagum SA, Yang X, Skalicky M, Mehari TG, Maitra S (2021) Progressive Genomic Approaches to Explore Drought-and Salt-Induced Oxidative Stress Responses in Plants under Changing Climate. Plants, 10(9), 1910 [DOI] [PMC free article] [PubMed]
- Bray EA (2000) Response to abiotic stress. Biochemistry and molecular biology of plants 1158–1203
- Bray EA (1993) Molecular responses to water deficit. Plant Physiol, 103:1035 – 1040 [DOI] [PMC free article] [PubMed]
- Rawat N, Wungrampha S, Singla-Pareek SL, Yu M, Shabala S, Pareek A (2022) Rewilding staple crops for the lost halophytism: Toward sustainability and profitability of agricultural production systems. Mol. Plant 15:45-64 [DOI] [PubMed]
- Chaves MM, Costa JM, Saibo NJ (2011) Recent advances in photosynthesis under drought and salinity. In Advances in botanical research Jan 57 49–104 Academic Press
- Choudhary AK, Sultana R, Vales MI, Saxena KB, Kumar RR, Ratnakumar P (2018) Integrated physiological and molecular approaches to improvement of abiotic stress tolerance in two pulse crops of the semi-arid tropics. Crop J 1;6(2):99–114
- Close TJ. Dehydrins: Emergence of a biochemical role of a family of plant dehydration proteins. Physiol Plant. 1996;97:795–803. doi: 10.1111/j.1399-3054.1996.tb00546.x. [DOI] [Google Scholar]
- Conde A, Chaves MM, Gerós H. Membrane transport, sensing and signaling in plant adaptation to environmental stress. Plant Cell Physiol. 2011;52(9):1583–1602. doi: 10.1093/pcp/pcr107. [DOI] [PubMed] [Google Scholar]
- Cui Y, Zhang W, Lin X, Xu S, Xu J, Li Z. Simultaneous improvement and genetic dissection of drought tolerance using selected breeding populations of rice. Front Plant Sci. 2018;9:320. doi: 10.3389/fpls.2018.00320. [DOI] [PMC free article] [PubMed] [Google Scholar]
- Das P, Bahuguna RN, Rathore RS, Abbat S, Nongpiur RC, Sarsu F, Singla-Pareek SL, Pareek A (2021) Rice mutants with tolerance to multiple abiotic stresses show high constitutive abundance of stress-related transcripts and proteins. Aust. J. Crop Sci Sep 1;15(9):11–20
- Das P, Nutan KK, Singla-Pareek SL, Pareek A. Oxidative environment and redox homeostasis in plants: dissecting out significant contribution of major cellular organelles. Front Environ Sci. 2015;2:70. doi: 10.3389/fenvs.2014.00070. [DOI] [Google Scholar]
- Deinlein U, Stephan AB, Horie T, Luo W, Xu G, Schroeder JI (2014) Plant salt-tolerance mechanisms. Trends Plant Sci Jun 1;19(6):371-9 [DOI] [PMC free article] [PubMed]
- Faize M, Burgos L, Faize L, Piqueras A, Nicolas E, Barba-Espin G, Clemente-Moreno MJ, Alcobendas R, Artlip T, Hernandez JA. Involvement of cytosolic ascorbate peroxidase and Cu/Zn-superoxide dismutase for improved tolerance against drought stress. J Exp Bot. 2011;62(8):2599–2613. doi: 10.1093/jxb/erq432. [DOI] [PubMed] [Google Scholar]
- Farooq M, Kobayashi N, Wahid A, Ito O, Basra SM. Strategies for producing more rice with less water. Adv Agron. 2009;101:351–388. doi: 10.1016/S0065-2113(08)00811-0. [DOI] [Google Scholar]
- Fruhwirth GO, Hermetter A (2008) Mediation of apoptosis by oxidized phospholipids.Subcell Biochem 49:351–367 [DOI] [PubMed]
- Fu Y, Yang Y, Chen S, Ning N, Hu H. Arabidopsis IAR4 modulates primary root growth under salt stress through ROS-mediated modulation of auxin distribution. Front Plant Sci Apr. 2019;25:522. doi: 10.3389/fpls.2019.00522. [DOI] [PMC free article] [PubMed] [Google Scholar]
- Gallego SM, Pena LB, Barcia RA, Azpilicueta CE, Iannone MF, Rosales EP, Zawoznik MS, Groppa MD, Benavides MP. Unravelling cadmium toxicity and tolerance in plants: insight into regulatory mechanisms. Environ Exp Bot Nov. 2012;1:33–46. doi: 10.1016/j.envexpbot.2012.04.006. [DOI] [Google Scholar]
- Gupta A, Rico-Medina A, Caño-Delgado AI. The physiology of plant responses to drought. Sci Apr. 2020;17(6488):266–269. doi: 10.1126/science.aaz7614. [DOI] [PubMed] [Google Scholar]
- Gupta P, Nutan KK, Singla-Pareek SL, Pareek A. Abiotic stresses cause differential regulation of alternative splice forms of GATA transcription factor in rice. Front Plant Sci Nov. 2017;13:1944. doi: 10.3389/fpls.2017.01944. [DOI] [PMC free article] [PubMed] [Google Scholar]
- Hanin M, Brini F, Ebel C, Toda Y, Takeda S, Masmoudi K. Plant dehydrins and stress tolerance: versatile proteins for complex mechanisms. Plant Signal Behav. 2011;6(10):1503–1509. doi: 10.4161/psb.6.10.17088. [DOI] [PMC free article] [PubMed] [Google Scholar]
- Hara M, Shinoda Y, Tanaka Y, Kuboi T. DNA binding of citrus dehydrin promoted by zinc ion. Plant cell environ May. 2009;32(5):532–541. doi: 10.1111/j.1365-3040.2009.01947.x. [DOI] [PubMed] [Google Scholar]
- Hasanuzzaman M, Bhuyan MH, Zulfiqar F, Raza A, Mohsin SM, Mahmud JA, Fujita M, Fotopoulos V. Reactive oxygen species and antioxidant defense in plants under abiotic stress: Revisiting the crucial role of a universal defense regulator. Antioxid Aug. 2020;9(8):681. doi: 10.3390/antiox9080681. [DOI] [PMC free article] [PubMed] [Google Scholar]
- Henry A. IRRI’s drought stress research in rice with emphasis on roots: accomplishments over the last 50 years. Plant Root. 2013;7:92–106. doi: 10.3117/plantroot.7.92. [DOI] [Google Scholar]
- Hirt H, Shinozaki K (2003) Plant responses to abiotic stress, vol 4. Springer Science & Business Media
- Hussain S, Ulhassan Z, Brestic M, Zivcak M, Zhou W, Allakhverdiev SI, Yang X, Safdar ME, Yang W, Liu W. Photosynthesis research under climate change. Photosynth Res. 2021;150(1):5–19. doi: 10.1007/s11120-021-00861-z. [DOI] [PubMed] [Google Scholar]
- Iannone MF, Rosales EP, Groppa MD, Benavides MP. Reactive oxygen species formation and cell death in catalase-deficient tobacco leaf discs exposed to paraquat. Biol Trace Elem Res May. 2012;146(2):246–255. doi: 10.1007/s12011-011-9244-1. [DOI] [PubMed] [Google Scholar]
- Jagadish SK, Craufurd PQ, Wheeler TR (2007) High temperature stress and spikelet fertility in rice (Oryza sativa L.). J Exp Bot May 1;58(7):1627-35 [DOI] [PubMed]
- Ji K, Wang Y, Sun W, Lou Q, Mei H, Shen S, Chen H (2012) Drought-responsive mechanisms in rice genotypes with contrasting drought tolerance during reproductive stage. J plant physiol Mar 1;169(4):336 – 44 [DOI] [PubMed]
- Kadam NN, Tamilselvan A, Lawas LM, Quinones C, Bahuguna RN, Thomson MJ, Dingkuhn M, Muthurajan R, Struik PC, Yin X, Jagadish SK. Genetic control of plasticity in root morphology and anatomy of rice in response to water deficit. Plant Physiol Aug. 2017;174(4):2302–2315. doi: 10.1104/pp.17.00500. [DOI] [PMC free article] [PubMed] [Google Scholar]
- Kadam NN, Xiao G, Melgar RJ, Bahuguna RN, Quinones C, Tamilselvan A, Prasad PV, Jagadish KS. Agronomic and physiological responses to high temperature, drought, and elevated CO2 interactions in cereals. Adv Agron Jan. 2014;1:111–156. doi: 10.1016/B978-0-12-800131-8.00003-0. [DOI] [Google Scholar]
- Kadam NN, Yin X, Bindraban PS, Struik PC, Jagadish KS. Does morphological and anatomical plasticity during the vegetative stage make wheat more tolerant of water deficit stress than rice? Plant Physiol Apr. 2015;167(4):1389–1401. doi: 10.1104/pp.114.253328. [DOI] [PMC free article] [PubMed] [Google Scholar]
- Kamarudin ZS, Yusop MR, Tengku Muda Mohamed M, Ismail MR, Harun AR. Growth performance and antioxidant enzyme activities of advanced mutant rice genotypes under drought stress condition. Agron Dec. 2018;8(12):279. doi: 10.3390/agronomy8120279. [DOI] [Google Scholar]
- Karan R, Singla-Pareek SL, Pareek A. Histidine kinase and response regulator genes as they relate to salinity tolerance in rice. Funct Integr Genom. 2009;9(3):411–417. doi: 10.1007/s10142-009-0119-x. [DOI] [PubMed] [Google Scholar]
- Kim Y, Chung YS, Lee E, Tripathi P, Heo S, Kim KH. Root response to drought stress in rice (Oryza sativa L.) Int J Mol Sci Jan. 2020;21(4):1513. doi: 10.3390/ijms21041513. [DOI] [PMC free article] [PubMed] [Google Scholar]
- Kitomi Y, Hanzawa E, Kuya N, Inoue H, Hara N, Kawai S, Kanno N, Endo M, Sugimoto K, Yamazaki T, Sakamoto S (2020) Root angle modifications by the DRO1 homolog improve rice yields in saline paddy fields. Proc Natl Acad Sci Sep 1;117(35):21242-50 [DOI] [PMC free article] [PubMed]
- Kumari R, Sharma VK, Kumar H. Seed culture of rice cultivars under salt stress. Int J Pure Appl Biosci. 2015;3:191–202. [Google Scholar]
- Kumari S, Nee Sabharwal VP, Kushwaha HR, Sopory SK, Singla-Pareek SL, Pareek A. Transcriptome map for seedling stage specific salinity stress response indicates a specific set of genes as candidate for saline tolerance in Oryza sativa L. Funct Integr Genomics Feb. 2009;9(1):109–123. doi: 10.1007/s10142-008-0088-5. [DOI] [PubMed] [Google Scholar]
- Kumari S, Singh P, Singla-Pareek SL, Pareek A. Heterologous expression of a salinity and developmentally regulated rice cyclophilin gene (OsCyp2) in E. coli and S. cerevisiae confers tolerance towards multiple abiotic stresses. Mol Biotechnol. 2009;42(2):195–204. doi: 10.1007/s12033-009-9153-0. [DOI] [PubMed] [Google Scholar]
- Lahkar L, Tanti B. Study of morphological diversity of traditional aromatic rice landraces (Oryza sativa L.) collected from Assam, India. Ann Plant Sci. 2017;6(12):1855–1861. doi: 10.21746/aps.2017.6.12.9. [DOI] [Google Scholar]
- Leng G, Hall J. Crop yield sensitivity of global major agricultural countries to droughts and the projected changes in the future. Sci Total Environ. 2019;654:811–821. doi: 10.1016/j.scitotenv.2018.10.434. [DOI] [PMC free article] [PubMed] [Google Scholar]
- Lesk C, Rowhani P, Ramankutty N. Influence of extreme weather disasters on global crop production. Nature. 2016;529(7584):84–87. doi: 10.1038/nature16467. [DOI] [PubMed] [Google Scholar]
- Li J, Zhang M, Yang L, Mao X, Li J, Li L, Wang J, Liu H, Zheng H, Li Z, Zhao H (2021) OsADR3 increases drought stress tolerance by inducing antioxidant defense mechanisms and regulating OsGPX1 in rice (Oryza sativa L.).Crop J 9:003-1017
- Liu C, Mao B, Yuan D, Chu C, Duan M (2021) Salt tolerance in rice: physiological responses and molecular mechanisms. stress.;1:25
- Lum MS, Hanafi MM, Rafii YM, Akmar ASN. Effect of drought stress on growth, proline and antioxidant enzyme activities of upland rice. J Anim Plant Sci. 2014;24(5):1487–1493. [Google Scholar]
- Mishra M, Wungrampha S, Kumar G, Singla-Pareek SL, Pareek A. How do rice seedlings of landrace Pokkali survive in saline fields after transplantation? Physiology, biochemistry, and photosynthesis. Photosynth Res Jul. 2020;6:1–9. doi: 10.1007/s11120-020-00771-6. [DOI] [PubMed] [Google Scholar]
- Mishra SS, Behera PK, Panda D. Genotypic variability for drought tolerance-related morpho-physiological traits among indigenous rice landraces of Jeypore tract of Odisha, India. J Crop Improv Mar. 2019;4(2):254–278. doi: 10.1080/15427528.2019.1579138. [DOI] [Google Scholar]
- Mishra SS, Panda D (2017) Leaf traits and antioxidant defense for drought tolerance during early growth stage in some popular traditional rice landraces from Koraput, India. Rice Sci Jul 1;24(4):207 – 17
- Mittler R. Abiotic stress, the field environment and stress combination. Trends Plant Sci. 2006;11(1):15–19. doi: 10.1016/j.tplants.2005.11.002. [DOI] [PubMed] [Google Scholar]
- Møller IM, Jensen PE, Hansson A. Oxidative modifications to cellular components in plants. Annu Rev Plant Biol. 2007;58:459–481. doi: 10.1146/annurev.arplant.58.032806.103946. [DOI] [PubMed] [Google Scholar]
- Nahar S, Vemireddy LR, Sahoo L, Tanti B (2018) Antioxidant protection mechanisms reveal significant response in drought-induced oxidative stress in some traditional rice of Assam, India. Rice Sci Jul 1;25(4):185 – 96
- Negrão S, Schmöckel SM, Tester M. Evaluating physiological responses of plants to salinity stress. Ann Bot Jan. 2017;1(1):1–1. doi: 10.1093/aob/mcw191. [DOI] [PMC free article] [PubMed] [Google Scholar]
- Pandey P, Ramegowda V, Senthil-Kumar M. Shared and unique responses of plants to multiple individual stresses and stress combinations: physiological and molecular mechanisms. Front Plant Sci. 2015;6:723. doi: 10.3389/fpls.2015.00723. [DOI] [PMC free article] [PubMed] [Google Scholar]
- Parida AK, Das AB. Salt tolerance and salinity effects on plants: a review. Ecotoxicol Environ Saf. 2005;60(3):324–349. doi: 10.1016/j.ecoenv.2004.06.010. [DOI] [PubMed] [Google Scholar]
- Paul K, Pauk J, Kondic-Spika A, Grausgruber H, Allahverdiyev T, Sass L, Vass I. Co-occurrence of mild salinity and drought synergistically enhances biomass and grain retardation in wheat. Front Plant Sci Apr. 2019;24:501. doi: 10.3389/fpls.2019.00501. [DOI] [PMC free article] [PubMed] [Google Scholar]
- Peng Y, Reyes JL, Wei H, Yang Y, Karlson D, Covarrubias AA, Krebs SL, Fessehaie A, Arora R. RcDhn5, a cold acclimation-responsive dehydrin from Rhododendron catawbiense rescues enzyme activity from dehydration effects in vitro and enhances freezing tolerance in RcDhn5‐overexpressing Arabidopsis plants. Physiol Plant Dec. 2008;134(4):583–597. doi: 10.1111/j.1399-3054.2008.01164.x. [DOI] [PubMed] [Google Scholar]
- Pradhan GP, Prasad PV, Fritz AK, Kirkham MB, Gill BS. Effects of drought and high temperature stress on synthetic hexaploid wheat. Funct Plant Biol Mar. 2012;6(3):190–198. doi: 10.1071/FP11245. [DOI] [PubMed] [Google Scholar]
- Prasad PV, Pisipati SR, Mutava RN, Tuinstra MR. Sensitivity of grain sorghum to high temperature stress during reproductive development. Crop Sci Sep. 2008;48(5):1911–1917. doi: 10.2135/cropsci2008.01.0036. [DOI] [Google Scholar]
- Rani B, Sharma VK. Standarisation of methodology for obtaining the desired salt stress environment for salinity effect observation in rice seedlings. Int J Environ Sci. 2015;6(2):232–236. [Google Scholar]
- Ranjbarfordoei A, Samson R, Van Damme P, Lemeur R. Effects of drought stress induced by polyethylene glycol on pigment content and photosynthetic gas exchange of Pistacia khinjuk and P. mutica. Photosynthetica Apr. 2000;38(3):443–447. doi: 10.1023/A:1010946209484. [DOI] [Google Scholar]
- Rizhsky L, Liang H, Shuman J, Shulaev V, Davletova S, Mittler R (2004) When defense pathways collide. The response of Arabidopsis to a combination of drought and heat stress. Plant Physiol Apr 1;134(4):1683-96 [DOI] [PMC free article] [PubMed]
- Rodrigues J, Inzé D, Nelissen H, Saibo NJ. Source–sink regulation in crops under water deficit. Trends Plant Sci Jul. 2019;1(7):652–663. doi: 10.1016/j.tplants.2019.04.005. [DOI] [PubMed] [Google Scholar]
- Sampangi-Ramaiah MH, Dey P, Jambagi S, Kumari MV, Oelmüller R, Nataraja KN, Ravishankar KV, Ravikanth G, Shaanker RU. An endophyte from salt-adapted Pokkali rice confers salt-tolerance to a salt-sensitive rice variety and targets a unique pattern of genes in its new host. Sci Rep Feb. 2020;24(1):1–4. doi: 10.1038/s41598-020-59998-x. [DOI] [PMC free article] [PubMed] [Google Scholar]
- Sarker U, Oba S. Catalase, superoxide dismutase and ascorbate-glutathione cycle enzymes confer drought tolerance of Amaranthus tricolor. Sci Rep. 2018;8(1):1–12. doi: 10.1038/s41598-018-34944-0. [DOI] [PMC free article] [PubMed] [Google Scholar]
- Selote DS, Khanna-Chopra R. Drought‐induced spikelet sterility is associated with an inefficient antioxidant defence in rice panicles. Physiol Plant. 2004;121(3):462–471. doi: 10.1111/j.1399-3054.2004.00341.x. [DOI] [Google Scholar]
- Shah F, Huang J, Cui K, Nie L, Shah T, Chen C, Wang K. Impact of high-temperature stress on rice plant and its traits related to tolerance. J Agric Sci Oct. 2011;149(5):545–556. doi: 10.1017/S0021859611000360. [DOI] [Google Scholar]
- Shailani A, Joshi R, Singla-Pareek SL, Pareek A. Stacking for future: Pyramiding genes to improve drought and salinity tolerance in rice. Physiol Plant. 2021;172(2):1352–1362. doi: 10.1111/ppl.13270. [DOI] [PubMed] [Google Scholar]
- Sharma P, Dubey RS. Drought induces oxidative stress and enhances the activities of antioxidant enzymes in growing rice seedlings. Plant Growth Regul. 2005;46(3):209–221. doi: 10.1007/s10725-005-0002-2. [DOI] [Google Scholar]
- Sofo A, Scopa A, Nuzzaci M, Vitti A. Ascorbate peroxidase and catalase activities and their genetic regulation in plants subjected to drought and salinity stresses. Int J Mol Sci. 2015;16(6):13561–13578. doi: 10.3390/ijms160613561. [DOI] [PMC free article] [PubMed] [Google Scholar]
- Stadtman ER, Levine RL. Protein oxidation. Ann N Y Acad Sci. 2000;899(1):191–208. doi: 10.1111/j.1749-6632.2000.tb06187.x. [DOI] [PubMed] [Google Scholar]
- Suzuki N, Rivero RM, Shulaev V, Blumwald E, Mittler R. Abiotic and biotic stress combinations. New Phytol Jul. 2014;203(1):32–43. doi: 10.1111/nph.12797. [DOI] [PubMed] [Google Scholar]
- Todaka D, Nakashima K, Shinozaki K, Yamaguchi-Shinozaki K (2012) Toward understanding transcriptional regulatory networks in abiotic stress responses and tolerance in rice Rice Dec;5(1):1–9 [DOI] [PMC free article] [PubMed]
- Trenberth KE, Dai A, Van Der Schrier G, Jones PD, Barichivich J, Briffa KR, Sheffield J. Global warming and changes in drought. Nat Clim Chang Jan. 2014;4(1):17–22. doi: 10.1038/nclimate2067. [DOI] [Google Scholar]
- Velikova V, Yordanov I, Edreva A. Oxidative stress and some antioxidant systems in acid rain-treated bean plants: protective role of exogenous polyamines. Plant Sci Feb. 2000;7(1):59–66. doi: 10.1016/S0168-9452(99)00197-1. [DOI] [Google Scholar]
- Venuprasad R, Cruz MS, Amante M, Magbanua R, Kumar A, Atlin GN (2008) Response to two cycles of divergent selection for grain yield under drought stress in four rice breeding populations. Field Crops Res Jun 3;107(3):232 – 44
- Verma G, Dhar YV, Srivastava D, Kidwai M, Chauhan PS, Bag SK, Asif MH, Chakrabarty D (2017) Genome-wide analysis of rice dehydrin gene family: Its evolutionary conservedness and expression pattern in response to PEG induced dehydration stress. PLoS One May 1;12(5):e0176399 [DOI] [PMC free article] [PubMed]
- Wilson C, Lesch SM, Grieve CM (2000) Growth stage modulates salinity tolerance of New Zealand spinach (Tetragonia tetragonioides, Pall.) and red orach (Atriplex hortensis L.). Ann Bot Apr 1;85(4):501-9
- Wungrampha S, Joshi R, Rathore RS, Singla-Pareek SL, Pareek A. CO2 uptake and chlorophyll a fluorescence of Suaeda fruticosa grown under diurnal rhythm and after transfer to continuous dark. Photosynth Res Nov. 2019;142(2):211–227. doi: 10.1007/s11120-019-00659-0. [DOI] [PubMed] [Google Scholar]
- Wungrampha S, Joshi R, Singla-Pareek SL, Pareek A. Photosynthesis and salinity: are these mutually exclusive? Photosynthetica. 2018;56(1):366–381. doi: 10.1007/s11099-017-0763-7. [DOI] [Google Scholar]
- Xie Z, Wang C, Zhu S, Wang W, Xu J, Zhao X. Characterizing the metabolites related to rice salt tolerance with introgression lines exhibiting contrasting performances in response to saline conditions. Plant Growth Regul Nov. 2020;92:157–167. doi: 10.1007/s10725-020-00627-y. [DOI] [Google Scholar]
- Yang L, Zhao X, Zhu H, Paul M, Zu Y, Tang Z. Exogenous trehalose largely alleviates ionic unbalance, ROS burst, and PCD occurrence induced by high salinity in Arabidopsis seedlings. Front Plant Sci Oct. 2014;29:570. doi: 10.3389/fpls.2014.00570. [DOI] [PMC free article] [PubMed] [Google Scholar]
- Yu Z, Wang X, Zhang L. Structural and functional dynamics of dehydrins: a plant protector protein under abiotic stress. Int J Mol Sci. 2018;19(11):3420. doi: 10.3390/ijms19113420. [DOI] [PMC free article] [PubMed] [Google Scholar]
- Zhao X, Wang W, Zhang F, Deng J, Li Z, Fu B (2014) Comparative metabolite profiling of two rice genotypes with contrasting salt stress tolerance at the seedling stage. PloS one Sep 29;9(9): e108020 [DOI] [PMC free article] [PubMed]
- Zhu R, Wu F, Zhou S, Hu T, Huang J, Gao Y. Cumulative effects of drought–flood abrupt alternation on the photosynthetic characteristics of rice. Environ Exp Bot Jan. 2020;1:103901. doi: 10.1016/j.envexpbot.2019.103901. [DOI] [Google Scholar]
- Zlatev Z (2009) Drought-induced changes in chlorophyll fluorescence of young wheat plants. Biotechnol Biotechnol Equip Jan 1;23(sup1):438 – 41
- Rawat Nishtha, Singla‐Pareek Sneh L., Pareek Ashwani. Membrane dynamics during individual and combined abiotic stresses in plants and tools to study the same. Physiologia Plantarum. 2021;171(4):653–676. doi: 10.1111/ppl.13217. [DOI] [PubMed] [Google Scholar]
Associated Data
This section collects any data citations, data availability statements, or supplementary materials included in this article.
Supplementary Materials
Data Availability Statement
All data generated or analyzed during this study are included in this published article and its Supplementary material.