

Abstract
Individuals with COVID‐19 who do not require hospitalization are instructed to self‐isolate in their residences. Due to high secondary infection rates in household members, there is a need to understand airborne transmission of SARS‐CoV‐2 within residences. We report the first naturalistic intervention study suggesting a reduction of such transmission risk using portable air cleaners (PACs) with HEPA filters. Seventeen individuals with newly diagnosed COVID‐19 infection completed this single‐blind, crossover, randomized study. Total and size‐fractionated aerosol samples were collected simultaneously in the self‐isolation room with the PAC (primary) and another room (secondary) for two consecutive 24‐h periods, one period with HEPA filtration and the other with the filter removed (sham). Seven out of sixteen (44%) air samples in primary rooms were positive for SARS‐CoV‐2 RNA during the sham period. With the PAC operated at its lowest setting (clean air delivery rate [CADR] = 263 cfm) to minimize noise, positive aerosol samples decreased to four out of sixteen residences (25%; p = 0.229). A slight decrease in positive aerosol samples was also observed in the secondary room. As the world confronts both new variants and limited vaccination rates, our study supports this practical intervention to reduce the presence of viral aerosols in a real‐world setting.
Keywords: Air change rate, Airborne transmission, COVID‐19 pandemic, COVID‐19 symptoms, PTFE filter virus sampling, SARS‐CoV‐2 aerosols
Practical Implications.
SARS‐CoV‐2 RNA was detected in aerosol samples collected in residences, further strengthening the thesis that the airborne transmission route is key for COVID‐19 spread and deserves attention.
Interventions in residences such as the use of portable air cleaners should be considered to reduce airborne viral levels and thus transmission of COVID‐19.
Lower viral loads in saliva samples (higher Ct values) are associated with a reduced probability of detecting SARS‐CoV‐2 RNA in the air.
The presence of respiratory (e.g., cough, shortness of breath, and sore throat) and gastrointestinal symptoms may inform the likelihood of airborne transmission and direct preventive measures.
1. INTRODUCTION
COVID‐19 caused by SARS‐CoV‐2 remains a deadly pandemic, and new variants such as Delta (B.1.617.2) and especially Omicron (B.1.1.529) are highly transmissible. 1 As of January 9, 2022, there were 299 million cases of COVID‐19 worldwide, causing 5.4 million deaths with over 2.3 million daily cases still being recorded. 2 There have been 57.5 million confirmed cases in the United States alone, with 826 000 deaths and counting. 3 , 4
Increasing evidence and informed opinion indicate that virus‐laden aerosol particles play an important role in the transmission and pathogenesis of SARS‐CoV‐2 infection. 5 , 6 , 7 Viral particles originating from the respiratory tract have a bimodal size distribution, 8 , 9 , 10 which underlies two primary pathways for airborne transmission. Relatively large respiratory droplets (e.g., from ~10 to 100 µm and larger) rapidly settle onto surfaces, 11 typically within 1–2 m of the source. They are amenable to protection by traditional techniques such as hand hygiene, social distancing, and face masks. Smaller particles, from ~100 nm to a few microns, can remain suspended in the air for hours, 12 , 13 , 14 move with air currents, and require additional control measures such as high‐efficiency masks and respirators, ventilation, or air filtration. 15 , 16 Epidemiological studies have found that transmission can occur at distances greater than 2 m away from an infectious source. 17 , 18 , 19 , 20 , 21 The potential importance of fine particles in COVID‐19 transmission is supported by studies finding SARS‐CoV‐2 RNA in indoor air samples in healthcare settings 22 , 23 and more recently in residences. 24 , 25 , 26
Individuals newly infected with SARS‐CoV‐2 are directed to isolate themselves at home, with necessary care (e.g., food and assistance with hygiene) provided by household members. Yet, unlike in healthcare settings, the presence of airborne SARS‐CoV‐2 RNA has not been systematically evaluated in residences. In a recent review, Dinoi et al. reported that more than 75% of studies of airborne SARS‐CoV‐2 RNA were conducted in hospitals, while only 13% were in community‐based indoor environments, 27 and three studies were in homes of infected individuals. 28 , 29 , 30 The CDC recommends maintaining "good air flow" and opening the window in a space shared with an infected household member, but this advice may be difficult to follow due to limited ventilation, security concerns, and adverse weather conditions. Moreover, isolation from others may be difficult to achieve and maintain for 10–14 days (or shorter as per the latest Omicron‐variant‐based CDC guidance 31 ). These challenges are likely to have contributed to the high rate of secondary infections (e.g., up to 55%) observed among household members. 32 , 33 , 34
Air filtration using portable air cleaners (PACs) is a practical intervention that could lower airborne viral particle concentrations and improve air exchange rates (AER) in homes, thereby reducing infection risk via fine aerosol and even droplets among close contacts and caregivers. 35 , 36 , 37 High efficiency particulate air (HEPA) filters, commonly used in PAC, capture at least 99.97% of particles of the maximum penetrating size (i.e., 0.3 µm in diameter). 38 Furthermore, the effectiveness of PACs to reduce the presence of aerosols, including PM2.5, PM10, fungal spores, and black carbon, due to traffic, cooking, wildfires, and other sources, has been shown in residential settings. 39 , 40 , 41 , 42 A typical PAC with a clean air delivery rate (CADR) of 300 cfm operating in a 15 x 15 x 8 ft. room provides clean air equivalent to 10 air changes per hour (ACH). 43 ACH in typical US homes without PAC is markedly lower, ranging only from 0.5 to 1.5. 37 , 44
While the combination of vaccines and boosters prevents severe cases of COVID‐19, uncertainty remains about practical public health responses to reduce the risk of in‐home infection, such as from the highly contagious Omicron variant (B.1.1.529) 45 or future novel respiratory viruses. Therefore, studies of other means to reduce the transmission of viral infections, such as the use of PACs, are needed. Prior studies in residences have involved manipulating or scripting subject behavior/activities. Here, we report the first naturalistic interventional study using PACs to reduce airborne levels of COVID‐19 in US residences. This study aimed to:
Investigate the presence of airborne SARS‐CoV‐2 RNA in total suspended particles and size‐fractionated airborne particles in the primary room (i.e., the "self‐isolation room") used by an infected participant and a secondary room in the residence;
Assess associations between the detection of SARS‐CoV‐2 RNA in the air and the viral loads in participants' saliva and their symptoms;
Determine whether residential exposure to airborne SARS‐CoV‐2 can be reduced by PACs.
2. METHODS AND MATERIALS
2.1. Study design
The study was a randomized crossover trial using air filtration with PACs as the intervention. Sampling was conducted in participants' residences for two consecutive 24‐h periods (Day 1 and Day 2) with the PAC operated in "filtration" (HEPA filter installed) or "sham" (HEPA filter removed) modes. The participant was blinded to the order of treatments, which was randomized. The study took place between November 2020 and May 2021, during the time when Alpha (B.1.1.7), Iota (B.1.526), Gamma (P.1), and Delta (B.1.617.2) SARS‐CoV‐2 variants were dominant in the US. 46 , 47 , 48 The study was approved by the Rutgers University Institutional Review Board (Pro2020001323), and the participants provided informed consent.
2.2. Recruitment
Participants were recruited primarily through Rutgers University Employee Health Services (New Jersey, US). Employees who received or reported a positive clinical test for SARS‐CoV‐2 were electronically given a study flyer and asked to contact the study team. Subjects were also recruited through a partnership with Vault Health (New York City, NY), a virtual healthcare platform that provides COVID‐19 testing. Vault's users testing positive for COVID‐19 received an email informing them about the study and directing them to the study website with relevant contact information. Responding volunteers were screened by phone, and only adults who had received a positive clinical test within the last 7 days were eligible. At the beginning of the first 24‐h period, participants provided saliva for COVID‐19 PCR testing.
2.3. Field sampling
2.3.1. Air sampling locations
We sampled the air in two rooms (primary and secondary) in each residence. Participants (i.e., infected persons) chose the primary room as the space where they intended to spend most of their time and planned to isolate during the two sampling days. The secondary room was any other room of the participants' choice in the home, most often a living or dining room. Floor and room plans with dimensions (e.g., height, width, length) were created using Magicplan (Sensopia Inc., 2011–2018; Version 9.1.2; retrieved from http://itunes.apple.com); the data were used to determine the room volumes. Since our study was naturalistic, the participants were not given any specific instructions about isolating or any other behavioral changes. The words "residence" and "homes" are used interchangeably throughout the paper.
2.3.2. Survey data
All participants completed three interviews with a member of the sampling team: at 0 h, 24 h (Day 1), and 48 h (Day 2) into field sampling. At the first interview, the participant provided demographic information, the type of residence, HVAC system, symptoms, choice of primary and secondary rooms, number of days since COVID‐19 diagnosis and onset of symptoms, the total number of residents, and if other residents recently tested positive for COVID‐19 or reported any symptoms (Table 1 and Table SI.1). In the two follow‐up interviews, the number of hours the participant spent in the primary and secondary rooms for both sampling periods, door and window‐opening behaviors (Table SI.2), and symptoms for every 24 h (Table SI.3) were documented.
TABLE 1.
Demographic, residence types, and survey data of the study participants
| Categories | Frequency (n = 17) | Percentage (%) |
|---|---|---|
| Gender | ||
| Female | 9 | 52.9 |
| Male | 8 | 47.1 |
| Race | ||
| Asian | 4 | 23.5 |
| Black or African American | 3 | 17.6 |
| White | 7 | 41.2 |
| Prefer not to answer | 3 | 17.6 |
| Hispanic or Latino | ||
| Yes | 3 | 17.6 |
| No | 14 | 82.4 |
| Residence | ||
| A single‐family detached house | 10 | 58.8 |
| A townhouse or multi‐family house with 2 or 3 apartments | 5 | 29.4 |
| An apartment in a building with 4 or more apartments | 1 | 5.9 |
| Other | 1 | 5.9 |
| HVAC system (Heat ON, Sampling period: November to mid‐May) | ||
| Forced air | 11 | 64.7 |
| Hot water (radiator/baseboard) | 5 | 29.4 |
| Electric | 1 | 5.9 |
| Occupancy | ||
| Two or more residents | 14 | 82.4 |
| Participant only | 3 | 17.6 |
| Other occupants than the participant who recently tested positive or had symptoms of COVID−19 | ||
| Yes | 8 | 57.1 |
| No | 6 | 42.9 |
| Not applicable | 3 | na |
| Number of days since COVID−19 diagnosis (median = 3 days) | ||
| Within 3 days | 12 | 70.6 |
| From 4 to 7 days | 5 | 29.4 |
| Number of days since COVID−19 symptoms started (median = 5 days) | ||
| Within 5 days | 9 | 52.9 |
| From 6 to 14 days | 8 | 47.1 |
| Total | 17 | 100 |
Abbreviation: na, not applicable.
2.3.3. Air samplers
An IMPACT filter sampler (SKC, Inc., Eighty Four, PA) with the PM2.5 and PM10 impaction plates removed or a 47 mm open‐face filter holder (CH Technologies, Inc., Westwood, NJ) with a 2‐micron, 47 mm PTFE filter (SKC, Inc.) was used to collect total suspended particles (TSP) in the primary room. A 37 mm open‐face cassette sampler (SKC, Inc.) with a 1‐micron, 37‐mm PTFE filter (SKC, Inc.) was used to collect TSP in the secondary room. Each sampler was operated at 10 Lpm for 24 h using a Leland Legacy pump (SKC, Inc.), resulting in an air volume of 14.4 m3. When possible, samplers were placed at least 2 m (6 feet) away from headboards, vents, windows, and any obstructing furniture. The IMPACT sampler (SKC, Inc.) used in the primary room was carefully placed beyond the anticipated cough zone and oriented face‐up due to its design characteristics. The 47 mm open‐face filter holder (CH Technologies, Inc.) used in the primary room and the 37 mm open‐face cassette sampler (SKC, Inc.) used in the secondary room were placed face‐down to prevent the collection of large droplets. With sampling for 2 days in two rooms, four filter samples were collected for each residence. For a subset of six homes (IDs 12–17), TSP samples using a 47 mm open‐face filter holder (CH Technologies, Inc.) and size‐fractionated aerosol samples of >PM10, PM10‐2.5, and PM2.5 using the unmodified IMPACT sampler (SKC, Inc.) with 2‐micron, 47 mm PTFE filters (SKC, Inc.) were collected in the primary room. Sampler characteristics are provided in Table SI.4, and the data for size‐fractionated aerosol samples are described in Section SI.1 and Table SI.5. After sampling, all filters were refrigerated before transport to the laboratory. Previous research 49 showed no significant change in viral recovery with filter storage at 4°C for up to 1 week. Field and laboratory blanks were processed periodically during the study, accounting for 10% of the total samples.
2.3.4. Portable air cleaner
A portable air cleaner (PAC; Medify Air; MA‐40) was placed only in the primary room at about 1 m (three feet) away from any walls. This particular PAC model was chosen due to its use of HEPA filters, the ease of changing its filters, portability, and multiple fan speed settings. Its usage was noted at the end of each sampling period by reading a power meter (Baldr Electricity Power Energy Usage Meter). The PAC is advertised to achieve a CADR of 330 cfm at the highest fan setting (Mode 3). By measuring the exit air velocity of the PAC using an anemometer (TSI Inc.), we found a good agreement between the advertised CADR and our measurement of 348 cfm for Mode 3 (data not shown). However, Mode 1 was chosen to ensure a comfortable sound level for the participants. Using the NIOSH sound level meter app, we measured sound levels of 59.6 ± 11.0 dB at three feet away from the PAC (i.e., ~13.7 dB over background levels). At Mode 1, our measured CADR was 263 cfm (data not shown). Since HEPA filters have ~100% filtration for 0.3 µm particles, we can estimate the resulting air changes per hour (ACH) as:
| (1) |
Air sampling was also simultaneously performed in the secondary room to determine the extended effect of PAC. At the end of sampling, the PAC and a replacement HEPA filter were offered to the participants free of charge.
2.4. Laboratory procedures
2.4.1. Elution of SARS‐CoV‐2 aerosols from filter samples
Twenty four‐hour PTFE filter samples were analyzed by a commercial laboratory, Infinite BiologiX (IBX), using an FDA‐approved procedure that targeted three genomic regions of SARS‐CoV‐2. The elution protocol of virus‐associated particles from a PTFE filter was optimized previously using a SARS‐CoV‐2 surrogate virus, Human Coronavirus OC43. 49 Briefly, the filter sample was placed in a microcentrifuge tube with 1 ml sterile RNA‐free water (ThermoFisher Scientific) and vortexed three times for 10 s each. The eluate was then used for RNA extraction and analyses.
2.4.2. Detection of SARS‐CoV‐2 RNA by RT‐PCR
Virus RNA was extracted from the filters and saliva samples using the Chemagic 360 automated specimen processing system (PerkinElmer) with the Chemagic Viral DNA/RNA 300 Kit H96 (PerkinElmer) for 300 µl of the eluate, resulting in 50 µl of the extracted RNA product. Of this product, 5 µl of RNA sample was analyzed using the TaqPath COVID‐19 Combo Kit (ThermoFisher Scientific) and Applied Biosystems QuantStudio 5 Real‐Time PCR System (RT‐PCR; ThermoFisher Scientific) targeting the nucleocapsid (N) gene, spike (S) gene, and open reading frame (ORF) 1ab gene. MS2 phage RNA was added as an internal control to monitor the integrity of nucleic acid extraction and RT‐PCR reaction. The limit of detection (LoD) for all three SARS‐CoV‐2 targets was 200 copies/ml. Negative, positive, and no‐template controls were included with every RT‐PCR run. The cutoff value of Ct ≤ 37 for at least two SARS‐CoV‐2 specific genes and MS2 phage was considered positive for clinical saliva samples. 50 Recent studies 51 , 52 , 53 , 54 of environmental aerosol and surface samples used a Ct value of ≤40 for any SARS‐CoV‐2 specific gene as a criterion for detection. Based on these references, we used Ct ≤ 40 for any SARS‐CoV‐2 specific gene and MS2 phage as a criterion for detecting SARS‐CoV‐2 RNA in the aerosol samples. The samples were analyzed only using RT‐PCR, and the viability of the sampled aerosol particles was not determined.
To validate the identity of amplified PCR products, pairs of clinical (i.e., saliva) and aerosol samples from 3 randomly selected homes were sequenced with the respective amplicon primers at IBX LLC using next‐generation sequencing by the Illumina platform.
2.5. Data management, presentation, and analysis
Study data were collected and managed using REDCap electronic data capture tools hosted at Rutgers Robert Wood Johnson Medical School. 55 , 56 SPSS v27.0 (IBM) and OriginPro 2019 (OriginLab) were used to analyze and illustrate the data, respectively. Colorblind‐friendly palettes with patterns available in OriginPro were chosen for the figures. Average values (±1 SD) are reported in the results section. Associations between source strength (i.e., viral load in saliva sample on Day 1) and SARS‐CoV‐2 detection and estimated ACH and SARS‐CoV‐2 detection were analyzed after dichotomizing each at the 25th percentile value. The data on time since COVID‐19 diagnosis and symptoms onset were dichotomized by the median value. Due to the small sample size, independent nominal and ordinal variables were associated by Fisher's exact test with one‐sided significance and Gamma statistic (G), respectively. Gamma values <0.3, 0.3–0.6, >0.6 were considered weak, moderate, and strong associations, respectively (table 14.2 in Healey 57 ). Differences in detection between sampled homes (e.g., stratified by room type) were analyzed by independent samples t‐test. Groups with p‐values of less than 0.05 were considered significantly different. Given that small sample sizes minimized the power for statistical testing, large effects were also reported.
3. RESULTS
3.1. Number of participants
Participants were tested for COVID‐19 using a saliva test administered at the start of Day 1 (n = 23; Figure 1). Five participants tested negative on Day 1 and were excluded from the study. One home where equipment malfunctioned during sampling was also excluded from further analysis. Overall, seventeen participants completed the study. Two subjects were fully vaccinated (vaccines were just being deployed at the time of the study). Additionally, all participants had reported at least one symptom on Day 1 (discussed in more detail below).
FIGURE 1.
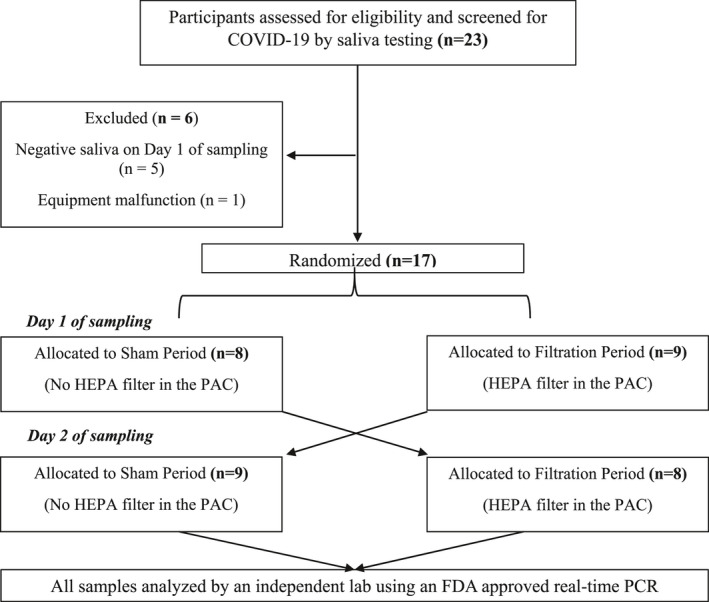
Flow diagram indicating the number of residents who participated in the single‐blind crossover randomized study; PAC, portable air cleaner
3.2. Demographics, residence types, survey data, and general sampling conditions
The majority of participants lived in single‐family detached homes (58.8%) and multi‐apartment townhouses (29.4%), while only two participants lived in apartment buildings (11.8%). Frequency and percentages of demographic data, residence types, and survey data are presented in Table 1, with detailed information in Tables SI.1 and SI.2. Fourteen residences (82.4%) were occupied by two or more people, of which 57.1% (8/14 participants) reported other household members to have recently tested positive or had symptoms of COVID‐19.
Sampling was performed during the late Fall, Winter, and early Spring in New Jersey, USA, with average outdoor temperatures of 46.3, 36.7, and 56.8, respectively. 58 Hence, the heating was generally ON, with 64.7% of residences having forced air, 29.4% hot water radiator/baseboards, and 5.9% electric heating system. 88.2% of participants reported having windows always closed throughout the two sampling days. On average, participants reported spending 15.4 h (±5.3) in the primary room and 6.7 h (±4.9) in the secondary room. Doors to the primary rooms were kept closed (usually or when occupied by the participant) by 64.7% (11/17) and 70.6% (12/17) of participants on Days 1 and 2 of sampling, respectively.
3.3. Saliva samples
Saliva samples from each participant were analyzed for N, ORF1ab, and S genes. Ct values are reported in Table 2. For the 17 participants, the average Ct values (N gene: 24.88 ± 5.71; ORF1ab gene: 24.61 ± 5.45; and S gene: 24.04 ± 4.07) and minimum Ct values (N gene: 16.41; ORF1ab gene: 16.66; and S gene: 16.68) were similar between the three genes. RT‐PCR ceased to detect the S gene primer sequence after March 2021 due to a decrease in diagnostic sensitivity from variant mutations, leading to false negatives when using commercial kits. 59 , 60 Similar to our study, Bal et al. 61 reported the S‐gene target failure in the three‐target RT‐PCR assay when using the TaqPath kit.
TABLE 2.
Ct values of MS2 phage and SARS‐CoV‐2 in saliva samples collected from the participants at the start of sampling
| ID | Internal control | Saliva samples—SARS‐CoV−2 | ||
|---|---|---|---|---|
| MS2 Phage | N gene | ORF1ab gene | S gene a | |
| 1 | 26.01 | 24.26 | 23.65 | 23.56 |
| 2 | 28.88 | 16.91 | 16.66 | 16.68 |
| 3 | 26.60 | 24.97 | 24.68 | 24.96 |
| 4 | 25.74 | 23.86 | 22.19 | 23.97 |
| 5 | 25.66 | 33.66 | 30.93 | ‐ |
| 6 | 27.40 | 25.50 | 26.34 | 26.83 |
| 7 | 25.80 | 27.47 | 27.65 | 27.38 |
| 8 | 31.39 | 26.35 | 27.93 | 27.37 |
| 9 | 25.36 | 17.67 | 17.27 | 16.98 |
| 10 | 24.61 | 28.09 | 27.55 | 27.69 |
| 11 | 26.63 | 25.05 | 24.95 | 25.00 |
| 12 | 34.60 | 16.41 | 16.94 | ‐ |
| 13 | 27.53 | 16.95 | 16.90 | ‐ |
| 14 | 26.51 | 21.56 | 21.36 | ‐ |
| 15 | 28.71 | 28.11 | 28.68 | ‐ |
| 16 | 26.29 | 35.97 | 34.98 | ‐ |
| 17 | 27.28 | 30.33 | 29.69 | ‐ |
The RT‐PCR ceased to detect the laboratory's targeted S gene primer sequence after March 2021 due to a decrease in diagnostic sensitivity caused by variant mutations when using commercial kits.
3.4. SARS‐CoV‐2 RNA in TSP samples—sham period
The detection of SARS‐CoV‐2 RNA in non‐fractionated aerosol samples is shown in Figure 2 and Table 3. Out of the 17 residences, aerosol samples for ID 8 in the primary room and IDs 1 and 2 in the secondary room were analyzed using alternate analytical protocols and thus excluded from this report. 43.8% of the aerosol samples (7/16 residences) in the primary room and 46.7% of the aerosol samples (7/15 residences) in the secondary room were positive for SARS‐CoV‐2 RNA during the "sham" period. Airborne viral RNA was detected in both primary and secondary rooms of five homes (IDs 4, 5, 9, 11, and 13; 35.7% out of 14 complete sets), out of which three (IDs 4, 9, and 13) reported closing their primary room doors during the study. Similar proportions of positive aerosol samples were detected in homes with central HVAC (primary room: 50%, 5/10 residences; secondary room: 44.4%, 4/9 residences) when compared to non‐central HVAC (primary room: 33.3%, 2/6 residences; secondary room: 50%, 3/6 residences). For a subset of six homes, both TSP and particle size‐fractionated aerosol samples of > PM10, PM10‐2.5, and PM2.5 were positive for SARS‐CoV‐2 RNA for only home ID 13 (Section SI.1 and Table SI.5).
FIGURE 2.

Ct values of SARS‐CoV‐2 genes detected in aerosol samples of seventeen residences: (A) primary room during the sham period with no HEPA filter in the PAC; (B) primary room during the filtration period with HEPA filter in the PAC; (C) secondary room during the sham period with no HEPA filter in the PAC; (D) secondary room during the filtration period with HEPA filter in the PAC. Black, orange, and blue bars represent the Ct values for N, ORF1ab, and S genes, respectively. NA (not applicable) refers to samples excluded due to technical malfunction; PAC, portable air cleaner
TABLE 3.
Characteristics of primary and secondary rooms where air sampling was performed as well as results of SARS‐CoV‐2 RNA detection in total suspended particles (TSP) samples for sham and filtration periods
| ID | Primary room | Secondary room | |||||||
|---|---|---|---|---|---|---|---|---|---|
| Description of the primary room | Room volume (ft3) | Estimated ACH based on primary room volume and CADR of PAC (h−1) | TSP aerosol sample: Sham period | TSP aerosol sample: Filtration period | Description of the secondary room | Room volume (ft3) | TSP aerosol sample: Sham period | TSP aerosol sample: Filtration period | |
| 1 | Living room | 1513 | 10.4 | nd | nd | Gym/Den | 1048 | ‐ | ‐ |
| 2 | Bedroom | 2004 | 7.9 | Detected | nd | Living room | 2815 | ‐ | ‐ |
| 3 | Bedroom | 1697 | 9.3 | nd | nd | Living room | 1844 | nd | nd |
| 4 | Bedroom | 1375 | 11.5 | Detected | Detected | Living room | 1804 | Detected | Detected |
| 5 | Living/dining room | 3593 | 4.4 | Detected | nd | Bedroom | 1058 | Detected | Detected |
| 6 | Bedroom | 2347 | 6.7 | Detected | nd | Living/dining room | 2678 | nd | nd |
| 7 | Living room | 1154 | 13.7 | nd | nd | Bedroom | 1127 | Detected | Detected |
| 8 | Bedroom | 1517 | 10.4 | ‐ | ‐ | Living room | 5081 | Detected | Detected |
| 9 | Bedroom | 1243 | 12.7 | Detected | Detected | Living room | 3695 | Detected | Detected |
| 10 | Bedroom | 1027 | 15.4 | nd | nd | Living room | 3253 | nd | nd |
| 11 | Living room | 2806 | 5.6 | Detected | Detected | Bedroom | 959 | Detected | Detected |
| 12 | Bedroom | 1677 | 9.4 | nd | nd | Living room | 2208 | nd | nd |
| 13 | Living room | 1204 | 13.1 | Detected | Detected | Bedroom | 1314 | Detected | nd |
| 14 | Living room | 2601 | 6.1 | nd | nd | Bedroom | 1595 | nd | nd |
| 15 | Bedroom | 1647 | 9.6 | nd | nd | Living room | 1540 | nd | nd |
| 16 | Living room | 2274 | 6.9 | nd | nd | Den | 4385 | nd | nd |
| 17 | Bedroom | 1520 | 10.4 | nd | nd | Living room | 2051 | nd | nd |
Detected" was assigned when at least one SARS‐CoV‐2 specific gene and internal control MS2 phage were amplified with a Ct value below 40. The air change per hour (ACH) was calculated based on the primary room volume and clean air delivery rate (CADR) of the used portable air cleaner (PAC).
Abbreviation: nd, not detected.
3.5. Variables potentially affecting detection of airborne viral RNA during the sham period
3.5.1. Number of days since COVID‐19 diagnosis
Only participants who tested positively for COVID‐19 either from saliva or nasal swab samples within the last seven days were included in the study. They were stratified into two groups by the median diagnosis time (50th percentile = 3 days; IQR = 2 days): detection "within three days" or "from four to seven days" to investigate whether the number of days since the positive COVID‐19 test affects SARS‐CoV‐2 RNA detection in the air. We found a similar proportion of positive aerosol samples between the two groups (45.5%, 5/11 residences vs. 40%, 2/5 residences), and the difference was not statistically different (p = 0.635).
3.5.2. Association between the detection of SARS‐CoV‐2 RNA in saliva and aerosol samples
We investigated the association between the source strength and the presence of SARS‐CoV‐2 RNA in the air. Clinical studies have shown an inverse correlation between higher SARS‐CoV‐2 Ct values and lower quantitative viral loads, for example, RNA copies/ml. 60 , 62 We used saliva Ct values to stratify homes into "Low Ct" (<25th percentile saliva) and "High Ct" (>25th percentile) saliva source strength groups (Figure 3). For aerosol samples collected in the primary room, 3/4 homes (75%) in the "Low Ct" group and 4/12 homes (33%) in the "High Ct" group tested positive for SARS‐CoV‐2 RNA. The association between detecting SARS‐CoV‐2 RNA in the air and Ct values in saliva samples was inverse and strong (G = −0.714; p = 0.070; Figure 3A).
FIGURE 3.

Association between SARS‐CoV‐2 RNA detection in saliva and aerosol (e.g., TSP) samples collected during the sham period (without HEPA filter in the portable air cleaner (PAC)). The clinical samples were stratified into two groups at the 25th percentile Ct values of N and ORF1ab genes: "Low Ct" which indicated higher viral load and "High Ct" which indicated lower viral load. (A) Aerosol samples collected in the primary room of 16 residences (saliva N gene 25th percentile Ct value 18.64; Saliva ORF1ab gene 25th percentile Ct value 18.29); (B) Aerosol samples collected in the secondary room of 15 residences (saliva N gene 25th percentile Ct value: 21.56; saliva ORF1ab gene 25th percentile Ct value: 21.36)
For the secondary room, 3 and 12 homes were stratified in the "Low Ct" and "High Ct" groups, respectively, with the 25th percentile Ct value in saliva for N gene = 21.56 and ORF1ab gene = 21.36 (Figure 3B). Similar to the primary room, an inverse yet moderate association was observed (G = −0.474; p = 0.219).
The purified PCR products of paired saliva and TSP aerosol samples during the "sham" period were analyzed for three homes. Interestingly, even though two pairs had insufficient viral loads in the aerosol samples to be sequenced, one pair (ID 4) had the same COVID‐19 lineage for both samples. This lineage, B.1.324, has been present in the United States since March 2020. 63 , 64 Though only one pair was positively sequenced, detecting the same SARS‐CoV‐2 variant in the individual's saliva and environmental aerosol samples provides some validation of the relationship between source and airborne SARS‐CoV‐2 RNA.
3.5.3. Association between symptoms reported by the participants and detection of SARS‐CoV‐2 RNA in aerosol samples
A detailed summary of symptoms for the three periods (i.e., at enrollment and during each treatment period) is presented in Table SI.3. The highlighted cells represent the sampling period with no filter in the PAC (i.e., "sham" period). Overall, the symptoms for each participant were comparable during both sampling periods. For example, out of the 17 participants, a similar number of participants reported coughing during the "sham" (n = 10) and "filtration" (n = 11) periods (p = 0.500). The associations between individual symptoms and detection of SARS‐CoV‐2 RNA in aerosol samples were evaluated for the primary room (the main isolation room), and the results are shown in Figure SI.1 and Section SI.2.
In addition to individual symptoms, we also grouped related symptoms and analyzed their association with the detection of SARS‐CoV‐2 RNA in aerosol samples (Figure 4). If participants reported at least one respiratory symptom (e.g., cough, sore throat, shortness of breath), 50% (6/12 homes) had positive aerosol samples for SARS‐CoV‐2 RNA compared to 25% (1/4 homes) where no respiratory symptoms were reported (p = 0.392; Figure 4A). When participants reported at least one symptom of fever, cough, or sore throat, there was also a positive but non‐significant association with SARS‐CoV‐2 RNA in aerosol samples (54.5% (6/11 homes) vs. 20% (1/5 homes); p = 0.231; Figure 4B).
FIGURE 4.

Association between SARS‐CoV‐2 RNA in aerosol (e.g., TSP) samples collected in the primary room during the sham period (without HEPA filter placed in the portable air cleaner (PAC)) and symptoms reported by the self‐isolating resident with COVID‐19. (A) Any one of the respiratory symptoms (e.g., cough/sore throat/shortness of breath) and (B) Any one of the following symptoms: fever or cough or sore throat. p‐values from Fisher's exact test are reported to associate the independent categorical variables
3.6. SARS‐CoV‐2 RNA in total aerosol samples—comparison between sham and filtration periods
SARS‐CoV‐2 Ct values for the positive aerosol samples in both rooms and sampling periods are shown in Figure 2. The Ct values ranged from 28.46 to 38.5 during the "sham" period (Figure 2A,C), whereas the values were slightly higher (i.e., less virus) during the "filtration" period (30.68–39.75; Figure 2B,D). In the primary room (with the PAC), 43.8% of the samples (7/16 residences) were positive for SARS‐CoV‐2 RNA during the "sham" period, whereas only 25% of the samples (4/16 residences) tested positive during the "filtration" period (Table 3; p = 0.229). All rooms positive during filtration were also positive during sham.
In the secondary room (without the PAC), a higher proportion of positive aerosol samples for SARS‐CoV‐2 RNA was detected during both periods compared to the primary room: 46.7% (7/15 residences) during the "sham" period and 40% (6/15 residences) during the "filtration" period (p = 0.500). Similar to the primary room, all six secondary rooms that were positive during the "filtration" period were also positive during the "sham" period.
3.7. Factors affecting the effectiveness of PACs
The effectiveness of PACs to remove airborne particles containing viruses is mainly dependent on room volumes, air mixing patterns, and clean air delivery rate (CADR). 65
Since rooms differed in their types and volumes, we analyzed the detection of airborne viral RNA as a function of those variables for both primary and secondary rooms:
3.7.1. Primary room
Bedrooms (n = 9) and living rooms (n = 7) had average volumes of 1615 ft3 (±395 ft3) and 2163 ft3 (±915 ft3), respectively. For the "sham" period, there was a comparable percentage of aerosol samples positive for SARS‐CoV‐2 RNA in bedrooms (44.4%; 4/9 homes) and living rooms (42.9%; 3/7 homes), despite the higher room volumes of the latter (p = 0.671). Participants in homes with positive aerosol samples for SARS‐CoV‐2 RNA also reported spending a similar number of hours in these two types of primary rooms (bedroom: 17.4 ± 7.4 h; living room: 15.3 ± 1.5 h; t‐test p = 0.313). During the "filtration" period, two of the four bedrooms with positive aerosol samples in the "sham" period had negative aerosol samples (50% decrease; p = 0.310), even though these two participants reported spending close to 24 h in the bedrooms. Similarly, one of the three living rooms, where viral RNA was detected in the air during the "sham" period, tested negative during the "filtration" period (33.3% decrease; p = 0.500), even though the participant occupied it for 14 h. These reductions of SARS‐CoV‐2 aerosols in the primary room during the "filtration" period, with the participant present, might be explained by the presence and operation of the PAC in the room. 66 , 67
3.7.2. Secondary room
Air samples were collected in bedrooms (n = 5) with an average volume of 1211 ft3 (±251) and other rooms such as living rooms, dining areas, gyms, and dens (n = 10) with an average volume of 2854 ft3 (±1207). For the "sham" period, participants, whose secondary rooms had aerosol samples positive for SARS‐CoV‐2 RNA, spent on average 7.8 ± 1.0 h in bedrooms and 6.7 ± 6.4 h in other larger spaces (t‐test p = 0.399). A considerably higher percentage of aerosol samples were positive in bedrooms (80%; 4/5 homes) than in the other rooms (30%; 3/10 homes; p = 0.100). Lower aerosol sample positivity for SARS‐CoV‐2 RNA in spaces like dens and living rooms could be due to the dilution of SARS‐CoV‐2 aerosols in large‐volume spaces. 43 For the "filtration" period, one of the four bedrooms with positive aerosol samples in the "sham" period tested negative (25% decrease; p = 0.500); this particular participant spent 8 h in the bedroom. However, the effect of PAC was not observed for the other rooms (no reduction in the number of positive aerosol samples; n = 3; p = 0.686).
The ACH (h−1) values for primary rooms were calculated using the measured room volumes and our PAC's CADR at Mode 1 using Equation 1, and the results are shown in Table 3. ACHs ranged from 4.4 to 15.4 h−1 with an average of 9.6 h−1 (±3.1). For comparison, an ACH of 5–6 h−1 is recommended for classrooms and student health facilities, 68 and levels above 6 are frequently recommended for patient‐care areas, examination rooms, and food preparation centers. 69 Further details on ACH are included in Figure SI.2 and Section SI.3.
4. DISCUSSION
This project is the first blinded crossover randomized study to investigate whether air cleaners effectively reduce SARS‐CoV‐2 transmission in homes under real‐world conditions, that is, without any behavior changes in residents. Our initial findings show that the rate of positive aerosol samples in homes of infected patients was reduced when comparing "filtration" to "sham" periods in the primary isolation room (4/16 residences vs. 7/16 residences, p = 0.229) and in a secondary room (6/15 residences vs. 7/15 residences, p = 0.500). Two homes (IDs 10 and 12) were fully vaccinated; however, none of their aerosol samples were positive for SARS‐CoV‐2 RNA. The potential contribution of SARS‐CoV‐2 aerosols from other occupants cannot be definitively determined since saliva samples were not collected from them. Given the multiple important variables that we did not seek to control in this naturalistic study, as well as the small sample size, we had limited statistical power to detect differences between "filtration" and "sham" periods. We verified that SARS‐CoV‐2 RNA in aerosols is detectable in a substantial proportion of homes with infected residents, consistent with concerns that aerosol transmission may be important in secondary infection in homes. As predicted, room volume appeared to be an important variable in analyzing the effectiveness of the PAC. Virus‐negative TSP samples were more frequent in self‐isolation rooms with higher ACH.
Scientific and public interest in using PACs with HEPA filters in residences has reemerged over the last decade to reduce combustion‐derived 40 and indoor‐generated air pollutants (e.g., from smoking, cooking, and cleaning) 70 , 71 , 72 as a means to decrease cardiorespiratory diseases, 73 , 74 and asthma in adults and children. 75 , 76 During the COVID‐19 pandemic, PACs have been widely advertised and used to reduce exposure to viral aerosols, albeit without extensive data to support these claims. 30 , 67 Since PACs are effective in removing airborne PM, by extension, they should be effective in removing viral aerosols and PM‐associated viral particles, thereby minimizing the risk of airborne virus transmission in a cost‐effective way. They could at least partially address COVD‐19 disparities in disadvantaged communities, where personal space is at a premium, a "sick room" might not be an option, window use is often constrained due to security concerns or poor outdoor air quality, and central HVAC with filtration is frequently absent. However, the effectiveness of filtration for reduction of exposure to aerosols associated with SARS‐CoV‐2 RNA, or actual transmission of COVID‐19 infection, has not been evaluated in rigorous controlled trials.
By reducing exposure to generic fine particles (PM2.5) that have been associated with worse COVID‐19 outcomes in epidemiological studies, the use of PACs may have benefits beyond a direct reduction in SARS‐CoV‐2 aerosol concentrations. A cross‐sectional study of US national databases investigated the relationship between long‐term average exposure of PM2.5 and COVID‐19 and reported an 8% increase in COVID‐19 mortality per 1 µg m−3 increase of PM2.5 (95% CI: 2%–15%). 77 Setti et al. 78 also detected SARS‐CoV‐2 RNA in outdoor PM samples in areas with high PM and COVID‐19 outbreaks. While the reasons for interactive effects between PM and SARS‐CoV‐2 are unknown (perhaps an effect of facilitated virus delivery to the deep lung or interaction with established adverse effects of PM, that is, inflammation, oxidative stress, increased coagulation), PACs may be especially beneficial in areas with higher levels of PM2.5 given the interplay of COVID‐19 and air pollution. 79
A recent scripted study by Rodriguez et al. 30 sampled 1 m3 of air volume in residences and reported an 80% reduction in SARS‐CoV‐2 RNA detection using PACs. In comparison, our study sampled 14.4 m3 of air volume and did not restrict sampling based on background indoor PM levels or manipulate participants’ behavior. Notably, our PAC was operated at the lowest setting (Mode 1; estimated ACH = 9.6 ± 3.2 h−1) to maintain a low noise level. The estimated ACH would have increased to an average of 12.7 h−1 (±4.1) if Mode 3 (highest) was used instead. At the chosen Mode 1 setting, the acceptability of PAC use was 100%. The participants stressed that the low noise level was a major deciding factor to adopting the PAC, and most intended to continue using it even after the study ended.
We collected 14.4 m3 of air volume over 24 h using PTFE filters, which offer the advantage of long‐term sampling without the need to replace evaporated sampling liquid in impingers or worry about damage to brittle gelatin filters. As such, this study is one of the few projects that detected SARS‐CoV‐2 RNA in residences using PTFE filters with Ct values ranging from 28.46 to 39.75. Ang et al. 80 reported similar SARS‐CoV‐2 Ct values for aerosol samples collected in hospital quarantine wards.
A variety of other air sampling methods, techniques, and air sample volumes have been successfully employed to detect airborne SARS‐CoV‐2 viral RNA in aerosols. Among the frequently utilized samplers are NIOSH BC 251 bioaerosol samplers with centrifuge tubes and filters operated at 3.5 Lpm, 22 , 81 , 82 Viable Virus Aerosol Sampler (VIVAS) with water vapor condensation to grow the viral particles and operated at 6.5–8 Lpm, 81 , 83 , 84 and impactors used at 5 Lpm with gelatin filters 5 and at 10 Lpm with PTFE filters. 24 High flowrate samplers include Sartorius Airport MD8 air sampler operated at 50 Lpm with gelatin filters, 6 , 30 liquid impinger BIO‐Capturer‐6 operated at 80 Lpm, 85 and SASS Wetted Wall Cyclone Sampler operated at 150–300 Lpm. 51 , 80 Another recent study reported negative air samples for SARS‐CoV‐2 in two residential rooms when sampled with a similar PTFE filter but found positive samples with VIVAS and NIOSH samplers. 81 Differences in elution protocols between studies could have contributed to different results.
Other studies conducted in residential settings with air samples positive for SARS‐CoV‐2 had a similar Ct range with at least one identical RT‐PCR target gene as our study. For seven residences with infected people, Rodriguez et al. reported positive air samples for all seven samples collected using gelatin filters (MD8 Airport Portable Air Collector, Sartorius) at 50 Lpm for 20 min (1 m3 of air). Their Ct values ranged from 30.3 to 38.6 for N, S, and RdPR primers. 30 Similarly, among eight residences, Robie et al. 29 reported positive air samples for 19.0% of 42 NIOSH Samplers (3.5 Lpm for 2 h, or 0.42 m3) and 20.0% of 25 BioSamplers (SKC, Inc.; 12.5 Lpm for 2 h, or 1.5 m3) with Ct values ranging from 31.8 to 39.9 for N and S primers. Döhla et al. reported positive fomite and wastewater samples; however, all 15 of their air samples collected using cyclone samplers (Coriolis μ Air Sampler, Bertin Technologies) at 300 Lpm for 10 min (3 m3) and analyzed by E and RdRP primers, were negative.
We also report SARS‐CoV‐2 RNA in different PM fractions collected in one residence's primary (self‐isolation) room, indicating the presence of SARS‐CoV‐2 RNA in small and large aerosol particles. Chia et al. and Shankar et al. reported detection only in particles with aerodynamic diameter 1–4 µm and >4 µm using the NIOSH sampler and hypothesized that low extraction efficiency from PTFE filter for particles <1 µm resulted in no detection. 22 , 81 On the contrary, similar to our study, Santarpia et al. and Liu et al. reported detection of viral RNA in all aerosol size fractions using the NIOSH BC 251 sampler (gelatin filter for <1 µm and centrifuge tubes for 1–4 µm and >4.1 µm stages). 82 Also using gelatin filters, Liu et al. 5 reported SARS‐CoV‐2 RNA in particles larger and smaller than PM2.5.
In addition to the type of samplers, due to the lack of standardized and uniform protocols for airborne virus sampling and analysis, Ct thresholds for positive samples vary considerably among studies. For environmental air and swab samples, several studies stated Ct values 38–41 for any SARS‐CoV‐2 specific gene as the detection threshold. 6 , 22 , 30 , 51 , 52 , 54 , 80 , 86 , 87 In comparison, our clinical samples analyzed by IBX LLC had a more stringent requirement: at least two SARS‐CoV‐2 specific genes and MS2 phage to be detected with Ct <37. 50 With this more conservative clinical requirement, 37.5% of our samples (6/16 residences) in the primary room and 33.3% (5/15 residences) in the secondary room would still be positive for SARS‐CoV‐2 RNA during the "sham" period. Moreover, some studies do not report a threshold detection value as long as amplification is observed in at least one assay. 22 , 60 The existing differences in sample types, assays, and analysis platforms stress the need to develop a universal sampling and analysis framework when investigating viral aerosols.
To the best of our knowledge, this is the first study to sequence a clinical saliva sample from a participant and then detect the same SARS‐CoV‐2 lineage in the aerosol sample collected in the self‐isolation room of that participant. Other studies have sequenced environmental aerosol 83 , 84 and surface 88 , 89 samples but have not linked their results to clinical samples from the source patient. The only exception we found was a study by Kotwa et al. 90 that reported similar SARS‐CoV‐2 genomes between nasopharyngeal and environmental surface samples collected in rooms of patients hospitalized with COVID‐19. The same lineage in the clinical and aerosol sample pair further strengthens the thesis that aerosols play a key role in SARS‐CoV‐2 transmission.
Our findings on Ct values could imply a probability of detecting SARS‐CoV‐2 RNA in the air. For participants with a Ct value >22 in their saliva samples, we observed a strong negative association (G = −0.714) with detection of SARS‐CoV‐2 RNA in aerosol samples (p = 0.070). This association of negative aerosol samples and lower viral loads in saliva has not been previously reported. A retrospective cross‐sectional study by Bullard et al. 91 reported negative SARS‐CoV‐2 cultures for clinical swab samples with a Ct interquartile range of 22–33. Tom and Mina 92 proposed a Ct cutoff of >34 in clinical samples to likely not cause transmission. These Ct values were similar to the saliva Ct values of the "high Ct" group for our study (Ct > 22). Other studies have also attempted to relate the detection of SARS‐CoV‐2 in environmental samples with the shedding of the virus. Similar to our study, Cheng et al. positively associated clinical samples containing viral loads above 1000 copies/ml with surface contamination in patients' surroundings in airborne infection isolation rooms. 93 Thus, this growing body of evidence suggests that Ct values as a surrogate for viral load could be useful as a screening tool for detecting airborne SARS‐CoV‐2.
Associations between common symptoms of COVID‐19 and viral RNA in aerosol samples can help inform our understanding of transmission within residences. Studies have extensively reported COVID‐19 symptoms to provide prognostic information 94 , 95 , 96 , 97 but have not connected them to SARS‐CoV‐2 RNA in aerosol samples. Respiratory droplets and aerosols can be generated during coughing, sneezing, talking, singing, and exercising. 10 , 11 All 17 participants who completed our study were symptomatic with one or more common COVID‐19 symptoms. We saw a positive, although not statistically significant, association between respiratory and gastrointestinal symptoms reported by the participants and detection of SARS‐CoV‐2 RNA in aerosol samples in the primary room.
We acknowledge that our study has methodological limitations. Firstly, due to the limited sample size associated with waning infection rates in spring 2021 and the expected large variation from factors affecting actual and detected SARS‐CoV‐2 aerosols in homes, our study lacked statistical power to assess reductions in airborne SARS‐CoV‐2 detection that may have clinical and public health significance. We identified several sources of variability due to real‐world conditions, including stage of infection, possible virus source contributions from other infected residents, and resident behavior (opening windows and doors, time spent in each room, etc.). In addition, while the HEPA filter facilitates the removal of indoor PM in the "filtration" period, the increased air movement caused by the air cleaner during the "sham" period might also reduce indoor PM, especially its ultrafine fraction due to increased particle diffusion. Our study also lacked a washout period. These limitations could conceivably have caused random misclassification of exposure, thus reducing the apparent effectiveness between the "filtration" and "sham" periods. Nonetheless, the study demonstrated the presence of SARS‐CoV‐2 RNA in the air at infected persons' homes and explored the use of air cleaners to reduce SARS‐CoV‐2 exposure. Additional studies in such non‐occupational environments could further confirm our findings. Secondly, the movement of SARS‐CoV‐2 aerosols from the primary room to secondary rooms, although suggested, could not be unequivocally established since infected participants, and possibly other infected residents, had unrestricted access to secondary rooms. However, our unscripted study facilitates understanding the realistic behavior of household members during the self‐isolation period, including cases where other household members may have also been COVID‐19 positive. Thirdly, due to limited funding, saliva samples were collected on the first day only, and the number of virus copies in our samples was not determined. Viral loads of participants were assumed to be similar between the two sampling days. Saliva samples from other household members were not collected; hence, we can only speculate on the contribution of SARS‐CoV‐2 aerosols from other symptomatic and asymptomatic household members. Lastly, RT‐PCR has high specificity but cannot determine the infectivity of the sampled aerosol particles. However, culturing requires specialized samplers, transportation, and laboratory safety requirements that exceeded the scope and resources of our study.
Despite these limitations, our study demonstrates the presence of SARS‐CoV‐2 RNA in the air of COVID‐19 patients' residences, including in secondary rooms. It also shows that the presence of airborne viral RNA might be reduced by using PACs. Despite the study's limited sample size, its findings can begin to inform public health measures to minimize COVID‐19 transmission in residences and support the need for robust trials of PACs.
5. CONCLUSIONS
This is the first blinded randomized intervention study using PACs to suggest the reduction of risk of airborne transmission of COVID‐19 in residences without any experimental manipulation of residents' behavior or activity. Our findings reflect a real‐world scenario where the acceptability and the usage of a candidate intervention were high among the participants. It provides a basis for additional studies designed to investigate the control of viral aerosols in residences, including in multiple rooms. SARS‐CoV‐2 RNA was detected in aerosols in residences using long‐term filter sampling, and there were some associations between this detection and commonly reported COVID‐19 symptoms and salivary viral load. We also found some evidence of reduction in SARS‐CoV‐2 aerosol exposure using PACs. The same virus lineage in the clinical and aerosol sample pair supports the now widely held belief that aerosols play a key role in SARS‐CoV‐2 transmission and further stresses the need for infected persons to isolate. The use of air cleaners to reduce SARS‐CoV‐2 exposure should be considered for future guidance on how to care for COVID‐19 patients in residential and community‐based indoor environments, especially in situations of limited space and resources.
CONFLICT OF INTEREST
No conflict of interest declared.
AUTHOR CONTRIBUTIONS
Nirmala T. Myers involved in conceptualization, formal analysis, visualization, writing–original draft, and writing–review and editing. Robert J. Laumbach involved in conceptualization, methodology, formal analysis, funding acquisition, supervision, and writing–review and editing. Kathleen G. Black involved in conceptualization, data curation, methodology, formal analysis, funding acquisition, investigation, project administration, supervision, validation, and writing–review and editing. Pamela Ohman‐Strickland involved in formal analysis, supervision, validation, and writing–review and editing. Shahnaz Alimokhtari, Alicia Legard, Adriana De Resende, and Leonardo Calderón involved in data curation, investigation, and project administration. Frederic T. Lu involved in formal analysis, and writing–review and editing. Gediminas Mainelis and Howard M. Kipen involved in conceptualization, methodology, formal analysis, funding acquisition, supervision, and writing–review and editing.
Supporting information
Appendix S1
ACKNOWLEDGMENTS
Support was provided by a supplement to NIEHS P30 Center ES05022 and NIH/CATS (UL1TR003017). Dr. Nirmala T. Myers was supported by NIEHS Training Grant in Exposure Science (1T32ES019854). Dr. Frederic T. Lu was supported by NIOSH ERC (T42OH008422). We thank our referring physicians and Vault Health for participant referrals. We sincerely thank all the participants who were screened and allowed us into their homes.
Myers NT, Laumbach RJ, Black KG, et al. Portable air cleaners and residential exposure to SARS‐CoV‐2 aerosols: A real‐world study. Indoor Air. 2022;32:e13029. doi: 10.1111/ina.13029
DATA AVAILABILITY STATEMENT
Study data are available from the corresponding author upon request.
REFERENCES
- 1. CDC . Coronavirus Disease 2019 (COVID‐19). Centers for Disease Control and Prevention. February 11, 2020. Accessed December 8, 2021. https://www.cdc.gov/coronavirus/2019‐ncov/variants/delta‐variant.html
- 2. WHO . WHO Coronavirus (COVID‐19) Dashboard. Accessed January 9, 2021. https://covid19.who.int
- 3. WHO . United States of America: WHO Coronavirus Disease (COVID‐19) dashboard with vaccination data. Accessed January 9, 2022. https://covid19.who.int
- 4. CDC . COVID Data Tracker for United States. Centers for Disease Control and Prevention. March 28, 2020. Accessed December 8, 2021. https://covid.cdc.gov/covid‐data‐tracker
- 5. Liu Y, Ning Z, Chen Y, et al. Aerodynamic analysis of SARS‐CoV‐2 in two Wuhan hospitals. Nature. 2020;582:557‐560. [DOI] [PubMed] [Google Scholar]
- 6. Santarpia JL, Rivera DN, Herrera VL, et al. Aerosol and surface contamination of SARS‐CoV‐2 observed in quarantine and isolation care. Sci Rep. 2020;10:12732. [DOI] [PMC free article] [PubMed] [Google Scholar]
- 7. Zhou J, Otter JA, Price JR, et al. Investigating Severe Acute Respiratory Syndrome Coronavirus 2 (SARS‐CoV‐2) surface and air contamination in an acute healthcare setting during the peak of the Coronavirus disease 2019 (COVID‐19) pandemic in London. Clin Infect Dis. 2021;73:e1870‐e1877. [DOI] [PMC free article] [PubMed] [Google Scholar]
- 8. Han ZY, Weng WG, Huang QY. Characterizations of particle size distribution of the droplets exhaled by sneeze. J R Soc Interface. 2013;10:20130560. [DOI] [PMC free article] [PubMed] [Google Scholar]
- 9. Anand S, Mayya YS. Size distribution of virus laden droplets from expiratory ejecta of infected subjects. Sci Rep. 2020;10:21174. [DOI] [PMC free article] [PubMed] [Google Scholar]
- 10. Jarvis MC. Aerosol transmission of SARS‐CoV‐2: physical principles and implications. Front Public Health. 2020;8:813. [DOI] [PMC free article] [PubMed] [Google Scholar]
- 11. Wang CC, Prather KA, Sznitman J, et al. Airborne transmission of respiratory viruses. Science. 2021;373(6558):eabd9149. [DOI] [PMC free article] [PubMed] [Google Scholar]
- 12. Milton DK, Fabian MP, Cowling BJ, Grantham ML, McDevitt JJ. Influenza virus aerosols in human exhaled breath: particle size, culturability, and effect of surgical masks. PLoS Pathog. 2013;9:e1003205. [DOI] [PMC free article] [PubMed] [Google Scholar]
- 13. Bourouiba L. Turbulent gas clouds and respiratory pathogen emissions: potential implications for reducing transmission of COVID‐19. JAMA. 2020;323:1837‐1838. [DOI] [PubMed] [Google Scholar]
- 14. Nazaroff WW. Indoor aerosol science aspects of SARS‐CoV‐2 transmission. Indoor Air. 2022;32(1):e12970. doi: 10.1111/ina.12970. [DOI] [PubMed] [Google Scholar]
- 15. Morawska L, Tang JW, Bahnfleth W, et al. How can airborne transmission of COVID‐19 indoors be minimised? Environ Int. 2020;142:105832. [DOI] [PMC free article] [PubMed] [Google Scholar]
- 16. Li Y, Cheng P, Jia W. Poor ventilation worsens short‐range airborne transmission of respiratory infection. Indoor Air. 2022;32(1):e12946. 10.1111/ina.12946 [DOI] [PMC free article] [PubMed] [Google Scholar]
- 17. CDC . Transmission of SARS‐CoV‐2 from inhalation of virus in the air farther than six feet from an infectious source can occur. Centers for Disease Control and Prevention. February 11, 2020. Accessed January 5, 2022. https://www.cdc.gov/coronavirus/2019‐ncov/science/science‐briefs/sars‐cov‐2‐transmission.html
- 18. Shen Y, Li C, Dong H, et al. Community outbreak investigation of SARS‐CoV‐2 transmission among bus riders in Eastern China. JAMA Intern Med. 2020;180:1665‐1671. [DOI] [PMC free article] [PubMed] [Google Scholar]
- 19. Hamner L. High SARS‐CoV‐2 attack rate following exposure at a choir practice — Skagit County, Washington, March 2020. MMWR Morb Mortal Wkly Rep. 2020;69(19):606‐610. [DOI] [PubMed] [Google Scholar]
- 20. Lu J, Gu J, Li K, et al. COVID‐19 outbreak associated with air conditioning in Restaurant, Guangzhou, China, 2020. Emerg Infect Dis. 2020;26(11):2789‐2791. 10.3201/eid2611.203774 [DOI] [PMC free article] [PubMed] [Google Scholar]
- 21. Katelaris AL, Wells J, Clark P, et al. Epidemiologic evidence for airborne transmission of SARS‐CoV‐2 during Church Singing, Australia, 2020. Emerg Infect Dis. 2021;27:1677‐1680. [DOI] [PMC free article] [PubMed] [Google Scholar]
- 22. Chia PY, Coleman KK, Tan YK, et al. Detection of air and surface contamination by SARS‐CoV‐2 in hospital rooms of infected patients. Nat Commun. 2020;11:2800. [DOI] [PMC free article] [PubMed] [Google Scholar]
- 23. Ong SWX, Tan YK, Chia PY, et al. Air, surface environmental, and personal protective equipment contamination by severe acute respiratory syndrome Coronavirus 2 (SARS‐CoV‐2) from a symptomatic patient. JAMA. 2020;323:1610‐1612. [DOI] [PMC free article] [PubMed] [Google Scholar]
- 24. Laumbach RJ, Mainelis G, Black KG, et al. Presence of SARS‐CoV‐2 aerosol in residences of adults with COVID‐19. Ann Am Thorac Soc. 2022;19(2):338‐341. 10.1513/AnnalsATS.202107-847RL [DOI] [PMC free article] [PubMed] [Google Scholar]
- 25. Hadei M, Mohebbi SR, Hopke PK, et al. Presence of SARS‐CoV‐2 in the air of public places and transportation. Atmos Pollut Res. 2021;12(3):302‐306. [DOI] [PMC free article] [PubMed] [Google Scholar]
- 26. Chirizzi D, Conte M, Feltracco M, et al. SARS‐CoV‐2 concentrations and virus‐laden aerosol size distributions in outdoor air in north and south of Italy. Environ Int. 2021;146:106255. [DOI] [PMC free article] [PubMed] [Google Scholar]
- 27. Dinoi A, Feltracco M, Chirizzi D, et al. A review on measurements of SARS‐CoV‐2 genetic material in air in outdoor and indoor environments: Implication for airborne transmission. Sci Total Environ. 2021;809:151137. [DOI] [PMC free article] [PubMed] [Google Scholar]
- 28. Döhla M, Wilbring G, Schulte B, et al. SARS‐CoV‐2 in environmental samples of quarantined households; 2020:2020.05.28.20114041. June 2, 2020. Accessed December 12, 2021. https://www.medrxiv.org/content/ 10.1101/2020.05.28.20114041v1 [DOI] [PMC free article] [PubMed]
- 29. Robie ER, Abdelgadir A, Binder RA, Gray GC. Live SARS‐CoV‐2 is difficult to detect in patient aerosols. Influenza Other Respir Viruses. 2021;15:554‐557. [DOI] [PMC free article] [PubMed] [Google Scholar]
- 30. Rodríguez M, Palop ML, Seseña S, Rodríguez A. Are the portable air cleaners (PAC) really effective to terminate airborne SARS‐CoV‐2? Sci Total Environ. 2021;785:147300. [DOI] [PMC free article] [PubMed] [Google Scholar]
- 31. CDC . CDC updates and shortens recommended isolation and quarantine period for general population. CDC Updates and Shortens Recommended Isolation and Quarantine Period for General Population. January 1, 2016. Accessed December 29, 2021, https://www.CDC.gov/media/releases/2021/s1227‐isolation‐quarantine‐guidance.html
- 32. Lewis NM, Chu VT, Ye D, et al. Household transmission of severe acute respiratory Syndrome Coronavirus‐2 in the United States. Clin Infect Dis. 2021;73:1805‐1813. [DOI] [PMC free article] [PubMed] [Google Scholar]
- 33. Metlay JP, Haas JS, Soltoff AE, Armstrong KA. Household transmission of SARS‐CoV‐2. JAMA Network Open. 2021;4:e210304. [DOI] [PMC free article] [PubMed] [Google Scholar]
- 34. Chu VT, Yousaf AR, Chang K, et al. Household transmission of SARS‐CoV‐2 from children and adolescents. N Engl J Med. 2021;385:954‐956. [DOI] [PMC free article] [PubMed] [Google Scholar]
- 35. Fermo P, Comite V, Falciola L, Guglielmi V, Miani A. Efficiency of an air cleaner device in reducing aerosol particulate matter (PM) in indoor environments. Int J Environ Res Public Health. 2020;17:18. [DOI] [PMC free article] [PubMed] [Google Scholar]
- 36. Cai J, Yu W, Li B, et al. Particle removal efficiency of a household portable air cleaner in real‐world residences: a single‐blind crossover field study. Energy Build. 2019;203:109464. [Google Scholar]
- 37. Peng Z, Rojas ALP, Kropff E, et al. Practical indicators for risk of airborne transmission in shared indoor environments and their application to COVID‐19 outbreaks. Environ Sci Technol. 2022;56(2):1125‐1137. [DOI] [PMC free article] [PubMed] [Google Scholar]
- 38. ASHRAE . Filtration and air cleaning summary. Accessed December 8, 2021. https://www.ASHRAE.org/technical‐resources/filtration‐disinfection
- 39. Sharma R, Balasubramanian R. Evaluation of the effectiveness of a portable air cleaner in mitigating indoor human exposure to cooking‐derived airborne particles. Environ Res. 2020;183:109192. [DOI] [PubMed] [Google Scholar]
- 40. Cox J, Isiugo K, Ryan P, et al. Effectiveness of a portable air cleaner in removing aerosol particles in homes close to highways. Indoor Air. 2018;28:818‐827. [DOI] [PMC free article] [PubMed] [Google Scholar]
- 41. Barn P, Larson T, Noullett M, Kennedy S, Copes R, Brauer M. Infiltration of forest fire and residential wood smoke: an evaluation of air cleaner effectiveness. J Expo Sci Environ Epidemiol. 2008;18:503‐511. [DOI] [PubMed] [Google Scholar]
- 42. Xiang J, Huang C‐H, Shirai J, et al. Field measurements of PM2.5 infiltration factor and portable air cleaner effectiveness during wildfire episodes in US residences. Sci Total Environ. 2021;773:145642. [DOI] [PMC free article] [PubMed] [Google Scholar]
- 43. Allen JG, Ibrahim AM. Indoor air changes and potential implications for SARS‐CoV‐2 transmission. JAMA. 2021;325:2112‐2113. [DOI] [PubMed] [Google Scholar]
- 44. Reichman R, Shirazi E, Colliver DG, Pennell KG. US residential building air exchange rates: new perspectives to improve decision making at vapor intrusion sites. Environ Sci Processes Impacts. 2017;19:87‐100. [DOI] [PMC free article] [PubMed] [Google Scholar]
- 45. Omicron Variant CDC. What you need to know. Centers for Disease Control and Prevention. December 8, 2021. Accessed December 8, 2021. https://www.cdc.gov/coronavirus/2019‐ncov/variants/omicron‐variant.html
- 46. Iati M, Fritz A, Hawkins D, Suliman A, Villegas P. What you need to know about the coronavirus variants. Washington Post. November 29, 2021. Accessed December 1, 2021. https://www.washingtonpost.com/health/2021/11/29/covid‐variants/
- 47. WHO . Tracking SARS‐CoV‐2 variants. Accessed December 1, 2021. https://www.WHO.int/emergencies/emergency‐health‐kits/trauma‐emergency‐surgery‐kit‐who‐tesk‐2019/tracking‐SARS‐CoV‐2‐variants
- 48. NJDEP . COVID‐19 variant surveillance report week ending June 5, 2021 (MMWR week 22). June 5, 2021. Accessed December 1, 2021. https://www.nj.gov/health/cd/documents/topics/NCOV/COVID_19_Variant_Report_Week_2021_22_.pdf
- 49. Myers NT, Han TT, Li M‐L, Brewer G, Harper M, Mainelis G. Impact of sampling and storage stress on the recovery of airborne SARS‐CoV‐2 virus surrogate captured by filtration. J Occup Environ Hyg. 2021;18:461‐475. [DOI] [PMC free article] [PubMed] [Google Scholar]
- 50. Rutgers Clinical Genomics Laboratory . Accelerated Emergency Use Authorization (EUA) Summary SARS‐CoV‐2 Assay. Rutgers Clinical Genomics Laboratory TaqPath SARS‐CoV‐2 Assay EUA Summary. 2020.
- 51. Guo Z‐D, Wang Z‐Y, Zhang S‐F, et al. Aerosol and surface distribution of Severe Acute Respiratory Syndrome Coronavirus 2 in Hospital Wards, Wuhan, China, 2020. Emerg Infect Dis. 2020;26(7):1583‐1591. [DOI] [PMC free article] [PubMed] [Google Scholar]
- 52. Vicente VA, Lustosa BPR, Grisolia ME, et al. Environmental detection of SARS‐CoV‐2 virus RNA in health facilities in Brazil and a Systematic review on contamination sources. Int J Environ Res Public Health. 2021;18:3824. [DOI] [PMC free article] [PubMed] [Google Scholar]
- 53. Dargahi A, Jeddi F, Vosoughi M, et al. Investigation of SARS CoV‐2 virus in environmental surface. Environ Res. 2021;195:110765. [DOI] [PMC free article] [PubMed] [Google Scholar]
- 54. Wong JCC, Hapuarachchi HC, Arivalan S, et al. Environmental contamination of SARS‐CoV‐2 in a non‐healthcare setting. Int J Environ Res Public Health. 2020;18:E117. [DOI] [PMC free article] [PubMed] [Google Scholar]
- 55. Harris PA, Taylor R, Thielke R, Payne J, Gonzalez N, Conde JG. Research electronic data capture (REDCap)–a metadata‐driven methodology and workflow process for providing translational research informatics support. J Biomed Inform. 2009;42:377‐381. [DOI] [PMC free article] [PubMed] [Google Scholar]
- 56. Harris PA, Taylor R, Minor BL, et al. The REDCap consortium: building an international community of software platform partners. J Biomed Inform. 2019;95:103208. [DOI] [PMC free article] [PubMed] [Google Scholar]
- 57. Healey JF. Statistics: A Tool for Social Research, 8th ed. Cengage Learning; 2011. [Google Scholar]
- 58. NCEI . ONJSC: Rutgers: University: Historical monthly summary tables. Accessed December 2, 2021. https://climate.rutgers.edu/stateclim_v1/nclimdiv/index.php?stn=NJ00&elem=avgt
- 59. Khateeb J, Li Y, Zhang H. Emerging SARS‐CoV‐2 variants of concern and potential intervention approaches. Crit Care. 2021;25:244. [DOI] [PMC free article] [PubMed] [Google Scholar]
- 60. Walker AS, Pritchard E, House T, et al. Ct threshold values, a proxy for viral load in community SARS‐CoV‐2 cases, demonstrate wide variation across populations and over time. Teare MD, Davenport MP, eds. eLife. 2021;10:e64683. [DOI] [PMC free article] [PubMed] [Google Scholar]
- 61. Bal A, Destras G, Gaymard A, et al. Two‐step strategy for the identification of SARS‐CoV‐2 variant of concern 202012/01 and other variants with spike deletion H69–V70, France, August to December 2020. Euro Surveill. 2021;26:2100008. [DOI] [PMC free article] [PubMed] [Google Scholar]
- 62. Waudby‐West R, Parcell BJ, Palmer CNA, Bell S, Chalmers JD, Siddiqui MK. The association between SARS‐CoV‐2 RT‐PCR cycle threshold and mortality in a community cohort. Eur Respir J. 2021;58:2100360. [DOI] [PMC free article] [PubMed] [Google Scholar]
- 63. Cov‐lineages Org . Cov‐Lineages ‐ B.1.324. Accessed December 5, 2021. https://cov‐lineages.org/lineage.html?lineage=B.1.324
- 64. Thornlow B, Hinrichs AS, Jain M, et al. A new SARS‐CoV‐2 lineage that shares mutations with known variants of concern is rejected by automated sequence repository quality control. biorxiv. 2021:2021.04.05.438352. April 6, 2021. Accessed December 5, 2021. https://www.biorxiv.org/content/ 10.1101/2021.04.05.438352v1 [DOI] [Google Scholar]
- 65. US EPA O . Air cleaners, HVAC filters, and coronavirus (COVID‐19). June 18, 2020. Accessed December 7, 2021. https://www.epa.gov/coronavirus/air‐cleaners‐hvac‐filters‐and‐coronavirus‐covid‐19
- 66. Ward M, Siegel JA, Corsi RL. The effectiveness of stand alone air cleaners for shelter‐in‐place. Indoor Air. 2005;15:127‐134. [DOI] [PubMed] [Google Scholar]
- 67. Lindsley WG, Derk RC, Coyle JP, et al. Efficacy of portable air cleaners and masking for reducing indoor exposure to simulated exhaled SARS‐CoV‐2 aerosols — United States, 2021. MMWR Morb Mortal Wkly Rep. 2021;70:972‐976. [DOI] [PMC free article] [PubMed] [Google Scholar]
- 68. ASHRAE . Reopening of schools and universities. Accessed January 9, 2022. https://www.ASHRAE.org/technical‐resources/reopening‐of‐schools‐and‐universities
- 69. CDC . Guidelines for Environmental Infection Control in Health‐Care Facilities (2003) ‐ Appendix B. July 22, 2019. Accessed December 7, 2021. https://www.cdc.gov/infectioncontrol/guidelines/environmental/appendix/air.html
- 70. Bard RL, Rubenfire M, Fink S, et al. Reduced fine particulate matter air pollution exposures using in‐home portable air cleaners: pilot results of the cardiac rehabilitation air filter trial (CRAFT). J Cardiopulm Rehabil Prev. 2020;40:276‐279. [DOI] [PubMed] [Google Scholar]
- 71. Kipen HM, Black K, Laumbach RJ, et al. Reductions in Indoor Air Pollutants with Use of Portable Indoor Air Cleaners: Windows Open v. Windows Closed. In: D26. Health effects associated with indoor and outdoor air pollution. American Thoracic Society International Conference Abstracts. American Thoracic Society; 2019:A6012–A6012. May 1, 2019. Accessed December 11, 2021. https://www.atsjournals.org/doi/abs/ 10.1164/ajrccm-conference.2019.199.1_MeetingAbstracts.A6012 [DOI]
- 72. Butz AM, Matsui EC, Breysse P, et al. A randomized trial of air cleaners and a health coach to improve indoor air quality for inner‐city children with asthma and secondhand smoke exposure. Arch Pediatr Adolesc Med. 2011;165:741‐748. [DOI] [PMC free article] [PubMed] [Google Scholar]
- 73. Laumbach RJ, Cromar KR, Adamkiewicz G, et al. Personal interventions for reducing exposure and risk for outdoor air pollution: an Official American Thoracic Society Workshop Report. Ann Am Thorac Soc. 2021;18:1435‐1443. [DOI] [PMC free article] [PubMed] [Google Scholar]
- 74. US EPA . Residential Air Cleaners ‐ A Technical Summary, 3rd ed. Portable Air Cleaners, Furnace and HVAC Filters. 2018;pp. 1‐74. https://www.epa.gov/sites/default/files/2018‐07/documents/residential_air_cleaners_‐_a_technical_summary_3rd_edition.pdf [Google Scholar]
- 75. Riederer AM, Krenz JE, Tchong‐French MI, et al. Effectiveness of portable HEPA air cleaners on reducing indoor PM2.5 and NH3 in an agricultural cohort of children with asthma: a randomized intervention trial. Indoor Air. 2021;31:454‐466. [DOI] [PMC free article] [PubMed] [Google Scholar]
- 76. van der Heide S, van Aalderen WMC, Kauffman HF, Dubois AEJ, de Monchy JGR. Clinical effects of air cleaners in homes of asthmatic children sensitized to pet allergens. J Allergy Clin Immunol. 1999;104:447‐451. [DOI] [PubMed] [Google Scholar]
- 77. Wu X, Nethery RC, Sabath MB, Braun D, Dominici F. Air pollution and COVID‐19 mortality in the United States: strengths and limitations of an ecological regression analysis. Sci Adv. 2020;6(45):eabd4049. Publsihed November 4, 2020. 10.1126/sciadv.abd4049 [DOI] [PMC free article] [PubMed] [Google Scholar]
- 78. Setti L, Passarini F, De Gennaro G, et al. SARS‐Cov‐2RNA found on particulate matter of Bergamo in Northern Italy: first evidence. Environ Res. 2020;188:109754. [DOI] [PMC free article] [PubMed] [Google Scholar]
- 79. Brandt EB, Beck AF, Mersha TB. Air pollution, racial disparities, and COVID‐19 mortality. J Allergy Clin Immunol. 2020;146:61‐63. [DOI] [PMC free article] [PubMed] [Google Scholar]
- 80. Ang AX, Luhung I, Ahidjo BA, et al. Airborne SARS‐CoV‐2 surveillance in hospital environment using high‐flowrate air samplers and its comparison to surface sampling. Indoor Air. 2022;32(1):e12930. [DOI] [PMC free article] [PubMed] [Google Scholar]
- 81. Shankar SN, Witanachchi CT, Morea AF, et al. SARS‐CoV‐2 in residential rooms of two self‐isolating persons with COVID‐19. J Aerosol Sci. 2022;159:105870. [DOI] [PMC free article] [PubMed] [Google Scholar]
- 82. Santarpia JL, Herrera VL, Rivera DN, et al. The size and culturability of patient‐generated SARS‐CoV‐2 aerosol. J Expo Sci Environ Epidemiol. 2021:1–6. https://www.nature.com/articles/s41370‐021‐00376‐8 [DOI] [PMC free article] [PubMed] [Google Scholar]
- 83. Lednicky JA, Shankar SN, Elbadry MA, et al. Collection of SARS‐CoV‐2 virus from the air of a clinic within a University Student Health Care Center and analyses of the viral genomic sequence. Aerosol Air Qual Res. 2020;20:1167. [DOI] [PMC free article] [PubMed] [Google Scholar]
- 84. Lednicky JA, Lauzardo M, Fan ZH, et al. Viable SARS‐CoV‐2 in the air of a hospital room with COVID‐19 patients. Int J Infect Dis. 2020;100:476‐482. [DOI] [PMC free article] [PubMed] [Google Scholar]
- 85. Li YH, Fan YZ, Jiang L, Wang HB. Aerosol and environmental surface monitoring for SARS‐CoV‐2 RNA in a designated hospital for severe COVID‐19 patients. Epidemiol Infect. 2020;148:e154. [DOI] [PMC free article] [PubMed] [Google Scholar]
- 86. Stern RA, Koutrakis P, Martins MAG, et al. Characterization of hospital airborne SARS‐CoV‐2. Respir Res. 2021;22:73. [DOI] [PMC free article] [PubMed] [Google Scholar]
- 87. Yamagishi T, Ohnishi M, Matsunaga N, et al. Environmental sampling for severe acute respiratory Syndrome Coronavirus 2 during a COVID‐19 outbreak on the diamond Princess Cruise Ship. J Infect Dis. 2020;222:1098‐1102. [DOI] [PMC free article] [PubMed] [Google Scholar]
- 88. Coil DA, Albertson T, Banerjee S, et al. SARS‐CoV‐2 detection and genomic sequencing from hospital surface samples collected at UC Davis. PLoS One. 2021;16:e0253578. [DOI] [PMC free article] [PubMed] [Google Scholar]
- 89. Cheng VC‐C, Fung KS‐C, Siu GK‐H, et al. Nosocomial outbreak of Coronavirus disease 2019 by possible airborne transmission leading to a superspreading event. Clin Infect Dis. 2019;2021(73):e1356‐e1364. [DOI] [PMC free article] [PubMed] [Google Scholar]
- 90. Kotwa JD, Jamal AJ, Mbareche H, et al. Surface and air contamination with SARS‐CoV‐2 from hospitalized COVID‐19 patients in Toronto, Canada. 2021:2021.05.17.21257122. June 19, 2021. Accessed December 11, 2021. https://www.medrxiv.org/content/ 10.1101/2021.05.17.21257122v2 [DOI]
- 91. Bullard J, Dust K, Funk D, et al. Predicting infectious severe acute respiratory syndrome Coronavirus 2 from diagnostic samples. Clin Infect Dis. 2020;71:2663‐2666. [DOI] [PMC free article] [PubMed] [Google Scholar]
- 92. Tom MR, Mina MJ. To Interpret the SARS‐CoV‐2 Test, consider the cycle threshold value. Clin Infect Dis. 2020;71:2252‐2254. Accessed January 5, 2022. https://www.ncbi.nlm.nih.gov/labs/pmc/articles/PMC7314112/ [DOI] [PMC free article] [PubMed] [Google Scholar]
- 93. Cheng VC‐C, Wong S‐C, Chan VW‐M, et al. Air and environmental sampling for SARS‐CoV‐2 around hospitalized patients with coronavirus disease 2019 (COVID‐19). Infect Control Hosp Epidemiol. 1–8. [DOI] [PMC free article] [PubMed] [Google Scholar]
- 94. Chen A, Agarwal A, Ravindran N, To C, Zhang T, Thuluvath PJ. Are gastrointestinal symptoms specific for Coronavirus 2019 infection? A prospective case‐control study from the United States. Gastroenterology. 2020;159:1161‐1163. e2. [DOI] [PMC free article] [PubMed] [Google Scholar]
- 95. Izcovich A, Ragusa MA, Tortosa F, et al. Prognostic factors for severity and mortality in patients infected with COVID‐19: a systematic review. PLoS One. 2020;15:e0241955. [DOI] [PMC free article] [PubMed] [Google Scholar]
- 96. Sharma R, Agarwal M, Gupta M, Somendra S, Saxena SK. Clinical characteristics and differential clinical diagnosis of novel Coronavirus disease 2019 (COVID‐19). Coronavirus Disease 2019 (COVID‐19). 2020:55.
- 97. Rudberg A‐S, Havervall S, Månberg A, et al. SARS‐CoV‐2 exposure, symptoms and seroprevalence in healthcare workers in Sweden. Nat Commun. 2020;11:5064. [DOI] [PMC free article] [PubMed] [Google Scholar]
Associated Data
This section collects any data citations, data availability statements, or supplementary materials included in this article.
Supplementary Materials
Appendix S1
Data Availability Statement
Study data are available from the corresponding author upon request.