

Abstract
Chronic inflammation triggers compensatory immunosuppression to stop inflammation and minimize tissue damage. Studies have demonstrated that endoplasmic reticulum (ER) stress augments the suppressive phenotypes of immune cells; however, the molecular mechanisms underpinning this process and how it links to the metabolic reprogramming of immunosuppressive macrophages remains elusive. Here we report that the Th2 cytokine interleukin 4 (IL-4) and the tumor microenvironment increase the activity of a protein kinase RNA-like ER kinase (PERK) signaling cascade in macrophages and promote immunosuppressive M2 activation and proliferation. Loss of PERK signaling impeded mitochondrial respiration and lipid oxidation critical for M2 macrophages. PERK activation mediated the upregulation of PSAT1 and serine biosynthesis via the downstream transcription factor ATF4. Increased serine biosynthesis resulted in enhanced mitochondrial function and α-ketoglutarate (α-KG) production required for JMJD3-dependent epigenetic modification. Inhibition of PERK suppressed macrophage immunosuppressive activity and could enhance the efficacy of immune checkpoint PD-1 inhibition in melanoma. Our findings delineate a previously undescribed connection between PERK signaling and PSAT1-mediated serine metabolism critical for promoting immunosuppressive function in M2 macrophages.
Introduction
Macrophages, a critical component of the innate immune system, are a group of heterogeneous cells present in all tissues. Due to this wide distribution, macrophages are uniquely poised to exert essential processes for human health - from pathogen clearance, tissue repair, and maintenance of homeostasis1,2. The ability of macrophages to serve these functions reflects their ability to execute disparate cellular programs in response to distinct extracellular cues. As a result, immunosuppressive (M2) macrophages and pro-inflammatory (M1) macrophages represent two distinct polarization phenotypes in response to tumor and helminthic insults or to bacterial and viral infection3. Moreover, the revitalization of immunometabolism and epigenetics research has uncovered new insights into these polarization phenotypes, revealing major and largely non-overlapping alterations in gene expression that are closely associated with distinctive metabolic pathways4,5.
These distinct phenotypes are dependent on cues from the surrounding microenvironment, and inflammatory milieus are known to impose stress signals that affect the energetic demands and cellular fitness of infiltrating immune cells6,7. However, to induce phenotypic changes, these signals must be incorporated and translated intracellularly. The major organelle responsible for coordinating extrinsic challenges and intrinsic cellular demands is the ER where the progression of inflammatory diseases can provoke the unfolded protein response (UPR). The UPR is commonly associated with the maintenance of proteostasis; however, recent findings show that activation of the UPR is linked to the development and function of immune cells8–10, including dendritic cells (DCs)11,12, myeloid cell-driven immunosuppressive cells (MDSCs)13, and also T cells14,15. The UPR signaling cascade is primarily initiated by the type-I transmembrane kinase, inositol-requiring enzyme-1α (IRE-1α), the type-II transmembrane protein, activating transcription factor-6 (ATF-6), and PKR-like endoplasmic reticulum kinase (PERK, encoded by Eif2ak3)16. Recent studies have suggested that IRE1α-mediated X-box binding protein (XBP1) signaling plays a crucial role in macrophages during inflammatory diseases17,18. Yet, these findings have reached inconclusive and/or contradictory conclusions. This raises an important question about whether other arms of the UPR contribute to the metabolic adaption necessary to support the immunosuppressive characteristics of macrophages.
Activated PERK phosphorylates the downstream mediator eukaryotic translation initiation factor 2α (eIF2α)16, leading to the induction of stress-responsive activating transcription factor 4 (ATF4) activation19. PERK signaling induces mitochondrial function20, while ATF4 activation has been suggested to upregulate a set of targets involved in amino acid anabolism21. In this study, we show that the PERK arm of the UPR is uniquely upregulated in macrophages responding to the Th2 cytokine IL-4 and also the tumor microenvironment. This PERK signaling modality promotes mitochondrial respiration to fulfill cellular energy requirements while also signaling through ATF4 to regulate PSAT1 activity to mediate the serine biosynthesis pathway. The process of PSAT1-mediated serine synthesis, in addition to supporting mitochondrial fitness, balances the production of α-ketoglutarate (α-KG) necessary for JMJD3-dependent histone demethylation and reinforces immunosuppressive M2 activation and cell expansion. These results highlight a previously uncharacterized role for PERK in cellular metabolism and epigenetic modification in M2 macrophages, and our findings may offer a novel strategy for counteracting the immunosuppressive effects of M2 macrophages in human diseases.
Results
PERK supports macrophage immunosuppression
To investigate the role of the ER stress response in immunosuppressive M2 macrophages, we first analyzed publicly available microarray and single-cell RNA sequencing data and performed gene set enrichment analysis (GSEA) of IL-4/anti-IL-4 antibody complex (IL-4c) treated mouse peritoneal macrophages (GSE54679)22 and tumor-associated macrophages (TAMs) from patients with lung carcinoma (GSE97168)23. Our data indicated that under IL-4 stimulation (Extended Data Figure 1a) and within the tumor microenvironment (Extended Data Figure 1b), macrophages significantly upregulated genes associated with an ER stress response. By analyzing our RNA sequencing (RNA-Seq) dataset (GSE53053)24, we found that the PERK arm of the ER stress response was markedly induced by bone marrow-derived macrophages (BMDMs) following stimulation with IL-4 compared with naïve (M0) and pro-inflammatory (M1) macrophages (Figure 1a). Moreover, we observed a positive correlation between CD68 mRNA of tumor macrophages to individual gene transcripts (HSP5A, EIF2A, NFE2L2, and ATF4) of the PERK signaling axis in different human cancer patient samples from the Cancer Genome Atlas (TCGA) program including colon adenocarcinoma (COAD), lung adenocarcinoma (LUAD), and pancreatic ductal adenocarcinoma (PDAC) (Extended Data Figure 1c), suggesting that the activation of PERK may be required to support immunosuppressive M2 phenotype. To confirm this, BMDMs were stimulated with the Th2 cytokine IL-4 or assessed TAMs from animals bearing B16-F10 melanoma. We found that both IL-4 stimulated macrophages and TAMs exhibited a higher percentage of activated (phosphorylated) PERK protein compared with naïve BMDMs and splenic macrophages from melanoma tumor-bearing mice, respectively (Figure 1b,c & Extended Data Figure 1d). Of note, a conventional ER stress inducer, Thapsigargin was able to induce the phosphorylation of PERK (Extended Data Figure 1d,e), but was incapable of driving polarization towards an immunosuppressive phenotype in macrophages (Extended Data Figure 1f), suggesting that PERK activation itself is not sufficient to induce M2 polarization, but rather, an initiating factor such as IL-4 or the TME is also necessary.
Figure 1. PERK stress signaling promotes an immunosuppressive phenotype in macrophages.

a, Expression of genes encoding molecules involved in the PERK arm of the ER stress response in M0 (naive), M1 (LPS plus IFNγ), and M2 (IL-4) BMDMs, assessed by RNA-Seq analysis. b, Geometric MFI of p-PERK+ BMDMs cultured for 24 h with IL-4, measured by flow cytometry (n=3; mean ± s.e.m). Data are collected from three independent experiments. c, Geometric MFI of p-PERK+ macrophages in the tumor and spleen from B16-F10 tumor bearing mice (n=4 mice per group). Data representative of two independent experiments. d, Expression of CD206, CD301, PD-L2, and Relmα in M0 and IL-4 treated BMDMs from Eif2ak3fl/fl and Eif2ak3fl/fl x LysMCre mice (n=3; mean ± s.e.m). Data are collected from three independent experiments. e, Representative histogram (left) and quantitative plot (right) of Relmα+ peritoneal macrophages in mice following treatment with IL-4c (n=4 mice per group; mean ± s.e.m). Each symbol represents one individual. Data representative of two independent experiments. f, Absolute number of peritoneal macrophages (n=4 for Eif2ak3fl/fl and n=3 for Eif2ak3fl/fl x LysMCre mice; mean ± s.e.m). Each symbol represents one individual. Data is representative of two independent experiments. g, Representative histogram (left) and quantitative plot (right) of Ki67+ peritoneal macrophages in mice following treatment with IL-4c (n=4 for Eif2ak3fl/fl and n=3 Eif2ak3fl/fl x LysMCre mice; mean ± s.e.m). Each symbol represents one individual. Data is representative of two independent experiments. h, Representative expression of CD206 and CD301 by PERK wild-type or knockout BMDMs co-cultured with either B16-F10 melanoma cells (top) or LLC lung carcinoma cells (bottom) for 72 h (n=4; mean ± s.e.m). Data is representative of two independent experiments. i, Proliferation of CellTrace Violet (CTV)-labelled CD8 OT-I T cells activated with anti-CD3 and anti-CD28 and co-cultured with PERK wild-type or PERK-null BMDMs stimulated with IL-4 (M2) or LPS+IFNγ (M1) at a ratio of 1:10 for 72 hr (n=2; mean ± s.e.m). Data is representative of two individual experiments. j,k, Tumor growth (Eif2ak3fl/fl, n=15 ; Eif2ak3fl/fl x LysMCre, n=15; mean ± s.e.m) (j) and tumor weight (k) of B16-F10 melanoma. Data were taken from tumors harvested on either day 10 or day 16 post-tumor transplantation. (n=5 mice per group D10; n=15 mice per group D16; mean ± s.e.m). Each symbol is representative of one individual. Data are representative of at least two independent experiments. l,m, Absolute number of TAMs (l) and the frequency of CD206+ TAMs (m) in Eif2ak3fl/fl and Eif2ak3fl/fl x LysMCre tumor bearing mice from either day 10 or day 16 tumors (n=4 per group D10 or n=15 per group D16; mean ± s.e.m). Each symbol is representative of one individual. Data are representative of at least two independent experiments. n,o,p, Absolute number of TILs (n) and the frequency of IFNγ+ CD4 (o) and IFNγ+ CD8 (p) T cells in Eif2ak3fl/fl and Eif2ak3fl/fl x LysMCre tumor-bearing mice from either day 10 or day 16 tumors (n=4 per group; mean ± s.e.m). Each symbol represents one individual. Data are representative of two independent experiments. q, Survival analysis between Eif2ak3fl/fl and Eif2ak3fl/fl x LysMCre mice bearing B16-F10 melanoma (n=8 per group; mean ± s.e.m); data are collected from two independent experiments. All data were analyzed using two-tailed unpaired Student’s t-test (b,c,d,e,f,g,j,I,j,k,l,m,n,o,p) or Mantel-Cox test for survival (q).
Treatment with a selective PERK inhibitor GSK2656157 could significantly inhibit M2 polarization as measured by the expression of canonical M2 markers CD206 and CD301 (Extended Data Figure 1g). To further study the intrinsic effect of PERK in macrophages, we generated myeloid-specific conditional knockout mice deficient in Eif2ak3 by crossing Eif2ak3fl/fl with LysMCre mice (Eif2ak3fl/fl x LysMCre; designated as PERKcKO). We observed that PERK deficiency did not affect the cell viability in naïve macrophages (Extended Data Figure 1h), yet PERK-null macrophages upon IL-4 stimulation were significantly hindered in M2 polarization in vitro (Figure 1d) and in vivo (Figure 1e). Importantly, we found that PERK supports the proliferative capacity of peritoneal macrophages in this Th2 setting, since increases in cell number and Ki67 expression were greatly inhibited in PERK deficient peritoneal macrophages (Figure 1f,g). In contrast, macrophages classically activated with LPS plus IFNγ (M1 macrophages) exhibited low expression of PERK (Figure 1a & Extended Data Figure 1i). Similar to a reported study25, PERK deficiency (PERKcKO) had no impact on the pro-inflammatory expression of iNOS and TNF (Extended Data Figure 1j,k). Furthermore, loss of PERK did not “rewire” M1 macrophages to exhibit an anti-inflammatory phenotype (Extended Data Figure 1i,l)26, and deletion of PERK did not detrimentally affect the expression of XBP1s (Extended Data Figure 1m) which has been linked to macrophage immunity in obesity17 and the TME18.
ER stress responses have been implicated in dysregulated DC antigen presentation12 and T cell exhaustion14,15 in the tumor microenvironment. We, therefore, sought to determine whether PERK activity is required to support the immunity of TAMs. PERK deficient BMDMs cocultured with either melanoma cells (B16-F10) or Lewis lung carcinoma cells (LLC) exhibited less M2 polarization as compared to PERK sufficient macrophages (Figure 1h). Additionally, these PERKcKO M2 macrophages were less capable of blunting T cell proliferation (Figure 1i), suggesting that loss of PERK in macrophages can confer greater anti-tumor immunity. To test this, we transplanted wild-type (Eif2ak3fl/fl) or PERKcKO mice with murine melanoma cells and measured tumor growth over the course of 16 days. Indeed, both tumor volume (Figure 1j) and tumor weight (Figure 1k) were significantly lower in the PERKcKO mice compared to wild-type mice. Moreover, reduced numbers of macrophages infiltrating into the tumor were found in the PERKcKO compared to the control mice (Figure 1l) and corresponded to a significant decrease in CD206-positivity (Figure 1m). Conversely, higher numbers of tumor-infiltrating T lymphocytes (TILs) (Figure 1n) and an increased frequency of IFNγ-expressing CD8+ and CD4+ T cells (Figure 1o,p) were found in tumors from PERKcKO mice. Intriguingly, this inverse relationship between TAMs and TILs was detected as early as 10 days post-tumor implantation (Figure 1k–p), and this improved anti-tumor immunity corresponded with a noticeable increase in survival (Figure 1q). Together, these data indicate that PERK activation promotes an immunosuppressive M2 phenotype in macrophages and that loss of PERK not only inhibits this phenotype but restores anti-tumor activity.
Integrated stress response (ISR) in macrophage activation
UPR signaling partially overlaps with the integrated stress response (ISR) where PERK is uniquely positioned to coordinate with both pathways by phosphorylating eIF2α27. Inhibition of eIF2α using a selective inhibitor ISRIB was able to significantly repress M2 polarization without distorting iNOS expression in macrophages (Extended Data Figure 2a–c). Yet, in addition to PERK, ISR proteins, general control nonderepressible 2 (GCN2), double-stranded RNA-dependent protein kinase (PKR), and heme-regulated eIF2α kinase (HRI) can respond and adapt to different environmental and pathological challenges necessary for maintaining cell homeostasis28. To determine whether anti-inflammatory M2 macrophages required other ISR support, we performed RNA-Seq analysis of HRI, PKR, and GCN2, and found that only the expression of GCN2 was significantly elevated in M2 macrophages (Extended Data Figure 2d). Interestingly, deletion of GCN2 did not decrease the expression of CD206, CD301, PD-L2 and Relmα in macrophages in response to IL-4 (Extended Data Figure 2e,f), nor adversely affected iNOS and TNF expression in M1 macrophages (Extended Data Figure 2g,h). Moreover, Gcn2−/− macrophages exhibited only slight differences in metabolic function compared to Gcn2+/+ controls responding to IL-4 and LPS plus IFNγ (Extended Data Figure 2i,j). Thus, PERK signaling but not other ISR members, accounts for M2 activation.
PERK signaling is crucial for metabolic reprogramming
Since metabolic reprogramming has been suggested to modulate the suppressive function of macrophages29, we next examined whether PERK-deficient M2 macrophages fail to sustain appropriate metabolic reprogramming and operation. To test this, we performed an unbiased RNA-Seq analysis of M2 macrophages from wild-type and PERKcKO mice. Analysis of RNA-Seq data by pathway enrichment and gene ontology of differentially expressed genes showed that genetic ablation of PERK denoted significant dysregulation of numerous pathways in macrophages, including lysosomal function, mitochondrial oxidative phosphorylation (OXPHOS), lipid metabolism, glutamine metabolism, and amino acid synthesis (Figure 2a,b) - all processes that have been deemed essential for supporting the function of M2 macrophages24,30,31. We then used targeted metabolomics analysis and confirmed that the levels of cellular metabolites were clearly distinguishable in PERK-deficient M2 macrophages compared to the wild-type controls (Figure 2c,d), which displayed a marked decline in the generation of mitochondrial metabolites, histidine/pyrimidine, and several crucial amino acids (Figure 2e).
Figure 2. Multivariate analysis of transcriptomics and metabolomics data.

a,b, Gene set enrichment analysis was performed, and enrichment scores are shown for KEGG (a) and GO (b) pathway enrichment in PERK knockout M2 macrophages compared with PERK wild-type M2 macrophages (n=2 independent experiments). c,d,e, Metabolomics profiling was performed, and principal component analysis (PCA) score plot (c), heatmap analysis of metabolites (d), and KEGG pathway enrichment in PERK knockout M2 macrophages compared with PERK wild-type M2 macrophages (e) are shown (n=4 independent experiments).
While lipid metabolism and mitochondrial fitness have been explicitly tied to M2 macrophage immunity, the initiating factor for these processes has not been fully elucidated. Inhibition of PERK signaling suppressed mitochondrial respiration (OCR; Figure 3a & Extended Data Figure 2k) and reduced overall ATP production in M2 macrophages (Figure 3b). PERK deficiency also deviated glycolytic metabolism (ECAR) to levels similar to naive macrophages (Extended Data Figure 3a). This scenario could be recapitulated by the PERK inhibitor GSK2656157 (Extended Data Figure 3c–e). Although PERK deficiency did not curb the pro-inflammatory activity of macrophages stimulated with LSP+IFNγ, it slightly reduced glycolytic metabolism not mitochondrial respiration (Extended Data Figure 3a,b). Furthermore, our transcriptomic and qRT-PCR analysis showed that a number of key genes responsible for lipid metabolism and mitochondrial respiration were markedly reduced by PERK inhibition (Figure 3c,d). This corresponded to a significant decrease in lipid uptake (Figure 3e & Extended Data Figure 3f) and lipolysis (Figure 3f & Extended Data Figure 3g) in M2 macrophages upon IL-4 stimulation. Mitochondria are the major energy-generating source for the cell. This energy is produced within tightly organized structures called cristae, in which the tighter and more densely packed the cristae, the greater the surface area upon which the respiratory complexes of the electron transport chain (ETC) can assemble. Thus, for cells such as M2 macrophages which rely on enhanced mitochondrial function, the number and size of mitochondria available, as well as the density of the cristae within these mitochondria are imperative for supporting their immunological functions. Importantly, it has been suggested that PERK signaling regulates mitochondrial morphology32, and abnormal mitochondrial cristae ultrastructure is strongly correlated with dysfunction in mitochondrial respiratory capacity33. Using transmission electron microscopy (TEM), we found that PERKcKO M2 macrophages displayed overall lower numbers of mitochondria that were also smaller compared to wild-type cells (Extended Data Figure 3h). In comparison to wild-type, PERKcKO macrophages also appeared to exhibit disorganized cristae (Figure 3g), having overall less number (Figure 3h) and wider structure (Figure 3i) within the intermembrane space. Additionally, mitochondrial mass (Figure 3j & Extended Data Figure 3i) and membrane potential (Figure 3k & Extended Data Figure 3j) were both significantly reduced in PERKcKO or cells treated with GSK2656157. Given the altered cristae morphology, we further investigated whether the complexes of the ETC were affected by PERK deficiency. We found that PERKcKO M2 macrophages had significantly reduced levels of mitochondrial ETC gene and protein expression (Figure 3l,m). These data suggest that these cristae differences contribute to an altered metabolic phenotype between PERK wild-type and deficient macrophages.
Figure 3. PERK activity is essential for metabolic reprogramming in M2 macrophages.

a, Basal OCR of IL-4 stimulated BMDMs (M2) from Eif2ak3fl/fl or Eif2ak3fl/fl x LysMCre (n=5; mean ± s.e.m). Data are collected from five independent experiments. b, ATP levels of IL-4 stimulated BMDMs from Eif2ak3fl/fl or Eif2ak3fl/fl x LysMCre mice (n=3; mean ± s.e.m). Data are from three independent experiments. c, Expression of genes encoding CD36, LIPA, PPARγ, PGC1β, and ACAT1 in M2 (IL-4) macrophages from Eif2ak3fl/fl and Eif2ak3fl/fl x LysMCre mice, assessed by RNA-Seq analysis. d, Expression of CD36, LIPA, PPARγ, PGC1β in PERK wild-type and deficient macrophages stimulated with IL-4 by quantitative real-time PCR analysis (n=4; mean ± s.e.m). Data are representative of two independent experiments. e, Representative histogram (left) and quantitative plot (right) of BODIPY FL C16 staining in BMDMs treated with IL-4 (n=4; mean ± s.e.m). Data are representative of three independent experiments. f, Representative histogram (left) and quantitative plot (right) of BODIPY (493/503) staining in BMDMs treated with IL-4 (n=4; mean ± s.e.m). Data are representative of three independent experiments. g, Representative images of mitochondrial and cristae (red arrows) from transmission electron microscopy of IL-4 stimulated bone-marrow macrophages from Eif2ak3fl/fl or Eif2ak3fl/fl x LysMCre mice. Scale bar = 500 nm. h,i, Measurements of cristae area (h) and cristae width (i) as determined using ImageJ. Each dot represents average of all mitochondria from one cell (n=22; mean ± s.e.m). Data are representative of two biological replicates. j, Representative histogram (left) and quantitative plot (right) of MitoTracker Green+ staining in BMDMs treated IL-4 (n=4; mean ± s.e.m). Data are representative of three independent experiments. k, Representative histogram (left) and quantitative plot (right) of MitoTracker Orange+ staining in BMDMs treated with IL-4 (n=4; mean ± s.e.m). Data are representative of three independent experiments. l, Expression of genes encoding molecules involved in the electron transport chain reaction in M2 (IL-4) macrophages from Eif2ak3fl/fl or Eif2ak3fl/fl x LysMCre mice, assessed by RNA-Seq analysis. m, Immunoblots of mitochondrial proteins ATP5A, UQCRC2, MTCO1, SDHB, NUDFB8, and PHB1 from PERK sufficient or deficient BMDMs stimulated with IL-4. Data are representative of three independent experiments. n, Mitochondrial calcium flux (Rhod-2) from PERK sufficient or deficient BMDMs treated with IL-4 was determined and normalized by wild-type naïve M0 macrophages. Arrow, stimulation using 10 μM ionomycin (n=6; mean ± s.e.m); data are representative of three independent experiments. All data were analyzed by two-tailed unpaired Student’s t-test (a,b,d,e,f,h,I,j,k) or two-tailed paired Student’s t-test.
Crosstalk between the ER and the mitochondria has been demonstrated to promote bioenergetics in cells34 and is thought to be mediated by calcium signaling. We noted that the expression of genes encoding mitochondrial calcium transport was downregulated in PERKcKO M2 cells (Extended Data Figure 3k). Furthermore, we assessed the mitochondrial calcium flux in PERK intact or deficient M2 BMDMs and found that PERK ablation resulted in a profound reduction of calcium flux within the mitochondria (Figure 3n & Extended Data Figure 3l). Collectively, these findings suggest that suppression of PERK signaling may differentially disrupt mitochondrial homeostasis by preventing adequate crosstalk between the ER and mitochondria. The result of this may then prevent M2 macrophages from being able to produce sufficient energy to fully sustain their immunosuppressive function.
PERK induces serine biosynthesis via ATF4
Proliferating cells, including M2 macrophages, require ATP to build biomass and thus require cellular building blocks such as nucleotides for genome replication, lipids for membrane integrity, and amino acids for proteins biosynthesis. Notably, however, the pentose phosphate pathway (PPP), a component of glycolysis that is crucial to the needs of rapidly dividing cells, is markedly lower in M2 compared to M1 macrophages35. It has been shown that the serine biosynthesis pathway (SBP) can provide one-carbon units for de novo nucleotide biosynthesis supporting the expansion of T cells36 and tumor cells37. We therefore hypothesized that M2 macrophages may also use SBP to support the biosynthesis of various macromolecules required for cellular proliferation and function. Intriguingly, we observed deletion of PERK to significantly reduce the metabolism of amino acids (i.e. serine, glycine, and threonine) and nucleotides (i.e. histidine and pyrimidine) in macrophages responding to IL-4 (Figure 2), suggesting a novel role for PERK in tuning the SBP in M2 macrophages.
Using GSEA analysis, we compared serine/glycine one-carbon metabolism by IL-4 stimulated mouse peritoneal macrophages vs. naïve peritoneal macrophages22 and intratumoral macrophages (TAMs) vs. non-tumor macrophages from patients with lung cancer23. Our data revealed a significant enrichment of this pathway in both IL-4 stimulated macrophages and TAMs (Figure 4a,b). Next, we performed mass spectrometry-based metabolite profiling and found that the levels of intracellular 3-phosphoglycerate, serine, and glycine were significantly elevated by IL-4 stimulated M2 cells compared to M1 macrophages (Figure 4c). We also used targeted metabolomics analysis and identified a number of metabolites associated with the serine/glycine one-carbon metabolic pathway to be significantly reduced in PERKcKO M2 macrophages compared to wild-type (Figure 4d). Deletion of PERK not only negatively impacted intrinsic serine levels, but also surprisingly downregulated the transcript levels of the key serine biosynthesis genes (Phgdh, Psat1, and Psph)38 induced by M2 macrophages (Figure 4e,f; Extended Data Figure 4a). Similarly, inhibition of the PERK downstream target eIF2α, was able to decrease the production of intracellular serine (Extended Data Figure 2l). It has been separately reported in other cells that activated PERK signaling induces the translational activation of activating transcription factor 4 (ATF4)39 and that ATF4 regulates a set of targets involved in serine/glycine metabolism and mitochondrial function21,40; however, no studies have determined whether PERK signals through ATF4 to support SBP in macrophages. We, therefore, investigated the interconnection between PERK-ATF4 signaling and serine biosynthesis in M2 macrophages by first analyzing a chromatin immunoprecipitation sequencing (ChIP-Seq) dataset of ATF4-DNA binding in M0 vs. M2 macrophages obtained from a previously published study (GSE140029)41. We found that ATF4 bound DNA was enriched in M2 compared to M0 (histogram; Figure 4g); and, importantly, the enriched ATF4 target gene loci were associated with downstream PERK signaling (Nfe2l2 and Ddit3), and also serine one-carbon metabolism (Psat1, Shmt2, Mtfhr, Mthfd1l, Mthfd2) in M2 macrophages (Figure 4g). We also found that ATF4 could bind to genes involved in the regulation of mitochondrial respiration and lipid metabolism (Uqcrq, Atp9b, Ndufa4l2, Pparg, Abca1). Moreover, PERK ablation reduced the protein expression of ATF4, PHGDH, and PSAT1 (Figure 4h). We next generated retroviral mediated short hairpin RNA (shRNA) against ATF4 to further understand the relationship between PERK, ATF4, and M2 activation. Similar to the PERKcKO, ATF4 knockdown reduced the expression of ATF4, PHGDH and PSAT1 (Figure 4i,j), and also suppressed the IL-4-induced expression of CD206, CD301, PD-L2 and Relmα (Figure 4k). Overexpression of ATF4 in PERKcKO was able to rescue the defective M2 activation and metabolic function (basal OCR & basal ECAR) in BMDMs stimulated with IL-4 (Figure 4l–n). Together, our results strongly imply that activated PERK regulates ATF4 to reprogram cellular metabolic networks tailoring M2 activation.
Figure 4. PERK regulates intrinsic serine biosynthesis via ATF4.

a, Enrichment plot of serine glycine one carbon metabolism (SGOC) genes in IL-4c treated mouse peritoneal macrophages compared with naïve (PBS) macrophages by GSEA analysis. b, GSEA result comparing SGOC genes between TAMs and non-tumor macrophages from patients with lung carcinoma. c, Abundance of 3-phosphoglycerate (3-PG), serine, and glycine in extracts of BMDMs cultured for 24 h in M1 (LPS+IFNγ) or M2 (IL-4) stimulating conditions, assessed by mass spectrometry (n=4; mean ± s.e.m). Data are collected from four independent experiments. d, Targeted metabolomics profiling indicated metabolites from Eif2ak3fl/fl or Eif2ak3fl/fl x LysMCre BMDMs stimulated with IL-4 (n=4 independent experiments). e, Intracellular serine levels in extracts of PERK wild-type or knockout BMDMs treated with IL-4 (n=3; mean ± s.e.m); serine level from naïve (M0) wild-type macrophages is indicated by dotted horizontal line. Data are representative of two independent experiments. f, Expression of genes encoding PHGDH and PSAT1 in M2 (IL-4) macrophages from Eif2ak3fl/fl or Eif2ak3fl/fl x LysMCre mice, assessed by RNA-Seq analysis. g, Comprehensive heatmap of ATF4 binding regions by ChIP-Seq analysis. h, Immunoblot analysis of PERK, ATF4, PHGDH, PSAT1, and β-actin in macrophages from PERK wild-type or deficient BMDMs. Data are representative of three independent experiments. i,j qRT-PCR (i; n=4; mean ± s.e.m) and immunoblot (j) analysis of ATF4, PHGDH, PSAT1, and β-actin in BMDMs transduced with retrovirus expressing ATF4 or luciferase (Luc) shRNA, and stimulated with IL-4. Data are representative of two independent experiments. k, Expression of CD206, CD301, PD-L2 and Relmα in BMDMs transduced with retrovirus expressing ATF4 or luciferase (Luc) shRNA and stimulated with IL-4 (n=3; mean ± s.e.m). Data are representative of two independent experiments. l,m,n, PERK wild-type (WT) or deficient (KO) BMDMs were either transduced with retrovirus overexpressing a control reporter gene (EV) or a reporter gene plus the Atf4 sequence (Atf4O/E), and stimulated with IL-4. Representative expression of CD206 and CD301 was determined by flow cytometry (l; n=4; mean ± s.e.m), and basal OCR (m) and basal ECAR (n) were measured by Seahorse Flux analyzer (n=3; mean ± s.e.m). Data are representative of two independent experiments. All data were analyzed by two-tailed unpaired Student’s t-test (c,e,I,k) or one-way ANOVA with Dunnett’s multiple comparisons test (m,n).
Serine biosynthesis contributes to M2 activation
We next sought to determine whether serine metabolism was necessary for immunosuppressive M2 macrophages. We treated BMDMs with the pharmacological PHGDH inhibitor CBR-588442, or retroviral-mediated shRNA targeting Phgdh (Extended Data Figure 4b) and Psat1 (Extended Data Figure 4c). Inhibition of SBP enzymes substantially decreased the expression of CD206, CD301, PD-L2, and Relmα (Figure 5a & Extended Data Figure 4d,e). We also observed that inhibition of PHGDH via another selective inhibitor NCT-50343 strikingly suppressed Relmα+ M2 activation (Figure 5b) and proliferation (Figure 5c) in macrophages upon IL-4c administration in the mouse peritoneal cavity in vivo. To study the effect of serine metabolism in macrophages, we generated myeloid cell conditional Psat1 knockout animals by crossing Psat1fl/fl with LysMCre mice (Psat1fl/fl x LysMCre; designated as PSAT1cKO). Similar to the effects found with pharmacological inhibition and genetic knockdown, lower expression of CD206, CD301, PD-L2 and Relmα was detected in PSAT1cKO BMDMs stimulated with IL-4 compared with those from wild-type (Psat1fl/fl) mice (Figure 5d,e). Additionally, PSAT1 deficiency had no effect on M1 polarization toward an anti-inflammatory phenotype (Extended Data Figure 4f,g). In comparison with wild-type macrophages, PSAT1cKO BMDMs co-cultured with B16-F10 or LLC exhibited a marked attenuation of the suppressive M2 phenotype (Figure 5f) and exhibited less capacity to restrain T cell proliferation in vitro (Figure 5g). To define the intrinsic role of PSAT1 in immunosuppressive macrophages during tumorigenesis, we transplanted Psat1fl/fl x LysMCre and wild-type mice with B16-F10 melanoma cells. Delayed growth and reduced tumor weight were observed in Psat1fl/fl x LysMCre mice compared with controls (Figure 5h,i). A significant reduction in cell number and M2 positive phenotype was detected in TAMs from Psat1fl/fl x LysMCre mice (Figure 5j,k). We also found that elimination of PSAT1 in macrophages could enhance anti-tumor T cell responses, resulting in increased percentages of TILs and IFNγ-expressing CD8+ and CD4+ T cells from B16-F10 tumor-bearing mice (Figure 5l–n).
Figure 5. Serine biosynthesis promotes an immunosuppressive phenotype in macrophages.
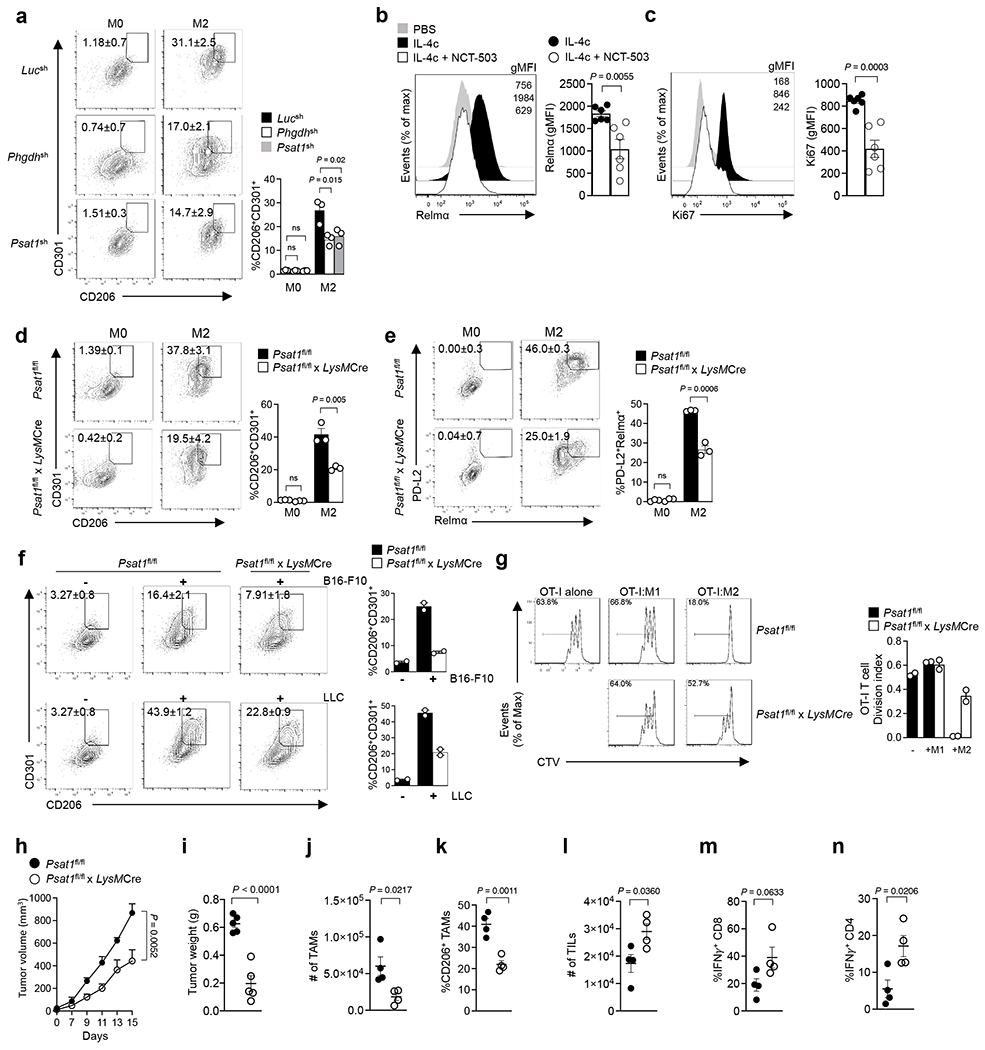
a, Expression of CD206 and CD301 in BMDMs transduced with retrovirus expressing PHGDH shRNA (middle), or BMDMs transduced with retrovirus expressing PSAT1 shRNA (bottom) (n=3; mean ± s.e.m). Data are representative of three independent experiments. b,c, Representative histogram (left) and quantitative plot (right) of Relmα+ (b) or Ki67+ (c) mouse peritoneal macrophages following treatment with IL-4c in the presence or absence of NCT-503 (n=6 mice per group; mean ± s.e.m). Each data symbol represents one individual. d,e, Expression of CD206, CD301 (d), PD-L2 and Relmα (e) in IL-4 stimulated BMDMs from Psat1fl/fl or Psat1fl/fl x LysMCre (n=3; mean ± s.e.m). Data are representative of three independent experiments. f, Expression of CD206 and CD301 by BMDMs from Psat1fl/fl or Psat1fl/fl x LysMCre mice co-cultured with B16-F10 melanoma cells (top) and LLC lung carcinoma cells (bottom) for 72 h (n=2; mean ± s.e.m). Data are collected from two independent experiments. g, Proliferation of CTV-labelled OT-I CD8 T cells activated with anti-CD3 and anti-CD28 and co-cultured with PSAT1 ypyype or knockout BMDMs treated with IL-4 (M2) or LPS+IFNγ (M1) in ratio of 1:10 for 72 hr (n=2; mean ± s.e.m). Data are collected from two independent experiments. h,i, Tumor growth (h) and tumor weight (i) of B16-F10 melanoma from Psat1fl/fl or Psat1fl/fl x LysMCre mice (n=5 mice per group; mean ± s.e.m). Data are collected from two independent experiments. j,k, Absolute number of TAMs (j) and the frequency of CD206+ TAMs (k) in PSAT1 wild-type or knockout mice (n=4 mice per group; mean ± s.e.m). l,m,n Absolute number of TILs (l) and the frequency of IFNγ+ CD8 (m) or CD4 (n) T cells in PSAT1 wild-type or knockout mice (n=4 mice per group; mean ± s.e.m). Data are representative of two independent experiments. All data were analyzed by two-tailed unpaired Student’s t-test (b,c,d,e,f,g,h,I,j,k,l,m,n) or one-way ANOVA with Dunnett’s multiple comparisons test (a).
PSAT1 is required for mitochondrial fitness
Cellular serine is actively transported into the mitochondria44, and its availability is known to maintain mitochondrial function and support mitochondrial fatty acid metabolism45. We, therefore, hypothesized whether the mitochondrial dysfunction present in the PERKcKO macrophages was due to diminished SBP metabolism. We observed that the level of intracellular serine was markedly reduced in PSAT1cKO M2 macrophages compared to wild-type controls (Figure 6a), and, similar to PERKcKO, inhibition of PSAT1-mediated serine biosynthesis appeared to decrease fatty acid oxidation (FAO; OCR), glycolytic activity (ECAR), and ATP generation in macrophages under IL-4 stimulation (Figure 6b,c & Extended Data Figure 4h–j). Yet, interestingly, this reduction in energy production was not due to dysregulation of mitochondrial mass and membrane potential (Figure 6d–g). Additionally, we found that loss of PSAT1 did not exhibit a negative impact on ETC assembly compared with controls (Figure 6h). However, calcium flux into the mitochondria was significantly compromised in the PSAT1-null M2 macrophages (Figure 6i). Together, these findings indicate that serine biosynthesis plays an important role in mitochondrial fitness by supporting FAO and mitochondrial calcium flux, but has no direct bearing on the mitochondrial respiratory chain assembly.
Figure 6. Serine biosynthesis contributes to mitochondrial fitness independent of respiratory chain assembly.

a, Intracellular serine levels in extracts of IL-4 stimulated BMDMs from Psat1fl/fl or Psat1fl/fl x LysMCre (n=4; mean ± s.e.m); serine levels from M0 are indicated by dotted horizontal line. Data are representative of two independent experiments. b, Basal OCR (left) and basal ECAR (right) of PSAT1 wild-type or knockout BMDMs stimulated with IL-4 (n=3; mean ± s.e.m). Data are collected from three independent experiments. c, ATP production of PSAT1 wild-type or knockout BMDMs stimulated with IL-4 (n=4; mean ± s.e.m). Data are representative of two independent experiments. d, Representative histogram (left) and quantitative plot (right) of MitoTracker Green+ staining in BMDMs transduced with either retroviral expressing Luc, PHGDH or PSAT1 shRNA and stimulated IL-4 (n=3; mean ± s.e.m). Data are representative of three independent experiments. e, Representative histogram (left) and quantitative plot (right) of MitoTracker Orange+ staining in BMDMS transduced with either retroviral expressing Luc, PHGDH or PSAT1 shRNA and stimulated IL-4 (n=3; mean ± s.e.m). Data are representative of three independent experiments. f, Representative histogram (left) and quantitative plot (right) of MitoTracker Green+ staining in PSAT1 wild-type or knockout BMDMs stimulated with IL-4 (n=3; mean ± S.E.M). Data are representative of three independent experiments. g, Representative histogram (left) and quantitative plot (right) of MitoTracker Orange+ staining in PSAT1 wild-type or knockout BMDMs stimulated with IL-4 (n=3; mean ± s.e.m). Data are representative of three independent experiments. h, Immunoblot analysis of mitochondrial electron transport chain complexes from PSAT1 wild-type or knockout BMDMs stimulated with IL-4. Data are representative of two independent experiments. i, Mitochondrial calcium uptake (Rhod2) of PERK wild-type or knockout BMDMs stimulated with IL-4 (n=3; mean ± s.e.m). Arrow, stimulation using 10 μM ionomycin. Data are collected from three independent experiments. All data were analyzed using either two-tailed unpaired Student’s t-test (a,b,f,g), two-tailed paired Student’s t-test (i), or ordinary one-way ANOVA with Dunnett’s multiple comparisons test (d,e).
PERK-PSAT1 signaling facilitates epigenetic regulation
In addition to assisting mitochondrial function, SBP plays an important role in amino acid homeostasis by regulating intracellular α-KG levels for the maintenance of epigenetic modifications5,46. PSAT1 requires glutamine-derived glutamate as a substrate for a transamination reaction resulting in the production of serine as well as α-KG. In our data, we found that loss of PERK resulted in a decreased expression of glutamine and glutamate metabolism (Figure 2b,e). In support of this, we quantified the levels of intracellular glutamine and α-KG and found that PERKcKO led to a notable reduction in glutamine consumption and α-KG production in IL-4-stimulated M2 macrophages (Figure 7a,b). As expected, the cellular level of α-KG was strongly dysregulated in PSAT1-ablated M2 macrophages compared with wild-type controls as well (Figure 7c). These findings suggest that PERK fine-tunes PSAT1 activity to produce α-KG in M2 macrophages.
Figure 7. Dysregulation of SBP suppresses Jmjd3-mediated histone demethylation.

a,b, Glutamine consumption (a) and intracellular α-KG levels (b) from PERK wild-type or knockout BMDMs treated with IL-4 (n=4; mean ± s.e.m); levels from M0 are indicated by dotted horizontal line. Data are representative of two independent experiments. c, Intracellular α-KG levels from PSAT1 wild-type or knockout BMDMs treated with IL-4 (n=4; mean ± s.e.m); levels from M0 are indicated by dotted horizontal line. Data are representative of two independent experiments. d,e, Immunoblot analysis of histone methyl mark H3K27me3, PSAT1, PERK, histone H3 from PERK (d) or PSAT1 (e) wild-type and knockout BMDMs treated with IL-4. Data are representative of three independent experiments. f, H3K27me3 histone modifications of Irf4, Pparg, Phgdh and Mgl2 from PERK wild-type and knockout BMDMs stimulated with IL-4. Data are representative of three independent experiments. g,h, qRT-PCR analysis of indicated M2 genes from PERK (g) or PSAT1 (h) wild-type and knockout BMDMs cultured with IL-4 for 6 h in the presence or absence of dm-KG (1 mM) or GSK-J4 (25 μM) (n=3; mean ± s.e.m). Data are collected from three independent experiments. All data were analyzed by either two-tailed unpaired Student’s t-test (a,b,c), or ordinary one-way ANOVA with Dunnett’s multiple comparisons test (g,h).
α-KG is an essential co-factor for JMJD3 histone demethylation. Previously, JMJD3-α-KG signaling has been implicated in M2 activation in macrophages29. We therefore reasoned that the decrease in immunosuppressive M2 properties by PSAT1 and PERK-deficiencies may be due to reduced histone demethylation as a result of lower α-KG availability. Indeed, we found that histone methylation marks on H3K27 were elevated by PSAT1cKO and PERKcKO (Figure 7d,e). This hypermethylation was not due to decreased expression of Jmjd3 mRNA (Extended Data Figure 5a,b) nor protein (Extended Data Figure 5c,d). To understand whether the hypermethylation of H3K27 was specifically occurring on M2-related genes, we performed an unbiased ChIP-Seq analysis of PERK sufficient and deficient macrophages. In comparison to PERK WT macrophages, PERKcKO had significantly more regions with increased H3K27 methylation in M2 macrophages compared to M1 macrophages (Extended Data Figure 5e). As expected, we observed increased H3K27 methylation at the loci of M2 genes including Irf4, Pparg, and Mgl2 in PERK-deficient M2 cells (Figure 7f). In contrast, the H3K27 methylation state of those M2 gene promoters was unaffected in both naïve (M0) and macrophages stimulated with LPS+IFNγ (Extended Data Figure 5f). Moreover, the distributions of H3K27me3 in M1-related genes were not affected by PERK deficiency in M0, M1, or M2 conditions (Extended Data Figure 5g). We then asked whether supplementation of α-KG was able to rescue the immunosuppressive phenotype in PERK- and PSAT1-deficient M2 macrophages. We found that the expression of M2-associated genes was restored in both PSAT1cKO and PERKcKO M2 macrophages by supplementation with dm-KG (Figure 7g,h), and this phenomenon could be reversed by the inhibition of JMJD3 using a selective inhibitor GSK-J4. Collectively, our data strongly suggest that JMJD3-dependent histone modifications are important for M2 gene expression and are sensitive to the α-KG availability mediated by an unconventional PERK-PSAT1 metabolic pathway.
Inhibition of PERK signaling promotes anti-tumor immunity
To recapitulate our findings in therapeutic models, we next evaluated the anti-tumor effects of GSK2656157 (PERK inhibitor) and NCT-503 (PHGDH inhibitor) (Extended Data Figure 6a). We found that delayed tumor progression and development was observed in B16-F10 tumor bearing mice treated with both small molecule inhibitors (Figure 8a,b) and corresponded with a profound reduction in the numbers and immunosuppressive activity of intratumoral TAMs (Figure 8c,d). These treatments induced higher expansion of CD8+ and CD4+ T cells (TILs) expressing IFNγ, but this increase was only statistically significant for the GSK2656157-treated mice (Figure 8e–g). In addition, both treatments of GSK2656157 and NCT-503 had no marked impact on other tumor-infiltrating immune cell populations (Extended Data Figure 6b) but were able to significantly extend survival in tumor-bearing mice (Figure 8h). We noted that although NCT-503 was able to strikingly reduce tumor growth and weight, this treatment had much more variable effects on mouse body weight, suggesting poorer tolerance (Extended Data Figure 6c). Given that GSK2656157 appeared to have better outcomes overall, we then tested whether it could synergistically work with anti-PD-1 immunotherapy to further suppress tumor progression. We observed that GSK2656157 potentiated the anti-tumor efficacy of anti-PD-1 monoclonal antibody against B16-F10 melanoma (Extended Data Figure 6d & Figure 8i). Overall, our data demonstrate a crucial role for PERK signaling in macrophage suppressive activity and that a PERK inhibitor provides significant anti-tumor efficacy. Moreover, PERK inhibition with the combination of immune checkpoint blockade is able to reprogram the TME towards a more immunostimulatory environment leading to better cancer treatment.
Figure 8. Therapeutic PERK inhibition suppresses tumorigenesis.

a,b, Tumor growth (a) or weight (b) from mice bearing B16-F10 melanoma treated with either GSK2656157 or NCT-503. Drug administration is indicated by arrows (n=9 in vehicle, n=10 in GSK and NCT treatment groups; mean ± s.e.m). c, Absolute number of TAMs (n=7 in vehicle, n=8 in GSK and NCT treatment groups; mean ± s.e.m). d, Frequency of CD206+ TAMs (n=8; mean ± s.e.m). e,f,g, Absolute number of TILs (e), frequency of IFNγ+ CD8 (f) and IFNγ+ CD4 (g) T cells (n=7 in vehicle, n=10 in GSK and NCT treatment groups; mean ± s.e.m). h, Survival analysis of mice treated with either vehicle, GSK2656157, or NCT-503 (n=10 mice per group). i, Tumor growth from mice bearing B16-F10 melanoma and treated with either IgG2a control, αPD-1, GSK2656157, or αPD-1 + GSK2656157 (n=7 mice per group). All data were collected from two independent experiments. Data were analyzed by ordinary one-way ANOVA with Dunnett’s multiple comparisons test (a-g) or Mantel-Cox test for survival (h).
Discussion
Classical Th2 immune responses such as helminth infections are required not only to promote worm clearance but also to resolve inflammatory tissue damage47. Similarly, tumor sites, which are considered a form of chronic stress, also induce sustained inflammation48. An emerging body of research has suggested that macrophages, mediated by cellular metabolism and/or type 2 cytokines, play critical roles in orchestrating tissue inflammation during pathogenic insults49,50. Yet, the molecular drivers which contribute to the metabolic and energetic rewiring of macrophage effector function remain elusive. ER stress responses have recently emerged as a crucial regulatory process underlying multiple essential cellular functions in addition to proteostasis. Here, we found that the ER protein PERK acts as a metabolic nexus point that connects extracellular cues to intracellular reprogramming. We found that both IL-4 and the TME are initiation factors that stimulate the immunosuppressive phenotype, and these environmental cues are coordinated with and “translated” by PERK signaling to control the processes necessary for promoting the immunosuppressive activity of M2 macrophages. The metabolic pathways mediated by PERK activity could effectively result in suppressed T cell effector functions, and inhibition of PERK was able to restore the cell expansion and IFNγ production of T cells, evoking better anti-tumor immunity.
It has become evident that metabolism dictates immunity6. The widespread metabolic derailment found in PERKcKO macrophages is evidence that PERK acts as a vital metabolic hub to effectively convey the cellular signals and/or demands for effector function. Our results indicated that PERK signaling was required for mitochondrial bioenergetics, upregulating mitochondrial mass, cristae ETC activity, and calcium exchange. We found that the mitochondrial respiration and FAO critical for meeting the energy demands of M2 macrophages were mediated by PERK signaling. Moreover, activated PERK signaling induced the downstream transcription factor ATF4 to regulate PSAT1-mediated serine biosynthesis which in turn generated serine and supported mitochondrial FAO and calcium. We also found that the activity of PSAT1 produced α-KG which could then support JMJD3 in epigenetic histone modifications to promote immunosuppressive gene expression in macrophages. The necessity of these functions underlies the metabolic pathways required for macrophage M2 activation under harsh pathologic insults. Together, these data uncover an unexpected molecular interconnection between PERK and other important organelles within the macrophage, and the relationship between PERK and PSAT1-mediated serine biosynthesis provides potential strategies to reprogram or edit M2 macrophages that could benefit the treatment of cancers or other inflammatory diseases.
Previous studies have illustrated that deletion of transcription factor ATF4 affects mitochondrial respiration, glycolysis, and amino acid metabolism leading to impaired CD4+ T cell proliferation and effector function51. Additionally, defective nonessential amino acid metabolism such as serine synthesis attenuates the proliferative capacity of T lymphocytes to modulate adaptive immunity36. We have shown a previously undescribed role for activated PERK and downstream ATF4 signaling in inducing the expression of enzymes (PHGDH and PSAT1) involved in diverting intermediary metabolites from glycolysis to de novo serine biosynthesis. Perturbations of PHGDH and PSAT1 or inhibition of PERK all effectively lowered the cellular pool of serine. Additionally, genetic ablation of PSAT1 significantly decreased mitochondrial FAO and mitochondrial calcium flux in M2 macrophages. Notably, the expansion of suppressive M2 macrophages present in mice following IL-4c administration or challenge with tumor did not occur when de novo serine biosynthesis was inhibited. This finding may reflect reduced proliferation and function of these cells due to diminished essential macromolecule biosynthesis and mitochondrial FAO supported by the serine metabolic program38,45.
Glutamine-derived glutamate can contribute to the production of glycine via the serine synthesis pathway and through the transamination of 3-phosphohydroxypurvate to phosphoserine by PSAT1. Reports have indicated that PSAT1 governs the intracellular levels of serine/glycine and α-KG and is a metabolic vulnerability in cancer cells52–54. Our genetic PERK- and PSAT1-deficient models provide a unique avenue to explore these metabolic dynamics in macrophages. We found that M2 activation was associated with increased levels of glutamine/glutamate metabolism, and glutamine utilization was markedly diminished by PERK ablation. Importantly, inhibition of PSAT1 or PERK significantly reduced the cellular concentrations of α-KG in M2 macrophages. α-KG is not only known to support the activity of the Krebs cycle55, but also serves as an essential co-factor for the histone demethylase JMJD3. JMJD3 has been previously found to promote immune cell functionality31,56; thus, loss of α-KG potentially prevented the activity of JMJD3 resulting in hypermethylation of histone H3K27. It is also likely that α-KG can mediate the activity of other epigenetic regulators such as Ten-Eleven Translocation (TET) enzymes to control immune cell fate5. It has been reported that the activity of TET2 is important to repress proinflammatory activity in macrophages57, and loss of TET2 fails to promote/sustain the immunosuppressive function of macrophages in the TME58. Nevertheless, our results suggest that the cellular production of α-KG is necessary for the metabolic reprogramming and epigenetic modification of M2 macrophages and is, in part, mediated by PERK-PSAT1 signaling.
The relationship between PERK and PSAT1 suggests that this would make an effective therapeutic target against melanoma. We found that treatment of melanoma with GSK2656157 or NCT-503 markedly delayed tumor growth and suppressed the immunosuppressive activation of TAMs. However, only GSK2656157 was able to further enhance T cell anti-tumor immunity as demonstrated by increased IFNγ+ tumor-infiltrating T lymphocytes. GSK2656157 was also able to boost the efficacy of anti-PD-1 immunoblockade and confer protection against melanoma. Collectively, our study provides a novel role for PERK in the regulation of metabolic circuits and epigenetic regulation that support immunosuppressive M2 activation and function in macrophages. Our findings suggest that modulation of PERK signaling may offer therapeutic potential in diseases in which immunosuppressive M2 macrophages have deleterious effects.
Methods
Animals and in vivo experiments
C57BL/6J, LysMCre, and Gcn2−/− mice were purchased from Jackson Laboratory. Psat1tm1a(KOMP)Wtsi/Mmucd (Psat1fl/fl) mice were purchased from the MMRCC. Eif2ak3fl/fl and OT-I mice were provided by Drs. S. Adoro and A. Huang, respectively. All mice were bred and maintained in specific pathogen free conditions under protocols approved by the institutional animal care at Case Western Reserve University School of Medicine, and both male and female mice were used at 8-12 weeks of age. For IL-4c experiments, age and sex-matched C57BL/6J or PERK wild-type or PERKcKO mice were injected i.p. with or without 30 mg/kg NCT-503 (Cayman Chemical), and with 300 μl of 3% thioglycollate (Sigma-Aldrich) immediately prior to IL-4 complexed to mAb anti-IL-4 (IL-4c; containing 5 μg of IL-4, PeproTech, and 25 μg of anti-IL-4 clone 11B11, BioXcell)59. For all tumor experiments, 5 x 10⁵ B16-F10 melanoma cells were subcutaneously transplanted into age and sex-matched mice as described. Tumors were measured every 2 days using calipers starting at day 7 post tumor injection until day 15, 16, or 18. Tumor volume was calculated using the formula [(length x width x (length x width)0.5] x π/6. For the therapeutic drug treatment: mice were given i.p. injection of either 100 μl DMSO, 30 mg/kg GSK2656157 (Selleck Chem) and 30 mg/kg NCT-503 (Selleck Chem) on day 8, 10, and 12 post tumor injection. Tumors were measured every 2 days starting at day 8 and until day 16. Maximal tumor size cut-off was determined to be 2 cm for non-endpoint studies. For the Anti-PD-1 tumor experiment: mice were given either control 200 μg per mouse IgG2a (Lienco Technologies), 200 μg per mouse anti-PD-1 (Lienco Technologies), 30 mg/kg GSK2656157, or combination therapy of anti-PD-1 plus GSK2656157 on day 8, 10, and 12 post tumor injection. Tumors were measured every 2 days starting on day 8 until day 18.
Cell lines
B16-F10 (CRL-6475) melanoma and LL/2 (LLC; CRL-1642) Lewis lung carcinoma cell lines were purchased from ATCC and maintained using complete medium (RPMI 1640 containing 2 mM L-glutamine, 100 U/mL penicillin/streptomycin, and 10% FBS). Cell lines were passaged for a maximum of 20 passages.
Tumor digestion and cell isolation
Tumors were minced in RPMI with 2% FBS, DNase I (1 μg/ml, Sigma-Aldrich) and collagenase (1 mg/ml, Sigma-Aldrich), followed by digestion at 37 °C for 1 h and filtration through a 45-μm cell strainer. Filtered cells were incubated with ACK Lysing Buffer (Thermo-Fisher) to lyse red blood cells and then washed with FACS buffer (PBS + 1% FBS + 0.1% sodium azide). Leukocytes enrichment was performed by density gradient centrifugation (800 g, 30 min) at 25 °C with 40% and 80% percoll (GE Healthcare).
Preparation of macrophages from bone marrow and macrophage activation
Bone marrow cells were differentiated in the presence of recombinant mouse M-CSF (20 ng/ml; PeproTech) in complete medium (RPMI 1640 containing 10 mM glucose, 2 mM L-glutamine, 100 U/mL of penicillin/streptomycin and 10% FBS) for 7 days. Fresh complete medium with M-CSF was supplemented on day 6 prior to use. Day 7 macrophages were washed and variously stimulated with IL-4 (20 ng/ml; PeproTech) or LPS (20 ng/ml; Sigma-Aldrich) plus IFNγ (50 ng/ml; PeproTech) in the absence or presence of 5 μM GSK2656157 (Cayman Chemical), 30 μM CBR-5884 (Cayman Chemical), or 5 μM ISRIB (Cayman Chemical). Macrophages were harvested after 24 h and analyzed by flow cytometry for the expression of M2 or M1 activation. For tumor co-culture experiments, macrophages and tumor cells were collected on day 7. Tumor cells were plated at a density of 5-6 x 10⁵ in a 12-well plate for at least 1 h prior to addition of macrophages. Once tumor cells were attached, 2 x 10⁵ macrophages were added to each well for 72 h. For some experiments, macrophages were cultured with IL-4 in the presence of absence of 1 mM dimethyl-α-KG (dm-KG; Sigma-Aldrich) or 25 μM GSK-J4 (Selleck Chem) for 6 h, and cells were harvested for the further experiments as indicated.
In vitro T cell proliferation assay
Mouse splenic CD8+ T cells from OT-I mice were isolated using EasySep Mouse CD8α Positive Selection Kit (STEMCELL Technologies). Isolated OT-I T cells were labeled with CellTrace Violet (CTV) Cell proliferation Kit (Thermo Fisher) manufacturer instruction. The CTV-labeled CD8+ T cells (0.5 x 10⁵ per well) were cultured in plate-bound 1 μg/ml anti-CD3 (clone 145-2C11; Thermo Fisher) and 5 μg/ml anti-CD28 (Clone 37.51; Thermo Fisher) with complete RPMI media containing 55 μM β-mercaptoethanol and 10 ng/ml IL-2. IL-4 or LPS+IFNγ stimulated macrophages were then added into T cell cultures with ratio 1:10 (macrophages:T cells) for 72 h. Cells were then harvested and CTV positive signal in the CD8+ gate was measured by flow cytometry.
Flow Cytometry
For surface staining, cells were kept at 4°C and blocked with 5 μg/ml of anti-CD16/32 (clone 93; eBiosciences) before staining to CD45 (clone 30-F11; BioLegend), Gr1 (clone 8C5; BioLegend), CD3 (clone 17A2; eBioscience), CD3 (clone 145-2C11; BioLegend), CD4 (clone GK1.5; BioLegend), CD8 (clone 53-6.7; BioLegend), CD19 (clone 6D5; BioLegend), F4/80 (clone BM8; BioLegend & eBiosciences), CD11b (clone M1/70; BioLegend & eBiosciences), CD206 (clone C068C2; BioLegend), CD301 (clone ER-MP23; Bio-Rad), PD-L2 (clone TY25, eBiosciences). For intracellular staining of Relmα (PeproTech), Ki67 (eBioscience), NOS2 (clone C-11; Santa Cruz), TNF (clone MP6-XT22; BioLegend) or p-PERK(T980) (Bioss), cells were fixed with BD Cytofix/Cytoperm buffer (BD Biosciences), and stained with appropriate primary Ab followed by incubation with appropriate fluorochrome-conjugated anti-rabbit IgG (Jackson Immunoresearch) or anti-mouse IgG (clone Poly4053; BioLegend). For IFNγ staining, cells were cultured in complete RPMI medium containing phorbol 12-myristate 13-acetate (PMA; 50 ng/ml; Sigma-Aldrich), ionomycin (750 ng/ml; Sigma-Aldrich) and GolgiStop (1000X; BD Biosciences) for 4 h at 37°C. After surface staining, the cells were fixed using BD Cytofix/Cytoperm buffer and stained with IFNγ antibody (clone XMG1.2; BioLegend). Lipid uptake was stained with 1 μM BODIPY FL C16 (Invitrogen) and measured by flow cytometry. Intracellular neutral lipids were stained with 500 ng/ml BODIPY 493/503 (Invitrogen) and measured by flow cytometry. Mitochondrial mass and membrane potential were stained with 50 nM MitoTracker Green (Invitrogen) and 50 nM MitoTracker Oranage (Invitrogen) respectively and measured by flow cytometry.
Retroviral transduction
Retroviral transduction of macrophages was accomplished using protocols that we have used previously24. Sequences for luciferase and for Phgdh, Psat1, and Atf4 short hairpin RNAs (shRNA) were obtained from Open Biosystems and cloned into the MSCV-LTRmir30-PI8 retroviral vector, encoding human CD8 (huCD8) as a reporter. For overexpression, Atf4 sequence was cloned into MSCV-IRES retroviral vector, encoding huCD8 as a reporter. Day 3 bone marrow macrophage cultures were spin infected with retrovirus. At day 7 of culture, macrophages were harvested and transduced cells were identified by huCD8 expression.
Cell fractionation and Immunoblot analysis
Cells were lysed in RIPA buffer (Thermo Fisher) with protease and phosphatase inhibitors (Cell Signaling Technologies). Anti-PERK (C33E10), anti-PHB1, anti-XBP1s (E9V3E), anti-Tri-Methyl-Histone H3 Lys27 (C36B11), and anti-Histone H3 (D1H2) were all purchased from Cell Signaling Technologies. Polyclonal antibody p-PERK(T980) was purchased from Bioss (BS-3330R). Anti-JMJD3 was purchased from Abcepta. Anti-PHGDH and anti-PSAT1 antibodies were purchased from Protein Tech. Total OXPHOS rodent antibody cocktail was purchased from Abcam. Anti-ATF4 (C-20) was purchased from Santa Cruz Biotechnology. Anti-β-Actin was purchased from Sigma-Aldrich. Primary antibody staining was followed by peroxidase-linked secondary antibody and ECL immunoblot detection (Bio Rad). Immunoblots for p-PERK(T980) and PERK was performed using a phos-tag-based acrylamide gel (FUJIFILM Wako Chemicals).
RNA extraction and qRT-PCR.
RNA was extracted using TRIzol reagent (Life Technologies). Complementary DNA was generated using PrimeScript RT Reagent Kit with gDNA Eraser (Takara Bio) according to manufacturer’s instruction. TaqMan or SYBR green method was used for real-time PCR with primers from Applied Biosystems or IDT. The assay was performed on a BioRad CFX96 machine (BioRad). Relative expression was normalized by β-actin in each sample. The following primer sequences were used: For SYBR green, β-actin (Forward - 5’ TCCATCATGAAGTGTGACGT 3’; Reverse - 5’ TACTCCTGCTTGCTGATCCAC 3’), Atf4 (Forward - 5’ GCAAGGAGGATGCCTTTT C 3’; Reverse - 5’GTTTCCAGGTCATCCATTCG 3’), Phgdh (Forward - 5’ TGGCCTCGGCAGAATTGGAAG 3’; Reverse - 5’ TGTCATTCAGCAAGCCTGTGGT 3’), and Psat1: Forward - 5’ GATGAACATCCCATTTCGCATTGG 3’; Reverse - 5’ GCGTTATACAGA GAGGCACGAATG 3’). For TaqMan, β-actin (mm00607939_s1), Arg1 (mm00475988_m1), Cd36 (mm00432399_m1), Chil3 (mm00657889_mH), Lipa (mm00498820_m1), Mrc1 (mm00485148_m1), Pparg (mm01184322_m1), Ppargc1b (mm00504723_m1), Irf4 (mm00516431_m1).
Metabolic analysis
For real-time analysis of extracellular acidification rates (ECAR) and oxygen consumption rates (OCR), macrophages were analyzed using an XFe96 Extracellular Flux Analyzer (Agilent). Three or more consecutive measurements were taken under basal conditions followed by the sequential addition of 1 μM oligomycin to inhibit the mitochondrial ATP synthase, 3 μM fluoro-carbonyl cyanide phenylhydrazone (FCCP), a protonophore, which uncouples ATP synthesis from oxygen consumption by the electron transport chain, and 100 nM rotenone plus 1 μM antimycin A (Rot/Ant; all drugs for this assay were purchased from Sigma-Aldrich), which inhibit the electron transport chain. In this assay, basal oxygen consumption can be established by measuring OCR in the absence of drugs. ATP production was measured using the ATP Determination Kit (Invitrogen). Glutamine consumption was measured using the Glutamine Assay Kit (Abnova). Serine and α-KG levels were measured using the DL-Serine Assay Kit or the Alpha Ketoglutarate Assay Kit following manufacturer instruction (Abcam). Metabolite levels of cholesterol, 3-PG, serine, and glycine in stimulated macrophages was performed by Metabolon, Durham, NC.
Calcium flux analysis
Cells were washed with calcium flux buffer (1x HBSS, 0.1% BSA, 25 mM HEPES pH 7.4, and 2.5 mM Probenecid). Cells were incubated with 1 μM Rhod-2 (Thermo-Fisher) in calcium flux buffer in the dark for 30 min at 37°C. After incubation, cells were washed with calcium flux buffer and incubated for an additional 5 min in calcium flux buffer without Rhod-2 at 37°C. Rhod2 was measured using a BioTek Gen5 plate reader. Following 5 mins of baseline reading, Rhod-2 loaded cells were stimulated with 10 μM ionomycin. Calcium flux measurements were taken every 30 seconds until plateau was reached (approximately 20 min).
RNA-sequencing and bioinformatics analysis
mRNA was extracted from lysates of cells that had been stimulated for 24 h. Random primers and reverse transcriptase of TruSeq® Stranded kit were used to synthesize cDNA, and cDNA library sequencing was performed using Illumina HiSeq. The differential expression test, gene set enrichment analysis (GSEA) and visualization were performed by using R (v.5.2.0), ggplot2 (v3.2.1), edgeR (v.3.32.1), pheatmap (v.1.0.12), clusterProfiler (v.3.10), and MSigDB (v.7.0).
Targeted metabolomics analysis
Sample preparation -
Cell culture was extracted by the addition of MeOH:H2O (4:1) (1 mL)60,61. This solution containing scraped lysed cells was further homogenized in the Cryolys Precellys 24 sample Homogenizer (2 x 20 seconds at 10000 rpm, Bertin Technologies, Rockville, MD, US) with ceramic beads. Homogenized extracts were centrifuged for 15 mins at 4000 g at 4°C and the resulting supernatant was collected and evaporated to dryness in a vacuum concentrator (LabConco, Missouri, US). Dried sample extracts were resuspended in MeOH:H2O (4:1, v/v) prior to LC-MS/MS analysis according to the total protein content, using 75 μL as the minimal reconstitution volume corresponding to the sample with the lowest protein content.
Liquid chromatography -
tandem mass spectrometry analysis (LC-MS/MS). Cell lysates were analyzed by Hydrophilic Interaction Liquid Chromatography coupled to tandem mass spectrometry (HILIC - MS/MS) in both positive and negative ionization modes using a 6495 triple quadrupole system (QqQ) interfaced with 1290 UHPLC system (Agilent Technologies)62. In positive mode, the chromatographic separation was carried out in an Acquity BEH Amide, 1.7 μm, 100 mm × 2.1 mm I.D. column (Waters, Massachusetts, US). Mobile phase was composed of A = 20 mM ammonium formate and 0.1 % FA in water and B = 0.1 % formic acid in ACN. The linear gradient elution from 95% B (0-1.5 min) down to 45% B was applied (1.5 min -17 min) and these conditions were held for 2 min, followed by 5 min of column re-equilibration at the initial gradient conditions. The flow rate was 400 μL/min, column temperature 25 °C and sample injection volume 2 μl. In negative mode, a SeQuant ZIC-pHILIC (100 mm, 2.1 mm I.D. and 5 μm particle size, Merck, Damstadt, Germany) column was used. The mobile phase was composed of A = 20 mM ammonium Acetate and 20 mM NH4OH in water at pH 9.7 and B = 100% ACN. The linear gradient elution from 90% (0-1.5 min) to 50% B (8-11 min) down to 45% B (12-15 min) was applied, followed by 9 min post-run for column re-equilibration. The flow rate was 300 μL/min, column temperature 30 °C and sample injection volume 2 μl. For both analyses, the ESI source conditions were set as follows: dry gas temperature 290°C, nebulizer 35 psi and flow 14 L/min, sheath gas temperature 350 °C and flow 12 L/min, nozzle voltage 0 V, and capillary voltage ±2000 V. Data were acquired in dynamic Multiple Reaction Monitoring (dMRM) mode with a total cycle time of 600 ms. Pooled QC samples (representative of the entire sample set) were analyzed periodically throughout the overall analytical run in order to assess the quality of the data, correct the signal intensity drift and remove the peaks with poor reproducibility (CV > 30%)63. In addition, a series of diluted quality controls (dQC) were prepared by dilution with methanol: 100% QC, 50%QC, 25%QC, 12.5%QC and 6.25%QC and analyzed at the beginning and at the end of the sample batch. This QC dilution series served as a linearity filter to remove the features which don’t respond linearly or correlation with dilution factor is < 0.6564.
Data processing and statistical analysis -
Raw LC-MS/MS data were processed using the Agilent Quantitative analysis software (version B.07.00, MassHunter Agilent technologies). Relative quantification of metabolites was based on EIC (Extracted Ion Chromatogram) areas for the monitored MRM transitions. Data quality assessment was done in R (http://cran.r-project.org/). Signal intensity drift correction was done within the LOWESS/Spline algorithm65 followed by filtering of “not-well behaving” peaks (CV (QC peaks) > 30% & R2 (QC dilution curve) < 0.75).
Transmission electron microscopy
For transmission electron microscopic (TEM) analysis, cells were seeded onto 6-well plates with 12 mm diameter inserts (Corning Snapwell inserts) at a density of 1-2 x 10⁵ cells per well. Cells were stimulated as described previously. After 24 h, the membrane filter with their attached cells was immersed in fixative. The initial fixative was 2.5% glutaraldehyde in cacodylate buffer (pH 7.3). The specimen was postfixed in ferrocyanide-reduced 1% osmium tetroxide. After a soak in acidified uranyl acetate, the specimen was dehydrated in ethanol, passed through propylene oxide, and embedded in Embed-812 (Electron microscopy Sciences, Hatfield, PA). Thin sections (70 nm) were cut on a RMC MT6000-XL ultramicrotome. Sections were cut in a horizontal plane parallel to that of the membrane to provide panoramic views of the cells. These were mounted on Gilder square 300 mesh nickel grids (Electron Microscopy Sciences, PA) and then sequentially stained with acidified methanolic uranyl acetate and stable lead staining solution. These were coated on a Denton DV-401 carbon coater (Denton Vacuum LLC, NJ), and were examined in a FEI Tecnai Spirit (T12) with a Gatan US4000 4kx4k CCD.
Chromatin immunoprecipitation and sequencing (ChIP-Seq)
Five million cells were fixed with 1% formaldehyde in media at 1x10⁶ cells/mL for 10 min at room temperature with constant agitation. Fixation was stopped and quenched with 125 mM glycine for 5 min on ice. After one wash with PBS, cell pellets were snap-frozen with liquid nitrogen and store at −80°C until nuclei preparation. Nuclei were isolated using Lysis buffer (50 mM HEPES pH 7.5, 140 mM NaCl, 1 mM EDTA, 10% glycerol, 0.5% NP40, 0.25% Triton X-100) and were washed once with Wash buffer (10 mM Tris-HCl pH 8.0, 200 mM NaCl, 1 mM EDTA, 0.5 mM EGTA). The pellets were resuspended with Shearing buffer (10 mM Tris-HCl pH 8.0, 1 mM EDTA, 0.1% SDS) and the chromatin were sheared using BioruptorPico (Diagenode) for 14 cycles (30s on; 30s off) at 4°C. 2.5 μg chromatin was diluted to a final of 300 μL RIPA buffer (50 mM Tris-HCl pH 8.0, 150 mM NaCl, 1 mM EDTA, 1% NP40, 0.1% SDS, 0.5% sodium deoxycholate) and incubated with 2.5 μg rabbit monoclonal anti-H3K27me3 antibody (Cell Signaling Technologies, clone C36B11, lot 19) overnight at 4°C with constant rotation. For immunoprecipitation, the samples were incubated with 10μL pre-cleared Protein A Magnetic Beads (ThermoFisher) for 2h at 4°C. The beads were washed twice with RIPA buffer, once with High salt buffer (50 mM Tris-HCl pH 8.0, 500 mM NaCl, 1 mM EDTA, 1% NP40, 0.1% SDS), once with LiCl buffer (50 mM Tris-HCl pH 8.0, 250 mM LiCl, 1 mM EDTA, 1% NP40, 1% sodium deoxycholate), and finally once with TE buffer (10 mM Tris-HCl pH 8.0, 1mM EDTA). All washes were incubated for 5 mins at 4°C with constant rotation. After last wash, beads were resuspended with 200 μL elution buffer (100 mM NaHCO3, 1% SDS) with 0.5 mg/mL RNaseA (Qiagen), and incubated at 65°C on a thermoshaker for 20 min at 1200 rpm. For decrosslinking, proteinase K (0.5 mg/mL; Ambion) and NaCl (200 mM) were added into the eluted samples and incubated in thermocycler at 65°C overnight. The samples were purified by using Zymo PCR purification kit (Zymo). Sequencing libraries were prepared using NEB Ultra II kits according to the standard protocol (NEB). Samples were sequenced with a Illumina Novaseq 6000 at 50bp paired-end with a SP flow cell (Nationwide Children Hospital, Columbus, OH).
Bioinformatics analysis of ChIP-Seq
Pair-ended reads were first analyzed using FastQC and then mapped to mm10 mouse reference genome GRCm38 (Dec. 2011) using Bowtie 2 (v2.4.2). Samtools was used to remove unaligned and duplicated reads. Peaks were called using HOMER and the reads overlapped with the mm10 blacklisted regions (ENCODE 2016) were removed. Bigwig files were generated using Deeptools (v3.5.1) with the command bamCoverage (--normalizeUsing RPKM). Count matrix was generated using DiffBind (v2.0.2) (22217937) dba count with normalization DBA_SCORE_TMM_MINUS_EFFECTIVE. The differential H3K27me3-enriched regions between were determined using edgeR in DiffBind with a cutoff of P equal or lower than 0.01. Heatmaps were generated using Deeptools.
Data analysis and statistics
Data were analyzed using Graphpad Prism (v9). Comparisons for three or more groups were calculated using One-way ANOVA and, where indicated, unpaired or paired two-tailed Student’s t-tests. Differences were considered significant when P-values were below 0.05. Pilot in vivo studies were used for estimation of the sample size required to ensure adequate power. No statistical methods were used to predetermine sample size, but our sample sizes are similar to those reported in previous publications66. Data distribution was assumed to be normal but this was not formally tested. Age and sex-matched animals were randomly assigned to experimental conditions. Data collection and analysis were not performed blind to the conditions of the experiments. No data exclusion was performed.
Data availability
RNA-Seq and ChIP-Seq results are available in the Gene Expression Omnibus database under accession code GSE165836 and GSE183287, respectively. Other data available upon request to corresponding author. Source data are provided with this paper.
Extended Data
Extended Data Figure 1. PERK deficiency does not affect M1 activation.

a, Enrichment plot of endoplasmic reticulum (ER) stress genes in IL-4c treated mouse peritoneal macrophages compared with naïve (PBS) macrophages by GSEA analysis. b, GSEA result comparing ER stress genes between TAMs and non-tumor macrophages from patients with lung carcinoma. c, Pearson correlation of TAM CD68 expression with genes encoding molecules involved in the PERK pathway in cancer patients from the TCGA. d, Immunoblots of p-PERK, PERK, and β-actin from BMDMs stimulated with IL-4, Thapsigargin, or phosphatase. Ratio of p-PERK to total PERK was determined using ImageJ. Data are representative of three independent experiments. e, Geometric MFI of p-PERK+ in BMDMs stimulated with IL-4 or Thapsigargin (n=3; mean ± s.e.m). Data are collected from three independent experiments. f, Percentage of CD206+CD301+ in BMDMs treated with either DMSO (vehicle), IL-4, or Thapsigargin (n=3; mean ± s.e.m). Data are collected from three independent experiments. g, Expression of CD206 and CD301 from BMDMs treated with IL-4 (M2) in the presence or absence of GSK2656157 (n=3; mean ± s.e.m). Data are representative of three independent experiments. h, Percentage of 7AAD− naïve BMDMs isolated from Eif2ak3fl/fl or Eif2ak3fl/fl x LysMCre mice (n=6; mean ± s.e.m). Data are collected from six independent experiments. i, Immunoblots of PERK, iNOS, Arg1, and β-actin from PERK wild-type and deficient BMDMs treated with LPS plus IFNγ (M1), IL-4 (M2), or Thapsigargin. Data are representative of two independent experiments. j-l, Representative histogram (left) and quantitative plot (right) of iNOS (j), TNF (k), or expression of CD206 and CD301 (l) in BMDMs stimulated with LPS plus IFNγ (M1) or IL-4 (M2) (n=3; mean ± s.e.m). Data are representative of three independent experiments. m, Immunoblots of p-PERK, PERK, XBP1s, and β-actin in unstimulated (M0), LPS+IFNγ (M1), or IL-4 (M2) stimulated BMDMs; data are representative of three independent experiments. All data were analyzed using two-tailed unpaired Student’s t-test (e,g,j,j,k,l) or one-way ANOVA with Tukey’s multiple comparisons test (f).
Extended Data Figure 2. ISR in macrophage activation and metabolism.

a,b, Expression of CD206, CD301 (a), PD-L2 and Relmα (b) in macrophages stimulated with IL-4 in the presence or absence of ISRIB (n=3; mean ± s.e.m). Data is representative of three independent experiments. c, Representative histogram (left) and quantitative analysis (right) of iNOS expression in macrophages stimulated with LPS+IFNγ in the presence or absence of ISRIB (n=3; mean ± s.e.m). Data is representative of three independent experiments. d, Expression of genes associated with ISR, assessed by RNA-Seq analysis. e,f, Expression of CD206, CD301 (e), PD-L2 and Relmα (f) in Gcn2+/+ and Gcn2−/− macrophages in the presence or absence of IL-4 (n=3; mean ± s.e.m). Data is representative of two independent experiments. g,h, Representative histograms (left) and quantitative analysis (right) of iNOS (g) or TNF (h) in Gcn2+/+ and Gcn2−/− macrophages in the presence or absence of LPS+IFNγ (n=3; mean ± s.e.m). Data is representative of two independent experiments. i,j, Basal OCR (i) and ECAR (j) of Gcn2+/+ and Gcn2−/− M0, M1, and M2 macrophages (n=3; mean ± s.e.m). Data is representative of two independent experiments. k, Basal OCR of M0 and M2 BMDMs in the presence or absence of ISRIB (n=3; mean ± s.e.m). Data is representative of two independent experiments. l, Intracellular serine content from M0, M1 and M2 macrophages in the presence of absence of ISRIB (n=3; mean ± s.e.m). Data is representative of two independent experiments. All data were analyzed using two-tailed unpaired Student’s t-test (a,b,c,e,f,g,h,I,j,k,l).
Extended Data Figure 3. Pharmacological inhibition of PERK deviates cellular metabolism in M2 macrophages.

a, Basal OCR of naïve (M0) and M1 (LPS+IFNγ) BMDMs from PERK sufficient or deficient mice (n=3; mean ± s.e.m). Data collected from three independent experiments. b, Basal ECAR of naïve (M0), M1 (LPS+IFNγ), and M2 (IL-4) BMDMs from PERK wild-type or null animals (n=3; mean ± s.e.m). Data are collected from three independent experiments. c,d,e Basal OCR (c), ECAR (d), or ATP production (e) from wild-type BMDMs treated with IL-4 in the presence or absence of GSK2656157 (n=3; mean ± s.e.m). Dashed line indicates wild-type M0. Data are collected from three independent experiments. f, Representative histogram (left) and quantitative analysis (right) of BODIPY FL C16 staining in BMDMs treated with IL-4 in the presence or absence of GSK2656157 (n=3; mean ± s.e.m). Data representative of three independent experiments. g, Representative histogram (left) and the frequency (right) of BODIPY (493/503) staining in BMDMs stimulated with IL-4 in the presence or absence of GSK2656157 (n=3; mean ± s.e.m). Data representative of three independent experiments. h, Representative TEM images of PERK wild-type and PERKcKO M2 (IL-4) macrophages. Red arrows indicate mitochondria. Data representative of three biological replicates. i, Representative histogram (left) and the frequency (right) of MitoTracker Green+ staining in BMDMs treated IL-4 (n=3; mean ± s.e.m). Data representative of three independent experiments. j, Representative histogram (left) and the frequency (right) of MitoTracker Orange+ staining in BMDMs treated with IL-4 (n=3; mean ± s.e.m). Data representative of three independent experiments. k, RNA-seq analysis of genes associated with mitochondrial calcium transport. l, Mitochondrial calcium flux (Rhod-2) from BMDMs treated with IL-4 in the presence or absence of GSK2656157 was determined and normalized by wild-type naïve M0 macrophages. Arrow, stimulation using 10 μM ionomycin (n=6 for wild-type M0 and M2; n=4 for GSK-treated cells; mean ± s.e.m). Data are representative of three independent experiments. All data were analyzed using two-tailed unpaired Student’s t-test (a,b,c,d,e,f,g,i,j,l) or two-tailed paired Student’s t-test (l).
Extended Data Figure 4. Inhibition of PHGDH or PSAT1 impairs M2 macrophage function.

a, Expression of genes encoding the serine one-carbon metabolic pathway in naïve (M0), M1 (LPS+IFNγ), or M2 (IL-4) macrophages, assessed by RNA-Seq analysis. b,c, Immunoblot analysis of PHGDH, PSAT1 and β-actin in BMDMs transduced with either retrovirus expressing Luc (b,c), PHGDH (b) or PSAT1 (c) shRNA and stimulated with IL-4. Data are representative of three independent experiments. d,e, Expression of CD206, CD301, PD-L2 and Relmα by IL-4 stimulated BMDMs treated with CBR-5884 (d) or transduced with PHGDH shRNA (e; middle), or transduced with PSAT1 shRNA (e; bottom) (n=3; mean ± s.e.m). Data are representative of three independent experiments. f, Expression of CD206 and CD301 in M0 or LPS+IFNγ (M1) stimulated BMDMs from Psat1fl/fl or Psat1fl/fl x LysMCre mice (n=3; mean ± s.e.m). Data are representative of three independent experiments. g, Relative histogram (left) and gMFI (right) of either naïve (M0) or M1 macrophages from PSAT1 wild-type and knockout mice (n=3; mean ± s.e.m). Data are representative of three independent experiments. h,i, Basal OCR and ECAR of wild-type BMDMs treated with IL-4 in the presence or absence of CBR-5884 (h) or transduced with shRNA targeting Phgdh or Psat1 (n=3; mean ± s.e.m) (i). Data are collected from three independent experiments. j, ATP production from BMDMs stimulated with IL-4 in the presence or absence of CBR-5884 (n=3; mean ± s.e.m). All data were analyzed using two-tailed unpaired Student’s t-test (d,f,g,h,j), or ordinary one-way ANOVA with Dunnett’s multiple comparisons test (e,i).
Extended Data Figure 5. Loss of PERK does not result in H3K27m3 histone hypermethylation in pro-inflammatory M1 genes.

a,b, qRT-PCR analysis of Jmjd3 expression from PERK wild-type/knockout (a), or PSAT1 wild-type/knockout (b) BMDMs stimulated with IL-4 (n=2; mean ± s.e.m). Data are collected from two independent experiments. c,d, Immunoblots of PERK, Jmjd3 and β-actin in M0, M1, and M2 BMDMs from PERK wild-type and knockout mice (c) or from PSAT1 wild-type and knockout mice (d). Data are representative of two independent samples. e, Changes in gene expression of targets associated with H3K27me3 from PERK wild-type or knockout BMDMs stimulated with IL-4 (M2; left) or LPS+IFNγ (M1; right). f, H3K27me3 histone modifications of Irf4, Pparg, Phgdh and Mgl2 from PERK wild-type and knockout BMDMs in the presence or absence of LPS+IFNγ. g, H3K27me3 histone modifications of selected genes associated with pro-inflammation from naïve (M0), LPS+IFNγ (M1) or IL-4 (M2) stimulated PERK wild-type or knockout macrophages. All data were analyzed using two-tailed unpaired Student’s t-test (a,b).
Extended Data Figure 6. Therapeutic PERK inhibition in mouse melanoma model.

a, Schematic of the experimental design for small molecule inhibitor treatments. b, Frequency of tumor-infiltrating immune cells (TAMs, TILs, DCs, MDSCs, and NK cells) from B16-F10 tumor-bearing mice with treatment of either DMSO (Vehicle), GSK2656157, or NCT-503. Tumors were harvested on day 16. (n=10 mice per group; mean ± s.e.m). Data are collected from two independent experiments. c, Body weight of tumor-bearing mice given the indicated treatments (n=9 mice per group; mean ± s.e.m). Data are collected from two independent experiments. d, Schematic of the experimental design for the treatment of αPD-1, GSK2656157, and αPD-1 + GSK2656157. Data were analyzed by ordinary one-way ANOVA with Dunnett’s multiple comparisons test (b,c).
Acknowledgements
We would like to thank Drs. S. Adoro and A. Huang for providing Eif2ak3fl/fl and OT-I mice, respectively. We thank Drs. A. Huang, S. Adoro, and G. Dubyak for helpful discussions, and Dr. H. Fujioka from the Cleveland Center for Membrane and Structural Biology for expert technical assistance. All individuals above are affiliated with Case Western Reserve University. L.N.R is supported by the Immunology T32 Training Program (AI089474). P.-C.H. is supported in part by postdoctoral fellowship provided by Ministry of Science and Technology (MOST) Taiwan. C.-W.J.L. is funded by NIH National Cancer Institute K22 award (K22CA241290), and startup funds from the Department of Microbial Infection and Immunity and Pelotonia Institute of Immuno-oncology at the Ohio State University. J.I. is supported by UNIL interdisciplinary grant. P.-C.H. is funded by the European Research Council Staring Grant (802773-MitoGuide), SNSF project grants (31003A_182470), the Cancer Research Institute (CLIP investigator award and Lloyd J. Old STAR award), and UNIL interdisciplinary grant. S.C.-C.H. is funded by the Cancer Research Institute CLIP Investigator Award, the VeloSano Pilot Award, Case Comprehensive Cancer Center American Cancer Society Pilot Grants (IRG-91-022-19, IRG-16-186-21), Case GI SPORE DRP Grant (5P50CA150964-08), and the Cleveland Digestive Research Core Center Pilot Grant (1P30DK097948).
Footnotes
Competing financial interests
P.-C.H. is a member of scientific advisory for Elixiron Immunotherapeutics. The remaining authors declare no competing interests.
References
- 1.Wynn TA, Chawla A & Pollard JW Macrophage biology in development, homeostasis and disease. Nature 496, 445–455 (2013). [DOI] [PMC free article] [PubMed] [Google Scholar]
- 2.McNelis JC & Olefsky JM Macrophages, Immunity, and Metabolic Disease. Immunity 41, 36–48 (2014). [DOI] [PubMed] [Google Scholar]
- 3.Murray PJ Macrophage Polarization. Annu Rev Physiol 79, 541–566 (2017). [DOI] [PubMed] [Google Scholar]
- 4.Etchegaray J-P & Mostoslavsky R Interplay between Metabolism and Epigenetics: A Nuclear Adaptation to Environmental Changes. Molecular Cell 62, 695–711 (2016). [DOI] [PMC free article] [PubMed] [Google Scholar]
- 5.Lio CJ & Huang SC Circles of Life: linking metabolic and epigenetic cycles to immunity. Immunology 161, 165–174 (2020). [DOI] [PMC free article] [PubMed] [Google Scholar]
- 6.Buck MD, Sowell RT, Kaech SM & Pearce EL Metabolic Instruction of Immunity. Cell 169, 570–586 (2017). [DOI] [PMC free article] [PubMed] [Google Scholar]
- 7.Li X et al. Navigating metabolic pathways to enhance antitumour immunity and immunotherapy. Nat Rev Clin Oncol 16, 425–441 (2019). [DOI] [PubMed] [Google Scholar]
- 8.Bettigole SE & Glimcher LH Endoplasmic Reticulum Stress in Immunity. Annu Rev Immunol 33, 1–31 (2015). [DOI] [PubMed] [Google Scholar]
- 9.Grootjans J, Kaser A, Kaufman RJ & Blumberg RS The unfolded protein response in immunity and inflammation. Nat Rev Immunol 16, 469–484 (2016). [DOI] [PMC free article] [PubMed] [Google Scholar]
- 10.Song M & Cubillos-Ruiz JR Endoplasmic Reticulum Stress Responses in Intratumoral Immune Cells: Implications for Cancer Immunotherapy. Trends Immunol 40, 128–141 (2019). [DOI] [PubMed] [Google Scholar]
- 11.Osorio F et al. The unfolded-protein-response sensor IRE-1α regulates the function of CD8α+ dendritic cells. Nat Immunol 15, 248–257 (2014). [DOI] [PubMed] [Google Scholar]
- 12.Cubillos-Ruiz JR et al. ER Stress Sensor XBP1 Controls Anti-tumor Immunity by Disrupting Dendritic Cell Homeostasis. Cell 161, 1527–1538 (2015). [DOI] [PMC free article] [PubMed] [Google Scholar]
- 13.Mohamed E et al. The Unfolded Protein Response Mediator PERK Governs Myeloid Cell-Driven Immunosuppression in Tumors through Inhibition of STING Signaling. Immunity 52, 668–682.e7 (2020). [DOI] [PMC free article] [PubMed] [Google Scholar]
- 14.Song M et al. IRE1α–XBP1 controls T cell function in ovarian cancer by regulating mitochondrial activity. Nature 562, 423–428 (2018). [DOI] [PMC free article] [PubMed] [Google Scholar]
- 15.Cao Y et al. ER stress-induced mediator C/EBP homologous protein thwarts effector T cell activity in tumors through T-bet repression. Nat Commun 10, 1280 (2019). [DOI] [PMC free article] [PubMed] [Google Scholar]
- 16.Walter P & Ron D The Unfolded Protein Response: From Stress Pathway to Homeostatic Regulation. Science 334, 1081–1086 (2011). [DOI] [PubMed] [Google Scholar]
- 17.Shan B et al. The metabolic ER stress sensor IRE1α suppresses alternative activation of macrophages and impairs energy expenditure in obesity. Nat Immunol 18, 519–529 (2017). [DOI] [PubMed] [Google Scholar]
- 18.Batista A et al. IRE1α regulates macrophage polarization, PD-L1 expression, and tumor survival. Plos Biol 18, e3000687 (2020). [DOI] [PMC free article] [PubMed] [Google Scholar]
- 19.Wek RC & Cavener DR Translational Control and the Unfolded Protein Response. Antioxid Redox Sign 9, 2357–2372 (2007). [DOI] [PubMed] [Google Scholar]
- 20.Rainbolt TK, Saunders JM & Wiseman RL Stress-responsive regulation of mitochondria through the ER unfolded protein response. Trends Endocrinol Metabolism 25, 528–537 (2014). [DOI] [PubMed] [Google Scholar]
- 21.Wortel IMN, Meer L. T.van der, Kilberg MS, & Leeuwen F. N. van. Surviving Stress: Modulation of ATF4-Mediated Stress Responses in Normal and Malignant Cells. Trends Endocrinol Metabolism 28, 794–806 (2017). [DOI] [PMC free article] [PubMed] [Google Scholar]
- 22.Gundra UM et al. Alternatively activated macrophages derived from monocytes and tissue macrophages are phenotypically and functionally distinct. Blood 123, e110–e122 (2014). [DOI] [PMC free article] [PubMed] [Google Scholar]
- 23.Lavin Y et al. Innate Immune Landscape in Early Lung Adenocarcinoma by Paired Single-Cell Analyses. Cell 169, 750–765.e17 (2017). [DOI] [PMC free article] [PubMed] [Google Scholar]
- 24.Huang SC-C et al. Cell-intrinsic lysosomal lipolysis is essential for alternative activation of macrophages. Nat Immunol 15, 846–855 (2014). [DOI] [PMC free article] [PubMed] [Google Scholar]
- 25.Guthrie LN et al. Attenuation of PKR-like ER Kinase (PERK) Signaling Selectively Controls Endoplasmic Reticulum Stress-induced Inflammation Without Compromising Immunological Responses*. J Biol Chem 291, 15830–15840 (2016). [DOI] [PMC free article] [PubMed] [Google Scholar]
- 26.Yang F et al. ER-stress regulates macrophage polarization through pancreatic EIF-2alpha kinase. Cell Immunol 336, 40–47 (2019). [DOI] [PubMed] [Google Scholar]
- 27.Pakos-Zebrucka K et al. The integrated stress response. Embo Rep 17, 1374–1395 (2016). [DOI] [PMC free article] [PubMed] [Google Scholar]
- 28.Costa-Mattioli M & Walter P The integrated stress response: From mechanism to disease. Science 368, eaat5314 (2020). [DOI] [PMC free article] [PubMed] [Google Scholar]
- 29.Vitale I, Manic G, Coussens LM, Kroemer G & Galluzzi L Macrophages and Metabolism in the Tumor Microenvironment. Cell Metab 30, 36–50 (2019). [DOI] [PubMed] [Google Scholar]
- 30.Jha AK et al. Network Integration of Parallel Metabolic and Transcriptional Data Reveals Metabolic Modules that Regulate Macrophage Polarization. Immunity 42, 419–430 (2015). [DOI] [PubMed] [Google Scholar]
- 31.Liu P-S et al. α-ketoglutarate orchestrates macrophage activation through metabolic and epigenetic reprogramming. Nat Immunol 18, 985–994 (2017). [DOI] [PubMed] [Google Scholar]
- 32.Lebeau J et al. The PERK Arm of the Unfolded Protein Response Regulates Mitochondrial Morphology during Acute Endoplasmic Reticulum Stress. CellReports 22, 2827–2836 (2018). [DOI] [PMC free article] [PubMed] [Google Scholar]
- 33.Cogliati S, Enriquez JA & Scorrano L Mitochondrial Cristae: Where Beauty Meets Functionality. Trends Biochem Sci 41, 261–273 (2016). [DOI] [PubMed] [Google Scholar]
- 34.Bravo R et al. Increased ER-mitochondrial coupling promotes mitochondrial respiration and bioenergetics during early phases of ER stress. Journal of cell science 124, 2143–2152 (2011). [DOI] [PMC free article] [PubMed] [Google Scholar]
- 35.Haschemi A et al. The Sedoheptulose Kinase CARKL Directs Macrophage Polarization through Control of Glucose Metabolism. Cell Metab 15, 813–826 (2012). [DOI] [PMC free article] [PubMed] [Google Scholar]
- 36.Ma EH et al. Serine Is an Essential Metabolite for Effector T Cell Expansion. Cell Metab 25, 345–357 (2017). [DOI] [PubMed] [Google Scholar]
- 37.Locasale JW Serine, glycine and one-carbon units: cancer metabolism in full circle. Nat Rev Cancer 13, 572–583 (2013). [DOI] [PMC free article] [PubMed] [Google Scholar]
- 38.Ducker GS & Rabinowitz JD One-Carbon Metabolism in Health and Disease. Cell Metab 25, 27–42 (2017). [DOI] [PMC free article] [PubMed] [Google Scholar]
- 39.Harding HP et al. Regulated Translation Initiation Controls Stress-Induced Gene Expression in Mammalian Cells. Mol Cell 6, 1099–1108 (2000). [DOI] [PubMed] [Google Scholar]
- 40.Harding HP et al. An Integrated Stress Response Regulates Amino Acid Metabolism and Resistance to Oxidative Stress. Mol Cell 11, 619–633 (2003). [DOI] [PubMed] [Google Scholar]
- 41.Halaby MJ et al. GCN2 drives macrophage and MDSC function and immunosuppression in the tumor microenvironment. Sci Immunol 4, eaax8189 (2019). [DOI] [PMC free article] [PubMed] [Google Scholar]
- 42.Mullarky E et al. Identification of a small molecule inhibitor of 3-phosphoglycerate dehydrogenase to target serine biosynthesis in cancers. Proceedings of the National Academy of Sciences of the United States of America 113, 1778–1783 (2016). [DOI] [PMC free article] [PubMed] [Google Scholar]
- 43.Pacold ME et al. A PHGDH inhibitor reveals coordination of serine synthesis and one-carbon unit fate. Nat Chem Biol 12, 452–458 (2016). [DOI] [PMC free article] [PubMed] [Google Scholar]
- 44.Kory N et al. SFXN1 is a mitochondrial serine transporter required for one-carbon metabolism. Science 362, eaat9528 (2018). [DOI] [PMC free article] [PubMed] [Google Scholar]
- 45.Gao X et al. Serine Availability Influences Mitochondrial Dynamics and Function through Lipid Metabolism. Cell Reports 22, 3507–3520 (2018). [DOI] [PMC free article] [PubMed] [Google Scholar]
- 46.Hwang I-Y et al. Psat1-Dependent Fluctuations in α-Ketoglutarate Affect the Timing of ESC Differentiation. Cell Metab 24, 494–501 (2016). [DOI] [PubMed] [Google Scholar]
- 47.Harris NL & Loke P Recent Advances in Type-2-Cell-Mediated Immunity: Insights from Helminth Infection. Immunity 47, 1024–1036 (2017). [DOI] [PubMed] [Google Scholar]
- 48.Schäfer M & Werner S Cancer as an overhealing wound: an old hypothesis revisited. Nat Rev Mol Cell Bio 9, 628–638 (2008). [DOI] [PubMed] [Google Scholar]
- 49.Eming SA, Wynn TA & Martin P Inflammation and metabolism in tissue repair and regeneration. Science 356, 1026–1030 (2017). [DOI] [PubMed] [Google Scholar]
- 50.DeNardo DG et al. CD4+ T Cells Regulate Pulmonary Metastasis of Mammary Carcinomas by Enhancing Protumor Properties of Macrophages. Cancer Cell 16, 91–102 (2009). [DOI] [PMC free article] [PubMed] [Google Scholar]
- 51.Yang X et al. ATF4 Regulates CD4+ T Cell Immune Responses through Metabolic Reprogramming. CellReports 23, 1754–1766 (2018). [DOI] [PMC free article] [PubMed] [Google Scholar]
- 52.Ma L et al. Control of Nutrient Stress-Induced Metabolic Reprogramming by PKCζ in Tumorigenesis. Cell 152, 599–611 (2013). [DOI] [PMC free article] [PubMed] [Google Scholar]
- 53.Gao S et al. PSAT1 is regulated by ATF4 and enhances cell proliferation via the GSK3β/β-catenin/cyclin D1 signaling pathway in ER-negative breast cancer. J Exp Clin Canc Res 36, 179 (2017). [DOI] [PMC free article] [PubMed] [Google Scholar]
- 54.Yang C et al. Glutamine‐utilizing transaminases are a metabolic vulnerability of TAZ/YAP‐activated cancer cells. Embo Rep 19, (2018). [DOI] [PMC free article] [PubMed] [Google Scholar]
- 55.Martínez-Reyes I & Chandel NS Mitochondrial TCA cycle metabolites control physiology and disease. Nat Commun 11, 102 (2020). [DOI] [PMC free article] [PubMed] [Google Scholar]
- 56.Chisolm DA et al. CCCTC-Binding Factor Translates Interleukin 2- and α-Ketoglutarate-Sensitive Metabolic Changes in T Cells into Context-Dependent Gene Programs. Immunity 47, 251–267.e7 (2017). [DOI] [PMC free article] [PubMed] [Google Scholar]
- 57.Zhang Q et al. Tet2 is required to resolve inflammation by recruiting Hdac2 to specifically repress IL-6. Nature 525, 389–393 (2015). [DOI] [PMC free article] [PubMed] [Google Scholar]
- 58.Pan W et al. The DNA Methylcytosine Dioxygenase Tet2 Sustains Immunosuppressive Function of Tumor-Infiltrating Myeloid Cells to Promote Melanoma Progression. Immunity 47, 284–297.e5 (2017). [DOI] [PMC free article] [PubMed] [Google Scholar]
- 59.Finkelman FD et al. Anti-cytokine antibodies as carrier proteins. Prolongation of in vivo effects of exogenous cytokines by injection of cytokine-anti-cytokine antibody complexes. The Journal of Immunology 151, 1235–1244 (1993). [PubMed] [Google Scholar]
- 60.Ivanisevic J et al. Toward ‘omic scale metabolite profiling: a dual separation-mass spectrometry approach for coverage of lipid and central carbon metabolism. Analytical chemistry 85, 6876–6884 (2013). [DOI] [PMC free article] [PubMed] [Google Scholar]
- 61.Roci I et al. Metabolite Profiling and Stable Isotope Tracing in Sorted Subpopulations of Mammalian Cells. Analytical chemistry 88, 2707–2713 (2016). [DOI] [PMC free article] [PubMed] [Google Scholar]
- 62.Gallart-Ayala H et al. A global HILIC-MS approach to measure polar human cerebrospinal fluid metabolome: Exploring gender-associated variation in a cohort of elderly cognitively healthy subjects. Analytica chimica acta 1037, 327–337 (2018). [DOI] [PubMed] [Google Scholar]
- 63.Dunn WB et al. Procedures for large-scale metabolic profiling of serum and plasma using gas chromatography and liquid chromatography coupled to mass spectrometry. Nature protocols 6, 1060–1083 (2011). [DOI] [PubMed] [Google Scholar]
- 64.Gagnebin Y et al. Metabolomic analysis of urine samples by UHPLC-QTOF-MS: Impact of normalization strategies. Analytica chimica acta 955, 27–35 (2017). [DOI] [PubMed] [Google Scholar]
- 65.Tsugawa H, Kanazawa M, Ogiwara A & Arita M MRMPROBS suite for metabolomics using large-scale MRM assays. Bioinformatics 30, 2379–2380 (2014). [DOI] [PubMed] [Google Scholar]
- 66.Conza GD et al. Tumor-induced reshuffling of lipid composition on the endoplasmic reticulum membrane sustains macrophage survival and pro-tumorigenic activity. Nat Immunol 22, 1403–1415 (2021). [DOI] [PMC free article] [PubMed] [Google Scholar]
Associated Data
This section collects any data citations, data availability statements, or supplementary materials included in this article.
Data Availability Statement
RNA-Seq and ChIP-Seq results are available in the Gene Expression Omnibus database under accession code GSE165836 and GSE183287, respectively. Other data available upon request to corresponding author. Source data are provided with this paper.