

Abstract
Changes in neuronal network activity and increased interindividual variability in memory are among the most consistent features of growing older. Here, we examined the relationship between these hallmarks of aging. Young and aged rats were trained on a water maze task where aged individuals reliably display an increased range of spatial memory capacities relative to young. Two weeks later, neuronal activity was induced pharmacologically with a low dose of pilocarpine and control animals received vehicle. Activity levels were proxied by quantifying the immediate early gene products Arc and c-Fos. While no relationship was observed between basal, resting activity, and individual differences in spatial memory in any brain region, pilocarpine-induced marker expression was tightly coupled with memory in all areas of the prefrontal cortex (PFC) and hippocampus examined. The nature of this association, however, differed across regions and in relation to age-related cognitive outcome. Specifically, in the medial PFC, induced activity was greatest in aged rats with cognitive impairment and correlated with water maze performance across all subjects. In the hippocampus, the range of induced marker expression was comparable between groups and similarly coupled with memory in both impaired and unimpaired aged rats. Together the findings highlight that the dynamic range of neural network activity across multiple brain regions is a critical component of neurocognitive aging.
Keywords: cognitive aging, immediate early genes, network activity, pilocarpine, synaptic plasticity
1 |. INTRODUCTION
A major challenge in cognitive aging research is deciphering how complex memory systems and their underlying neural networks mediate variability in cognitive outcome later in life. While some people retain relatively normal cognitive function as they age, memory capacity among other aged individuals is substantially impaired. This increased interindividual variability is among the most consistent findings in aging research and is observed across multiple species (Rapp, Bañuelos, & Myrum, 2019). While impairment is closely linked to alterations in cellular and synaptic connectivity and plasticity (Morrison & Baxter, 2012), it is unclear how these changes influence the larger scale neural networks that support the brain’s ability to encode new memories.
Disrupted cortical network activity is a key feature of cognitive aging observed across a wealth of preclinical animal research and human imaging studies. The prefrontal cortex (PFC) and the hippocampal system appear to be most tightly coupled with both normal and pathological aging, where distinct subregions display unique signatures of cognitive decline (Bizon, Foster, Alexander, & Glisky, 2012; Burke & Barnes, 2010). These findings are supported by several powerful technologies that interrogate regional brain activation and neuronal network activity, including electroencephalogram recordings (e.g., Legon et al., 2015) and functional magnetic resonance imaging (fMRI) scans (Li et al., 2015). To assess activity over large network populations with neuron-level resolution, the assessment of immediate early gene (IEG) expression, including Arc and c-Fos, can provide a sensitive proxy (Greenberg, Ziff, & Greene, 1986; Kawashima, Okuno, & Bito, 2014; Yap & Greenberg, 2018). Although fidelity as a reflection of neuronal firing can vary under some conditions, numerous studies have exploited IEG induction to map neural activity patterns, driven pharmacologically or by behavior, including experiments focusing on neurocognitive aging (e.g., Fletcher et al., 2014; Hernandez et al., 2018; Schimanski, 2010).
In the current study, we tested the idea that individual differences in cognitive aging arise from disrupted neuronal activity dynamics across a distributed network of brain regions implicated in cognitive decline, as demonstrated by both preclinical studies and human neuroimaging results. We used a well-characterized rat model of cognitive aging that reliably displays a broad range of memory capacities, from aged rats that exhibit significant deficits in spatial learning and memory to other, age-matched rats that perform as well as young adults. We used a pharmacological induction approach and asked whether differences in the capacity or dynamic range of induced network activity are coupled with memory function. A similar pharmacological strategy has previously shown overall age-related changes (Bucci, Rosen, & Gallagher, 1998) and age-related changes coupled to cognitive aging (Haberman, Koh, & Gallagher, 2017). Taking a similar approach, here we found that the capacity for engaging plasticity-related activity is closely associated with cognitive aging, and that the nature of this coupling is qualitatively different between the hippocampus and PFC.
2 |. MATERIALS AND METHODS
2.1 |. Background behavioral characterization
Young adult (N = 13; 6 months of age) and aged (N = 28; approximately 24 months of age) male Long-Evans rats (Charles River Laboratories, Raleigh, NC, USA) were housed singly in a climate-controlled vivarium on a 12:12 hr light: dark cycle with food and water provided ad libitum. Spatial learning and memory were assessed using a hippocampus-dependent, “place” version of the Morris water maze, following an established protocol identical to many previous studies (Gallagher, Burwell, & Burchinal, 1993). The protocol includes sparse training (three trials/day for eight consecutive days) and multiple, interpolated probe trials (last trial every other day) to document the development of spatial bias for the escape location. Individual differences in learning and memory were assessed according to a learning index (LI) score validated in earlier studies (Gallagher et al., 1993), which reflects the average proximity to the hidden escape platform over the course of training. Low scores reflect relatively greater search accuracy focused on the escape location. Aged animals with LI scores under 240, which generally encompasses the range of young (Y) animals, were classified as aged unimpaired (AU), and those that scored above 240 were classified as aged impaired (AI). Following background behavioral characterization, rats were tested on a single-session cued version of the task to identify subjects with sensorimotor deficits or lacking motivation. The assessment consisted of six trials with variable escape locations in which the platform was raised and visible above the water surface. Aged animals that failed the task were excluded from the study. All procedures were approved by the Institutional Animal Care and Use Committees of the Intramural Research Program of the National Institute on Aging, in accordance with the National Institutes of Health Guide for the Care and Use of Laboratory Animals.
2.2 |. Drug treatments
To reduce stress-induced marker expression associated with injections and handling, all rats received 1 mL/kg saline intraperitoneally (i.p.) daily for 1 week, beginning 1 week after water maze testing. The day after the last saline injection, rats were injected with either pilocarpine (25 mg/kg dissolved in 0.9% saline; i.p.; Sigma Biochemicals, St. Louis, MO) or 0.9% saline, and returned to their home cage. Rats injected with pilocarpine displayed increased lacrimation and transiently diminished locomotor capacity and induced minor twitching that lasted approximately 15 min, though no outright seizure-like activity was observed. These drug-induced reactions were similar across young and aged animals, consistent with earlier reports (Bucci et al., 1998; Haberman et al., 2017). Ninety minutes following drug or vehicle treatment, rats were anesthetized with 5% isoflurane for ~3 min in a chamber and maintained with 2% isoflurane through a nose cone. Animals were perfused transcardially at a rate of 35 mL/min with cold PBS for 2 min and then with cold 4% paraformaldehyde (PFA) in PBS (pH 7.2–7.4) for 13 min. Brains were removed and placed in cold 4% PFA in PBS (pH 7.2–7.4) to postfix at 4°C overnight. Tissue was incubated in 10% glycerol in 0.1M phosphate buffer at 4°C for 24 hr, followed by 20% glycerol in 0.1M phosphate buffer at 4°C for 24 hr, and then frozen in chilled 2-methylbutane.
2.3 |. Immunohistochemistry
Histological sections were cut frozen in the coronal plane on a sliding microtome at a nominal thickness of 30 μm in a 1-in-10 series through the anterior–posterior extent of the brain. All immunohistochemical tissue processing was carried out in large batches, with each batch containing tissue from all conditions and groups, thereby controlling for run-to-run variability as a confound of group differences. Sections were washed in TBS and blocked in 5% normal donkey serum with 0.3% Triton X-100 in TBS for 1 hr at room temperature. The tissue was incubated with primary antibodies against Arc (Santa Cruz Biotechnology, Arc C-7, sc-17839, 1:100) and c-Fos (Santa Cruz Biotechnology, c-Fos 4, sc-52, 1:100) in blocking buffer for 48 hr at 4°C. Alexa Fluor 647 phalloidin was added to stain F-actin (1:40) and then incubated for an additional 24 hr at 4°C. Tissue sections were washed with TBS before incubation with species-appropriate secondary antibodies, Alexa Fluor donkey anti-mouse 488 (ThermoFisher Scientific R37114; 1:250), and Alexa Fluor donkey anti-rabbit 594 (ThermoFisher Scientific R37119; 1:250). Tissue was washed again and subsequently mounted onto glass slides, allowed to dry, and coverslipped with Pro-Long Gold Antifade Reagent (Invitrogen).
2.4 |. Quantitative imaging
Compared with previous studies that examined autoradiographic in situ hybridization for mRNA, or counted the number of immunopositive nuclei, here we conducted a lower resolution regional survey, sampling larger regions in the aggregate. The approach provided lower sensitivity than previous reports but permitted comparisons among regions in relation age and cognitive outcome. Slides were imaged using a Typhoon Trio Plus Scanner (GE Healthcare) at a resolution of 10 μm/pixel, yielding 16-bit grayscale TIFF images. The ImageJ software (http://rsbweb.nih.gov/ij/) was then used to invert and pseudocolor the images, which aided in visualizing the regions of interest. All immunofluorescence labeling intensity data were derived from the original underlying grayscale images. To accurately and objectively trace cell body layers, borders were traced on the phalloidin images, and transposed onto the corresponding c-Fos and Arc images. Quantification was performed by investigators blind to the experimental conditions. Both hemispheres were quantified from each of the following brain regions: the CA1 and CA3 pyramidal cell layers of the dorsal hippocampus (~5 sections/rat; ~3 mm—3.6 posterior to bregma), the anterior cingulate (aCg), prelimbic (PL), and infralimbic (IL) divisions of the medial prefrontal cortex (mPFC, ~5 sections/rat; ~3.2–2.2 anterior to bregma), and the retrosplenial cortex (RSC; ~5 sections/rat; ~3 mm—3.6 posterior to bregma). In the hippocampus, we opted to focus on the pyramidal cell layer since Arc immunofluorescence is at all times strongest in the nucleus and cell body (Steward, Farris, Pirbhoy, Darnell, & Van, 2015). Immunofluorescence intensity values for each protein were averaged across histological sections of each region of interest, yielding a single mean value per region for each subject.
2.5 |. Statistical analyses
Parametric statistics (two-way ANOVAs) were used to compare measures across groups (Y, AU, AI) and conditions (saline or pilocarpine). Sidak’s multiple comparisons tests were conducted when the overall group ANOVA reached significance. Potential relationships between LI scores and protein levels were assessed by two-tailed Pearson r correlation coefficients. Finally, principal component analysis (PCA) was conducted to explore the underlying structure of the results across brain regions and in relation to cognitive function. Thirteen factors were considered in the analysis, comprising the c-Fos and Arc immunofluorescence intensity values for all regions, and the LI score for each animal.
3 |. RESULTS
3.1 |. Spatial learning capacity varies among aged rats
Young and aged rats were assessed on a standardized version of the Morris water maze, optimized for identifying individual differences in hippocampus-dependent spatial learning capacities. LI scores were calculated as previously described (Gallagher et al., 1993). The LI score distribution resembled previous studies utilizing this model (Fletcher et al., 2014; Haberman et al., 2017; Smith, Adams, Gallagher, Morrison, & Rapp, 2000), where 6-month old (Y) animals scores averaged 188 ± 32.5 (SD; Figure 1 green circles; n = 13), while aged rats (24–28 months old) varied considerably more with an average of 218 ± 48. Aged animals were classified as unimpaired (AU) if their scores were on par with Y rats, under the 240 cutoff (Figure 1 orange squares; n = 17). Aged animals that scored worse than Y (above the 240 cutoff) were considered impaired (AI; Figure 1 purple triangles; n = 11). A single session of nonspatial cued escape training shortly following the protocol above ensured that no rats with impaired sensorimotor function or motivation were included.
FIGURE 1.
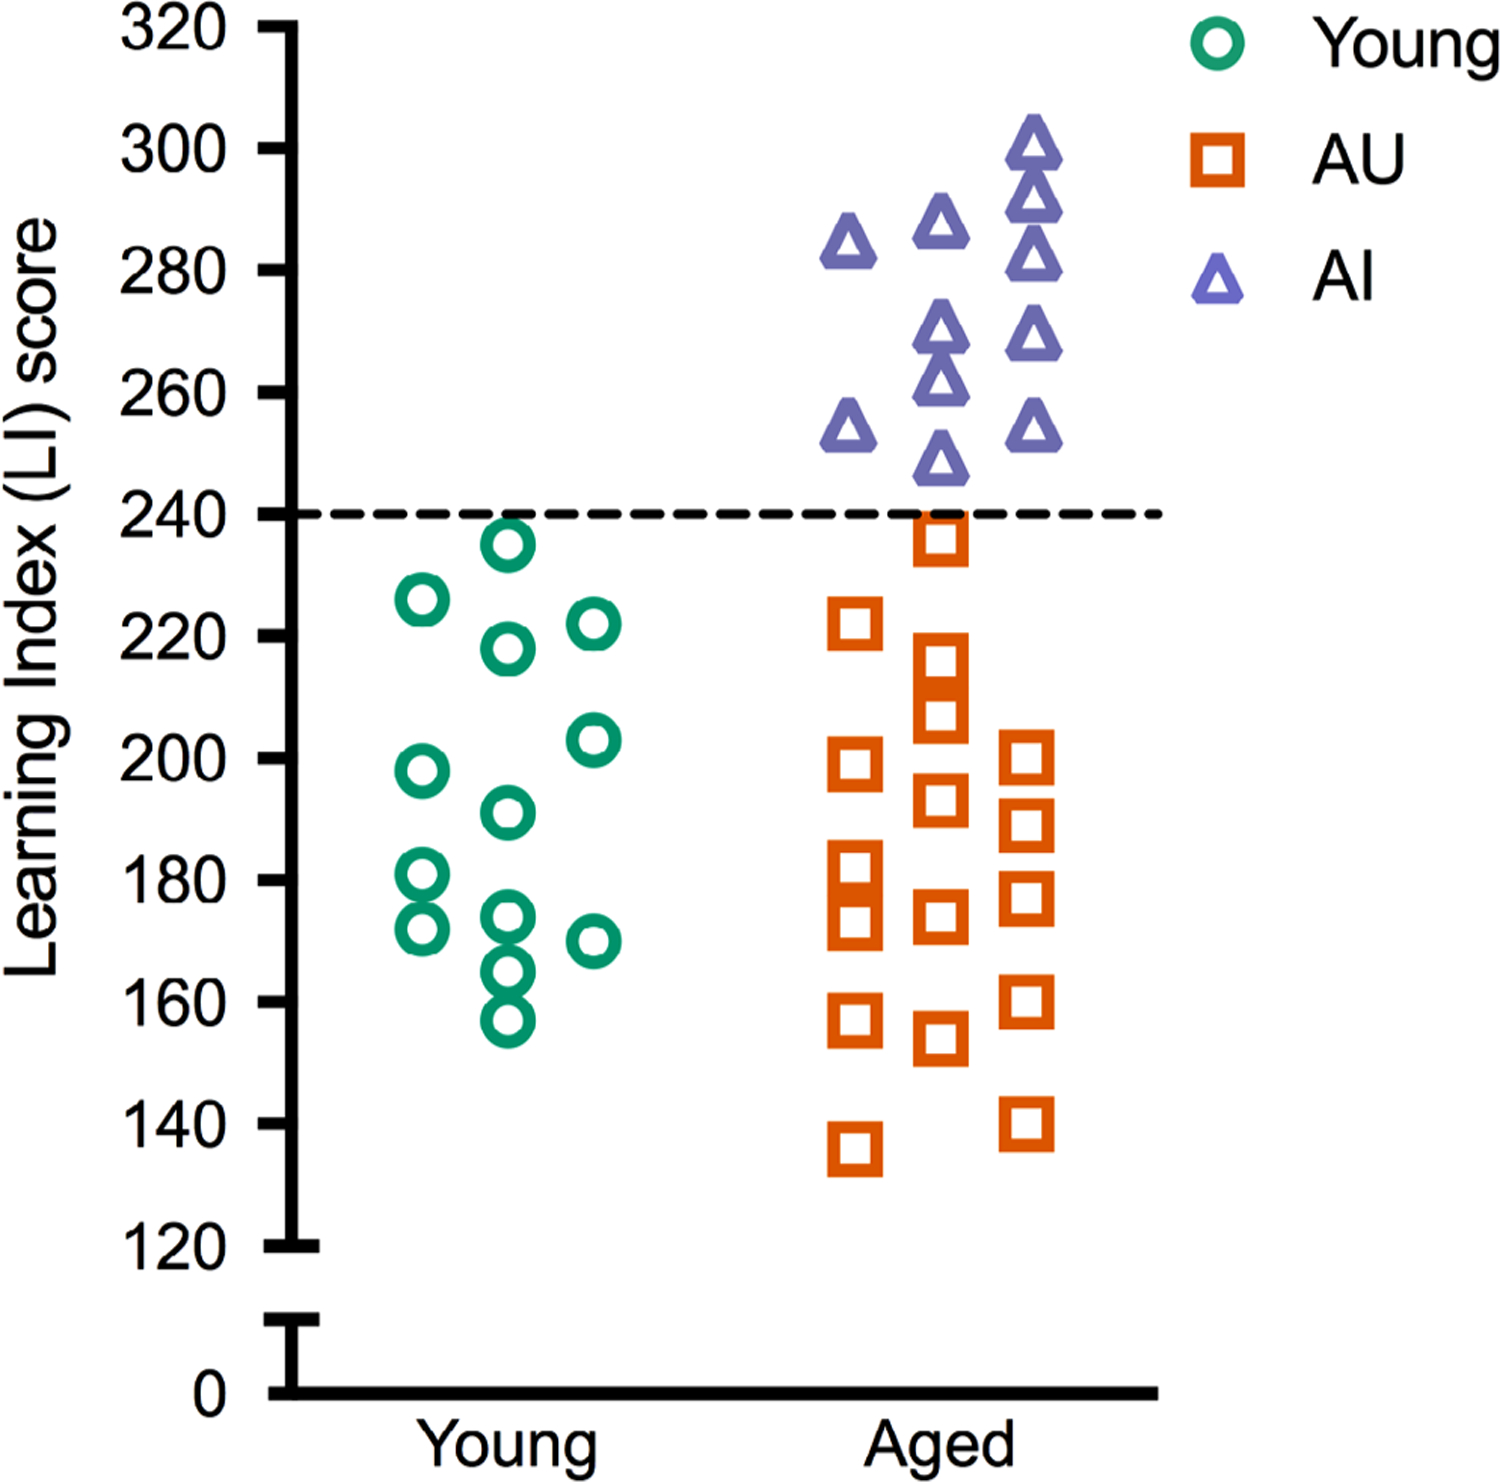
Performance of young and aged animals on the Morris water maze. Learning index scores from a standardized spatial version of the water maze from individual young (n = 13) and aged (n = 28) rats. Aged rats with learning index <240 were considered unimpaired, while those >240 were considered impaired
3.2 |. Pilocarpine-induced Arc and c-Fos expression in the hippocampus
To induce neuronal activity and IEG expression, we administered a subconvulsive dose of the muscarinic acetylcholine receptor agonist, pilocarpine, which selectively targets M1 and M3 receptor subtypes (Figueroa, Griffin, & Ehlert, 2009). Except where noted, the control marker F-actin was unaffected by age and insensitive to pilocarpine, confirming the gross structural integrity of the regions examined. Following injection, one of the earliest brain regions to exhibit pilocarpine-induced activity is the hippocampus (Turski, Ikonomidou, Turski, Bortolotto, & Cavalheiro, 1989). In the CA1 and CA3 hippocampal subfields (Figure 2a), pilocarpine significantly increased Arc expression above baseline levels (Figure 3; Table 1). Post hoc analyses revealed that pilocarpine-induced increases in Arc were selectively observed in young and aged rats with intact spatial memory (Figure 3; Table 1). A similar relationship was seen for c-Fos in CA1 and CA3 (Figure 3; Table 1; group * condition interaction: CA1, p = .035), although the magnitude of induction in Y and AU was not statistically robust in all comparisons. Between-groups tests (Y/AU/AI) within saline and pilocarpine conditions showed no significant main effect of group for Arc or c-Fos in either hippocampal subregion (Figure 3; Table 2). Pair-wise comparisons, however, showed significantly greater c-Fos expression in AI rats relative to Y in CA1 under basal, nonstimulated conditions (Table 2).
FIGURE 2.
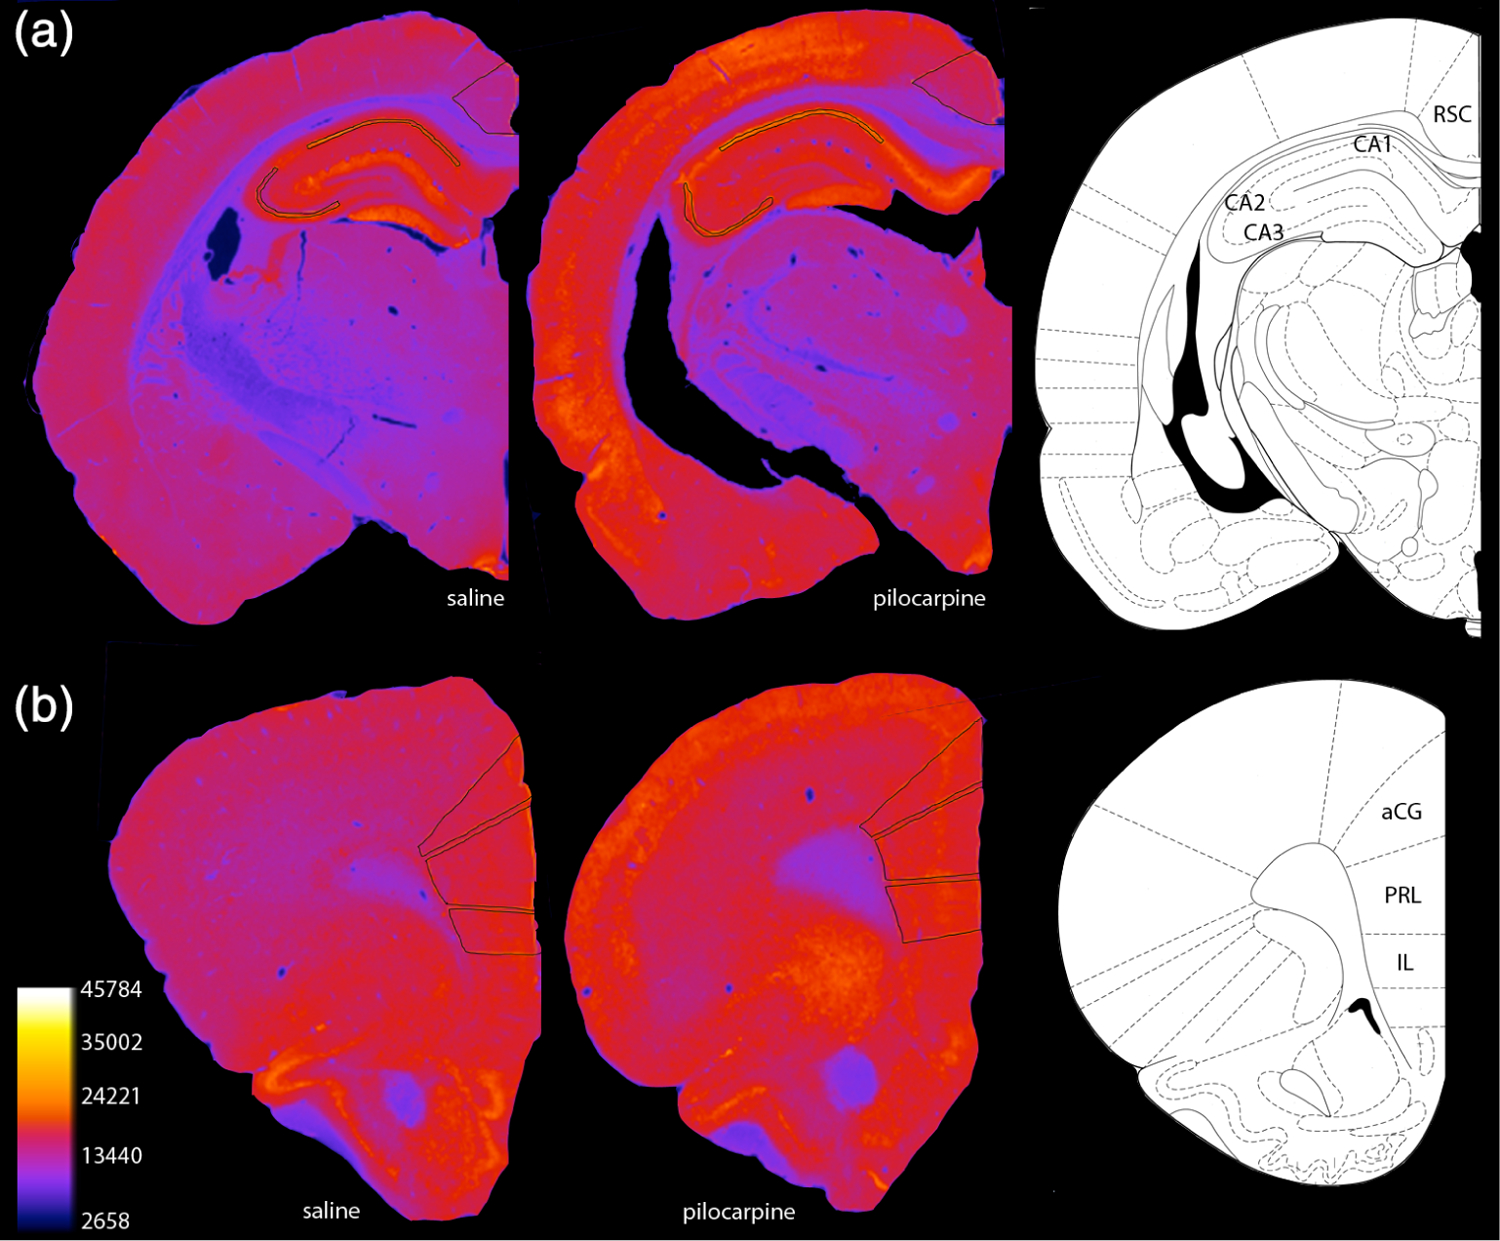
Immunoimaging of cognitive aging-vulnerable brain regions. Representative pseudo-colored images of Arc immunofluorescence in (a) hippocampal CA1 and CA3 subfields and retrosplenial cortex (RSC) as well as (b) three prefrontal cortex subregions: anterior cingulate cortex (aCG), the prelimbic cortex (PL), and the infralimbic cortex (IL). Regions of interest are outlined in black
FIGURE 3.
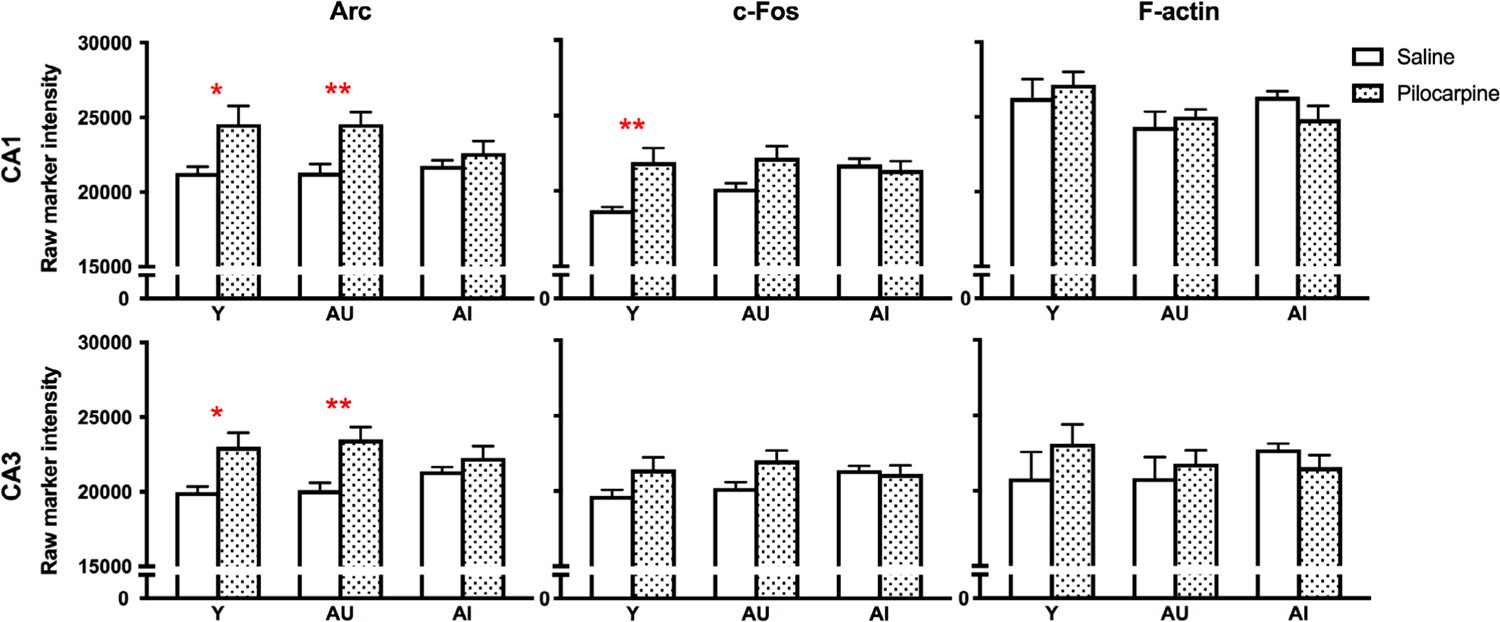
Pilocarpine-induced Arc and c-Fos expression in the hippocampus. Post hoc significance was assessed by Sidak’s multiple comparisons tests: *p < .05; **p < .005. Values represent raw intensity value group means ± SEM
TABLE 1.
Basal versus activity-induced marker expression in hippocampus
| Post hoc comparisons (saline vs. pilocarpine) | |||||||||
|---|---|---|---|---|---|---|---|---|---|
| Main effect of activity | Y | AU | AI | ||||||
| F [1,41] | p | t [41] | p | t [41] | p | t [41] | p | ||
| CA1 | Arc | 13.480 | .001 | 2.888 | .018 | 3.137 | .009 | 0.666 | .882 |
| c-Fos | 8.761 | .005 | 3.427 | .004 | 2.431 | .057 | 0.345 | .981 | |
| F-actin | 0.001 | .978 | 0.677 | .877 | 0.597 | .911 | 1.022 | .675 | |
| CA3 | Arc | 17.110 | .000 | 3.027 | .013 | 3.728 | .002 | 0.793 | .817 |
| c-Fos | 5.011 | .031 | 2.089 | .123 | 2.393 | .063 | 0.264 | .991 | |
| F-actin | 0.432 | .515 | 1.302 | .488 | 0.592 | .913 | 0.590 | .914 | |
P values <0.05 are shown in bold.
TABLE 2.
Y versus AU versus AI marker expression in hippocampus under basal conditions or following activity
| Post hoc comparisons (Y/AU/AI) basal | Post hoc comparisons (Y/AU/AI) activity | ||||||||||||||
|---|---|---|---|---|---|---|---|---|---|---|---|---|---|---|---|
| Main group effect | Y versus AU | Y versus AI | AU versus AI | Y versus AU | Y versus AI | AU versus AI | |||||||||
| F [1,41] | p | t [41] | p | t [41] | p | t [41] | p | t [41] | p | t [41] | p | t [41] | p | ||
| CA1 | Arc | 0.542 | .586 | 0.026 | >.99 | 0.377 | .975 | 0.381 | .974 | 0.003 | >.99 | 1.635 | .294 | 1.632 | .296 |
| c-Fos | 1.854 | 0.170 | 1.583 | .321 | 2.963 | .015 | 1.682 | .272 | 0.361 | .978 | 0.527 | .937 | 0.850 | .785 | |
| F-actin | 2.403 | .103 | 1.553 | .337 | 0.048 | >.99 | 1.534 | .348 | 1.764 | .234 | 1.716 | .256 | 0.138 | .999 | |
| CA3 | Arc | 0.130 | .878 | 0.126 | .999 | 1.259 | .517 | 1.236 | 0.532 | 0.529 | .936 | 0.697 | .867 | 1.170 | .576 |
| c-Fos | 0.739 | .484 | 0.636 | .895 | 1.835 | .205 | 1.370 | .445 | 0.764 | .833 | 0.350 | .980 | 1.033 | .668 | |
| F-actin | 0.234 | .792 | 0.014 | >.99 | 0.990 | .696 | 1.053 | .655 | 0.800 | .813 | 0.846 | .787 | 0.131 | .999 | |
P values <0.05 are shown in bold.
We next examined whether Arc and c-Fos expression in the hippocampus under basal conditions and after pilocarpine administration are coupled with the individual differences in memory assessed in the water maze. Correlations were calculated considering Y, AU, and AI separately as well as collapsed among aged (AU + AI), cognitively intact individuals (Y + AU), and “all subjects.” Under basal conditions, CA1 and CA3 levels of Arc and c-Fos did not correlate with LI scores in any analysis (Figure 4; all p’s > .05). In contrast, pilocarpine-induced activity was tightly coupled with spatial memory capacity in aged rats in both CA3 and CA1. Specifically, pilocarpine-induced Arc and c-Fos expression positively correlated with memory performance when the AU and AI groups were considered separately, but not when the analysis included other conditions (i.e., young rats, chronological age (AU + AI), or intact memory (Y + AU); significant correlations are plotted in Figure 4). These findings indicate that while greater activity predicts relatively poor memory, the overall dynamic range of pilocarpine-induced activity in the aged hippocampus is relatively preserved.
FIGURE 4.
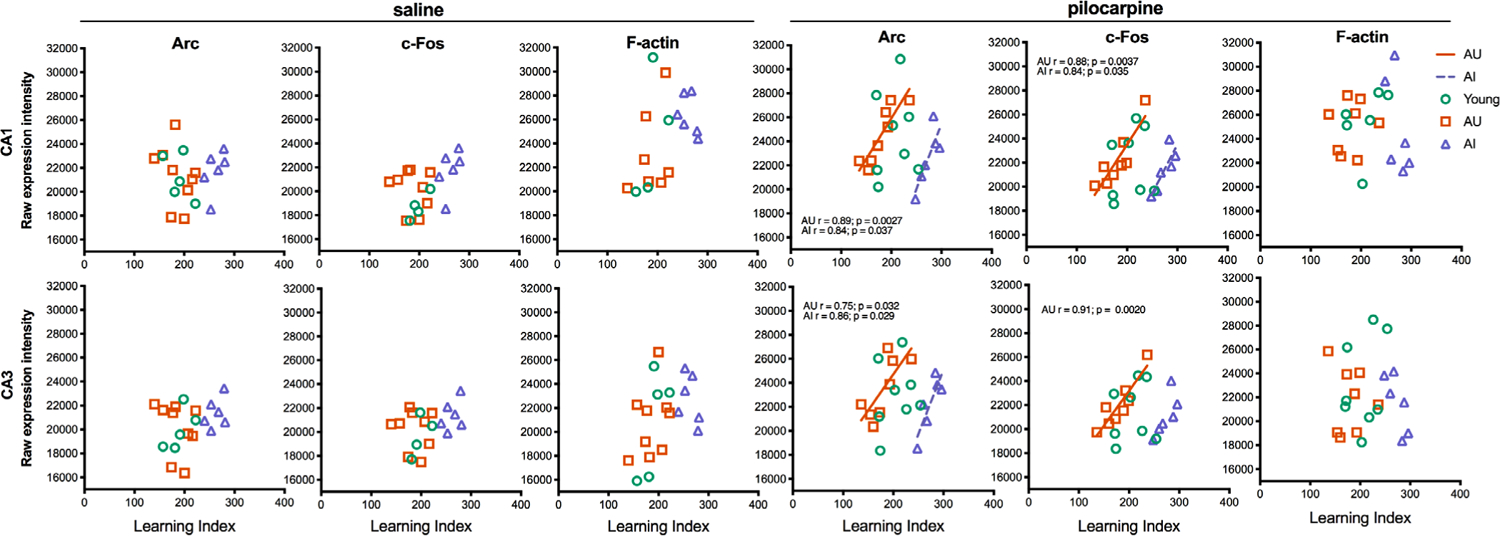
Correlation analyses of Arc and c-Fos expression in the hippocampus. Average Arc and c-Fos expression levels in the hippocampus were plotted against learning index scores for each rat. Pearson r values and their respective lines of best fit are plotted for significant associations (p < .05). Pearson r values and their respective lines of best fit are displayed for significant associations (p < .05)
3.3 |. Pilocarpine-induced Arc and c-Fos expression in the PFC
The mPFC is an important mediator of high-order cognitive function and is affected early in the aging process (Morrison & Baxter, 2012). We examined Arc and c-Fos expression in three mPFC subregions (Figure 2b): the anterior cingulate cortex (aCG), the prelimbic cortex (PL), and the infralimbic cortex (IL). Pilocarpine significantly elevated both Arc and c-Fos levels above saline control values in the aCG and PL, but the effect in the IL was only marginally significant for Arc (Figure 5; Table 3). Induction was most apparent in Y and numerically elevated in AI animals, while AU animals did not respond to pilocarpine treatment (Figure 5; Table 3). Between-group comparisons (Y/AU/AI) within the saline and pilocarpine treatment conditions showed that both baseline and activated Arc and c-Fos protein levels varied significantly between groups, while F-actin was comparatively stable (Figure 5; Table 4). Post hoc comparisons revealed that basal levels of both Arc and c-Fos were broadly elevated in aged animals, regardless of cognitive status, in aCG and PL, but not IL (Figure 5; Table 4). In contrast, pilocarpine-induced Arc and c-Fos levels were specifically elevated in animals with impaired spatial memory in aCG and PL (Figure 5; Table 4).
FIGURE 5.
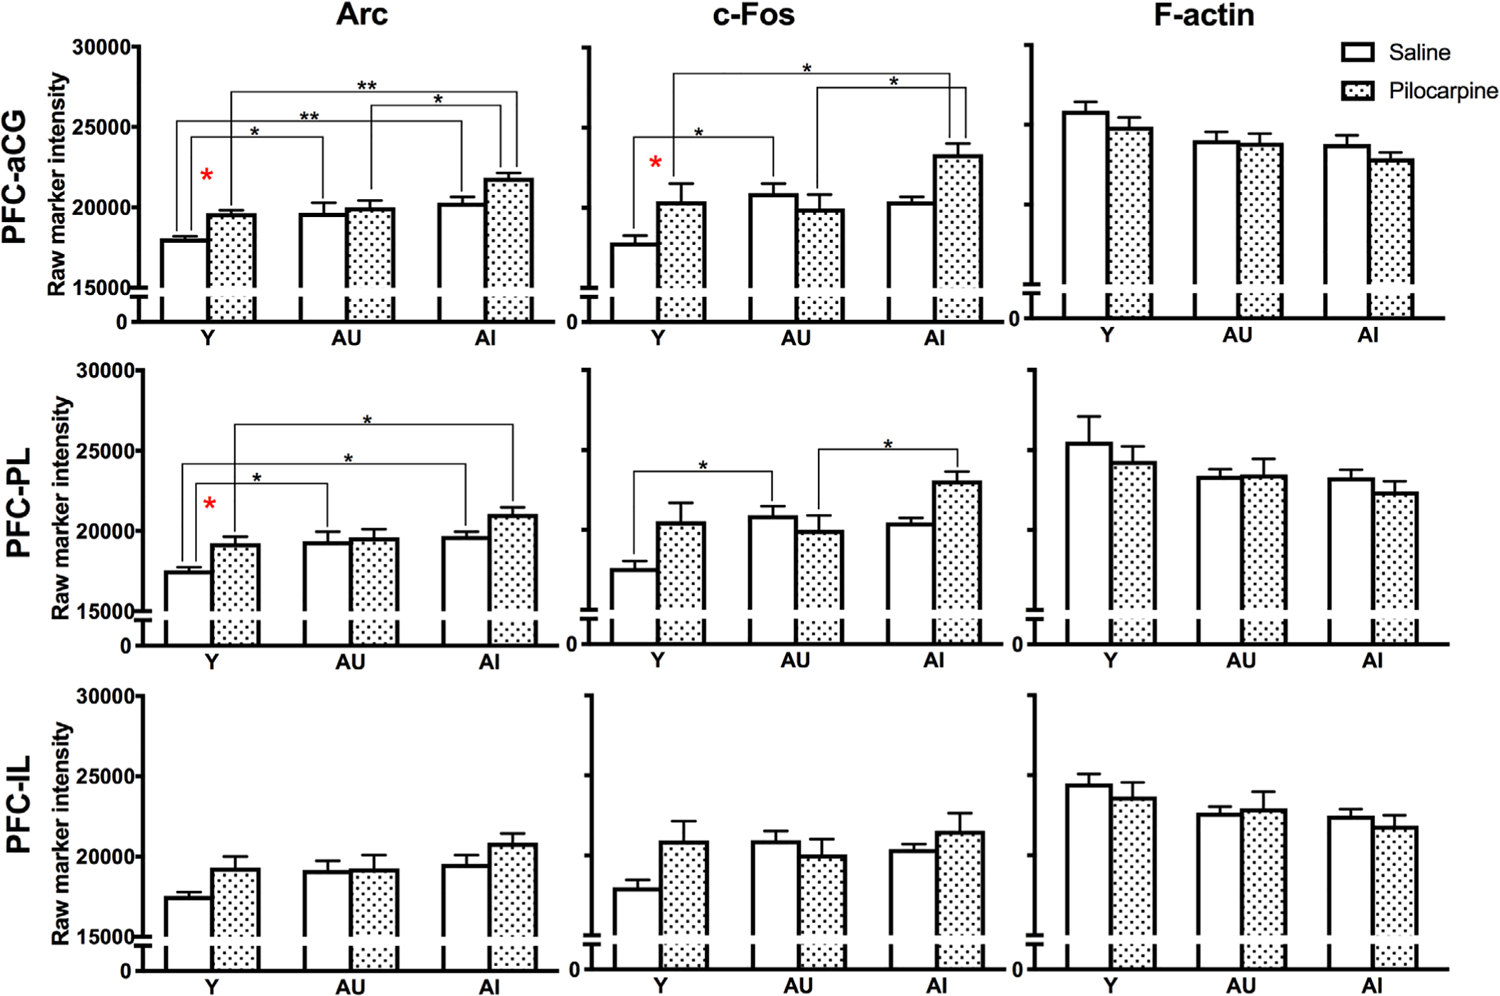
Pilocarpine-induced Arc and c-Fos expression in the prefrontal cortex. Post hoc significance was assessed by Sidak’s multiple comparisons tests: *p < .05; **p < .005. Values represent raw intensity value group means ± SEM. aCG, anterior cingulate cortex; IL, infralimbic cortex; PL, prelimbic cortex;
TABLE 3.
Basal versus activity-induced marker expression in PFC
| Post hoc comparisons (Saline vs. Pilocarpine) | |||||||||
|---|---|---|---|---|---|---|---|---|---|
| Main effect of activity | Y | AU | AI | ||||||
| F [1,41] | p | t [41] | p | t [41] | p | t [41] | p | ||
| aCG | Arc | 10.810 | .002 | 2.629 | .036 | 0.651 | .889 | 2.275 | .082 |
| c-Fos | 5.281 | 027 | 2.309 | .076 | 0.951 | .722 | 2.298 | .078 | |
| F-actin | 2.223 | .144 | 1.266 | .512 | 0.229 | .994 | 1.020 | .677 | |
| PL | Arc | 8.334 | 006 | 2.630 | .036 | 0.373 | .976 | 1.876 | .190 |
| c-Fos | 5.389 | .025 | 2.593 | .039 | 0.896 | .757 | 2.042 | .136 | |
| F-actin | 0.792 | 379 | 0.941 | .728 | 0.073 | 1.000 | 0.614 | .904 | |
| IL | Arc | 3.944 | .054 | 1.964 | .160 | 0.109 | .999 | 1.272 | .508 |
| c-Fos | 2.164 | 149 | 2.399 | .062 | 0.788 | .820 | 0.810 | .808 | |
| F-actin | 0.414 | .524 | 0.790 | .819 | 0.291 | .988 | 0.537 | .933 | |
P values <0.05 are shown in bold.
TABLE 4.
Y versus AU versus AI marker expression in PFC under basal conditions or following activity
| Post hoc comparisons (Y/AU/AI) basal | Post hoc comparisons (Y/AU/AI) activity | ||||||||||||||
|---|---|---|---|---|---|---|---|---|---|---|---|---|---|---|---|
| Main group effect | Y versus AU | Y versus AI | AU versus AI | Y versus AU | Y versus AI | AU versus AI | |||||||||
| F [1,41] | p | t [41] | p | t [41] | p | t [41] | p | t [41] | p | t [41] | p | t [41] | p | ||
| aCG | Arc | 13.350 | .000 | 2.731 | .028 | 3.391 | .005 | 1.047 | .659 | 0.679 | .876 | 3.558 | .003 | 2.950 | .016 |
| c-Fos | 5.788 | .006 | 2.831 | .021 | 2.084 | .125 | 0.456 | .957 | 0.437 | .962 | 2.509 | .048 | 2.899 | .018 | |
| F-actin | 6.781 | .003 | 2.406 | .061 | 2.395 | .063 | 0.284 | 0.989 | 1.385 | .436 | 2.435 | .057 | 1.196 | .558 | |
| PL | Arc | 9.099 | .001 | 4.098 | .016 | 4.257 | .012 | 0.676 | .882 | 0.822 | .831 | 3.844 | .025 | 3.109 | .083 |
| c-Fos | 5.555 | .007 | 3.011 | .013 | 2.300 | .078 | 0.395 | .972 | 0.498 | .946 | 2.186 | .100 | 2.631 | .035 | |
| F-actin | 2.607 | .086 | 1.697 | .264 | 1.558 | .335 | 0.059 | 1.000 | 0.697 | .867 | 1.417 | .416 | 0.794 | .817 | |
| IL | Arc | 3.659 | .035 | 1.825 | .209 | 1.999 | .149 | 0.412 | .968 | 0.086 | 1.000 | 1.625 | .300 | 1.701 | .262 |
| c-Fos | 1.523 | .230 | 2.471 | .052 | 1.782 | .22 | 0.439 | .962 | 0.749 | .841 | 0.475 | .952 | 1.144 | .594 | |
| F-actin | 3.385 | .044 | 1.807 | .216 | 1.753 | .239 | 0.164 | .998 | 0.762 | .834 | 1.683 | .271 | 1.002 | .689 | |
P values <0.05 are shown in bold.
Adopting the same approach as in the hippocampus, correlations were calculated to examine whether Arc and c-Fos expression in the mPFC are coupled with individual differences in spatial memory capacity. Analyses were conducted for Y, AU, and AI separately, as well as for aged (AU + AI), cognitively intact individuals (Y + AU), and “all subjects.” Mirroring results for the hippocampus, no significant correlations were observed between basal Arc or c-Fos levels and LI scores for any group (Figure 6; all p’s > .05). In contrast, for all subjects, pilocarpine-induced Arc and c-Fos expression correlated with LI scores in all regions of the PFC examined (Figure 6). Unlike the hippocampus, however, the correlations were not significant in the PFC when the groups were considered separately. Thus, PFC Arc and c-Fos induction were coupled with memory across the full range of capacities observed, from young and aged intact subjects with similar IEG levels, to other aged rats with substantial impairment and elevated pilocarpine-induced activity (significant correlation values are indicated in Figure 6). LI scores for animals with intact memory (Y + AU) correlated with induced c-Fos expression across all regions of the PFC, and with Arc in the IL (significant correlation values are indicated in Figure 6).
FIGURE 6.
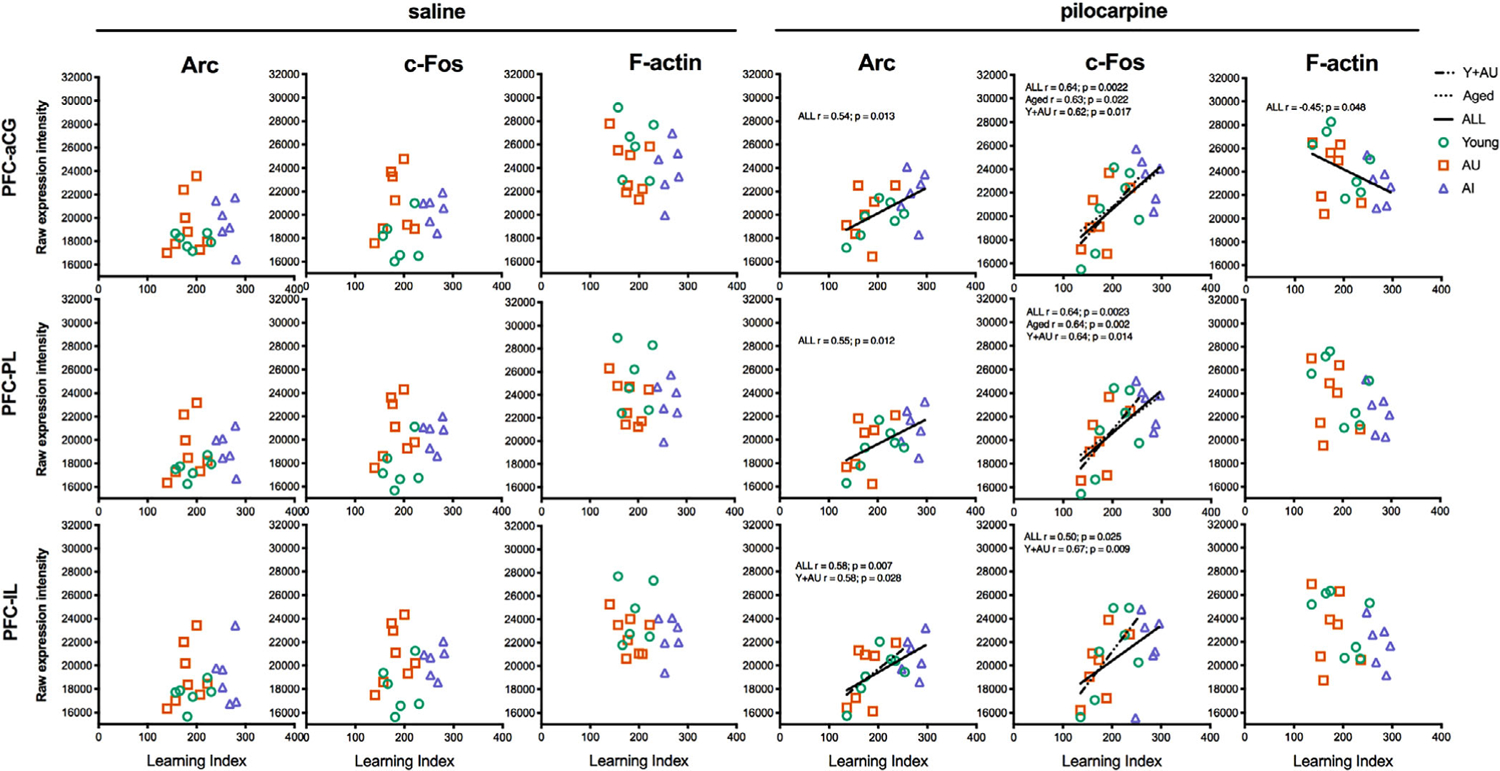
Correlation analyses of Arc and c-Fos expression in the prefrontal cortex. Average Arc and c-Fos expression levels in the prefrontal cortex were plotted against learning index scores for each rat. Pearson r values and their respective lines of best fit are plotted for significant associations (p < .05). aCG, anterior cingulate cortex; IL, infralimbic cortex; PL, prelimbic cortex
3.4 |. Pilocarpine-induced Arc and c-Fos expression in the retrosplenial cortex
The retrosplenial cortex (RSC), outlined in Figure 2a, is heavily interconnected with the hippocampal formation and other memory-related cortical areas (Sugar, Witter, van Strien, & Cappaert, 2011), and implicated in a wide range of cognitive functions including episodic and spatial memory (Vann, Aggleton, & Maguire, 2009). As expected, we found that pilocarpine significantly increased Arc and c-Fos expression above baseline levels in the RSC (Figure 7; Table 5), while no change was seen for F-actin (all p’s > .05). Similar to the hippocampus, post-hoc analyses showed that this increase was selective for Y and AU animals (Figure 7; Table 5). We also found that basal c-Fos expression levels varied between groups in RSC but not Arc or F-actin (Figure 7; Table 6). Post hoc analyses showed that basal c-Fos levels were specifically elevated in AI animals (Figure 7; Table 6). In contrast to the hippocampus and PFC (with the exception of Arc in AI rats that received pilocarpine), both basal and induced IEG levels in the RSC failed to correlate with LI values. Instead, we observed associations between LI scores and F-actin levels, suggesting that cytoskeletal components may be a more sensitive marker of aging in the RSC (Figure 8).
FIGURE 7.
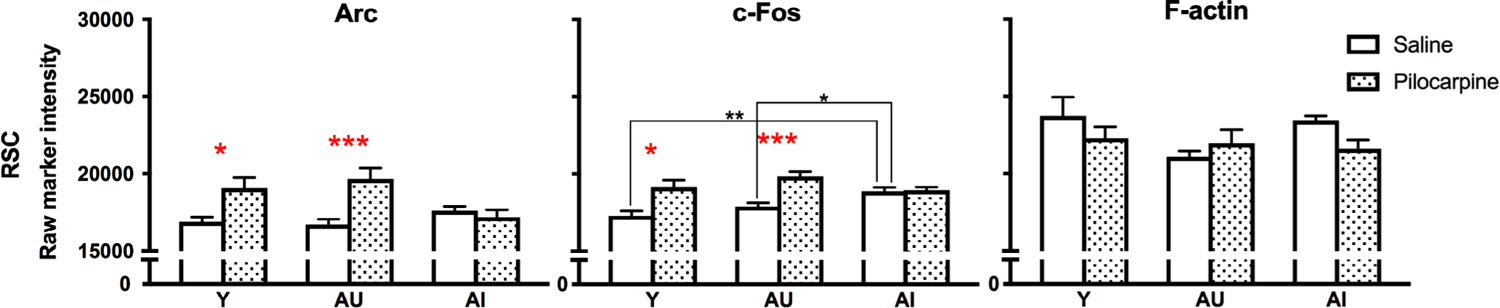
Pilocarpine-induced Arc and c-Fos expression in the retrosplenial cortex. Post hoc significance was assessed by Sidak’s multiple comparisons tests: *p < .05; **p < .005; ***p < .0005. Values represent raw intensity value group means ± SEM
TABLE 5.
Basal versus activity-induced marker expression in RSC
| Post hoc comparisons (Saline vs. Pilocarpine) | |||||||||
|---|---|---|---|---|---|---|---|---|---|
| Main effect of activity | Y | AU | AI | ||||||
| F [1,41] | p | t [41] | p | t [41] | p | t [41] | p | ||
| RSC | Arc | 12.470 | .001 | 2.896 | .018 | 4.286 | .000 | 0.474 | .953 |
| c-Fos | 27.040 | .000 | 3.955 | .001 | 4.539 | .000 | 0.191 | .997 | |
| F-actin | 1.716 | .197 | 1.362 | .449 | 0.886 | .762 | 1.601 | .311 | |
P values <0.05 are shown in bold.
TABLE 6.
Y versus AU versus AI marker expression in RSC under basal conditions or following activity
| Post hoc comparisons (Y/AU/AI) basal | Post hoc comparisons (Y/AU/AI) activity | ||||||||||||||
|---|---|---|---|---|---|---|---|---|---|---|---|---|---|---|---|
| Main group effect | Y versus AU | Y versus AI | AU versus AI | Y versus AU | Y versus AI | AU versus AI | |||||||||
| F [1,41] | p | t [41] | p | t [41] | p | t [41] | p | t [41] | p | t [41] | p | t [41] | p | ||
| RSC | Arc | 12.470 | .001 | 0.234 | .994 | 0.853 | .782 | 1.142 | .595 | 0.837 | .792 | 2.387 | .064 | 3.136 | .01 |
| c-Fos | 27.040 | .000 | 1.314 | .477 | 3.591 | .002 | 2.476 | .049 | 1.570 | .324 | 0.457 | .957 | 2.104 | .116 | |
| F-actin | 1.716 | .197 | 2.549 | .043 | 0.281 | .989 | 2.244 | .088 | 0.345 | .981 | 0.635 | .896 | 0.312 | .986 | |
P values <0.05 are shown in bold.
FIGURE 8.
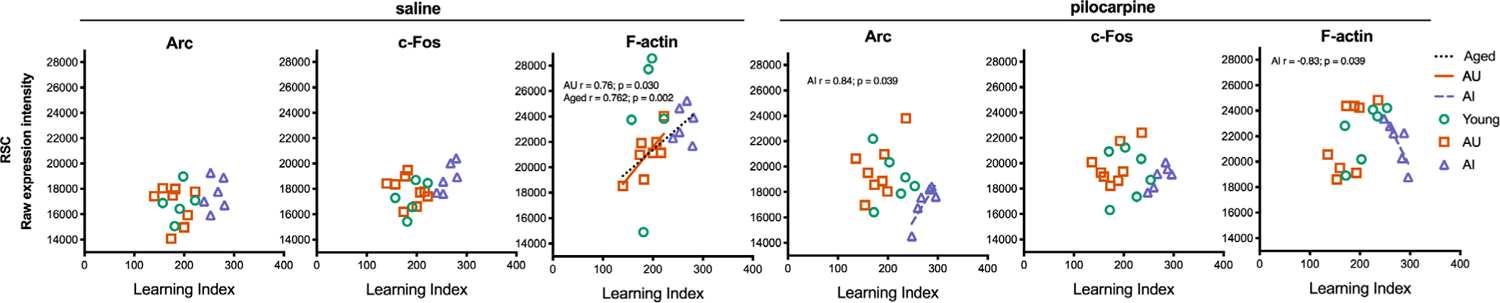
Correlation analyses of Arc and c-Fos expression in the retrosplenial cortex. Average Arc and c-Fos expression levels in the retrosplenial cortex were plotted against learning index scores for each rat. Pearson r values and their respective lines of best fit are plotted for significant associations (p < .05)
3.5 |. Principal component analysis
Results of the PCA directly confirmed that the relationship between activity marker expression and individual differences in memory in young and aged rats was distinct across the brain regions examined. Thirteen variables were considered in the analysis, including Arc and c-Fos values for all six anatomical regions examined, in addition to LI values. Three components explained over 91% of the variance, with Eigenvalues over 1. Loadings on the first component, accounting for nearly 40% of the variance, included c-Fos and Arc expression values for all mPFC regions, CA1 c-Fos expression, and LI scores. These findings are consistent with the bi-variate correlations described earlier (Figure 6), demonstrating that induced IEG activity in the PFC was directly coupled with spatial memory across the full range of capacities seen in Y and aged rats with and without impairment. Activity marker expression in the RSC, by comparison, predominantly loaded on a second orthogonal component, confirming that the association with memory was qualitatively different than that observed in the PFC. The majority of the hippocampus data loaded on a third component, further underscoring the significance of regional differences in how activation is coupled with cognitive function in aging (Table 7).
TABLE 7.
Component loadings from principal component analysis
| Components | ||||
|---|---|---|---|---|
| 1 | 2 | 3 | ||
| IL | Arc | 0.925 | 0.158 | −0.215 |
| PL | Arc | 0.902 | 0.227 | −0.272 |
| PL | c-Fos | 0.892 | −0.083 | −0.352 |
| aCG | c-Fos | 0.871 | −0.053 | −0.393 |
| IL | c-Fos | 0.869 | −0.064 | −0.049 |
| CA1 | c-Fos | 0.820 | −0.004 | 0.411 |
| aCG | Arc | 0.807 | 0.300 | −0.293 |
| LI score | 0.568 | 0.017 | −0.139 | |
| RSC | c-Fos | −0.012 | 0.986 | −0.112 |
| RSC | Arc | −0.076 | 0.984 | 0.106 |
| CA1 | Arc | 0.494 | 0.013 | 0.815 |
| CA3 | Arc | 0.544 | 0.138 | 0.731 |
| CA3 | c-Fos | 0.612 | −0.030 | 0.722 |
PCA loadings >0.5 are shown in bold.
4 |. DISCUSSION
Using brain-wide pharmacological induction of IEGs as a proxy, we took an unbiased approach to assess the relationship between interindividual variability in age-related cognitive outcome and neural network dynamics. In response to the activation of memory-related systems by pilocarpine administration, we observed a striking relationship between expression levels of the plasticity markers Arc and c-Fos, and cognitive status—in stark contrast to the complete absence of association under basal conditions. The nature of the coupling between induced expression and cognitive function was regionally specific and qualitatively different depending on the network engaged. In the mPFC, higher induced activity was associated with age-related cognitive impairment, while young rats and aged animals with intact spatial memory displayed equivalent marker expression levels. In the hippocampus, pilocarpine-induced marker expression was also coupled with spatial memory, but did not differ between groups based on either age or cognitive status. These results provide compelling evidence that, whereas constitutive, basal activity can remain relatively stable, the dynamic range of induced network activity in critical circuitry is tightly coupled to cognitive function in aging.
In the hippocampus, we observed a strong relationship between pilocarpine-induced activity and spatial memory performance among aged rats. Regardless of cognitive status, aged animals displayed a range of hippocampal IEG induction that fell within the same dynamic limits as young animals. These data show that disruption in the capacity to drive hippocampal activity alone is unlikely to account for age-related spatial memory deficits. By comparison, in a related study that quantified c-Fos via in situ hybridization following pilocarpine administration, hippocampal expression displayed a strong linear correlation across the full range of water maze performance seen in aged animals (Haberman et al., 2017). One account of these contrasting results is that they reflect differential effects on mRNA versus protein levels, or differences in measurement sensitivity associated with the detection methods used. Consistent with that possibility, we were unable to confirm the elevated levels of hippocampal c-Fos expression reported in aged-impaired rats as a group following pilocarpine administration (Haberman et al., 2017). While the molecular basis of the discrepancies between results for mRNA and protein levels are unclear, findings for Arc suggest they likely involve a complex interaction of age-related changes in IEG epigenetics, including methylation (Penner et al., 2011, 2016) and histone modifications (Myrum, Fletcher, De, Becker, & Rapp, 2018), together with increased basal translation and reduced protein turnover in aged impaired rats (Fletcher et al., 2014).
Compared to the hippocampus, we observed a fundamentally different association between network activity and spatial memory capacity in the mPFC, where we found a simple linear correlation when young and aged animals were considered together in the analysis. Across the full range of individual differences observed, in all areas of the PFC examined, the greater the activation response to pilocarpine, the worse spatial memory capacities rats displayed. This relationship is in accord with a previous study taking a similar experimental approach, which showed a linear correlation between c-Fos expression and LI score in the orbitofrontal cortex (Haberman et al., 2017). As was the case for the hippocampus in the current study, the association with memory function was strictly activity-dependent in the mPFC system, as basal Arc and c-Fos levels were unrelated to cognitive status.
Converging evidence supports the approach used here as an informative model on neurocognitive integrity in aging, and more specifically, on the role of changes in network excitability. For example, a previous study examining low dose pilocarpine induction also observed significant correlations between age-related cognitive impairment and cortical and hippocampal c-Fos expression (Haberman et al., 2017). The direction of the relationship between IEG expression and spatial memory capacity was the same as in previous reports, where higher induction correlated with worse performance (Fletcher et al., 2014; Haberman et al., 2017). Hippocampal Arc expression in this model recapitulates the results for experience-dependent induction (Fletcher et al., 2014), where water maze training failed to increase Arc significantly above basal levels, specifically in aged rats with impaired spatial memory. The results for the PFC, where nominal pilocarpine-induced increases in IEG expression were observed in Y and AI, but not AU rats, are also reminiscent of a study demonstrating a similar pattern for Arc after training on a test of cognitive flexibility that engages the PFC (Tomás Pereira, Gallagher, & Rapp, 2015). While a pharmacological approach is unlikely to mimic physiological patterns of activity, findings from this model support a body of work indicating that altered intrinsic network excitability contributes to cognitive aging (Oh, Simkin, & Disterhoft, 2016).
Although the activity proxy measured here was not induced by engaging the spatial memory demands used to document cognitive integrity, our results indicate that, alongside the important contribution of task-related neuronal firing, memory function is strongly coupled with the overall dynamic range of activity. The specific cell populations and circuit architecture responsible for regulating this dynamic range is an active area of investigation and presumably includes multiple levels of organization. Current studies implicate a complex profile of alterations in GABAergic systems (McQuail, Frazier, & Bizon, 2015). For example, while aging is associated with enhanced inhibitory tone in the PFC (Banuelos et al., 2014), the hippocampus displays a reduction in interneuron number selectively in aged animals with memory impairments (Spiegel, Koh, Vogt, Rapp, & Gallagher, 2013), together with a subfield-selective increase in excitability (Simkin et al., 2015; Thomé, Gray, Erickson, Lipa, & Barnes, 2016). Another likely contributor is the reduction seen in cholinergic tone in both normal aging and Alzheimer’s disease (Bartus, Dean, Beer, & Lippa, 1982; Contestabile, 2011; Dumas & Newhouse, 2011). Cholinergic drive onto hippocampal principal neurons is about half as powerful in memory-impaired aged rats as young animals (Shen & Barnes, 1996), and may contribute to our finding that pilocarpine fails to induce Arc and c-Fos in aged animals with memory impairment. Ultimately, it will be important to understand these changes in the context of other known circuit-specific vulnerabilities, including, for example, the well-documented decline in the integrity of perforant path input from the entorhinal cortex to the hippocampus (Yassa, Muftuler, & Stark, 2010), and associated compromise of specific synapse types early in the course of cognitive aging (Morrison & Baxter, 2012).
The impact of c-Fos dysregulation on cognitive aging is difficult to predict on the basis of our surprisingly limited understanding of its role in synaptic plasticity. Disrupted Arc expression, on the other hand, is positioned to have a substantial influence, reflecting its vital role in regulating surface α-amino-3-hydroxy-5-methyl-4-isoxazolepropionic (AMPA) receptors at recently activated synapses (Bramham et al., 2010; Chowdhury et al., 2006; Minatohara, Akiyoshi, & Okuno, 2016). Further support for the idea that disrupted Arc expression might contribute to cognitive aging comes from other clinical conditions where elevated Arc expression is coupled with cognitive impairment, including Gordon Holmes syndrome (Husain et al., 2017), fragile X syndrome (Park et al., 2009), Angelman syndrome (Cao et al., 2013; Greer et al., 2010; Kühnle, Mothes, Matentzoglu, & Scheffner, 2013; Mabb et al., 2014; Pastuzyn & Shepherd, 2017), and Alzheimer’s disease (Kerrigan & Randall, 2013).
Arc and c-Fos are upregulated in activated subsets of neurons associated with learning and memory formation (Yap & Greenberg, 2018) and their use as activity markers has greatly facilitated our understanding of the neural network architectures that underlie memory behavior and cognition. However, the degree to which IEG expression levels directly correspond with electrophysiological activity is less clear. Earlier efforts examining this relationship indicated that c-Fos expression correlates with synaptic activity levels, but not with the number of action potentials (Labiner et al., 1993). These data suggest that the threshold to induce IEG expression is lower than that required for action potentials. Nonetheless, the proportion of behavior-induced Arc-positive cells in CA1 is similar to electrophysiologically defined active neurons, further indicating a tight concordance between IEG expression and neuronal activity (Guzowski et al., 2006). Expression intensity within those cell populations, however, was not measured in that study. Our conclusions regarding neural network activity based on IEG expression should take these unknowns into consideration.
With respect to the related issue of quantification methodology, in the present study we opted to measure immunofluorescence intensity rather than the number of positive cells. A previous study reported that the proportion of CA1 neurons that were Arc positive following exploratory behavior did not differ between young and aged rats, but the amount of mRNA per neuron was reduced in aged rats (Penner et al., 2011). Expression levels therefore may be more sensitive to disrupted plasticity signaling than the number of IEG-positive cells. Similarly, behavior-induced Arc quantified through densitometric analyses of in situ hybridization across large numbers of cells showed differences in Arc levels that associated with age-related cognitive status (Fletcher et al., 2014).
Accumulating evidence implicates disrupted activity levels and plasticity as key features of age-related cognitive outcome. Using a pharmacological induction approach, we bolster those findings by characterizing the relationship between interindividual variability in spatial memory and network activity and plasticity. Another notable strength of the current experimental design is that the inclusion of saline controls revealed numerically higher basal activity in the aged impaired hippocampus. The dynamic engagement of memory-related networks revealed a tight coupling between activity and cognitive status, while constitutive activity levels appeared to be completely unrelated to cognitive status. We also observed that the relationship between activity and cognitive status is highly region specific, indicating qualitatively distinct signatures of aging between brain regions. These data raise the intriguing question of whether network activity and plasticity can be manipulated to positively influence cognitive outcome in aging. Several lines of evidence indicate that this may be an encouraging approach—for example, through noninvasive brain stimulation (Gomes-Osman et al., 2018), lifestyle changes (Christie et al., 2017), or pharmacological intervention (Koh, Haberman, Foti, McCown, & Gallagher, 2010). It will also be useful to determine whether the coupling between network activity and cognitive aging observed here similarly occurs during other active brain states, such as sleep-mediated memory consolidation.
ACKNOWLEDGMENTS
Thanks to Jeffrey M. Long for technical support and input as well as to Audrey M. Morrow, Lisa R. Taxier, and Katherine H. Schulze for their technical support. This research was supported entirely by the Intramural Research Program of the National Institutes of Health, National Institute on Aging.
REFERENCES
- Banuelos C, Beas BS, McQuail JA, Gilbert RJ, Frazier CJ, Setlow B, & Bizon JL (2014). Prefrontal cortical GABAergic dysfunction contributes to age-related working memory impairment. The Journal of Neuroscience, 34, 3457–3466. 10.1523/JNEUROSCI.5192-13. 2014 [DOI] [PMC free article] [PubMed] [Google Scholar]
- Bartus RT, Dean RL, Beer B, & Lippa AS (1982). The cholinergic hypothesis of geriatric memory dysfunction. Science, 217, 408–414. Retrieved from http://www.ncbi.nlm.nih.gov/pubmed/7046051 [DOI] [PubMed] [Google Scholar]
- Bizon JL, Foster TC, Alexander GE, & Glisky EL (2012). Characterizing cognitive aging of working memory and executive function in animal models. Frontiers in Aging Neuroscience, 4, 1–14. [DOI] [PMC free article] [PubMed] [Google Scholar]
- Bramham CR, Alme MN, Bittins M, Kuipers SD, Nair RR, Pai B, … Wibrand K (2010). The arc of synaptic memory. Experimental Brain Research, 200, 125–140. Retrieved from http://www.pubmedcentral.nih.gov/articlerender.fcgi?artid=2803749&tool=pmcentrez&rendertype=abstract [DOI] [PMC free article] [PubMed] [Google Scholar]
- Bucci DJ, Rosen DL, & Gallagher M (1998). Effects of age on pilocarpine-induced c-fos expression in rat hippocampus and cortex. Neurobiology of Aging, 19, 227–232. [DOI] [PubMed] [Google Scholar]
- Burke SN, & Barnes CA (2010). Senescent synapses and hippocampal circuit dynamics. Trends in Neurosciences, 33, 153–161. Retrieved from https://academic.oup.com/cercor/article-lookup/doi/10.1093/cercor/bhv200 [DOI] [PMC free article] [PubMed] [Google Scholar]
- Cao C, Rioult-Pedotti MS, Migani P, Yu CJ, Tiwari R, Parang K, … Marshall J (2013). Impairment of TrkB-PSD-95 signaling in Angelman syndrome. PLoS Biology, 11, e1001478. 10.1371/journal.pbio.1001478 [DOI] [PMC free article] [PubMed] [Google Scholar]
- Chowdhury S, Shepherd JD, Okuno H, Lyford G, Petralia RS, Plath N, … Worley PF (2006). Arc/Arg3.1 interacts with the endocytic machinery to regulate AMPA receptor trafficking. Neuron, 52, 445–459. Retrieved from http://www.pubmedcentral.nih.gov/articlerender.fcgi?artid=1784006&tool=pmcentrez&rendertype=abstract [DOI] [PMC free article] [PubMed] [Google Scholar]
- Christie GJ, Hamilton T, Manor BD, Farb NAS, Farzan F, Sixsmith A, … Moreno S (2017). Do lifestyle activities protect against cognitive decline in aging? A review. Frontiers in Aging Neuroscience, 9, 381. Retrieved from http://journal.frontiersin.org/article/10.3389/fnagi.2017.00381/full [DOI] [PMC free article] [PubMed] [Google Scholar]
- Contestabile A (2011). The history of the cholinergic hypothesis. Behavioural Brain Research, 221, 334–340. 10.1016/j.bbr.2009.12.044 [DOI] [PubMed] [Google Scholar]
- Dumas J. a., & Newhouse P. a. (2011). The cholinergic hypothesis of cognitive aging revisited again: Cholinergic functional compensation. Pharmacology, Biochemistry, and Behavior, 99, 254–261. 10.1016/j.pbb.2011.02.022 [DOI] [PMC free article] [PubMed] [Google Scholar]
- Figueroa KW, Griffin MT, & Ehlert FJ (2009). Selectivity of agonists for the active state of M1 to M4 muscarinic receptor subtypes. The Journal of Pharmacology and Experimental Therapeutics, 328, 331–342. Retrieved from http://www.ncbi.nlm.nih.gov/pubmed/18824613 [DOI] [PMC free article] [PubMed] [Google Scholar]
- Fletcher BR, Hill GS, Long JM, Gallagher M, Shapiro ML, & Rapp PR (2014). Neurobiology of learning and memory a fine balance : Regulation of hippocampal arc/Arg3. 1 transcription, translation and degradation in a rat model of normal cognitive aging. Neurobiology of Learning and Memory, 115, 58–67. Retirieved from 10.1016/j.nlm.2014.08.007 [DOI] [PMC free article] [PubMed] [Google Scholar]
- Gallagher M, Burwell R, & Burchinal M (1993). Severity of spatial learning impairment in aging: Development of a learning index for performance in the Morris water maze. Behavioral Neuroscience, 107, 618–626. [DOI] [PubMed] [Google Scholar]
- Gomes-Osman J, Indahlastari A, Fried PJ, Cabral DLF, Rice J, Nissim NR, … Woods AJ (2018). Non-invasive brain stimulation: Probing intracortical circuits and improving cognition in the aging brain. Frontiers in Aging Neuroscience, 10, 177. Retrieved from https://www.frontiersin.org/article/10.3389/fnagi.2018.00177/full [DOI] [PMC free article] [PubMed] [Google Scholar]
- Greenberg ME, Ziff EB, & Greene LA (1986). Stimulation of neuronal acetylcholine receptors induces rapid gene transcription. Science, 234, 80–83. Retrieved from http://www.ncbi.nlm.nih.gov/pubmed/3749894 [DOI] [PubMed] [Google Scholar]
- Greer PL, Hanayama R, Bloodgood BL, Mardinly AR, Lipton DM, Flavell SW, … Greenberg ME (2010). The Angelman syndrome protein Ube3A regulates synapse development by ubiquitinating arc. Cell, 140, 704–716. Retrieved from http://www.pubmedcentral.nih.gov/articlerender.fcgi?artid=2843143&tool=pmcentrez&rendertype=abstract [DOI] [PMC free article] [PubMed] [Google Scholar]
- Guzowski JF, Miyashita T, Chawla MK, Sanderson J, Maes LI, Houston FP, … Barnes CA (2006). Recent behavioral history modifies coupling between cell activity and Arc gene transcription in hippocampal CA1 neurons. Proceedings of the National Academy of Sciences, 103, 1077–1082. Retrieved from http://www.pnas.org/cgi/doi/10.1073/pnas.0505519103 [DOI] [PMC free article] [PubMed] [Google Scholar]
- Haberman RP, Koh MT, & Gallagher M (2017). Heightened cortical excitability in aged rodents with memory impairment. Neurobiology of Aging, 54, 144–151. Retrieved from http://linkinghub.elsevier.com/retrieve/pii/S0197458016303347 [DOI] [PMC free article] [PubMed] [Google Scholar]
- Hernandez AR, Reasor JE, Truckenbrod LM, Campos KT, Federico QP, Fertal KE, … Burke SN (2018). Dissociable effects of advanced age on prefrontal cortical and medial temporal lobe ensemble activity. Neurobiology of Aging, 70, 217–232. Retrieved from https://linkinghub.elsevier.com/retrieve/pii/S0197458018302331 [DOI] [PMC free article] [PubMed] [Google Scholar]
- Husain N, Yuan Q, Yen Y-C, Pletnikova O, Sally DQ, Worley P, … Shawn Je H (2017). TRIAD3/RNF216 mutations associated with Gordon Holmes syndrome lead to synaptic and cognitive impairments via Arc misregulation. Aging Cell, 16, 281–292. Retrieved from http://doi.wiley.com/10.1111/acel.12551 [DOI] [PMC free article] [PubMed] [Google Scholar]
- Kawashima T, Okuno H, & Bito H (2014). A new era for functional labeling of neurons: Activity-dependent promoters have come of age. Frontiers in Neural Circuits, 8, 1–9. Retrieved from http://journal.frontiersin.org/article/10.3389/fncir.2014.00037/abstract [DOI] [PMC free article] [PubMed] [Google Scholar]
- Kerrigan TL, & Randall AD (2013). A new player in the “synaptopathy” of Alzheimer’s disease—Arc/arg 3.1. Frontiers in Neurology 4, 9. Retrieved from http://journal.frontiersin.org/article/10.3389/fneur.2013.00009/abstract [DOI] [PMC free article] [PubMed] [Google Scholar]
- Koh MT, Haberman RP, Foti S, McCown TJ, & Gallagher M (2010). Treatment strategies targeting excess hippocampal activity benefit aged rats with cognitive impairment. Neuropsychopharmacology, 35, 1016–1025. Retrieved from http://www.nature.com/articles/npp2009207 [DOI] [PMC free article] [PubMed] [Google Scholar]
- Kühnle S, Mothes B, Matentzoglu K, & Scheffner M (2013). Role of the ubiquitin ligase E6AP/UBE3A in controlling levels of the synaptic protein arc. Proceedings of the National Academy of Sciences of the United States of America, 110, 8888–8893. Retrieved from http://www.pubmedcentral.nih.gov/articlerender.fcgi?artid=3670309&tool=pmcentrez&rendertype=abstract [DOI] [PMC free article] [PubMed] [Google Scholar]
- Labiner D, Butler L, Cao Z, Hosford D, Shin C, & McNamara J (1993). Induction of c-fos mRNA by kindled seizures: Complex relationship with neuronal burst firing. The Journal of Neuroscience, 13, 744–751. Retrieved from http://www.jneurosci.org/lookup/doi/10.1523/JNEUROSCI.13-02-00744.1993. [DOI] [PMC free article] [PubMed] [Google Scholar]
- Legon W, Punzell S, Dowlati E, Adams SE, Stiles AB, & Moran RJ (2015). Altered prefrontal excitation/inhibition balance and prefrontal output: Markers of aging in human memory networks. Cerebral Cortex, 26, 4315–4326. Retrieved from http://www.cercor.oxfordjournals.org/lookup/doi/10.1093/cercor/bhv200. [DOI] [PubMed] [Google Scholar]
- Li H-J, Hou X-H, Liu H-H, Yue C-L, Lu G-M, & Zuo X-N (2015). Putting age-related task activation into large-scale brain networks: A meta-analysis of 114 fMRI studies on healthy aging. Neuroscience and Biobehavioral Reviews, 57, 156–174. Retrieved from http://linkinghub.elsevier.com/retrieve/pii/S0149763415002316 [DOI] [PubMed] [Google Scholar]
- Mabb AM, Je HS, Wall MJ, Robinson CG, Larsen RS, Qiang Y, … Ehlers MD (2014). Triad3A regulates synaptic strength by ubiquitination of Arc. Neuron, 82, 1299–1316. Retrieved from https://www.ncbi.nlm.nih.gov/pubmed/24945773 [DOI] [PMC free article] [PubMed] [Google Scholar]
- McQuail JA, Frazier CJ, & Bizon JL (2015). Molecular aspects of age-related cognitive decline: The role of GABA signaling. Trends in Molecular Medicine, 21, 450–460. 10.1016/j.molmed.2015.05.002 [DOI] [PMC free article] [PubMed] [Google Scholar]
- Minatohara K, Akiyoshi M, & Okuno H (2016). Role of immediate-early genes in synaptic plasticity and neuronal ensembles underlying the memory trace. Frontiers in Molecular Neuroscience, 8, 1–11. http://journal.frontiersin.org/Article/10.3389/fnmol.2015.00078/abstract [DOI] [PMC free article] [PubMed] [Google Scholar]
- Morrison JH, & Baxter MG (2012). The ageing cortical synapse: Hallmarks and implications for cognitive decline. Nature Reviews. Neuroscience, 13, 240–250. Retrieved from http://www.nature.com/doifinder/10.1038/nrn3200 [DOI] [PMC free article] [PubMed] [Google Scholar]
- Myrum C, Fletcher BR, De S, Becker KG, & Rapp PR (2018). Surveying the epigenetic landscape of Arc-mediated age-related cognitive decline. Society for Neuroscience Conference. San Diego, CA, USA. p. 512.04/GGG7. [Google Scholar]
- Oh MM, Simkin D, & Disterhoft JF (2016). Intrinsic hippocampal excitability changes of opposite signs and different origins in CA1 and CA3 pyramidal neurons underlie aging-related cognitive deficits. Frontiers in Systems Neuroscience, 10, 1–8. Retrieved from http://journal.frontiersin.org/Article/10.3389/fnsys.2016.00052/abstract [DOI] [PMC free article] [PubMed] [Google Scholar]
- Park S, Park JM, Kim S, Kim J, Shepherd JD, Smith-hicks CL, … Worley PF (2009). Elongation factor 2 and fragile X mental retardation protein control the dynamic translation of arc/Arg3.1 essential for mGluR-LTD. Neuron, 59, 70–83. [DOI] [PMC free article] [PubMed] [Google Scholar]
- Pastuzyn ED, & Shepherd JD (2017). Activity-dependent Arc expression and homeostatic synaptic plasticity are altered in neurons from a mouse model of Angelman syndrome. Frontiers in Molecular Neuroscience, 10, 234. Retrieved from http://journal.frontiersin.org/article/10.3389/fnmol.2017.00234/full [DOI] [PMC free article] [PubMed] [Google Scholar]
- Penner MR, Parrish RR, Hoang LT, Roth TL, Lubin FD, & Barnes CA (2016). Age-related changes in Egr 1 transcription and DNA methylation within the hippocampus. Hippocampus, 26, 1008–1020. Retrieved from http://doi.wiley.com/10.1002/hipo.22583 [DOI] [PMC free article] [PubMed] [Google Scholar]
- Penner MR, Roth TL, Chawla MK, Hoang LT, Roth ED, Lubin FD, … Barnes CA (2011). Age-related changes in Arc transcription and DNA methylation within the hippocampus. Neurobiology of Aging, 32, 2198–2210. 10.1016/j.neurobiolaging.2010.01.009 [DOI] [PMC free article] [PubMed] [Google Scholar]
- Rapp PR, Bañuelos C, & Myrum C (2019). Neuroadaptive trajectories of healthy mindspan: From genes to neural networks. In Handbook of cognitive aging. Cambridge, United Kingdom: Cambridge University Press. [Google Scholar]
- Schimanski LA, & Barnes CA (2010). Neural protein synthesis during aging: Effects on plasticity and memory. Frontiers in Aging Neuroscience 2, 26. Retrieved from http://journal.frontiersin.org/article/10.3389/fnagi.2010.00026/abstract [DOI] [PMC free article] [PubMed] [Google Scholar]
- Shen J, & Barnes CA (1996). Age-related decrease in cholinergic synaptic transmission in three hippocampal subfields. Neurobiology of Aging, 17, 439–451. [DOI] [PubMed] [Google Scholar]
- Simkin D, Hattori S, Ybarra N, Musial TF, Buss EW, Richter H, … Disterhoft JF (2015). Aging-related hyperexcitability in CA3 pyramidal neurons is mediated by enhanced A-type K+ channel function and expression. The Journal of Neuroscience, 35, 13206–13218. [DOI] [PMC free article] [PubMed] [Google Scholar]
- Smith TD, Adams MM, Gallagher M, Morrison JH, & Rapp PR (2000). Circuit-specific alterations in hippocampal synaptophysin immunoreactivity predict spatial learning impairment in aged rats. The Journal of Neuroscience, 20, 6587–6593. Retrieved from http://www.ncbi.nlm.nih.gov/pubmed/10964964 [DOI] [PMC free article] [PubMed] [Google Scholar]
- Spiegel AM, Koh MT, Vogt NM, Rapp PR, & Gallagher M (2013). Hilar interneuron vulnerability distinguishes aged rats with memory impairment. The Journal of Comparative Neurology, 521, 3508–3523. [DOI] [PMC free article] [PubMed] [Google Scholar]
- Steward O, Farris S, Pirbhoy PS, Darnell J, & Van DSJ (2015). Localization and local translation of Arc/Arg3.1 mRNA at synapses: Some observations and paradoxes. Frontiers in Molecular Neuroscience, 7, 1–15. Retrieved from http://journal.frontiersin.org/article/10.3389/fnmol.2014.00101/abstract [DOI] [PMC free article] [PubMed] [Google Scholar]
- Sugar J, Witter MP, van Strien NM, & Cappaert NLM (2011). The retrosplenial cortex: Intrinsic connectivity and connections with the (para)hippocampal region in the rat. An interactive connectome. Frontiers in Neuroinformatics, 5, 7. Retrieved from: http://journal.frontiersin.org/article/10.3389/fninf.2011.00007/abstract [DOI] [PMC free article] [PubMed] [Google Scholar]
- Thomé A, Gray DT, Erickson CA, Lipa P, & Barnes CA (2016). Memory impairment in aged primates is associated with region-specific network dysfunction. Molecular Psychiatry, 21, 1257–1262. Retrieved from http://www.nature.com/articles/mp2015160 [DOI] [PMC free article] [PubMed] [Google Scholar]
- Tomás Pereira I, Gallagher M, & Rapp PR (2015). Head west or left, east or right: Interactions between memory systems in neurocognitive aging. Neurobiology of Aging, 36, 3067–3078. 10.1016/j.neurobiolaging.2015.07.024 [DOI] [PMC free article] [PubMed] [Google Scholar]
- Turski L, Ikonomidou C, Turski WA, Bortolotto ZA, & Cavalheiro EA (1989). Review: Cholinergic mechanisms and epileptogenesis. The seizures induced by pilocarpine: A novel experimental model of intractable epilepsy. Synapse, 3, 154–171. Retrieved from http://www.ncbi.nlm.nih.gov/pubmed/2648633 [DOI] [PubMed] [Google Scholar]
- Vann SD, Aggleton JP, & Maguire EA (2009). What does the retrosplenial cortex do? Nature Reviews. Neuroscience, 10, 792–802. 10.1038/nrn2733 [DOI] [PubMed] [Google Scholar]
- Yap E-L, & Greenberg ME (2018). Activity-regulated transcription: Bridging the gap between neural activity and behavior. Neuron, 100, 330–348. Retrieved from https://linkinghub.elsevier.com/retrieve/pii/S0896627318309012 [DOI] [PMC free article] [PubMed] [Google Scholar]
- Yassa MA, Muftuler LT, & Stark CEL (2010). Ultrahigh-resolution microstructural diffusion tensor imaging reveals perforant path degradation in aged humans in vivo. Proceedings of the National Academy of Sciences, 107, 12687–12691. Retrieved from http://www.pnas.org/lookup/doi/10.1073/pnas.1002113107 [DOI] [PMC free article] [PubMed] [Google Scholar]