Abstract
At the center of the SARS-CoV2 infection, the spike protein and its interaction with the human receptor ACE2 play a central role in the molecular machinery of SARS-CoV2 infection of human cells. Vaccine therapies are a valuable barrier to the worst effects of the virus and to its diffusion, but the need of purposed drugs is emerging as a core target of the fight against COVID19. In this respect, the repurposing of drugs has already led to discovery of drugs thought to reduce the effects of the cytokine storm, but still a drug targeting the spike protein, in the infection stage, is missing. In this work, we present a multifaceted computational approach strongly grounded on a biophysical modeling of biological systems, so to disclose the interaction of the SARS-CoV2 spike protein with ACE2 with a special focus to an allosteric regulation of the spike–ACE2 interaction. Our approach includes the following methodologies: Protein Contact Networks and Network Clustering, Targeted Molecular Dynamics, Elastic Network Modeling, Perturbation Response Scanning, and a computational analysis of energy flow and SEPAS as a protein-softness and monomer-based affinity predictor. We applied this approach to free (closed and open) states of spike protein and spike–ACE2 complexes. Eventually, we analyzed the interactions of free and bound forms of spike with hepcidin (HPC), the major hormone in iron regulation, recently addressed as a central player in the COVID19 pathogenesis, with a special emphasis to the most severe outcomes. Our results demonstrate that, compared with closed and open states, the spike protein in the ACE2-bound state shows higher allosteric potential. The correspondence between hinge sites and the Allosteric Modulation Region (AMR) in the S-ACE complex suggests a molecular basis for hepcidin involvement in COVID19 pathogenesis. We verify the importance of AMR in different states of spike and then study its interactions with HPC and the consequence of the HPC-AMR interaction on spike dynamics and its affinity for ACE2. We propose two complementary mechanisms for HPC effects on spike of SARS-CoV-2; (a) HPC acts as a competitive inhibitor when spike is in a preinfection state (open and with no ACE2), (b) the HPC-AMR interaction pushes the spike structure into the safer closed state. These findings need clear molecular in vivo verification beside clinical observations.
Introduction
The COVID19 pandemic urgently needs a therapeutic solution. Emerging in early 2020, the pandemic seems to be here to stay and coexist with humanity for the foreseeable future. It is necessary to find reliable therapeutic solutions based on a deep understanding of molecular mechanisms underlying virus infection and spreading.1 The spike protein has become the main molecular target of therapy2 and vaccination strategies3 due to its central role in the very early stage of the virus infection.
Its mutations strongly characterize SARS-CoV2 (the virus responsible for COVID19) with respect to genetic homologues (such as SARS-CoV), and they all come in the direction of optimizing the binding of the spike protein with its main receptor, human angiotensin converting enzyme 2 (ACE2). Because of the widespread presence of human ACE2 in many tissues (it is widely present in lungs, kidney, and gut), COVID19 acts with a multisystemic pathology.
The specific nature of the spike–ACE2 interaction has been largely explored since the pandemic outbreak, revealing special features awarding SARS-CoV2 with an unprecedented infectivity with respect to similar CoV (SARS-CoV and MERS-CoV), invoking a step change in spike flexibility as the main driver for improved infectivity and, more in general, providing insight on the very successful interaction with the receptor ACE24 also in the perspective of identification of epitopes as antibodies targeting.5 The key role played by the spike–ACE2 interaction is also reflected in the mutational escape to antibodies upon mutation, which involves mainly the receptor binding domain (RBD) and receptor binding motif (RBM) of the spike protein.5
Recently, the role of COVID19 in igniting iron dysregulation and hemoglobinopathy has been evidenced, pointing to an intermingled concurrence of infectious mechanisms and severe hematological pathological changes (e.g., blood clots).
Hepcidin plays a central role in iron metabolism and is involved in different mechanisms activated by COVID19; its serum values are highly altered in COVID 19 patients and have been used to predict COVID19 prognosis.6 Hepcidin is the main hormone in iron regulation, allowing iron retention in cells during inflammation. For that, it belongs to the molecular machinery of native immune systems, whose role is more and more evident in the different stages of the inflammatory response to infection threats.7 A recent work invokes a mimetic behavior of spike protein to explain the low level in critically ill patients.8 Human hepcidin is a 25-residue peptide, produced by a furin cleavage of the prohormone form. Incidentally, furin also plays a central role in SARS-CoV2 infection, since furin cleavage of the spike–ACE2 complex allows virus entry. So hepcidin and spike protein compete with the same enzyme, furin, for their activity.
Conversely, hepcidin belongs to the family of beta-hairpin peptides, with known antimicrobial properties that depend on the number of disulfide bonds stabilizing the peptide (the more, the better). In this family, hepcidin has the largest number of disulfide bonds (four) and is positioned as the potentially most effective antimicrobial peptide in its family. Hepcidin exhibits antifungal activity against Candida albicans, Aspergillus fumigatus, and Aspergillus niger and antibacterial activity against Escherichia coli, Staphylococcus aureus, Staphylococcus epidermidis, and group B Streptococcus.9
Eventually, Ehsani et al. demonstrated that the cytoplasmatic tail of the SARS-CoV2 spike protein shows a strong sequence similarity with hepcidin.10
For all these reasons, we decided to investigate the molecular interaction of human hepcidin with different forms of SARS-CoV2. We performed docking of human hepcidin with the closed, intermediate, and open forms of spike protein and with the complex spike–ACE2.
We also identified the allosteric sites in the open and closed conformations, to detect possible active regions for interactions with hepcidin, in the perspective of verifying its activity as an allosteric drug. The allosteric drug paradigm has been emerging as a novel landscape in drug discovery, requiring us also to better define the protein–protein interactions role in allostery of oligomeric proteins, such as spike and its complexes with ACE2.11
We found that different computational approaches, stemming from diverse hypotheses on protein conformational changes and binding, converge in suggesting a potentially effective interaction between hepcidin and spike protein. These results add a “molecular” layer to the multifaceted role of hepcidin in COVID19 pathogenesis.
Materials and Methods
Structural Data and Molecular Docking
We performed the analysis of the complex SARS-CoV2 spike–ACE2 structure available as Protein Data Bank (PDB) from the Web site of Zhang’s laboratory12 that we have already used in our previous work;13 before the analysis, structures were equilibrated by means of the adaptive tempering molecular dynamics (AT-MD) technique, as thoroughly explained below (see the next section).
To test the effect of hepcidin on the stability and affinity of the different forms of the spike protein, we used the Web server SWARM to perform the protein–peptide docking, which has been previously evaluated as the most reliable with respect to the reproduction of native conformations of peptide–protein complexes.14 Upon docking, we performed an all-atom molecular dynamics to equilibrate the spike–ACE2-hepcidin complex. We performed all the analysis on the equilibrium conformation resulting from the molecular dynamics simulation.
We report also the energy parameters of the complexes as computed through the PDBePISA web server (https://www.ebi.ac.uk/pdbe/pisa/); energy parameters of assemblies are explained in detail later.
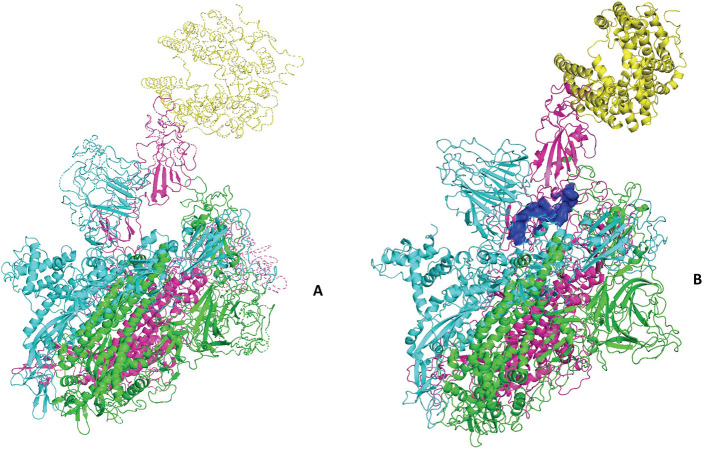
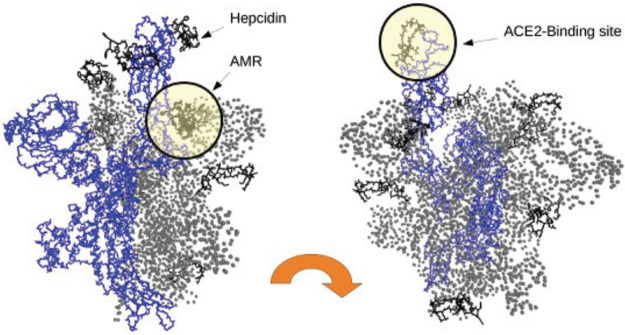
We performed an all-atom molecular dynamics on the two complexes, namely, spike + ACE2 and spike + ACE2 + hepcidin. We report the structure of the equilibrated forms of the spike–ACE2 complex, with and without hepcidin (see Figure 1); hepcidin binds in a region partially overlapping with the Allosteric Modulation Region (AMR) we identified in our previous study.13
Figure 1.
Complex of the spike protein of SARS-CoV2 with the human receptor ACE2 (in yellow). (A) Complex spike–ACE2; (B) complex spike–ACE2 docked with the hepcidin (blue surface).
Allosteric Region Identification by Protein Contact Networks Clustering
In previous works,13,15,16 we demonstrated the presence of an allosteric site in the spike protein, with respect to the binding with human ACE2, its main receptor. In this work, we apply again the same methodology to derive the main feature of the complexes (with and without hepcidin) so to disclose the role of this peptide in the complex of spike with the human receptor ACE2. We applied the clustering analysis on the structures shown in Figure 1 and to all the frames of the molecular dynamics of equilibration of the docked complex (spike protein + ACE2 + hepcidin), in order to identify guiding variables in the dynamics. The methodology of network clustering is based on the representation of protein molecular structures as networks (Protein Contact Networks (PCNs)): single residues are the network nodes, while network edges are the active contacts between residues. We define “active contacts” as those corresponding to a distance between residues between 4 and 8 Å (significant noncovalent interactions).17
The mathematical representation of the PCN is the adjacency matrix, defined as
| 1 |
The basic descriptor of the network connectivity is the node degree defined as
| 2 |
The average degree (adeg) of the network is the average value of ki over the number N of residues. Network shortest paths identify shortcuts in signal transmission through networks. The shortest path spij between the ith and jth nodes describes the lowest number of links to be trasversed for connecting the two nodes. This metrics plays a central role in identifying routes of signal transmission in allosteric regulation, as demonstrated also in other computational approaches.16,18 In this work, we apply Dijkstra’s algorithm19 to compute the matrix of shortest paths between residue pairs.
The functional properties of proteins rely on their modularity, implying that different modules (domains) inside the protein structure interact with each other and with the surrounding environment to allow protein physiological function. This interaction between regions of the protein structure is at the very basis of the allosteric mechanism, which in turn is responsible for the regulatory nature of protein activity.
The network formalism allows one also to identify functional modules inside the protein molecule, linked to the interaction pathways (link paths) throughout the molecule.
In this work, we apply network clustering based on the spectral decomposition of the Laplacian matrix, defined as
| 3 |
where D is the degree matrix, that is, a diagonal matrix whose generic non-null element Dii = ki. Applying the eigenvalue decomposition on the Laplacian L, the network clustering is a binary, hierarchical method based on the Fiedler vector v2, that is, the eigenvector corresponding to the second minor eigenvalue. The sign of its components assigns residues to two different clusters at each clustering iteration. The final result is a so-called “crispy” clustering partition, meaning a partition of nodes (residues) to different clusters. The number of clusters (power of 2) is assigned as the input of the algorithm.
We demonstrated that this method efficiently identifies functional modules in protein structure, when compared to geometrical methods of clustering like k-means.20
On the basis of the clustering partition (which assigns residues to different clusters, which putatively correspond to protein functional modules), it is possible to compute for each ith residue the participation coefficient, defined as21,22
| 4 |
where ksi is the node intracluster degree, that is, the number of contacts of the node (residue) with nodes belonging to the same cluster, whereas ki is the total node degree.
On the one side, P values range from 0 to 1; null values correspond to nodes very central in the clusters, not participating at all in the communication with other clusters; on the other side, high values of P (>0.75) identify nodes (residues) that spent most of their contacts with residues belonging to clusters other than their own.
We previously applied the method to identify functional regions related to ligand binding23 and to protein–protein interaction.24
We additionally performed an analysis of the interface between spike and ACE2, to quantify the effect of the hepcidin binding, starting from the PCN formalism.
We introduced the interchain degree as the number of contacts that each residue (possibly) shares with residues belonging to other chains. Once we define a given interface, we set two chains, and the corresponding interchain degree identifies the contacts between residues belonging to the two chains. In this work, we focus on the interface between the spike protomer and the ACE2 ectodomain (for instance, chain C of the trimeric spike and the chain D—ACE2 ectodomain—in the spike–ACE2 complex).
Nodes (residues) endowed with a high interchain degree are defined as PCN hotspots at the protein complex interface, and we hypothesized that they play a pivotal role in protein–protein interactions, therefore somehow corresponding to interface hotspots.25
To characterize the overall interface strength with respect to single chains, we computed the overall interchain degree, for example, the sum of interchain degree of residues belonging to a single chain, with reference to a given interface. The average value over the number of residues participating on the interface was defined as the average interchain degree. These two descriptors were used, for instance, in this case study, in the comparison of interfaces occurring in the analyzed complexes.
Interface Analysis
Thermodynamic Framework of Protein–Protein Interfaces Analysis
According to the theoretical framework for the PDBePisa server,26 the complex formation strictly depends on its interaction with the solvent environment.
Given an assembly A = A1, A2, ..., An made up of n subunits Ai, its stability is defined by the standard free energy of Gibbs of dissociation
| 5 |
where ΔGint is the binding energy of subunits Ai, and  is the entropy change upon dissociation.
  depends upon the ensemble of subunits (dissociation
pattern); generally, it is referred to the dissociation pattern that
corresponds to the minimum of
  . Unstable complexes show negative values
of
  .
.
The binding energy of subunits in solution is given by
| 6 |
where ΔGSOLV(A) is the change of free energy of solvation of the complex, ΔGSOLV(Ai) is the change of free energy of solvation for the single subunit Ai, and ΔGCONT(Ai, Aj) and ΔGES(Ai, Aj) are, respectively, the contact-dependent (main hydrogen bonds) and the electrostatic contribution of interaction between the subunits Ai and Aj.
It is possible also to define the solvation free energy gain upon formation of the interface between two subunits Ai and Aj ΔGSOLV(Ai, Aj) as the difference in total solvation energies of isolated and interfacing structures; negative ΔGSOLV(Ai, Aj) values correspond to hydrophobic interfaces, or positive protein affinity. The solvation energy for a macromolecular assembly A is computed considering the solvation occurs after a cavity C formation of volume V inside the solvent environment.
| 7 |
Here, V stands for bulk solvent, and all energies are computed as the difference between vacuum and solvent environments. ΔGCONT(A, V) and ΔGCONT(C, V) include contact-dependent between bulk solvent V, the macromolecular assembly A, and the cavity C.
The contact-dependent free energy change between two subunits is defined as
| 8 |
where  ,
,  , and
, and  are, respectively, the number of hydrogen
bonds, salt bridges, and disulfide bonds between the two subunits Ai and Aj.
The main contribution of the ΔGDISS(A) is the entropic term TΔSDISS(A), that is, the loss of entropy of the solvent upon complex formation, due to the loss of mobility of bound solvent molecules.
Topological Analysis of Interface
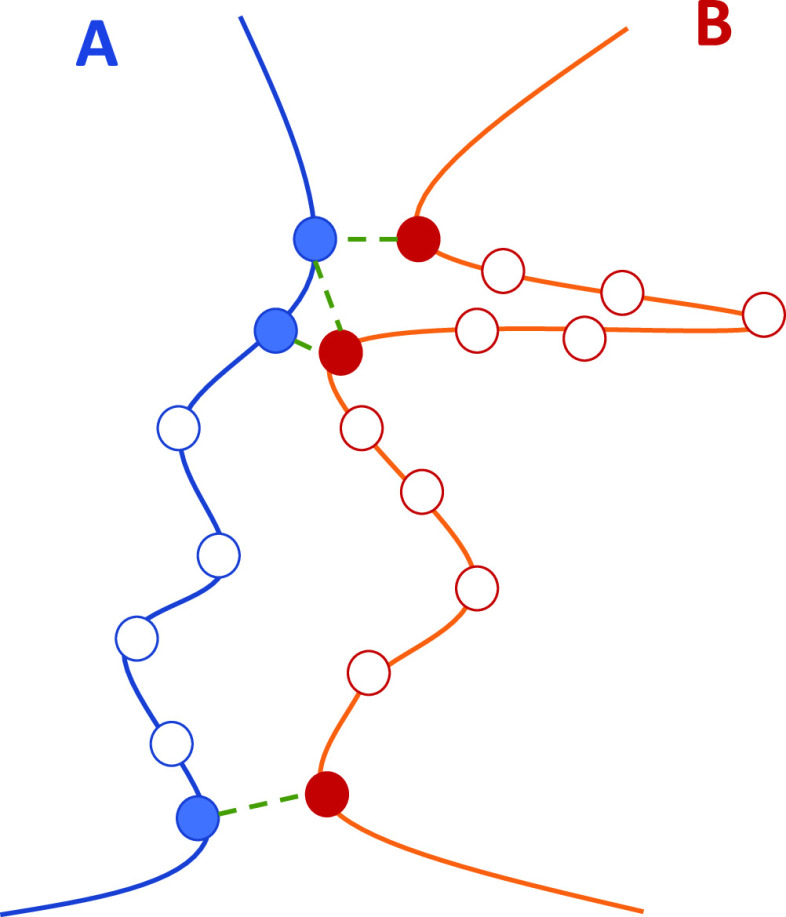
We adopted the geometrical descriptors of protein interfaces according to the method of Mei et al.24 (see Figure 2).
Figure 2.
Interface between two chains. In chain A, the length of the peptide segment participating in the interface accounts for seven residues (solid and empty blue bullets), and three of them are directly involved in four links (solid blue bullets). Analogously, chain B accounts for 12 residues in the interface, three of which are in direct contact with residues in chain A.
Specifically, given the interface between two chains in the complex, we defined the following.
-
1.
The total number of residues Q for each chain in the interface; this number is in general lower than the above-mentioned total interface degree, due to residues participating to the interface by multiple links.
-
2.
The length of the peptide segment involved in the interface R.
-
3.
The interface “roughness” Q/R.
-
4.
The interface amino acid range IAR = R/N, where N is the total number of residues in the chain.
Figure 2 depicts the interface between two chains: the length of the peptide segment in chain A is seven residues, three of which (solid blue bullets) are involved directly in links with residues of chain B (solid red bullets), and thus the interface roughness is 3/7 = 0.43; the overall degree of the interface in chain A is 4 (all green dashed lines from solid blue bullets). Conversely, chain B spends 12 residues in the interface (solid and empty red bullets), only three of which are directly involved in four links (Q/R = 3/12 = 0.25). We introduced energy descriptors including the topological description provided by the protein contact networks method. Starting from the consideration that the interaction energy is higher if the contact distance is smaller, we introduced a weight for each contact defined as
| 9 |
which is also the generic element of the interface energy matrix E, defined as
 |
10 |
For each interface, we sorted out the corresponding minor of the interface energy matrix E (corresponding as indices to the rectangular minors of the adjacency matrix), and we introduced the overall interface energy EINT as the sum of eij for each of the active links at the interface and the average value ⟨EINT⟩ over the whole number of residues at the interface. We also analyzed the single residue contribution to the interface energy, defining the value as follows.
| 11 |
We projected values of  onto the complex structure (represented
as ribbons and colored as heat map b-factor blue-red) using an in-house
Python script, according to the method described in Di Paola et al.27
Elastic Networks Models
The anisotropic network model (ANM) and the Gaussian network model (GNM) are two kinds of elastic network models (ENMs) for performing a normal-mode analysis on low-frequency modes of proteins and their complexes. In ANM28 each amino acid residue is represented by a node placed at its α-carbon coordinate. Residue pairs that fall within a cutoff distance rc of 15 Å are connected by harmonic springs of constant force γ. For a network composed of N nodes, the total potential energy is a summation over all springs in the system, and the (3N × 3N) Hessian matrix H is constructed based on the minimum energy structures that are the same as the crystal structures. Diagonalization of H yields (3N – 6) nonzero eigenvalues (λk) with corresponding eigenvectors (uk). Starting with the first nonzero eigenvalue, λk are sorted in ascending order and also the corresponding uk. The similarity between the ANM eigenvector sets described by two different states/conformations of a system can be calculated according to the following equation.29
| 12 |
Here, the inner product (uivj) quantifies the individual overlap between the ith and jth eigenvectors belonging to the different sets. The overlapk parameter quantifies the overall correspondence between the first k modes of the sets. In GNM, instead of H, the (N × N) Kirchhoff/connectivity matrix is constructed from the structural coordinates with a cutoff distance of 10 Å. eigenvalue decomposition yields (N – 1) nonzero modes for a folded structure. In our work, the GNM is used for evaluating the residue mean-square fluctuations of proteins. Both GNM and ANM analyses were performed by using the ProDy package.30
Anisotropic Network Model (ANM) Generated Structural Ensembles of the Complexes
To create coarse-grain ensembles of the structures for the protein complexes in the current study, we utilized the ANM approach,28,31 in which nonbonded interactions between residues are modeled by elastic springs. We consider first 20 motion levels of protein dynamics that require the lowest energy for deformation. The nonbonded interactions are modeled in this study as a six-step energy function where the spring stiffness is changed in discrete steps. To sample long-range interactions, we consider interaction distances between C-α atoms up to 50 Å. The generated models are extended to all atoms of the residues. The ANM-generated ensembles cover global motions of the complexes. We use Prody 1.10.11 to perform ANM computations.30
Perturbation Response Scanning Analysis
The Perturbation Response Scanning (PRS) approach is based on the linear response theory and allows one to evaluate residue displacements in response to external forces.32 The PRS technique was combined with protein dynamics based on cross-correlations calculated from ANM by constructing the Hessian matrix H.
The 3N-dimensional vector ΔR of node displacements in response to the application of a perturbation (a 3N-dimensional force vector F obeys Hooke’s law F = H × ΔR. The idea in PRS is to exert a force of a given magnitude on the network, one residue at a time, and observe the response of the overall network. The force exerted on residue i is expressed as
| 13 |
and the resulting response is
| 14 |
ΔR(i) is a 3N-dimensional vector that describes
the deformation of all the residues (in N blocks
of dimension 3, each) in response to F(i). A metric for the response of residue k is
the magnitude  of the kth block of ΔR(i) averaged over
multiple F(i) expressed as the ikth element of the N × N PRS matrix, SPRS. The elements of SPRS refer to unit (or uniform) perturbing force.
The response to unit deformation at each perturbation site is obtained
by dividing each row by its diagonal value.
 |
15 |
The average effect of the perturbed effector
site i on all other residues is computed by averaging over all sensors
(receivers) residues j and can be expressed as  . The effector profile
  describes the average effect that local
perturbation in the effector site i has on all other residues. The
maxima along the effector and sensor profiles would correspond to
functional mobile residues that undergo allosteric structural change.
SEPAS-Affinity Prediction Method
Using Modeler,33 we repaired some missed atoms in the spike–ACE2 complex. The repaired three-dimensional (3D) structures are used for performing blind flexible docking, adaptive tempering all atom MD simulations, and ANM. The repaired 3D structure of the complex (ABCD) is composed of SARS-CoV-2 trimeric spike protein (ABC) in association with ACE2 ectodomain (D). One of spike RBDs is in the up conformation. The PDB identification (ID) of the 3D structure of Hepcidin25 (H) is 1M4F.
Affinity Prediction by SEPAS
There are some firmed methods to predict the binding affinity between protein subunits: in conventional methods, a 3D structure of the protein complex is necessary to perform a prediction. To predict the effect of Hepcidin25 on the binding affinity of the SARS-CoV2 spike for ACE2, we used a recently introduced algorithm for the prediction of interaction affinities by using a single subunit.13,34,35 SEPAS supposes the stability of protein assemblies is encoded in the mechanical softness of binding patches.36 It is a monomer-based predictor of affinity between protein subunits. By providing a binding patch region on one partner of the desired protein complex, SEPAS performs an affinity prediction using the detected relation between the binding patch stiffness and the stability of the PPIs. The ensembles of the desired complexes generated by ANM or AT-MD simulations in the current work are the inputs of SEPAS.
Adaptive Tempering Molecular Dynamics (AT-MD) Simulations
The structures passed preparation steps before production runs. After minimization, the structures were heated gradually to 300 K using a conventional MD simulation protocol. The Generalized Born implicit solvent (GBIS) is selected to speed up the simulations.37 In GBIS computations we consider the hydrophobic effects by considering the changes in the accessible surface area (ASA) of the molecules implemented in NAMD 2.13.38 The utilized force fields in conventional MD and AT-MD simulations are CHARMM 22 and 27.39,40 To sample faster the conformation landscape of the complex, we run the AT-MD simulation for 2 × 10⁶ steps as one of the history-dependent versions of accelerated MD simulations for the temperature range of 300–320 K. In AT-MD, the potential energy of the system is averaged until the current step; if the current energy of the system is higher than the average energy then the Langevin thermostat adapts the system temperature by rising the current state temperature.41 Consequently, the system samples faster the conformational space by jumping local shallow energy wells. The structures of the systems are selected every 2 ps of AT-MD simulations for a downstream analysis. In conventional MD, AT-MD, and targeted molecular dynamics (TMD) simulations, we set the time step to 2 fs and do Langevin dynamics to a constant temperature where Langevin damping is set to 1. In regular MD the Langevin temperature is set to 300 K. In AT-MD we let the system temperature fluctuate between 300 and 320 K. We utilized GBIS as an implicit water model, so no pressure control was needed. The utilized force fields in conventional MD and AT-MD simulations are CHARMM 22 and 27, respectively.
Affinity Prediction Using the MM-GBSA Approach
We used a single trajectory-based molecular mechanics with generalised Born and surface area solvation (MM-GBSA) to predict the binding affinity.42,43 In this method, we use ensembles of ACE2 (D), trimeric spike (ABC), the ABCD complex, trimeric spike with Hepcidin25 in AMR (ABCH), and the ABCDH complex for performing the MM-GBSA affinity predictions. Every noted ensemble is created by sets of 2 × 10⁶ steps of all-atom AT-MD simulations in GBIS implicit solvent using NAMD 2.13. In GBIS-based simulations, we consider the hydrophobic effect by considering changes in the ASA of residues along simulations. The binding free energy, ΔG (association D), of ACE2 (D) to the trimeric spike while Hepcidin25 is bonded to AMR is computed considering following equation.
| 16 |
Flexible and Blind Protein–Protein Docking
To predict the most probable binding sites of Hepcidin25 on a monomeric spike or trimeric spike protein of SARS-CoV2 with or without ACE2, we utilize SWARM docking.44,45 By considering the normal modes of ligand and receptor subunits of the desired complex, the flexibility of subunits at the levels of thermal motion energy is implemented in SWARM docking. The best top 10 solutions of standard or democratic clusters are considered.
Targeted Molecular Dynamics (TMD) Generated Structures for the Transition of Spike from Closed to Open States
There are crystallized trimeric spike structures in both “closed” and “open” conformations. To study the properties of the spike along the transition pathway, we utilized the TMD approach.38 General simulation conditions are described in the AT-MD section. In TMD, a 3D structure is guided toward a final “target” state using steering forces. In brief, the root-mean-square (RMS) distance between the current coordinates and the target structure defines the external force. The force on a system is defined by the gradient of the potential defined as follows.
| 17 |
The spring constant scaled by atoms of the TMD group and is presented as Z in the equation. RMS stands for the instantaneous deviation of the structure from the target final state, and RMS′ evolves linearly from the starting structure to the target structure over the simulation time. The starting structure of the spike in the closed state is derived from the structure with PDB ID 6vxx after minimization is performed and AT-MD production steps are performed in the GBIS condition. The target structure is the spike with one chain in the open state that is derived from the structure with PDB ID 6vsb after minimization and AT-MD production steps are performed in the GBIS environment. To sample the spike structures from closed to open states we perform duplicated 3 × 10⁶ steps of TMD simulations.
Energy Transport Networks
To further support the identification of the AMR, we analyze the transport of energy across the spike–ACE2 complex. The eigenmodes of the ANM of the spike–ACE2 complex can be analyzed to locate energy-transport networks in the complex. We briefly summarize here how the normal modes of the complex, obtained for the ANM, can be used to identify pathways along which energy transport takes place. These pathways may include a combination of energy transfer along the main chain of the spike protein or ACE2 and energy transfer across noncovalent contacts. Details of the method are provided elsewhere.46–48 The nodes of the network are the residues of the spike protein and ACE2 that form the complex. The weights are expressed in terms of the matrix elements of the energy current operator S, which in harmonic approximation can be written in terms of the Hessian matrix H and eigenmodes e of the complex, which we model with the ANM. The matrix elements of S are used to calculate the mode diffusivity for energy transfer between a pair of residues, namely, A and A′. The energy diffusion coefficient DAA′ is computed in terms of the mode diffusivities. Specifically, we computed the first 1000 modes of the ANM for the spike–ACE2 complex, and we used modes 900–1000 to compute DAA′, which we take as the sum of all for those modes. The modes need to be of sufficiently short wavelength so that the energy transfer between residues can be described via a Markov model approach. The lowest-frequency modes are of too long wavelength to satisfy this model. Modes in the 900–1000 range, also other modes lower than these, yield results that, upon analysis of the network, do not vary with the selected modes. The time constant τAA′ between A and A′ per degree of freedom is calculated as
| 18 |
where dAA′ is the Euclidean distance between A and A′, which is taken as the center of mass distance.
Local energy diffusion occurs along a path between these two center-of-mass of regions A and A′, essentially along a one-dimensional path; thus, we include the factor of 2. We found that an analysis of the network of residues weighted by the time constants for energy transfer between residue pairs yields useful insights into residues and regions of a protein that mediate allosteric control.49−51 We identify the shortest paths in time between a residue pair of the complex. Residues that lie along the shortest paths have been identified as contributing to allosteric regulation, as these residues control information flow in the complex.51−53 Since our network is comprised of time constants for energy transfer between residues, we determine residues that lie along the shortest paths in time. This is quantified by the quantity C for node (or residue) v as
| 19 |
where N is the number of nodes in the network, and σst(v) takes the value of 1 when the shortest path in time that links nodes s and t passes through node v and is otherwise 0. We report the residues with the largest values of C and compare with the previously identified AMR.
Overview of Computational Workflow
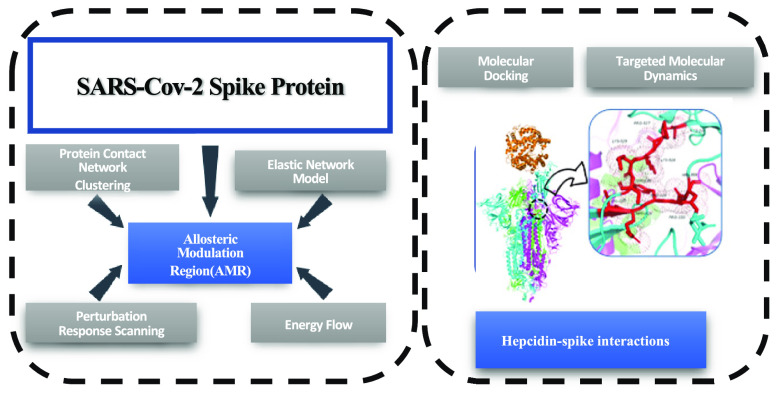
Figure 3 reports the scheme of the general overflow of the multifaceted computational approach.
Figure 3.
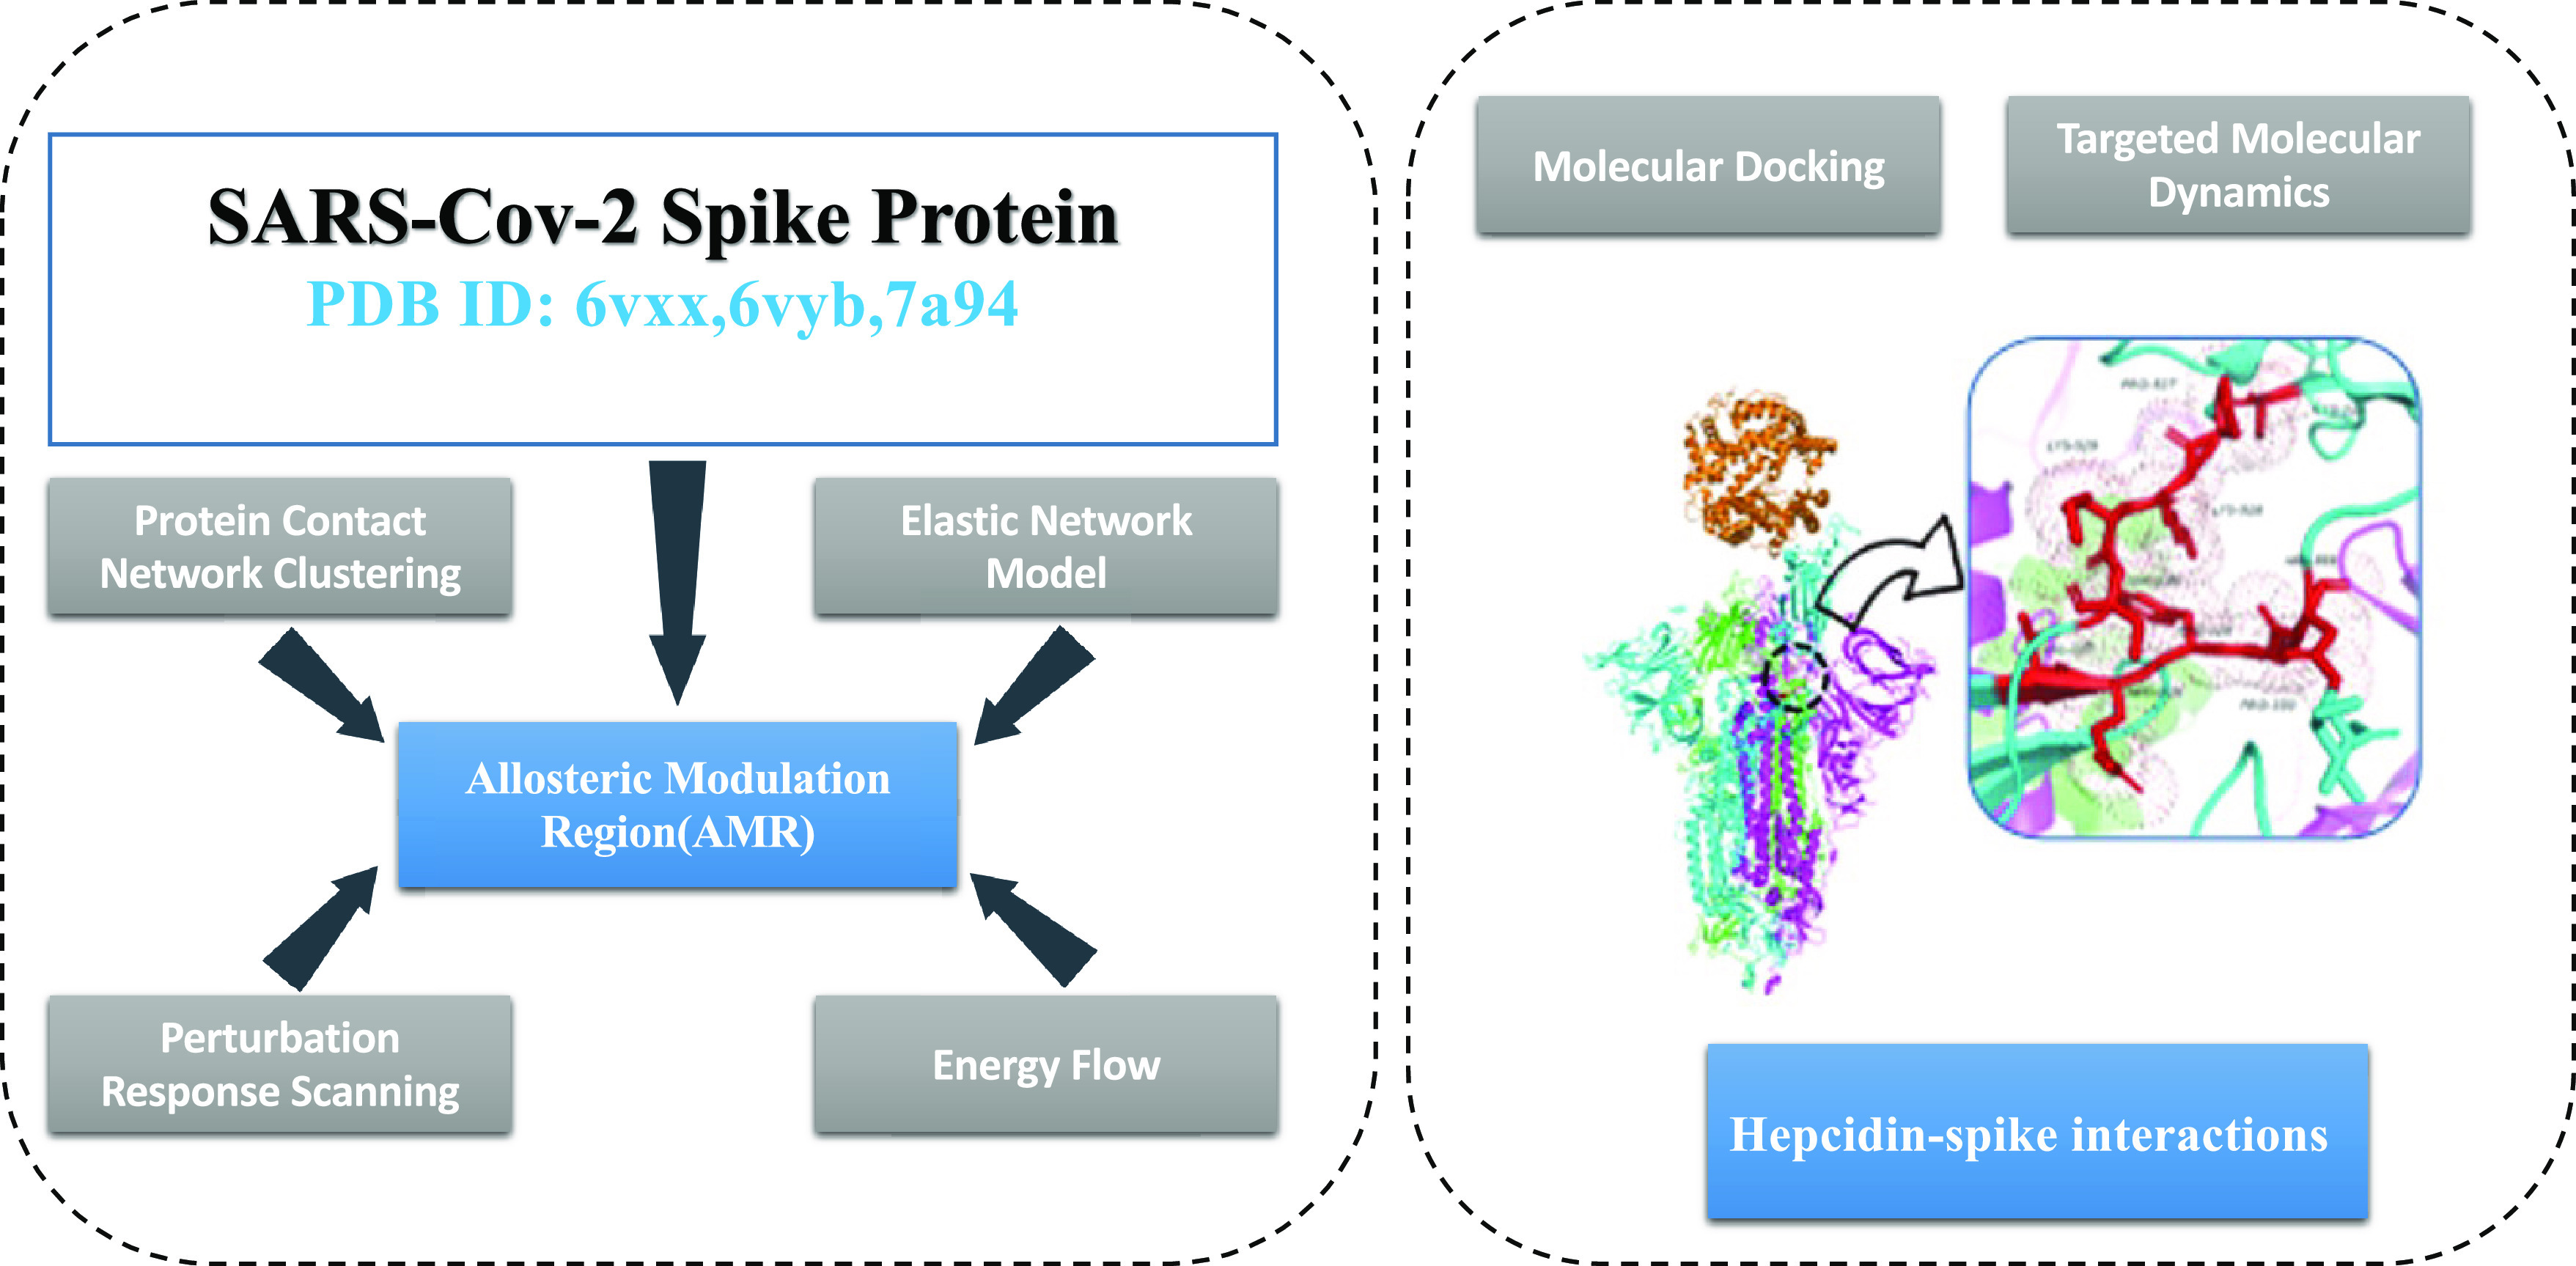
General workflow of the multifaceted computational approach to the analysis of the allosteric behavior of the spike–ACE2 complex in the perspective of inhibition by hepcidin.
Results and Discussion
In our previous work we reported for the first time the presence of an Allosteric Modulation Region in the SARS-COV2 spike protein. The introduced region was mapped on the spike in its open state while it was associated with ACE2. In the current study we seek to find the AMR in different conformational states of spike protein. Allosteric drugs modulate the function of the desired proteins over the distance between the drug-binding site region and the protein’s functional site. In the case of SARS-COV2 spike protein, finding allosteric effectors that modulate the binding and dynamic properties of the spike is of interest. We suggest AMR as a possible binding site for allosteric drugs. To this end, we perform multidimensional computations to study the effect hepcidin–AMR interactions and the consequence of the interactions on spike dynamics and its affinity for ACE2.
The performed simulations in the current work are presented in Figure S1. As presented in the Methods section, the trimeric spike bonded to ACE2 (ABCD) and the trimeric spike bonded to ACE2 and hepcidin (ABCDH) are passed relaxation steps by performing AT-MD simulations. To define the optimized structure of the complexes, we measure changes in the root-mean-square deviation (RMSD) and ASA for the systems (Figure S2). These optimized complexes are used in ANM, TMD, and MM-GBIS computations.
Network Clustering of Spike in Open and Closed States
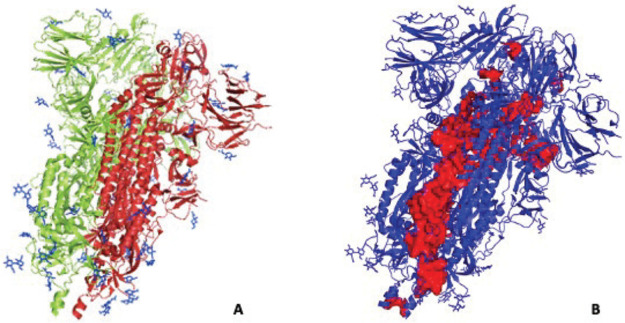
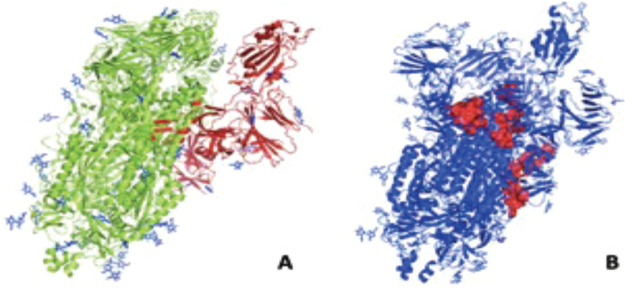
We report results for the application of the network clustering methodology to the identification of functionally active regions in the free forms of the SARS-CoV2 spike protein (open/closed conformation). In a previous work, we identified with the same methodology a putative allosteric site in the spike proteins of SARS-CoV and SARS-CoV2 with regard to their binding with ACE2.13Figure 4 reports the results of network clustering (two clusters solution) on the closed conformation of the SARS-CoV2 spike protein: in the closed conformation, the two clusters represent two blocks whose probable role is to contribute to the stability of the trimeric structure of the spike. The corresponding active regions (in red in Figure 4B) lie in the inner core of the trimeric structure. Similarly, Figure 5 reports the network clustering results (two clusters) for the open conformation of the SARS-CoV2 spike protein: the clustering partition and the corresponding active region (nonnull P values) are completely different from those of the closed conformation. The region opening to become prone to the binding of the spike protein of the virus with human receptor ACE2 is a cluster in its own; the rest of the protein structure is the second cluster. The active region is located in the hinge of the opening part of the protein structure. Thus, in the open conformation, the active region residues contribute to the protein activity rather than to its stability. The dramatic change in the structural-functional role of the same residues going from closed to open conformation is a signature of the relevant allosteric properties of the protein.54
Figure 4.
Network clustering of closed conformation of the SARS-CoV2 spike protein: (A) the two clusters in the closed conformation are reported in green and red; (B) the active region (P > 0) in the two clusters partition.
Figure 5.
Network clustering of open (1-up) conformation of the SARS-CoV2 spike protein: (A) the two clusters in the closed conformation are reported in green and red; (B) the active region (P > 0) in the two clusters partition.
Comparison of Conformational Dynamics of S Proteins in Three States
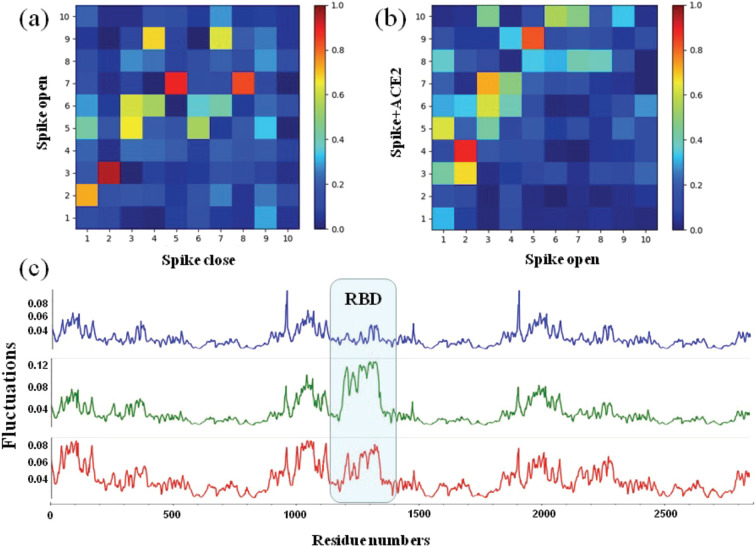
Collective motions are essential for protein functions including allosteric interactions. Herein, the ANM method was used to compare and analyze the collective motions of the SARS-CoV2 spike proteins in closed, open, and ACE2 bound states. The overlap maps of the 10 softest modes of S proteins between closed and open states as well as open and bound states are shown in Figure 6A,B. During these two conformational changes, most of the global modes were not conserved, along with a weaker correlation (<|0.6|) and reordering of modes. Two notable matching modes were found: mode 2 in the closed state corresponds to mode 3 in the open state, with an overlap of 0.86. Examination of the individual modes showed that the S protein induced high fluctuations at two receptor-binding domains still at the “down” position. In addition, mode 2 in the open state corresponds to mode 4 in the bound state, showing the “up” and bounded RBD motions. This clearly suggests that the dynamics of the S protein is largely affected by both the opening of the RBD and the binding of the ACE2 protein, underlying the RBD-dependent dynamics. We further calculated and compared the square fluctuations for S proteins among three different states, based on the first 20 ANM modes, to show how the dynamics difference happened. As a result, the dynamics difference of closed, open, and bound S proteins can be captured mostly at the RBD region (Figure 6C). It can be seen that, going from the closed to the open state, the fluctuation of up RBD becomes much higher compared with down RBD, while the other regions maintain similar fluctuations. The high plasticity of up RBD in open state can promote its binding with the host receptor ACE2. From the open state to the ACE2-bound state, the fluctuation of the up RBD becomes smaller clearly, as the binding process will make the RBD, especially the binding interface, more stable as expected. Besides, the binding of ACE2 not only leads to decreased flexibility in the RBD but also to increased flexibility of all other regions at the distal sites from the binding interface. This may suggest that the ACE2 binding can also affect residues in distal sites by modulating long-range allosteric communications caused by the conformational change of binding interface (RBD). In summary, S protein undergoes a spectrum of conformational changes going from the more stable down to the more flexible up conformational switch that can promote binding with the host receptor ACE2 and the small stability in a bound complex state. The conformational study of S trimers shows that the dynamical coupling range varies widely among different conformations, while these different binding conformations may lead to long-range allosteric communications.
Figure 6.
Intrinsic dynamics of S proteins in closed, open, and bound states. (A) Overlap of 10 ANM modes between the closed and open states. (B) Overlap of 10 ANM modes between the open and bound states. (C) The square fluctuations of S proteins in three states based on the first ANM modes. The bounded RBD is most stable in the closed state (blue) but has the largest flexibility in the open state (green). The bounded RBD in the complex state has the lowest stability (red).
The S-ACE2 Complex Shows the Highest Allosteric Potential
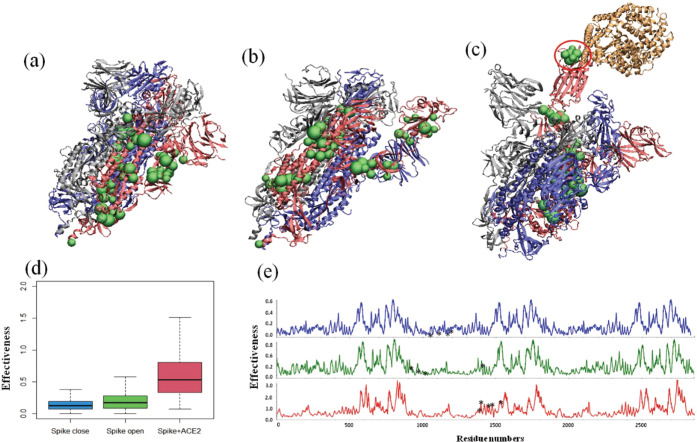
In ENM global motions, the residues with lower fluctuations form the hinge sites critical for the protein functions and allosteric regulations. Herein, the local minima of mean-square fluctuations based on the three GNM slowest modes are predicted as hinge sites, which are listed in Table 1. In all states, the distribution of hinge sites is relatively uniform along a sequence. Especially for the closed state, hinge sites distributed on each chain with a quite large degree of symmetry. Here, we focus on the hinge sites of S monomers that share the conformational change among three states. As shown in Figure 6A, the predicted hinge sites of the closed state are mainly located at nonfunctional domains but occupy some topologically important regions including protein–protein interactions between each S monomer and interfacial residues between S1 and S2 domains. Most of these hinges in the closed state are maintained, but hinge sites in the N-terminal domain (NTD) shift to RBD in the open state (Figure 6b).
Table 1. Hinge Sites in the SARS-CoV2 Spike–ACE2 Complex.
| chain | A | B | C | D |
|---|---|---|---|---|
| hinge sites | 317N, 326I, 474Q, 475A, 477S, 479P, 485G, 487N, 488C, 533L, 543F, 545G, 578D, 582L, 595 V, 612Y, 620 V, 621P, 623A, 643F, 650L, 654Z, 664I, 673S, 693I, 730S, 735S, 742I, 743C, 746D, 761T, 780Z, 783A, 854 K, 856N, 858L, 860 V, 873Y, 949L, 986P, 991 V, 1005Q, 1058H | 14Q, 33T, 37Y, 55F, 56L, 59F, 221S, 272P, 295P, 309Z, 322P, 590C, 698S, 752L, 753L, 758S, 971G, 983R, 990Z, 1146D | 320 V, 369Y, 371S, 472I, 489Y, 591S, 658N, 662C, 667G, 671C, 695Y, 703N, 730S, 776 K, 826 V, 866T, 948L, 966L, 996L, 1013I, 1015A, 1146D | 19S, 31K |
Such a hinge shift of RBD reveals implications for the further binding process. After the binding of the ACE2 receptor, a similar trend was found with most of these hinges in the open state being maintained. The most important finding is that there are several hinge sites present at the AMR in the bound complex, including Asp578, Leu582, Ile742, and Asn856 (the red circle in Figure 7c), all with P > 0.8. On the basis of these findings, we proposed that the conserved hinge sites in both closed and open states may alter the transitions of up and down forms, and the hinge sites located the AMR in the complex state may allosterically impact RBD-ACE2 binding.
Figure 7.
Allosteric properties of S proteins in closed, open, and bound states. (a–c) Distributions of the hinge sites (green beads) based on the first three GNM modes. (d) Comparison of effectiveness for three S proteins. (e) Effectiveness profiles for three S proteins, while their predicted AMR are labeled with black stars.
On the basis of an ANM calculation, the perturbation-response scanning (PRS) approach was employed to quantify the allosteric effect of each residue in the prtein structures on all other residues in response to an external perturbation. In our previous study,13 we showed that effectiveness is a good indicator to describe the allosteric properties of AMR and identified the key residues for which perturbation provokes structural dynamical changes at a long distance. Here, we also adapted effectiveness based on a PRS calculation to describe the allosteric potential of S proteins in closed, open, and bound states.
As shown in Figure 7D, the box plot shows that S proteins in closed and open states show similar effectiveness values, but the S protein in the bound state had a statistically higher effectiveness than the other two states (under p < 2.2 × 10⁻⁶ by Wilcoxon signed-ranked test), which shows that the S protein in the bound or “complex” state has higher allosteric potential. The allosteric profiles based on PRS would give provide more insight into the signaling ability of each residue (Figure 7E).
As we can see, S proteins with closed and open states display very similar profiles with relatively low effectiveness values, while the predicted AMRs (black stars) in both states show some valleys with very small signaling ability. But in the bound state, the S protein presents a more marked allosteric profile, while some peaks are mainly located at some functional domains, including cleavages and heptad repeats of three S monomers. In particular, additional peaks were found at the predicted AMR in the S-ACE2 complex. Our previous results suggest that the SARS-CoV2 AMR has stronger allosteric character than the AMR in SARS-CoV, and our current findings suggest this region in the S-ACE2 complex still has higher allosteric potential than two unbound states.
In the S-ACE2 complex, the AMR corresponds to hinge sites and has higher allosteric potential, thus the modulation of conformational dynamics of a binding interface by an allosteric ligand interaction at the AMR. Since the hinge sites and the AMR in the S-ACE2 complex also provide some potential drug binding sites, we recommend ongoing efforts to dock hepcidin peptide at the AMR in the “complex-like” state, not the “apo-like” state, to inhibit the binding interface.
Energy Flow in Spike–Protein Complexes
We compare the AMR identified by an analysis of contact networks for the spike–ACE2 complex with results of an analysis of energy-transport networks computed for the same complex. We specifically determine residues that mediate energy transport in the complex. As discussed above, this is quantified by C for node (or residue) v (see eq 19).
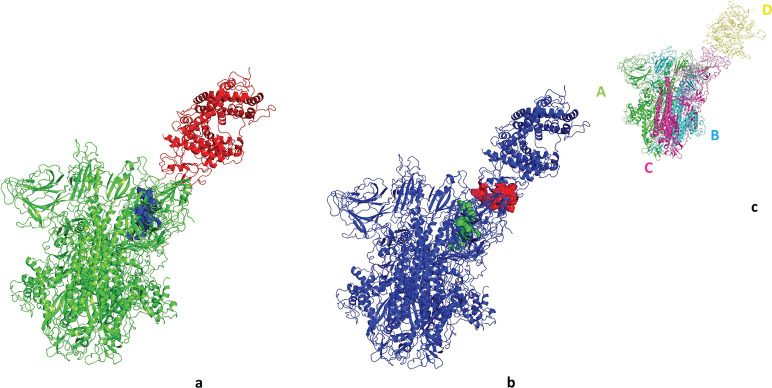
We computed C for all residues of the complex and plotted those residues with the largest values in Figure 8. Five residues of the spike–ACE2 complex stand out with values of C that are at least 70% larger than any other values computed. Those residues, which all have values of C between 0.175 and 0.195, are identified in red in Figure 6. The relatively large values of C for these residues indicate they lie along a much larger number of shortest energy-transport paths between any two residues of the complex than do other residues. Also plotted in Figure 6 are the residues identified as having the largest values of the participation coefficients (4). All of these residues, those found from the energy-transport network analysis and those identified with the largest participation coefficients, lie in the same region of the complex, identified in earlier work as an Allosteric Modulation Region.13 We have seen in earlier work on allosteric proteins that residues that control energy flow through the network play a central role in allosteric regulation;23,55 a mutation of such sites can alter the allosteric control.49,50,52
Figure 8.
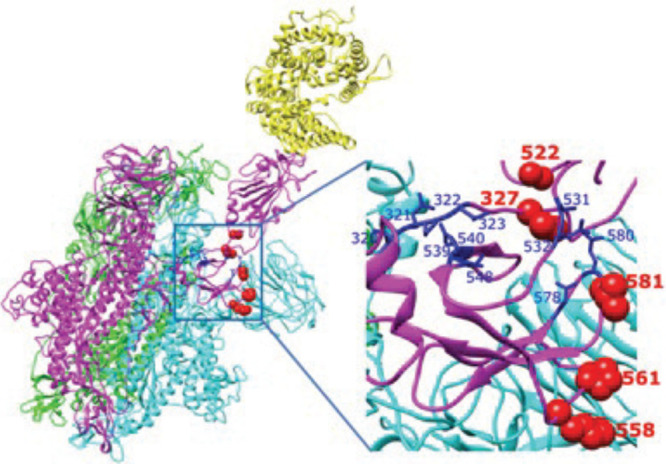
Spike–ACE2 complex, with chain A, B, and C shown in green, cyan and magenta, respectively, and the ACE2 ectodomain in yellow. The five residues identified as having the largest influence on energy transport in the complex are indicated in red. They all lie in the AMR, previously identified as containing the residues with the largest participation number in the complex, labeled in dark blue.
Hepcidin-Binding Changes the Network Clustering in Spike
In the following, we report the results of network clustering on the spike–ACE2 complex, with and without hepcidin for the sake of comparison. Figure 9 reports the network clustering for the equilibrated form of the spike–ACE2 complex.
Figure 9.
Network clustering of the equilibrated form of the spike–ACE2 complex. (a) Cluster partition; (b) participation coefficient P map; (c) complex chains.
The cluster partition is very similar to that found by Di Paola et al.;13 the detailed list of AMR residues (P > 0) is provided in Table 2: they are all in chain C carrying the RBD in direct contact with ACE2. Only ARG328 is endowed with relevant intermodule communication competencies (P ≥ 0.75), reported in italic font type in Table 2.
Table 2. Allosteric Modulation Region (AMR) in the Equilibrated Spike–ACE2 Complexa.
| name | position | P |
|---|---|---|
| VAL | 327 | 0.44 |
| ARG | 328 | 0.89 |
| PHE | 329 | 0.19 |
| PRO | 330 | 0.17 |
| ASN | 331 | 0.56 |
| CYS | 525 | 0.13 |
| PRO | 527 | 0.51 |
| LYS | 528 | 0.31 |
| LYS | 529 | 0.36 |
| SER | 530 | 0.44 |
All residues are located in the C chain. In italic the most competent residue (Arg 328) in intermodule communication (P ≥ 0.75).
Similarly, Table 3 reports the identity, position, and participation coefficient P of residues in the AMR for the equilibrated conformation of the complex spike + ACE2 + hepcidin. After performing blind and flexible docking between HPC and ACE2-bonded spike chain C, we find that HPC binds preferentially to AMR.
Table 3. Allosteric Modulation Region in the Equilibrated Spike–ACE2 + Hepcidin Complexa.
| name | position | P |
|---|---|---|
| PHE | 342 | 0.61 |
| ASN | 343 | 0.36 |
| ALA | 344 | 0.36 |
| THR | 345 | 0.56 |
| ARG | 346 | 0.31 |
| TRP | 353 | 0.61 |
| ASN | 354 | 0.84 |
| ARG | 355 | 0.31 |
| LYS | 356 | 0.27 |
| PHE | 374 | 0.40 |
| SER | 375 | 0.56 |
| THR | 376 | 0.56 |
| ASP | 398 | 0.51 |
| SER | 399 | 0.66 |
| PHE | 400 | 0.33 |
| VAL | 401 | 0.19 |
| VAL | 407 | 0.23 |
| PRO | 412 | 0.56 |
| LYS | 424 | 0.19 |
| LEU | 425 | 0.56 |
| PRO | 426 | 0.64 |
| ASP | 427 | 0.75 |
| THR | 430 | 0.19 |
| VAL | 433 | 0.19 |
| ILE | 434 | 0.36 |
| ALA | 435 | 0.64 |
| TRP | 436 | 0.80 |
| ASN | 437 | 0.75 |
| TYR | 508 | 0.1736 |
| ARG | 509 | 0.5950 |
| VAL | 510 | 0.79 |
| VAL | 511 | 0.3306 |
| VAL | 512 | 0.1900 |
All residues are located in the C chain. In italic font type the most competent residues in intermodule communication (P ≥ 0.75) are given.
The presence of hepcidin strongly changes the allosteric modulation scenario: in this complex, we found 33 residues (more than 3 times the number in the complex without hepcidin) all in the C chain, with five residues with P ≥ 0.75 (15%). The average value of P in the complex without hepcidin is ∼0.001; in the presence of hepcidin it rises to 0.0035. Thus, the hepcidin binding entails an enhanced allosteric character of the complex spike–ACE2.
Noticeably, again no active residue is within the RBD or in the RBM, addressing a purely allosteric nature of the communication between complex domains.
Hepcidin Binding Changes the Properties of Spike–ACE2 over Distance
Table 4 reports thermodynamic results of the application of the Proteins, Interfaces, Structures, and Assemblies (PISA) to the complex spike + ACE2 (with and without hepcidin), compared to free forms of the spike protein (open and closed). The stability of the closed form subunits is uniform, but the symmetry is broken upon activity (open conformation), since all subunits become less stable, with a quite high change in the C subunit, shifted to the open RBD conformation. The effect is mirrored as well in the interface interactions between subunits, which in general decrease upon activation, with a special regard to the B–C interface. In the complexes of the spike with ACE2, the stability of the subunits is strongly increased but not the interface binding between spike protomers (similar to values of the open form). The binding contribution to the general stability, however, strongly increases, passing from a fairly positive (unstable conformation) to a strongly negative (stable conformation) value. That means the ACE2 binding provides a large contribution to stabilize the complex molecular structure. In the presence of hepcidin, the ACE2–spike binding becomes a little bit more stable, whereas the whole complex (spike + ACE2 + hepcidin) gains more stability with respect to the spike + ACE2 complex (−130.7 kcal/mol in the spike + ACE2 vs −183.4 kcal/mol in the spike–ACE2 + hepcidin).
Table 4. Thermodynamic Parameters of Protein–Protein Interface (from PISA)56.
| chains | ΔGSOLV(Ai) kcal/mol | pairs | ΔGSOLV(AiAj) kcal/mol | ΔGint kcal/mol | ΔGDISS kcal/mol | TΔSDISS kcal/mol | |
|---|---|---|---|---|---|---|---|
| S+A | A | –1080.1 | A-B | –43.3 | –130.7 | –9.7 | 16.0 |
| B | –1073.3 | B-C | –39.6 | ||||
| C | –1050.0 | A-C | –42.8 | ||||
| D | –453.3 | C-D | –5.0 | ||||
| S+A+H | A | –1014.7 | A-B | –46.8 | –183.4 | –5.6 | 15.9 |
| B | –1002.4 | B-C | –46.8 | ||||
| C | –1011.9 | A-C | –43.2 | ||||
| D | –524.7 | C-D | –7.4 | ||||
| S closed | A | –919.1 | A-B | –52.9 | 34.5 | 170.9 | 37.2 |
| B | –919.5 | B-C | –52.8 | ||||
| C | –919.5 | A-C | –52.8 | ||||
| S open | A | –888.3 | A-B | –49.6 | 28.5 | 163.8 | 37.2 |
| B | –864.2 | B-C | –45.9 | ||||
| C | –736.9 | A-C | –50.8 |
Tables 5 and 6 report in detail the results for the interface analysis adopting the PCN approach. Results confirm that hepcidin contributes to stabilize the spike–ACE2 binding, mainly in terms of an increased number of contacts.
Table 5. Interface Analysis through PCNs: The Complex Spike–ACE2 (without Hepcidin).
| (Q/R)Ai | ⟨kAiAjEM⟩ | |||||||||||||
|---|---|---|---|---|---|---|---|---|---|---|---|---|---|---|
| A-B | ||||||||||||||
| Ai | 91 | 0.092 | 0.781 | 70.06 | 248 | 1.34 | 37.56 | 0.15 | ||||||
| Aj | 94 | 0.115 | 0.643 | |||||||||||
| B-C | ||||||||||||||
| Ai | 88 | 0.089 | 0.779 | 72.30 | 284 | 1.58 | 44.29 | 0.16 | ||||||
| Aj | 92 | 0.112 | 0.643 | |||||||||||
| A-C | ||||||||||||||
| Ai | 91 | 0.109 | 0.654 | 68.01 | 251 | 1.30 | 36.55 | 0.15 | ||||||
| Aj | 95 | 0.096 | 0.781 | |||||||||||
| C-D | ||||||||||||||
| Ai | 11 | 0.367 | 0.024 | 9.38 | 25 | 1.04 | 3.62 | 0.14 | ||||||
| Aj | 13 | 0.039 | 0.563 | |||||||||||
Table 6. Interface Analysis through PCNs: The Complex Spike–ACE2 (with Hepcidin).
| QAi | (Q/R)Ai | ⟨kAiAjEM⟩ | |||||||||||
|---|---|---|---|---|---|---|---|---|---|---|---|---|---|
| A-B | |||||||||||||
| Ai | 109 | 0.101 | 0.852 | 90.80 | 294 | 1.27 | 44.69 | 0.15 | |||||
| Aj | 122 | 0.146 | 0.655 | ||||||||||
| B-C | |||||||||||||
| Ai | 86 | 0.080 | 0.846 | 64.20 | 211 | 1.25 | 31.45 | 0.15 | |||||
| Aj | 83 | 0.102 | 0.643 | ||||||||||
| A-C | |||||||||||||
| Ai | 146 | 0.134 | 0.853 | 107.01 | 338 | 1.23 | 50.55 | 0.15 | |||||
| Aj | 129 | 0.120 | 0.848 | ||||||||||
| C-D | |||||||||||||
| Ai | 12 | 0.245 | 0.039 | 10.50 | 34 | 1.26 | 5.34 | 0.16 | |||||
| Aj | 15 | 0.045 | 0.560 | ||||||||||
SEPAS-Affinity Results
We are interested to find the possible binding sites of hepcidin25 on the spike of SARS-CoV2. As proteins have their own intrinsic motions, we need an efficient algorithm that considers protein motion in docking. SWARM docking performs flexible docking by including normal mode dynamics of receptor and ligand molecules. The blind docking option enables us to seek the spike protein for possible binding sites of hepcidin25 without prejudice. When we introduce trimeric spike protein (ABC) as receptor and hepcidin25 (H) as ligand molecule to SWARM, it returns us the best 10 complexes (Figure 10). In two structures of the top 10, hepcidin25 binds around/to AMR of the upward subunit of the trimeric spike with binding energy of −22 and −24 kcal/mol (Table 7).
Figure 10.
Result of SWARM docking is presented. Trimeric spike protein acts as a receptor protein and hepcidin25 acts as a ligand molecule. Chain C of the spike trimer is presented as blue wire, and other chains of the spike are presented as gray dots.
Table 7. Top 10 Solutions of SWARM Docking Are Presented for Trimeric and Monomeric Spike Protein as Receptor of Hepcidin25a.
| # solution | energy, kcal/mol | position |
|---|---|---|
| trimeric spike (chain ABC) | ||
| 1 | –31.7 | |
| 2 | –29.44 | |
| 3 | –28.92 | RBM |
| 4 | –27.3 | |
| 5 | –24.13 | |
| 6 | –23.95 | near AMR[27.86] |
| 7 | –22.84 | |
| 8 | –21.94 | near AMR [24.70] |
| 9 | –21.89 | |
| 10 | –21.85 | |
| monomeric spike (chain C) | ||
| 1 | 15.63 | |
| 2 | –13.1 | |
| 3 | –26.14 | AMR [19.98] |
| 4 | –10.39 | |
| 5 | 21.68 | |
| 6 | 3.5 | |
| 7 | 4.78 | |
| 8 | –10.76 | |
| 9 | 0.59 | |
| 10 | –18.83 | RBM |
The stalk region is laid on the body of spike in this section. The distance between Hepcidin25 and AMR is presented in brackets.
SWARM-docking results indicate that hepcidin25 also binds to the ACE2 binding site of spike protein (Table 7). To test how much the AMR accessibility affects hepcidin25 binding to AMR, we test the flexible docking between the first 700 residues of spike protein chain C and hepcidin25: results indicate that hepcidin25 binds with higher energy to the monomer form of spike. It also declares that the flexible structure of hepcidin25 and spike trimer are crucial for finding the binding sites of hepcidin25 on spike. The results of SWARM docking indicate that hepcidin25 also has a high affinity for the ACE2 binding-site region of monomeric or trimeric spike protein, suggesting that hepcidin25 may be a competitive inhibitor of ACE2 for binding to the SARS-CoV2 spike protein. The SWARM-docking results provide us a possible 3D structure of the complex between hepcidin25 and the AMR of spike protein. Our previous observations suggested that changes in the AMR structure affect the affinity of spike for ACE2 protein. These results encourage us to study the effect of hepcidin25 binding to AMR on the affinity of spike for ACE2.
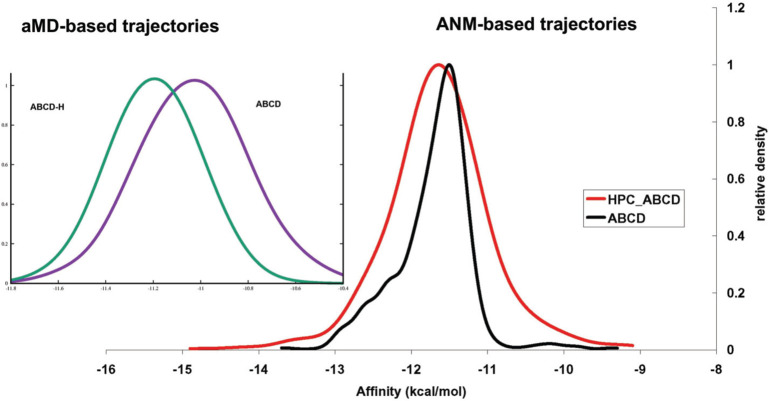
We predict the affinity of trimeric spike for ACE2 when hepcidin25 is bonded to the AMR of spike. SEPAS allows us to predict the affinity of spike for ACE2 considering changes in the mechanical softness of the spike binding site for ACE2. To perform affinity predictions, we consider the ensembles generated for trimeric spike in association to ACE2 in the presence (ABCD-H) or in absence (ABCD) of hepcidin25 in AMR by ANM as a coarse-grain approach or by utilizing the structural ensembles generated by all-atom AT-MD simulations.
The presented results in Figure 11 suggest that the binding of hepcidin25 to the AMR of spike possibly increases the binding affinity of spike for ACE2 to some extent. Also we predict the binding affinities using the MM-GBSA approach as another established method. We predict the binding energy of ACE2 (D) to the trimeric spike (ABC) of SARS-CoV2 in two different cases; when hepcidin25 binds to AMR (ABCDH) or in the absence of hepcidin25 (ABCD).
Figure 11.
SEPAS-predicted affinity of trimeric spike protein for ACE2 in the presence of hepcidin25 in the AMR (ABCD-H) or its absence (ABCD).
The binding energy of ACE2 to trimeric spike is −52 kcal/mol (standard error of mean (SEM) = 0.24) when hepcidin25 bonded to AMR in comparison to its absence in AMR when the binding affinity of ACE2 for spike is −47 kcal/mol (SEM = 0.23). The predicted change in the affinity of ACE2 to trimeric spike upon binding of hepcidin25 to AMR suggests that the binding of hepcidin25 to AMR significantly (p < 0.05) increased the affinity of ACE2 to spike. The density plot of the MM-GBSA-based affinity is presented in Figure S3.
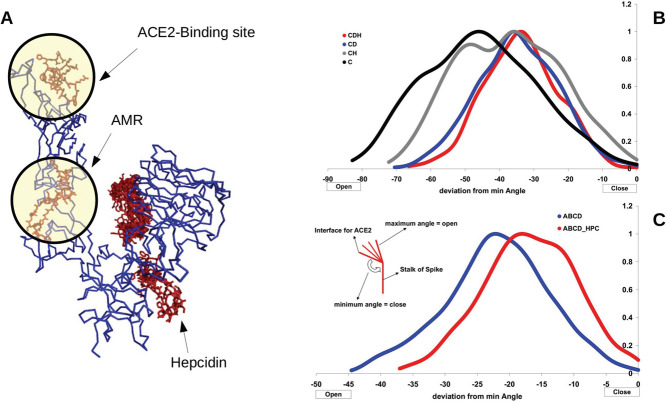
To study the possible effects of hepcidin25 binding to AMR on the dynamics of spike protein, we compute the angle between three residues (residues 494, 538, and 1042) of spike protein subunit C. These residues reside in the binding site of ACE2, around the AMR, and in an interface of the stalk region of chain C and other spike chains.
Using SWARM docking, we find a possible binding site of hepcidin25 on chain C (Table 7 and Figure 12). As we observe that hepcidin25 binds to the AMR of chain C in single-chain form (Figure 12A), we measure the changes of the noted angle in ANM-generated ensembles of chain C alone, chain C with hepcidin25 in its AMR (CH), chain C binds to ACE2 (CD), and when chain C is bonded to ACE2 and simultaneously hepcidin25 binds to AMR of chain C (CDH). The noted angle for chain C in different assemblies has its own spectrum; we assume the lowest value of the angle as the closed state because the binding site of ACE2 is close to the body of spike trimer in such a small angle. We compute the difference between the measured angle and the smallest angle of chain C in each assembly. Therefore, if the measured deviation is a small negative value, it means that the observed state of the ACE2 binding site of chain C is similar to the proposed closed state.
Figure 12.
Effect of hepcidin25 on the dynamics of spike subunits. (A) Docked binding sites of hepcidin25 on chain C. (B) Measured angle is reported for Chain C, chain C with hepcidin25 in AMR (CH), chain C in association with ACE2 (CD), and hepcidin25 bonded to AMR of chain C in complex with ACE2 (CDH). (C) Results of hepcidin25 binding to chain C in association with other subunit chains and ACE2 (ABCD-HPC) or without hepcidin25 (ABCD).
We present the measured deviation from the closed state in Figure 12B for chain C in the absence of other spike subunits and in Figure 12C for the complete spike. It is declared in Figure 12 that the binding of hepcidin25 in the AMR encourages chain C to spend more time in its closed state. We know that the closed state of spike has a lower tendency for ACE2 because of topological barriers ahead of spike subunits in the closed state for binding to cell-bonded ACE2.46,47 While we predict that the binding of hepcidin25 to the AMR increases the affinity of spike chain C for ACE2 to some extent in the open state, we also observed that the binding of hepcidin25 to AMR converts the spike RBD from an upward state into the closed state, which naturally has a lower tendency for interaction with ACE2. These observations in addition to the possible action of hepcidin25 as a competitive inhibitor of ACE2 for interaction with spike suggest hepcidin25 as a possible therapeutic agent for COVID19.
The Dynamic Transition of Spike from the Closed to Open State Dictates AMR–Hepcidin Interactions
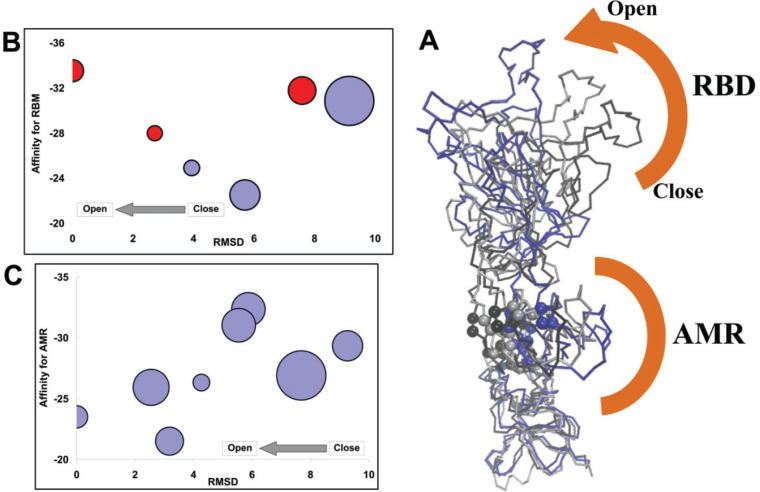
In the previous section, we study the interaction of hepcidin25 with spike protein. The considered spike was open and ready for binding to ACE2. Spike protein is in an inactive, trigger-ready, and closed state before binding to its cognate ligand. Upon interaction with host receptors, ACE2, the closed state of spike is changed to the open state. To study the binding of hepcidin25 to transient structures of spike from closed to open states, we utilized Targeted Molecular Dynamics simulations. To sample the spike structures, we perform the TMD simulations using spike in a trimeric state with all chains in the closed state, PDBID 6vxx, as the starting point and trimeric spike with one subunit in the open state (PDBID 6vsb) as the target structure. The resulting trajectories provide us possible 3D structures of spike along the transition from closed to open states (Figure 13A). We select six representative structures along the closed to open state pathway. The representative structure is introduced to the SWARM flexible docking algorithm. SWARM generates 10 first elastic normal modes for receptor and ligand structures to consider the natural motion of the structures that reside in the bottom of the energy curve. This approach not only implements the flexibility but also generates the possible structures around the seed structure for expanding the available binding sites. The docking results are presented in a clustering list that we consider the top 10 clusters.
Figure 13.
Results of hepcidin25 interaction with spike in different states. (A) Output of the TMD simulation for sampling the spike structure from closed to open states. The most important residues of the AMR, P > 0.5, are declared by sphere. (B) SWARM-predicted affinity of hepcidin25 for the RBM of spike chains along the transition from closed to open states. The horizontal axis represents the distance of the state to the open conformation of spike by computing the RMSD between the considered frame and the target structure in TMD. (C) Same story but for affinity between hepcidin25 and the AMR in monomeric spike. The size of the circle (B, C) correlates with the size of the SWARM suggesting the top cluster corresponds to the considered representative introduced receptor.
The results reported in Figure 13B indicate hepcidin25 binds to the receptor binding motif of spike. The diameter of circles in Figure 13 correlates with the population of the considered cluster defined by SWARM. We introduced trimeric spike to the SWARM algorithm. Hepcidin25 binds to the RBM of different chains in trimeric spike. If it binds to the chain that will stand up then we colored the corresponding circle red. The utilized samples of the trimeric spike structure from closed to open states show one meaningful complex with hepcidin25 in the AMR. The rectified spike chain in the trimeric form of spike protein presents a binding site around the AMR for hepcidin25 when it is near to the open conformation. In this state the distance between the center of mass of hepcidin25 and the AMR reaches 19.1 Å, but hepcidin25 is not successful for penetrating into the AMR; instead of binding into the AMR cavity it binds to the external wall of the AMR. Because the spike structure suffers structural changes in the RBM during the transition from closed to open states, the RBM shows a different affinity for hepcidin25 along the transition path (Figure 13B). It is indicated in Figure 13B that the RBM is becoming a better binding site for hepcidin25 upon transition of trimeric spike to the open state. We noted in a previous part that the considered spike was in the trimeric state, and by using TMD, we simulate the transition of one chain from the closed to open states in the context of the trimeric spike. Because of possible hindrances, hepcidin25 did not find the AMR in spike. When we introduce the representative transition structures of spike in monomer form to SWARM as a receptor, we detect that hepcidin25 binds to the AMR in most members of the top docking clusters (Figure 13C). It is indicated in Figure 13C that the affinity of hepcidin25 is decreased for AMR upon transition of spike to the open state.
We compute the interaction energy between residues of AMR and other parts of spike in trimeric form or the interaction of the AMR with itself (Figure 14) along the transition of spike from the closed to open state. The presented results in Figure 14 indicate that, upon transition of spike from the closed to open state, the AMR shows less contact with other regions of spike but becomes tighter because of its interactions with itself increased by the transition of spike to the open state (Figure 14). These results may rationalize why hepcidin25 has a lower chance for binding to AMR in the open state of trimeric spike. Our computations suggest that hepcidin25 preferentially binds to the RBM of spike in the trimeric open state while hepcidin25 tends to bind to AMR in closed monomeric spike protein. These observations comply with the above-stated conclusion that hepcidin25 upon binding to the AMR tends to convert spike from the open state to the closed and safer state.
Figure 14.
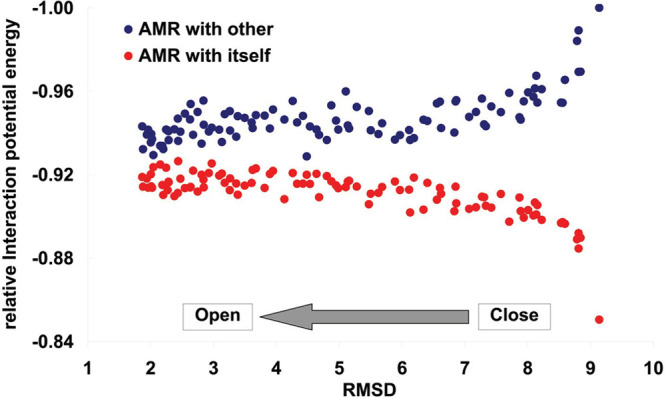
Pair-interaction potential is computed for the AMR. The relative interaction potential is presented in the vertical axis. More negative potential means a higher amount of interactions. The horizontal axis represents the distance of the state to the open conformation of spike by computing the RMSD between the considered frame and the target structure in TMD.
Conclusions
By employing a multifaceted computational approach on complexes of SARS-Cov2 spike protein, we gave a proof-of-concept that the binding of hepcidin to the complex ACE2–spike can promote the allosteric character of AMR interactions by enhancing the stability of the intermolecular interactions. PCN results highlighted active residues in the complex of ACE2-spike-hepcidin and that the hepcidin presence enhanced the strength of interactions at ACE2–spike interface. These results came along with the SEPAS and ENM results, both pointing to an increased affinity of the binding. Eventually, energy flow results converged toward the same allosteric region in the modulation of the ACE2–spike complex, with and without hepcidin.
Thus, all the adopted computational methods converge to a very consistent picture of the SARS-Cov2 spike protein binding process to ACE2 receptor highlighting the allosteric character of the process and confirming the presence of an allosteric modulating region playing a crucial role in determining receptor binding affinity. These results can be interpreted as a case study of a possible integration of different computational techniques looking for their invariant features. In this case, the take-home message is the consistency of the hepcidin role in allosteric modulation.
Hepcidin, as often happens in pharmacology, while exerting a possible antagonist role in spike protein receptor binding (therapeutic effect), plays at the same time a crucial role in the iron balance of blood cells, and this implies any alteration of hepcidin concentration can result in a risk of blood clotting. In a similar vein, the structural (and sequence) similarities of spike protein segments with hepcidin offer a possible explanation to COVID19 pathogenesis as well as to the rare thrombotic cases associated with vaccination.
Acknowledgments
H.H.-A. acknowledges the Institute for Advanced Studies in Basic Sciences at Zanjan, Iran, for supporting this work. G.H. is thankful for the support by the National Natural Science Foundation of China (31872723).
Supporting Information Available
The Supporting Information is available free of charge at https://pubs.acs.org/doi/10.1021/acsomega.2c00154.
Schematic illustration of simulations performed, plots of RMSD values and accessible surface area versus time, plots of density versus kilocalories per mole (PDF)
The authors declare no competing financial interest.
Notes
Data and Software Availability. All utilized computational tools like programs and servers are freely available for academic users. The information and download links of the utilized tools are presented in this section. All of the performed conventional MD simulations are carried out by utilizing NAMD 2.13. It is freely available at https://www.ks.uiuc.edu/Research/namd/2.13/features.html. CHARMM force fields for proteins are downloaded from the freely accessible repository at https://charmm-gui.org/?doc=toppar. PCN are computed on Matlab, version 2021a; heat maps of network indicators are produced through PyMol v2.4.2; full details of the method can be found in a previously cited reference.27 The presented molecular structures are generated using VMD 1.9.2 that is freely available at https://www.ks.uiuc.edu/Research/vmd/vmd-1.9.2/. To perform monomer-based affinity prediction, SEPAS software is utilized. The software is published and described at https://pubs.acs.org/doi/abs/10.1021/acs.jproteome.9b00594. SEPAS is freely available at http://biophysics.ir/affinity/. To perform flexible docking we utilized SWARM.44 The ANM-based ensembles are generated using Prody. It is freely available at http://prody.csb.pitt.edu/. Software for figures: Figure 1: generated by PyMol v2.4.2; Figure 2: generated in PowerPoint (MacOffice 2016); Figure 3: generated by PyMol v2.4.2. Figure 4: generated by PyMol v2.4.2. Figure 5: generated by PyMol v2.4.2. Figure 6: generated by VMD 1.9.2. Figure 7: generated by VMD 1.9.2. Figure 8: generated by excel and R. Figure 9: generated by VMD 1.9.2., R and excel. Figure 10: generated by VMD 1.9.2. and excel. Figure 11: generated by excel. Figure 12: panels (a) and (b) have been generated by Prody (http://prody.csb.pitt.edu/), panel (c) by VMD 1.9.2. Figure 13: panels (a–c) have been generated by VMD 1.9.2. and panel (d) by R.
Supplementary Material
References
- Irani A. H.; Steyn-Ross D. A.; Steyn-Ross M. L.; Voss L.; Sleigh J. The molecular dynamics of possible inhibitors for SARS-CoV-2. J. Biomol. Struct. Dyn. 2021, 1–10. 10.1080/07391102.2021.1942215. [DOI] [PubMed] [Google Scholar]
- Seyedpour S.; Khodaei B.; Loghman A. H.; Seyedpour N.; Kisomi M. F.; Balibegloo M.; Nezamabadi S. S.; Gholami B.; Saghazadeh A.; Rezaei N. Targeted therapy strategies against SARS-CoV-2 cell entry mechanisms: A systematic review of in vitro and in vivo studies. J. Cell. Physiol. 2021, 236, 2364–2392. 10.1002/jcp.30032. [DOI] [PubMed] [Google Scholar]
- Biswas S.; Dey S.; Chatterjee S.; Nandy A. Combatting future variants of SARS-CoV-2 using an in-silico peptide vaccine approach by targeting the spike protein. Med. Hypotheses 2022, 161, 110810. 10.1016/j.mehy.2022.110810. [DOI] [PMC free article] [PubMed] [Google Scholar]
- Wang Y.; Liu M.; Gao J. Enhanced receptor binding of SARS-CoV-2 through networks of hydrogen-bonding and hydrophobic interactions. Proc. Natl. Acad. Sci. U.S.A. 2020, 117, 13967–13974. 10.1073/pnas.2008209117. [DOI] [PMC free article] [PubMed] [Google Scholar]
- Triveri A.; Serapian S. A.; Marchetti F.; Doria F.; Pavoni S.; Cinquini F.; Moroni E.; Rasola A.; Frigerio F.; Colombo G. SARS-CoV-2 spike protein mutations and escape from antibodies: a computational model of epitope loss in variants of concern. J. Chem. Inf. Model. 2021, 61, 4687–4700. 10.1021/acs.jcim.1c00857. [DOI] [PMC free article] [PubMed] [Google Scholar]
- Nai A.; Lorè N. I.; Pagani A.; De Lorenzo R.; Di Modica S.; Saliu F.; Cirillo D. M.; Rovere-Querini P.; Manfredi A. A.; Silvestri L. Hepcidin levels predict Covid-19 severity and mortality in a cohort of hospitalized Italian patients. Am. J. Hematol. 2021, 96, E32–E35. 10.1002/ajh.26027. [DOI] [PubMed] [Google Scholar]
- Ganz T. Hepcidin—a peptide hormone at the interface of innate immunity and iron metabolism. Curr. Top. Microbiol. Immunol. 2006, 306, 183–198. 10.1007/3-540-29916-5_7. [DOI] [PubMed] [Google Scholar]
- Yagci S.; Serin E.; Acicbe O.; Zeren M. I.; Odabasi M. S. The relationship between serum erythropoietin, hepcidin, and haptoglobin levels with disease severity and other biochemical values in patients with COVID-19. Int. J. Lab. Hematol. 2021, 43, 142–151. 10.1111/ijlh.13479. [DOI] [PMC free article] [PubMed] [Google Scholar]
- Park C. H.; Valore E. V.; Waring A. J.; Ganz T. Hepcidin, a Urinary Antimicrobial Peptide Synthesized in the Liver. J. Biol. Chem. 2001, 276. 10.1074/jbc.M008922200. [DOI] [PubMed] [Google Scholar]
- Ehsani S. COVID-19 and iron dysregulation: distant sequence similarity between hepcidin and the novel coronavirus spike glycoprotein. Biol. Direct 2020, 15, 1–13. 10.1186/s13062-020-00275-2. [DOI] [PMC free article] [PubMed] [Google Scholar]
- Ni D.; Lu S.; Zhang J. Emerging roles of allosteric modulators in the regulation of protein-protein interactions (PPIs): A new paradigm for PPI drug discovery. Med. Res. Rev. 2019, 39, 2314–2342. 10.1002/med.21585. [DOI] [PubMed] [Google Scholar]
- Genome-wide Structure and Function Modeling of SARS-CoV-2 . https://zhanglab.ccmb.med.umich.edu/COVID-19/, 2020.
- Di Paola L.; Hadi-Alijanvand H.; Song X.; Hu G.; Giuliani A. The Discovery of a Putative Allosteric Site in the SARS-CoV-2 Spike Protein Using an Integrated Structural/Dynamic Approach. J. Proteome Res. 2020, 19, 4576–4586. 10.1021/acs.jproteome.0c00273. [DOI] [PubMed] [Google Scholar]
- Agrawal P.; Singh H.; Srivastava H. K.; Singh S.; Kishore G.; Raghava G. P. S. Benchmarking of different molecular docking methods for protein-peptide docking. BMC Bioinf 2019, 19, 426. 10.1186/s12859-018-2449-y. [DOI] [PMC free article] [PubMed] [Google Scholar]
- Verkhivker G. M.; Di Paola L. Dynamic Network Modeling of Allosteric Interactions and Communication Pathways in the SARS-CoV-2 Spike Trimer Mutants: Differential Modulation of Conformational Landscapes and Signal Transmission via Cascades of Regulatory Switches. J. Phys. Chem. B 2021, 125, 850–873. 10.1021/acs.jpcb.0c10637. [DOI] [PubMed] [Google Scholar]
- Blacklock K.; Verkhivker G. M. Allosteric regulation of the Hsp90 dynamics and stability by client recruiter cochaperones: protein structure network modeling. PLoS One 2014, 9, e86547 10.1371/journal.pone.0086547. [DOI] [PMC free article] [PubMed] [Google Scholar]
- Di Paola L.; De Ruvo M.; Paci P.; Santoni D.; Giuliani A. Protein contact networks: an emerging paradigm in chemistry. Chem. Rev. 2013, 113, 1598–1613. 10.1021/cr3002356. [DOI] [PubMed] [Google Scholar]
- Leitner D. M.; Pandey H. D.; Reid K. M. Energy Transport across Interfaces in Biomolecular Systems. J. Phys. Chem. B 2019, 123, 9507–9524. 10.1021/acs.jpcb.9b07086. [DOI] [PubMed] [Google Scholar]
- Johnson D. B. Efficient Algorithms for Shortest Paths in Sparse Networks. J. ACM 1977, 24, 1–13. 10.1145/321992.321993. [DOI] [Google Scholar]
- Tasdighian S.; Di Paola L.; De Ruvo M.; Paci P.; Santoni D.; Palumbo P.; Mei G.; Di Venere A.; Giuliani A. Modules identification in protein structures: the topological and geometrical solutions. J. Chem. Inf. Model. 2014, 54, 159–68. 10.1021/ci400218v. [DOI] [PubMed] [Google Scholar]
- Cumbo F.; Paci P.; Santoni D.; Di Paola L.; Giuliani A. GIANT: a cytoscape plugin for modular networks. PLoS One 2014, 9, e105001 10.1371/journal.pone.0105001. [DOI] [PMC free article] [PubMed] [Google Scholar]
- Guimerà R.; Nunes Amaral L. A. Functional cartography of complex metabolic networks. Nature 2005, 433, 895–900. 10.1038/nature03288. [DOI] [PMC free article] [PubMed] [Google Scholar]
- Cimini S.; Di Paola L.; Giuliani A.; Ridolfi A.; De Gara L. GH32 family activity: a topological approach through protein contact networks. Plant Mol. Biol. 2016, 92, 401–410. 10.1007/s11103-016-0515-2. [DOI] [PubMed] [Google Scholar]
- Di Paola L.; Mei G.; Di Venere A.; Giuliani A. Exploring the stability of dimers through protein structure topology. Curr. Protein Pept. Sci. 2015, 17, 30–6. 10.2174/1389203716666150923104054. [DOI] [PubMed] [Google Scholar]
- Di Paola L.; Platania C. B. M.; Oliva G.; Setola R.; Pascucci F.; Giuliani A. Characterization of protein–protein interfaces through a protein contact network approach. Front. bioeng. biotechnol. 2015, 3, 170. 10.3389/fbioe.2015.00170. [DOI] [PMC free article] [PubMed] [Google Scholar]
- Krissinel E.; Henrick K. Inference of macromolecular assemblies from crystalline state. J. Mol. Biol. 2007, 372, 774–797. 10.1016/j.jmb.2007.05.022. [DOI] [PubMed] [Google Scholar]
- Di Paola L.; Mei G.; Di Venere A.; Giuliani A.. Allostery ;Springer, 2021; pp 7–20. [DOI] [PubMed] [Google Scholar]
- Atilgan A. R.; Durell S. R.; Jernigan R. L.; Demirel M. C.; Keskin O.; Bahar I. Anisotropy of fluctuation dynamics of proteins with an elastic network model. Biophys. J. 2001, 80, 505–15. 10.1016/S0006-3495(01)76033-X. [DOI] [PMC free article] [PubMed] [Google Scholar]
- Marcos E.; Crehuet R.; Bahar I. Changes in dynamics upon oligomerization regulate substrate binding and allostery in amino acid kinase family members. PLoS Comput. Biol. 2011, 7, e1002201 10.1371/journal.pcbi.1002201. [DOI] [PMC free article] [PubMed] [Google Scholar]
- Bakan A.; Meireles L. M.; Bahar I. ProDy: protein dynamics inferred from theory and experiments. Bioinformatics 2011, 27, 1575–7. 10.1093/bioinformatics/btr168. [DOI] [PMC free article] [PubMed] [Google Scholar]
- Eyal E.; Yang L. W.; Bahar I. Anisotropic network model: Systematic evaluation and a new web interface. Bioinformatics 2006, 22, 2619–2627. 10.1093/bioinformatics/btl448. [DOI] [PubMed] [Google Scholar]
- Atilgan C.; Gerek Z. N.; Ozkan S. B.; Atilgan A. R. Manipulation of conformational change in proteins by single-residue perturbations. Biophys. J. 2010, 99, 933–43. 10.1016/j.bpj.2010.05.020. [DOI] [PMC free article] [PubMed] [Google Scholar]
- Sali A.; Blundell T. L. Comparative protein modelling by satisfaction of spatial restraints. J. Mol. Biol. 1993, 234, 779–815. 10.1006/jmbi.1993.1626. [DOI] [PubMed] [Google Scholar]
- Hadi-Alijanvand H. Soft regions of protein surface are potent for stable dimer formation. J. Biomol. Struct. Dyn. 2020, 38, 3587–3598. 10.1080/07391102.2019.1662328. [DOI] [PubMed] [Google Scholar]
- Hadi-Alijanvand H.; Rouhani M. Partner-specific prediction of protein-dimer stability from unbound structure of monomer. J. Chem. Inf. Model. 2018, 58, 733–745. 10.1021/acs.jcim.7b00606. [DOI] [PubMed] [Google Scholar]
- Hadi-Alijanvand H. Complex Stability Is Encoded in Binding Patch Softness: A Monomer-Based Approach to Predict Inter-Subunit Affinity of Protein Dimers. J. Proteome Res. 2020, 19, 409–423. 10.1021/acs.jproteome.9b00594. [DOI] [PubMed] [Google Scholar]
- Onufriev A.; Bashford D.; Case D. A. Modification of the generalized born model suitable for macromolecules. J. Phys. Chem. B 2000, 104, 3712–3720. 10.1021/jp994072s. [DOI] [Google Scholar]
- Acun B.; Hardy D. J.; Kale L. V.; Li K.; Phillips J. C.; Stone J. E. Scalable Molecular Dynamics with NAMD on the Summit System. IBM J. Res. Dev. 2018, 62, 1–9. 10.1147/JRD.2018.2888986. [DOI] [PMC free article] [PubMed] [Google Scholar]
- Mackerell A. D. Jr; Feig M.; Brooks C. L. 3rd Extending the treatment of backbone energetics in protein force fields: limitations of gas-phase quantum mechanics in reproducing protein conformational distributions in molecular dynamics simulations. J. Comput. Chem. 2004, 25, 1400–15. 10.1002/jcc.20065. [DOI] [PubMed] [Google Scholar]
- Foloppe N.; MacKerell A. D. Jr All-atom empirical force field for nucleic acids: I. Parameter optimization based on small molecule and condensed phase macromolecular target data. J. Comput. Chem. 2000, 21, 86–104. . [DOI] [Google Scholar]
- Zhang C.; Ma J. Enhanced sampling and applications in protein folding in explicit solvent. J. Chem. Phys. 2010, 132, 244101. 10.1063/1.3435332. [DOI] [PMC free article] [PubMed] [Google Scholar]
- Genheden S.; Kuhn O.; Mikulskis P.; Hoffmann D.; Ryde U. The normal-mode entropy in the MM/GBSA method: effect of system truncation, buffer region, and dielectric constant. J. Chem. Inf. Model. 2012, 52, 2079–2088. 10.1021/ci3001919. [DOI] [PubMed] [Google Scholar]
- Vergara-Jaque A.; Comer J.; Monsalve L.; Gonzalez-Nilo F. D.; Sandoval C. Computationally efficient methodology for atomic-level characterization of dendrimer–drug complexes: a comparison of amine-and acetyl-terminated PAMAM. J. Phys. Chem. B 2013, 117, 6801–6813. 10.1021/jp4000363. [DOI] [PubMed] [Google Scholar]
- Torchala M.; Moal I. H.; Chaleil R. A. G.; Fernandez-Recio J.; Bates P. A. SwarmDock: a server for flexible protein-protein docking. Bioinformatics 2013, 29, 807–9. 10.1093/bioinformatics/btt038. [DOI] [PubMed] [Google Scholar]
- Torchala M.; Moal I. H.; Chaleil R. A.; Agius R.; Bates P. A. A Markov-chain model description of binding funnels to enhance the ranking of docked solutions. Proteins: Struct., Funct., Bioinf. 2013, 81, 2143–2149. 10.1002/prot.24369. [DOI] [PubMed] [Google Scholar]
- Wrapp D.; Wang N.; Corbett K. S.; Goldsmith J. A.; Hsieh C.-L.; Abiona O.; Graham B. S.; McLellan J. S. Cryo-EM structure of the 2019-nCoV spike in the prefusion conformation. Science 2020, 367 (6483), 1260–1263. 10.1126/science.abb2507. [DOI] [PMC free article] [PubMed] [Google Scholar]
- Mansbach R. A.; Chakraborty S.; Nguyen K.; Montefiori D. C.; Korber B.; Gnanakaran S. The SARS-CoV-2 Spike variant D614G favors an open conformational state. Sci. Adv. 2021, 7 (16), eabf3671 10.1126/sciadv.abf3671. [DOI] [PMC free article] [PubMed] [Google Scholar]
- Gnanasekaran R.; Agbo J. K.; Leitner D. M. Communication maps computed for homodimeric hemoglobin: computational study of water-mediated energy transport in proteins. J. Chem. Phys. 2011, 135, 065103. 10.1063/1.3623423. [DOI] [PubMed] [Google Scholar]
- Leitner D. M. Water-mediated energy dynamics in a homodimeric hemoglobin. J. Phys. Chem. B 2016, 120, 4019–4027. 10.1021/acs.jpcb.6b02137. [DOI] [PubMed] [Google Scholar]
- Lee Y.; Choi S.; Hyeon C. Mapping the intramolecular signal transduction of G-protein coupled receptors. Proteins 2014, 82, 727–43. 10.1002/prot.24451. [DOI] [PubMed] [Google Scholar]
- Leitner D. M.; Hyeon C.; Reid K. M. Water-mediated biomolecular dynamics and allostery. J. Chem. Phys. 2020, 152, 240901. 10.1063/5.0011392. [DOI] [PubMed] [Google Scholar]
- Di Paola L.; Giuliani A. Protein contact network topology: a natural language for allostery. Curr. Opin. Struct. Biol. 2015, 31, 43–8. 10.1016/j.sbi.2015.03.001. [DOI] [PubMed] [Google Scholar]
- De Ruvo M.; Giuliani A.; Paci P.; Santoni D.; Di Paola L. Shedding light on protein–ligand binding by graph theory: the topological nature of allostery. Biophys. Chem. 2012, 165, 21–29. 10.1016/j.bpc.2012.03.001. [DOI] [PubMed] [Google Scholar]
- Di Nardo G.; Di Venere A.; Zhang C.; Nicolai E.; Castrignanò S.; Di Paola L.; Gilardi G.; Mei G. Polymorphism on human aromatase affects protein dynamics and substrate binding: spectroscopic evidence. Biol. Direct 2021, 16, 1–12. 10.1186/s13062-021-00292-9. [DOI] [PMC free article] [PubMed] [Google Scholar]
- PDBePISA (Proteins, Interfaces, Structures and Assemblies) . https://www.ebi.ac.uk/pdbe/pisa/, 2021.
Associated Data
This section collects any data citations, data availability statements, or supplementary materials included in this article.


