

Abstract
Medial prefrontal cortex (MPFC) and other regions like the occipital cortex (OC) exhibit abnormal neural activity in major depressive disorder (MDD). Their relationship to specific biochemical, psychophysical, and psychopathological changes remains unclear, though. For that purpose, we focus on a particular subregion in OC, namely middle temporal (MT) visual area that is known to mediate the perception of visual motion. Using high-field 7 T magnetic resonance imaging (MRI), including resting state functional MRI and proton magnetic resonance spectroscopy, the amplitude of low-frequency fluctuations (ALFF) of the blood oxygen level-dependent signal in MT, MT-seeded functional connectivity (FC), and gamma-aminobutyric acid (GABA) in MT were investigated. Applying the vision motion psychophysical task, the motion suppression index of subjects was also examined. We demonstrate significantly elevated neural variability (as measured by ALFF) in MT together with decreases in both MT GABA and motion suppression in our MDD sample. Unlike in healthy subjects, MT neural variability no longer modulates the relationship of MT GABA and motion suppression in MDD. MT also exhibits reduction in global inter-regional FC to MPFC in MDD. Finally, elevated MT ALFF relates to specifically retardation in behavior as measured by the Hamilton subscore. Together, MT provides a strong candidate for biomarker in MDD.
Keywords: amplitude of low-frequency fluctuations, biomarker, major depressive disorder, middle temporal visual cortex, proton magnetic resonance spectroscopy
Introduction
Major depressive disorder (MDD) is a complex psychiatric disorder where participants, besides mood symptoms, often show abnormal slowness in behavior, that is, retardation (Francesmonneris et al. 2013). Neuronally, MDD is characterized by strong changes in medial prefrontal cortex (MPFC) including the default-mode network (DMN) (Sheline et al. 2009; Andrews-Hanna et al. 2010; Kaiser et al. 2015; Yin et al. 2019; Scalabrini et al. 2020). In addition, changes in subcortical regions like amygdala (Tahmasian et al. 2013; Tang et al. 2013; Romanczuk-Seiferth et al. 2014; Jacobs et al. 2016) as well as others like the occipital cortex (OC) have been highlighted. Various studies show decreased activity in OC in both rest (Tao et al. 2011; Zeng et al. 2012; Kaiser et al. 2015; Scalabrini et al. 2020) and task (Furey et al. 2013; Le et al. 2017) as well as decreased inhibitory gamma-aminobutyric acid (GABA; Sanacora et al. 1999, 2004; Bhagwagar et al. 2007; Song et al. 2021) in acute MDD. Can OC serve as biomarker of MDD? Ideally, a biomarker should link biochemical, neuronal, psychophysical, and psychopathological levels of MDD as it is, for instance, proposed in the RDoC classification (Insel et al. 2010; Cuthbert and Insel 2013). The goal of our paper is to link these levels in order to provide further support for the OC as candidate biomarker of MDD.
The OC is heterogenous as it includes various subregions like early visual cortex (EVC) at the bottom and middle temporal (MT) visual area towards the upper end of the visual hierarchy (Born and Bradley 2005; Wengler et al. 2020). While previous studies in MDD targeted EVC (Zomet et al. 2008; Bubl et al. 2009; Salmela et al. 2021), a recent study focused mainly on MT (Song et al. 2021). MT is a higher order occipital region that is strongly involved in processing visual motion (Tadin et al. 2003; Born and Bradley 2005; Schallmo et al. 2018). Interestingly, psychophysical studies demonstrate that MDD patients show decreased ability in discriminating moving stimuli, a capacity that is well known to be related specifically to MT (Tadin et al. 2003; Golomb et al. 2009; Norton et al. 2016; Schallmo et al. 2018). Correspondingly, a recent study demonstrates that MT exhibits biochemical deficits in GABA leading to alteration in excitation–inhibition balance (EIB) (Song et al. 2021). This leaves open whether the changes in visual motion and GABA are related to abnormal neural activity in MT of MDD and how that, in turn, impacts its relationship to MPFC/DMN.
Resting-state activity in MDD is characterized by both inter-regional and intra-regional changes. Intra-regional activity can, for instance, be measured by neural variability that, describing the changes in the amplitude across time, is operationalized by the amplitude of low-frequency fluctuations (ALFF) (Zang et al. 2007; Zuo et al. 2010). Interestingly, MDD shows widespread abnormalities in ALFF in various regions like MPFC/DMN and OC including both increases and decreases (Womer et al. 2014; Zhang et al. 2014; Cui et al. 2016; Song et al. 2020). However, whether MT and EVC exhibit local-regional neural variability (ALFF) changes in MDD and how these are related to the more global inter-regional functional connectivity (FC) to MPFC/DMN remains yet unclear.
Inter-regional relationships are measured by FC, which is known to be abnormally high in especially MPFC/DMN of MDD (Sheline et al. 2009; Zeng et al. 2012; Kaiser et al. 2015). Recently, Scalabrini et al. (2020) demonstrated that inter-regional FC changes in DMN of MDD can be traced to the brain’s global activity, its overall topographic organization, rather than local-regional changes. This raises the question whether changes in OC and specifically MT including its FC to MPFC/DMN are local-regional or, alternatively, may be related to a more global source as related to the whole brain’s topography. We therefore aim distinguishing local-regional and more global changes in our neuronal analyses of MT and its FC to MPFC/DMN by conducting these analyses with and without global signal regression (GSR) (Huang et al. 2018; Scalabrini et al. 2020).
The goal of our multilevel study is to investigate intra-regional neural activity changes in OC, that is, MT (and EVC) of acute MDD as well as how especially MT is related to (i) psychophysical measures of visual motion; (ii) biochemical indices like GABA; (iii) inter-regional connectivity to MPFC/DMN; and (iv) specific depressive symptoms like retardation. For that purpose, we use high-field 7 T functional magnetic resonance imaging (fMRI) in both healthy and MDD. Beyond linking intra- and inter-regional changes of OC and MPFC/DMN, the focus on MT offers the opportunity to investigate biochemical (GABA), neuronal (ALFF), and psychophysical (visual motion) levels including their relationship and how that is disrupted in MDD. Furthermore, we hypothesis that MT ALFF may mediate between MT GABA and motion suppression in HC subjects, but, due to its supposed changes, no longer modulates the relationship of MT GABA and motion suppression in MDD. Such multilevel approach can contribute to establish OC and specifically MT as candidate biomarker of MDD. In addition to diagnostic purposes, investigation of MT and its relation to MPFC/DMN also offers novel therapeutic options as MT. Being located at the outer surface of the brain (Tadin et al. 2011), MT and, more generally, OC, provide an easily accessible target for noninvasive brain stimulation (Zhang et al. 2020).
We demonstrate abnormally elevated intra-regional ALFF in MT of acute MDD that disrupts its modulatory role (mediation) of the relation between MT GABA and visual motion suppression. Moreover, MT exhibits decreased inter-regional FC with MPFC/DMN in MDD, which can be traced to a more global (rather than local-regional) source (as it disappears when applying GSR). Finally, changes in local intra-regional ALFF of MT, a region mediating specifically visual motion (Tadin et al. 2003; Born and Bradley 2005; Schallmo et al. 2018), are related to abnormally slow motion and speed in depressive behavior, that is, retardation. Together, our findings demonstrate the importance of higher order OC, that is, MT for local-regional function, global topography, and specific depressive symptoms in acute MDD. That singles out MT as a strong candidate biomarker and potential treatment target in MDD.
Materials and Methods
Ethics
This study was approved by the ethical committee of Hangzhou Seventh People’s Hospital. All participants signed the informed consent and all testing was conducted in line with the declaration of Helsinki.
Participants
Given the special scanning in 7 T, we recruited a cohort of 18 adult MDD subjects who were suffering from an acute depressive episode. An independent group of age- and gender-matched healthy subjects (n = 32) was recruited as HC group (Table 1). All subjects had normal or corrected to normal vision, and had the education background above the college degree. Inclusion criteria of the MDD subjects were: (i) presence of an acute depressive episode and the diagnosis MDD in accordance with the Diagnostic and Statistical Manual of Mental Disorders, Fifth Edition (DSM-V) as (a) established by the assessing psychiatrist, and (b) confirmed with Mini International Neuropsychiatric Interview (M.I.N.I.) (Sheehan et al. 1998); (ii) clinical symptoms of depression as measured by a Hamilton Depression Rating Scale (HAMD-17) ≥18; (iii) MDD subjects treated with the agent of selective serotonin reuptake inhibitors (SSRI). Exclusion criteria were: (i) any other psychiatric disorder, or a mental disorder caused by a physical illness or substance abuse or a personality disorder; (ii) history of traumatic brain injury, epilepsy, or other known organic lesion of the central nervous system; (iii) presence of psychotic symptoms during the depressive episodes; (iv) subjects who were taking benzodiazepines during experiment time as they may affect occipital GABA concentration; and (v) history of endocrine disease or blood, heart, liver, kidney dysfunction, another medical disorder such as diabetes, or pregnancy.
Table 1.
Demographics and participant psychophysics data and patient clinical data
| Variables | MDD patients (n = 18) | Healthy controls (n = 32) | P value |
|---|---|---|---|
| Gender (M/F) | 8/10 | 12/20 | 0.639 |
| Age, years (SD) | 23.6 (6.1) | 24.5 (3.0) | 0.524 |
| Suppression index (SD) | 0.03 (0.08)a | 0.09 (0.07)a | 0.024 |
| HAMD-17 scores (SD) | 23.6 (3.6) | — | — |
| Treatment, n (%) | |||
| Antidepressants | 16 (88.9) | — | — |
| SSRI | 15 (83.3) | — | — |
| Combination | 1 (5.6) | — | — |
| No antidepressants | 1 (5.6) | — | — |
| Antipsychotics | 13 (72.2) | — | — |
| Benzodiazepines | 9 (50) | — | — |
| Mood stabilizers | 5 (27.8) | — | — |
aOne patient with MDD and one healthy subject were unable to complete the psychophysics task, so MDD: n = 17; HC: n = 31. Bold font indicates P < 0.05.
All subjects participated in the motion spatial suppression psychophysical, resting-state fMRI and MRS experiments, but only part of the MRS data (16/18 MDD and 22/32 healthy subjects) survived quality control (see the part of MRS date processing), and only some of participants (17/18 MDD and 31/32 healthy subjects) successfully completed the psychophysical experiment.
Measurement of Visual Motion Suppression
All stimuli were produced using Psychophysics Toolbox (Brainard 1997) based on MATLAB (MathWorks, Natick, MA, USA) and were shown on a linearized monitor (1920 × 1080 resolution, 100-Hz refresh rate, Cambridge Research System, UK). The viewing distance was 72 cm from the screen, with the head stabilized by a chinrest. Stimuli were drawn against a gray (56 cd/m2) background.
The details of the procedure for measurement are available in our recent study (Song et al. 2021). Briefly, large (diameter of 10°) and small (diameter of 2°) stimuli were vertically drifting sinusoidal gratings with high contrast (contrast: 50%; spatial frequency, 1 cycle/o; speed, 4°/s) (see Supplementary Fig. S1 in Song et al. (2021)). The edge of the grating was blurred with a raised cosine function (width, 0.3°). The grating was ramped on and off with a Gaussian temporal envelope, and the grating duration was defined as 1 SD of the Gaussian function. The duration was adaptively adjusted in each trial, and duration thresholds were estimated by a staircase procedure. Thresholds for large and small gratings were obtained from a 160-trial block that contained four interleaved three-down/one-up staircases. For each participant, we computed the correct rate for different stimulus durations separately for each stimulus size. These values were then fitted to a cumulative Gaussian function, and the duration threshold corresponding to the 75% correct point on the psychometric function was estimated for each stimulus size. Stimulus demonstration and practice trials were presented before the first run. Auditory feedback was provided for each wrong response. To quantify the spatial suppression strength, we calculated the spatial suppression index (SI), defined as the difference of log10 thresholds for large versus small stimuli (Tadin et al. 2003; Schallmo et al. 2018).
 |
(1) |
MR Experimental Procedure
We performed MR experiments in a 7 T whole body MR system (Siemens Healthcare, Erlangen, Germany) with a Nova Medical 32 channel array head coil. Session included resting-state fMRI (rsfMRI), structural image scanning, fMRI localizer scan (part of the subjects), and MRS scan within human MT complex (hMT+) for each subject. Resting-state scans were acquired with 1.5-mm isotropic resolution (transverse orientation, TR/TE = 2000/20.6 ms, 160 volumes, slice number = 90, flip angle = 70°, eyes closed). Structural images were acquired using a MP2RAGE sequence (TR/TI1/TI2 = 5000/901/3200 ms) with 0.7-mm isotropic resolution. Spectroscopy data were acquired using a 1H-MRS single-voxel short-TE STEAM (Stimulated Echo Acquisition Mode) sequence (Frahm et al. 1989) (TE/TM/TR = 6/32/7100 ms) with 4096 sampling points, 4-kHz bandwidth, 16 averages, eight repetitions, 20 × 20 × 20 mm3 volume of interest (VOI) size, and variable power and optimized relaxation delays (VAPOR) water suppression (Tká et al. 1999). Prior to acquisition, first- and second-order shims were adjusted using fast, automatic shimming technique by mapping (FASTMAP) along projections (Gruetter 1993). Two nonsuppressed water spectra were also acquired: one for phase and eddy current correction (only RF pulse, four averages) and another for metabolite quantification (VAPOR none, four averages). Voxels were positioned based on anatomical landmarks using a structural image scan collected in the same session, while avoiding contamination by CSF, bone, and fat. The hMT+ VOIs were placed in the ventrolateral occipital lobe, which was based on anatomical landmarks (Dumoulin et al. 2000; Schallmo et al. 2018). In these hMT+ VOIs, we did not distinguish between the middle temporal (MT) and medial superior temporal (MST) areas (Schallmo et al. 2018), both of which are motion selective (Huk et al. 2002). For 10 subjects, we, using fMRI, also functionally identified hMT+ as a check on the placement of the VOI. For these 10 healthy subjects, a protocol was used with a drifting grating (15% contrast) alternated with a static grating across blocks (10 s block duration, 160 TRs total). Using fMRI blood oxygen level-dependent (BOLD) signals, these localizer data were processed online to identify the hMT+ voxels in the lateral OC, which responded more strongly to moving versus static gratings (as in the method of Schallmo et al. (2018)). We did not scan the functional localizer for all MDD patients in order to reduce experimental load and time for the acute depressed subjects. In addition, we only used the left hMT+ as the target region to scan, which was motivated by studies showing that left hMT+ is more related to visual perceptual effects (Tadin et al. 2011).
MRS Data Processing
Spectroscopy data were preprocessed and quantified using magnetic resonance signal processing and analysis (https://www.cmrr.umn.edu/downloads/mrspa/), which runs under MATLAB and invokes the interface of the LCModel (Version 6.3-1 L) (Chen et al. 2019). First, we used the nonsuppressed water spectra to perform eddy current correction and frequency/phase correction. Second, we checked the quality of each FID (16 averages) visually and removed those with obviously poor quality. Third, the absolute concentrations of each metabolite were quantitatively estimated via the Water-Scaling method. For partial-volume correction, the tissue water content was computed as follows (Ernst et al. 1993):
 |
(2) |
where fgm, fwm, and fcsf were the GM/WM/CSF volume fraction in MRS VOI and we used FAST (FMRI’s automated segmentation tool, part of the FSL toolbox) (Zhang et al. 2001) to segment the three tissue compartments from the T1-weighted structural brain images. For water T2 correction, we set water T2 as 47 ms (Marjanska et al. 2012). Our concentrations were mM per kg wet weight. Furthermore, LCModel analysis was performed on all spectra within the chemical shift range of 0.2–4.0 ppm.
Poor spectral quality was established by a Cramer-Rao Lower Bound (CRLB) of more than 20% (Provencher 1993, 2001; Cavassila et al. 2001), and some data were excluded from further analysis. The signal-to-noise ratio (SNR) and full-width at half maximum (FWHM, the estimate of linewidth) were also used to control the spectral quality. All spectra with SNR < 15 or FWHM > 18 Hz were discarded. Spectral quality measures, that is, SNR, CRLBs, and the FWHM, were presented for difference between MDD and HC groups (see Supplementary Table S1). Overall quality of the obtained spectra can be regarded as good.
MRI Data Processing and Analysis
Resting-state functional images were preprocessed using the DPABI toolbox (Yan et al. 2016) based on SPM 12 (http://www.fil.ion.ucl.ac.uk/spm/) including: removal of the first five volumes, slice timing, realignment, coregistration of anatomical and functional images for each subject, segmentation of the anatomical images using DARTEL, linear detrend, nuisance covariates regression (with realignment Friston 24-parameter, white matter and CSF signal, both with and without global signal) (Friston et al. 1996), normalization to the standard MNI space with a resolution of 1.5 × 1.5 × 1.5 mm3 using DARTEL, spatial smoothing with a 3 mm FWHM Gaussian filter, and band-pass filtering with Standard frequency band (SFB, 0.01–0.1 Hz) as well as Slow3 (0.073–0.198 Hz), Slow4 (0.027–0.073 Hz), and Slow5 (0.01–0.027 Hz) (Buzsaki and Draguhn 2004; Zuo et al. 2010).
Before ALFF and FC analysis, we defined the region of interest (ROI). Left MT was described by a sphere with a radius of 10 mm (centered with −43, −73, 10 in MNI space) (Malikovic et al. 2007), left EVC was represented by Occipital_Sup_L mask, which was taken from AAL template, and bilateral MPFC was defined by the bilateral BA10 mask, which was obtained from Brodmann template.
After preprocessing, the Fast Fourier transformation was used to transform the time series for each voxel into the frequency domain, and the power spectrum was obtained. Within the SFB (0.01 to 0.1 Hz) as well as Slow3 (0.073 to 0.198 Hz), Slow4 (0.027 to 0.073 Hz), and Slow5 (0.01 to 0.027 Hz) frequency band, the averaged square root (i.e., ALFF value) of power spectrum activity was respectively calculated28 and then transformed to Z score for further comparison between groups. For both conditions, with and without GSR, we extracted the mean ALFF value within left MT and left EVC of each subject.
In addition to neural variability (ALFF) of MT, we also calculated FC in SFB in two distinct ways comparing HC and MDD, respectively. First, we took left MT as seed region and calculated its FC to the rest of the brain in a voxel-based way. Since the MPFC is a key region in MDD (Kaiser et al. 2015; Scalabrini et al. 2020), we also calculated FC of MT with a predefined region of MPFC (Brodmann 10) in both HC and MDD. Both sets of FC analyses were conducted with and without GSR as to identify their local or global source (Scalabrini et al. 2020). All the FC values were Fisher-Z-transformed. Date Processing and Analysis for Brain Imaging (DPABI) was used to investigate whether there were statistical differences in FC maps of MDD patients compared with healthy group. Using Gaussian random-field (GRF) theory, the significance threshold is voxel-wised P < 0.005, cluster-wised P < 0.05.
Statistical Analysis
PROCESS version 3.4, a toolbox in SPSS, was used to examine the mediation model. There are some prerequisites for mediation analysis: the independent variable should be a significant predictor of the mediator, and the mediator should be a significant predictor of the dependent variable. We examined whether the association between MT GABA and SI was mediated by ALFF in MT. Bias-corrected bootstrap methodology was used to evaluate the significance of the direct and indirect effect, in which 95% confidence interval (CI) was calculated with 5000 independent samples. If the bootstrap 95% CI of indirect effect did not contain zero, it indicated a significant mediating effect in the model.
SPSS 20 (IBM, USA) was used to conduct all the remaining statistical analysis in the study. We evaluated the correlation of variables (GABA, SI, ALFF, FC and depressive symptoms) using Pearson’s correlation analysis. Student’s t test was used to examine the differences between MDD and healthy groups. Differences or correlations were considered statistically significant if P < 0.05. Significances with multiple comparisons were tested with false discovery rate (FDR) correction. All analyses were controlled for medication effects (see Limitations for more details).
Results
Relationship of MT Neural Variability, MT GABA, and Motion Suppression in Healthy Subjects
Firstly, we used Pearson’s correlation analysis to investigate how the three variables (neuronal: ALFF, biochemical: GABA and psychophysical: SI) are related to each other in the HC group (n = 22). The correlations between GABA and SI (r = 0.59, P < 0.05), GABA and ALFF in SFB (r = 0.52, P < 0.05), ALFF in SFB and SI (r = 0.67, P < 0.01) were all significant in healthy subjects, which allowed us to apply mediation analyses.
We then tested the mediation model in the healthy subject group (Fig. 1). There were both significant direct and indirect effect in our mediation model with ALFF in MT as a mediator (Direct effect: c’ = 0.088, [0.014 0.196]; se = 0.049; effect ratio = 0.56; Indirect effect: c = 0.069, [0.003 0.163]; se = 0.042; effect ratio = 0.44). This suggests that neuronal activity (ALFF) in MT partially mediates the relationship of MT GABA and motion suppression.
Figure 1.
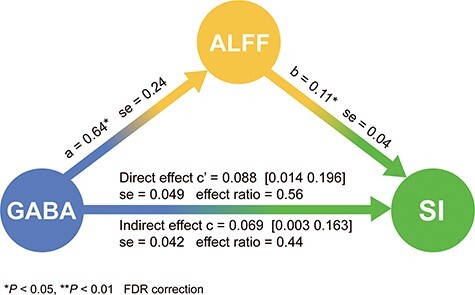
Mediation analysis in HC. ALFF serves as mediator between GABA (predictor) and SI (outcome).
Increased Neural Variability in MT of MDD
Compared with HC, the MDD group showed significantly increased ALFF in MT in SFB (T = 2.57, P < 0.05) as well as in all three sub-bands including Slow3 (T = 3.54, P < 0.01), Slow4 (T = 2.71, P < 0.05) and Slow5 (T = 1.87, P < 0.05) frequency band (Fig. 2A). We also found significantly elevated ALFF within EVC in SFB (T = 2.50, P < 0.05) as well as in Slow3 (T = 2.59, P < 0.05), Slow4 (T = 2.48, P < 0.05) and Slow5 (T = 2.32, P < 0.05) in MDD (Fig. 2B). In addition to the standard pre-processing that includes GSR in the analysis of ALFF, we also conducted the same analyses without GSR; this yielded similar results that suggests a truly local-regional (rather than global) source of ALFF changes in MT (see Supplementary Fig. S1).
Figure 2.

Group difference in ALFF between MDD and HC with GSR analyses. (A) MDD exhibited significantly elevated ALFF in MT compared with HC. (B) MDD showed significantly elevated ALFF in EVC compared with HC.
No Coupling of MT GABA, ALFF, and Motion SI in MDD Group
The time threshold of small moving grating in MDD (5.11 ± 1.28 ms, n = 17) is longer than HC (4.51 ± 0.73 ms, n = 31) which is almost significant (P = 0.06). Similar to the previous results (Song et al. 2021), there is significant longer time threshold in small stimuli of MDD than HC subjects. Consistent with a previous study (Song et al. 2021), we found that both MT GABA (T = −2.10, P < 0.05) and motion SI (T = −2.43, P < 0.05) were decreased in MDD compared with the healthy group (Fig. 3A). We conducted Pearson’s correlation analysis in MDD group (n = 16). Unlike in healthy subjects (Fig. 3B left), the three variables (ALFF, GABA, and SI) did not correlate with each other. Together, these results demonstrate that, unlike in healthy subjects (shown in Fig. 1), the elevated MT ALFF no longer modulates the relationship between MT GABA and motion SI in MDD (diagram shown in Fig. 3B right).
Figure 3.

Relationship between MT ALFF, MT GABA, and SI in MDD. (A) Reduction of GABA and SI in MDD. (B) The three variables (ALFF, GABA, and SI) correlated with each other in healthy subjects (left). Mediation model schematic in MDD (right): the abnormally elevated ALFF in MT (larger circle) disrupts its mediation of the relationship between lower MT GABA (smaller circle) and decreased SI (smaller circle) in MDD.
Decreased Functional Connectivity Between MT and MPFC in MDD
In order to probe relationship of MT to MPFC, we took MT as seed to investigate its FC changes with the rest of the brain. The results of voxel-wised FC are shown in Table 2 and Figure 4A. With the seed region placed in the left MT, MDD patients exhibited significantly decreased FC of MT with MPFC when compared with the HC group. This holds only when we did not apply GSR, whereas this effect disappeared when including GSR; that suggests a more global rather than local-regional (as either within MT or MPFC themselves) source (see also Scalabrini et al. 2020).
Table 2.
Significantly altered brain region in voxel-wised FC without GSR between MDD and HC group
| Seed | Cluster size | Effect regions | BA | Peak t-value | MNI coordinates | |||
|---|---|---|---|---|---|---|---|---|
| X | Y | Z | ||||||
| MT | MDD < HC | 253 | MPFC | BA10 | -2.68 | 3 | 49.5 | −6 |
Corrected by GRF correction (voxel-wised P < 0.005, cluster-wised P < 0.05). The peak coordinates were showed in the standard MNI space.
Figure 4.

Group difference in MT – MPC FC between MDD and HC, for both conditions with and without GSR. (A) Voxel-wised seed-based FC map of MDD versus HC, when MT was the seed region. Left: Without GSR in preprocessing, we found a significant cluster in MPFC, which indicated that the FC between left MT and MPFC was decreased; right: with GSR in preprocessing, there was no cluster in whole brain, which reflected the influence of global signal on MT-MPFC FC. (B) ROI-based MT-BA10 (MPC) FC of MDD versus HC. Left: Without GSR in preprocessing, MT-BA10 FC showed significant reduction in MDD compared with HC; right: with GSR in preprocessing, there was no significantly difference in MT-BA10 (MPFC) FC between the two groups, which reflected that the abnormality in this FC in MDD was likely be related to the global signal.
In order to further confirm these results, we took both left MT as well as bilateral BA10 (MPFC) as regions and correlated their time series with each other (i.e., FC). We again obtained significant MT-MPFC FC (in SFB including 0.01–0.1 Hz) decrease in MDD (T = −2.34, P < 0.05) which only hold when not applying GSR (while the significant difference disappeared when applying GSR: T = −1.68, P > 0.05); this speaks for a more global source of MT-MPFC FC changes in MDD (Fig. 4B). The rsFC comparison in all sub-bands including slow 3, 4, and 5 is displayed in Supplementary Figure S2.
Neural Variability in MT Relates to Retardation in Depressive Behavior
In the box plots (Fig. 5A), it could be seen that there are no outliers for ALFF of slow 3 in MT with GSR and retardation score in MDD group, which increased the confidence of the subsequent correlation analyses. In MDD patients, ALFF of slow 3 within MT was positively correlated with retardation score (of HAMD) (r = 0.48, P < 0.05, Fig. 5B). In contrast, there was no significant correlation slow 3 ALFF in EVC and retardation (r = 0.42, P > 0.05). The inclusion or exclusion of GSR in preprocessing did not affect these correlation results (see Supplementary Fig. S3); this suggests a local-regional impact of neural variability in MT on retardation in behavior. Unlike local intra-regional ALFF, we did not observe significant correlation of the more global inter-regional FC of MT-MPFC with the retardation score, for both with (r = −0.054, P > 0.05) and without GSR (r = 0.14, P > 0.05) (shown in Supplementary Fig. S4). The difference between local intra-regional (ALFF in MT) and global inter-regional (MT-MPFC) signals is further supported by the fact that we neither obtained correlations of MT-MPFC rsFC and MT ALFF for the whole sample nor for MDD and HC alone (shown in Supplementary Tables S1 and S2).
Figure 5.

Relationships of neural variability (ALFF) in MT with retardation score. (A) Box plots of ALFF in slow 3 in MT with GSR (left) and retardation score (right), which can be seen that none of them have outliers. (B) ALFF of slow 3 in MT is significantly correlated with HAMD retardation score.
Discussion
We investigated neuronal activity in a higher order occipital region, namely MT and how it relates to biochemical, psychophysical, and psychopathological changes in MDD. Our main findings are: (i) significantly higher neural variability (ALFF) in MT; (ii) neural variability (ALFF in MT) mediates the impact of molecular (GABA) on psychophysical performance (motion SI) in HC subjects (shown in Fig. 1), but no longer modulates their relationship in MDD (diagram shown in Fig. 3B right); (iii) decrease in MT’s global inter-regional FC to MPFC as “typical MDD region”; (iv) elevated neural variability in MT (ALFF) relates to specifically retardation in depressive behavior. In sum, we demonstrate multilevel changes in MT of MDD that provides further support for its eventual role as candidate biomarker.
In a first step, we, in healthy subjects, established relationship of MT neural variability to MT GABA and visual motion suppression (which is known to be mediated by MT (Tadin et al. 2003; Born and Bradley 2005; Schallmo et al. 2018). This yielded significant correlation of all three measures that allowed us to conduct a mediation model. Probing different models, we show that higher levels of GABA in MT lead to higher degrees of motion suppression, which is partially mediated by the level of neural variability in MT. This confirms our hypothesis, and provides direct connection of biochemical, neural, and psychophysical levels in healthy subjects. That is in line with recent findings (Schallmo et al. 2018), which also show relationship of GABA to vision motion performance (Schallmo et al. 2018; Song et al. 2021). At the same time, our findings extend these results by showing the key role of MT neural variability in mediating the effects of inhibitory GABA on motion suppression.
MDD subjects exhibit significantly elevated neural variability in MT. This is in accordance with recent findings showing altered neural activity in OC in general during both rest and task states (Zhang et al. 2014; Cui et al. 2016; Le et al. 2017; Northoff et al. 2018; Zhang et al. 2020). At the same time, our findings extend these observations by showing that specifically local-intra-regional neural variability is altered in MDD. This suggests that MT (and also EVC) exhibit intra-regional changes that are present already during the rest state. The local truly intra-regional nature of these changes is further supported by the fact that they remained unaffected by the presence or absence of GSR.
Is the elevated ALFF of MT in MDD a primary impairment or, alternatively, a compensatory mechanism of a yet unclear deficit? In case of compensation, one would expect to observe enhanced cognitive performance (Cabeza et al. 2018; Wang et al. 2019). This stands in contrast to our psychophysical results where the threshold of small stimuli of MDD (5.11 ± 1.28 ms, n = 17) is longer (rather than shorter) and thus impaired (rather than enhanced) than in HC (4.51 ± 0.73 ms, n = 31; almost significant (P = 0.06)). Albeit indirectly, this suggests that the abnormal intra-regional ALFF increase in MDD may be indicative of a primary impairment in MT rather than a consequence of a compensatory mechanism.
Our results tentatively suggest that abnormal increase of ALFF in MT may be driven by reduced GABA in the same region (Fig. 3A). This hints upon a deficit in neural inhibition in the neural activity of MT which, as we suppose, is manifest in abnormal increase of its neural variability (ALFF). The importance of deficient GABA in MT is further supported by the fact that its modulatory impact on psychophysical performance (motion SI) is decoupled from elevated ALFF in MT. Reduced gaba-ergic inhibition may lead to decreased suppression of redundant information in visual perception as manifest in the here observed longer duration time of small stimuli and decreased motion suppression (SI) in MDD. Whether this could also be the neural and psychophysical mechanism of abnormal perception in MDD in terms of wearing “gray colored glasses” (Fitzgerald 2013) remains to be investigated in the future.
The effects of altered MT extend beyond the OC. Taking MT as seed regions, MDD subjects show significantly lower FC of MT with MPFC. This was observed only when conducting no GSR whereas it disappeared when including GSR. That suggests a more global source of MT-MPFC FC changes rather than a primarily local-regional source (in either MPFC or MT alone independent of each other); if, in contrast, there were a primarily local-regional source, one would have expected no difference in MT-MPFC FC with and without GSR. Together, we may want to distinguish local-regional and global-inter-regional changes of MT, that is, neural variability and FC, with both being altered in MDD. This lends further support to the importance of global activity changes impacting the relationship of sensory input regions like MT with DMN regions like MPFC in MDD (Scalabrini et al. 2020).
Finally, the importance of MT for MDD is further supported by our psychopathological findings. The degree of neural variability in MT is related to specifically retardation in behavior: the more neural variability in MT, the more retardation in behavior. This suggests that the speed of behavior, i.e., retardation, is related to the degree of change on the neural level, that is, neuronal speed (see also in the reference Northoff et al. (2018)). However, whether it is really the speed of neural activity in MT that mediates its relationship with speed on the behavioral level, that is, retardation, remains to be explored in the future. If so, motion including speed would be shared by neural (ALFF), psychophysical–perceptual (motion suppression) and psychopathological (psychomotor retardation) levels thus serving as its “common currency” (Kolvoort et al. 2020; Northoff et al. 2020) as basis of “spatiotemporal psychopathology” (Northoff 2016, 2018; Northoff and Stanghellini 2016).
Limitations
We admit that the main limitation of the present study is the possible confounding effects of medication. Indeed, almost all of the acute MDD patients in our sample were taking medications, including mood stabilizers, antipsychotics, antidepressants, and benzodiazepines, which may possibly influence results. Following recent suggestions and standards, we examined the potential impact of the psychotropic medication load—the number and dosage of different medications, we then used the codes 0, 1, 2, and 3 to indicate no medication, and dose-equivalents below, equal, or above the mean effective daily dose, respectively (Davis and Chen 2004). We generated a composite measure of the medication load by summing all individual medication codes for each category and each individual MDD patient. We investigated the potential impact of medications on MRS and imaging data by correlating the resulting pharmacological load with GABA concentration, ALFF in SFB and slow 3 in MT, and FC between left MT and bilateral BA10. The medication load did not correlate with this measure in antidepressants, antipsychotics, mood stabilizers, and benzodiazepines (P > 0.05).
Then, to further control for an eventual effect of pharmacotherapy on the GABA concentration, ALFF in SFB and slow 3 in MT, and FC between left MT and bilateral BA10, we compared these variables by using a t test for each medication class (mood stabilizers, antidepressants, benzodiazepines, and antipsychotics), between those patients who were in treatment with the respective drug and those who were not. We found no differences between patients who were in treatment with mood stabilizers (n = 5) and patients who were not (n = 13) (P > 0.05), between patients who were in treatment with antidepressants (n = 16) and patients who were not (n = 2) (P > 0.05), between patients who were in treatment with benzodiazepines (n = 9) and patients who were not (n = 9) (P > 0.05), as well as between patients who were in treatment with antipsychotics (n = 13) and patients who were not (n = 5) (P > 0.05).
Yet another limiting factor is the rather low subject number. However, all subjects underwent the multilevel investigation: from molecular to behavior. We combined 7 T MRS with psychophysical testing, which allowed us to link occipital (especially the MT) GABA to visual perception and psychopathological symptoms in all subjects both healthy and MDD. Nevertheless, future larger scale MDD studies with non-MDD psychiatric comparison groups are necessary to support the utility of higher-order OC, that is, MT as potential biomarker target of acute MDD.
Conclusion
Candidates for biomarkers of MDD should span across different levels by establishing, for instance, relation of neuronal to biochemical, psychophysical, and psychopathological measures as proposed in the RDoC classification (Insel et al. 2010; Cuthbert and Insel 2013). The present study takes a first step in this direction by conducting multilevel investigation of a particular subregion in OC, namely MT. MDD shows elevation of neural variability in MT, which disrupts its modulation of the relationship between biochemical (GABA) and psychophysical (motion suppression) levels. Moreover, MT is abnormally connected to MPFC, which can be traced to a more global rather than local-regional source. Finally, we show that elevated neural variability in MT is related to specifically retardation in behavior. Together, our findings link biochemical, neuronal, psychophysical, and psychopathological levels in MDD with respect to MT. This provides further support for MT being a strong candidate biomarker of MDD, which also opens novel therapeutic options as MT is an easily accessible target for stimulation (Zhang et al. 2020).
Supplementary Material
Contributor Information
Dong-Yu Liu, Affiliated Mental Health Center & Hangzhou Seventh People's Hospital, Interdisciplinary Institute of Neuroscience and Technology, Zhejiang University School of Medicine, Hangzhou, 310013, China; Key Laboratory of Biomedical Engineering of Ministry of Education, Qiushi Academy for Advanced Studies, College of Biomedical Engineering and Instrument Science, Zhejiang University, Hangzhou 310027, China.
Xuan Ju, Affiliated Mental Health Center & Hangzhou Seventh People's Hospital, Interdisciplinary Institute of Neuroscience and Technology, Zhejiang University School of Medicine, Hangzhou, 310013, China.
Yuan Gao, Affiliated Mental Health Center & Hangzhou Seventh People's Hospital, Interdisciplinary Institute of Neuroscience and Technology, Zhejiang University School of Medicine, Hangzhou, 310013, China.
Jin-Fang Han, Affiliated Mental Health Center & Hangzhou Seventh People's Hospital, Interdisciplinary Institute of Neuroscience and Technology, Zhejiang University School of Medicine, Hangzhou, 310013, China.
Zhe Li, Affiliated Mental Health Center & Hangzhou Seventh People's Hospital, Interdisciplinary Institute of Neuroscience and Technology, Zhejiang University School of Medicine, Hangzhou, 310013, China; Key Laboratory of Biomedical Engineering of Ministry of Education, Qiushi Academy for Advanced Studies, College of Biomedical Engineering and Instrument Science, Zhejiang University, Hangzhou 310027, China.
Xi-Wen Hu, Affiliated Mental Health Center & Hangzhou Seventh People's Hospital, Interdisciplinary Institute of Neuroscience and Technology, Zhejiang University School of Medicine, Hangzhou, 310013, China.
Zhong-Lin Tan, Affiliated Mental Health Center & Hangzhou Seventh People's Hospital, Interdisciplinary Institute of Neuroscience and Technology, Zhejiang University School of Medicine, Hangzhou, 310013, China.
Georg Northoff, Affiliated Mental Health Center & Hangzhou Seventh People's Hospital, Interdisciplinary Institute of Neuroscience and Technology, Zhejiang University School of Medicine, Hangzhou, 310013, China; University of Ottawa Institute of Mental Health Research, University of Ottawa; Ottawa, ON, K1Z 7K4, Canada.
Xue Mei Song, Affiliated Mental Health Center & Hangzhou Seventh People's Hospital, Interdisciplinary Institute of Neuroscience and Technology, Zhejiang University School of Medicine, Hangzhou, 310013, China; Key Laboratory of Biomedical Engineering of Ministry of Education, Qiushi Academy for Advanced Studies, College of Biomedical Engineering and Instrument Science, Zhejiang University, Hangzhou 310027, China.
Funding
Ministry of Science and Technology of China; National Key R&D Program of China (2016YFC1306702) and from National Natural Science Foundation of China (Grants 81961128029, U20A20221); the Fundamental Research Funds for the Central Universities (2019XZZX003-20, 2020FZZX001-05); the Zhejiang Lab (2018EB0ZX01); and the key research and development program of Zhejiang Province (2020C03004). This work was supported by the Project for Hangzhou Medicine Discipline of Excellence and Key Project for Hangzhou Medical Disciplines. This work was also supported by the Michael Smith Foundation; EJLB-Canadian Institute of Health Research; Canada Research Chair; the Canada Institute of Health Research; the National Science Research Council; and Social Sciences and Humanities Research Council (to G.N.).
Notes
We thank Prof. Ruiliang Bai, Dost Ongur and Fei Du for guidance on the MRI experiment and data processing, thank Prof. Yong-Chun Cai for guiding the psychophysical test, thank Prof. Teng-Fei Wang for guiding the model analysis. We thank Zhejiang University 7 T Brain Imaging Research Center. We would like to thank all subjects for their enduring participation. Conflict of Interest: The authors report no financial interests or potential conflict of interest.
References
- Andrews-Hanna JR, Reidler JS, Sepulcre J, Poulin R, Buckner RL. 2010. Functional-anatomic fractionation of the brain's default network. Neuron. 65:550–562. [DOI] [PMC free article] [PubMed] [Google Scholar]
- Bhagwagar Z, Wylezinska M, Jezzard P, Evans J, Ashworth F, Sule A, Matthews PM, Cowen PJ. 2007. Reduction in occipital cortex gamma-aminobutyric acid concentrations in medication-free recovered unipolar depressed and bipolar subjects. Biol Psychiatry. 61:806–812. [DOI] [PubMed] [Google Scholar]
- Born RT, Bradley DC. 2005. Structure and function of visual area MT. Annu Rev Neurosci. 28:157–189. [DOI] [PubMed] [Google Scholar]
- Brainard DH. 1997. The psychophysics toolbox. Spat Vis. 10:433–436. [PubMed] [Google Scholar]
- Bubl E, Ludger T, Gondan M, Ebert D, Greenlee MW. 2009. Vision in depressive disorder. World J Biol Psychiatry. 10:377–384. [DOI] [PubMed] [Google Scholar]
- Buzsaki G, Draguhn A. 2004. Neuronal oscillations in cortical networks. Science. 304:1926–1929. [DOI] [PubMed] [Google Scholar]
- Cabeza R, Albert M, Belleville S, Craik FI, Duarte A, Grady CL, Lindenberger U, Nyberg L, Park DC. 2018. Maintenance, reserve and compensation: the cognitive neuroscience of healthy ageing. Nat Rev Neurosci. 19:701–710. [DOI] [PMC free article] [PubMed] [Google Scholar]
- Cavassila S, Deval S, Huegen C, van Ormondt D, Graveron-Demilly D. 2001. Cramer-Rao bounds: an evaluation tool for quantitation. NMR Biomed. 14:278–283. [DOI] [PubMed] [Google Scholar]
- Chen X, Fan X, Hu Y, Zuo C, Whitfield-Gabrieli S, Holt D, Gong Q, Yang Y, Pizzagalli DA, Du F, et al. 2019. Regional GABA concentrations modulate inter-network resting-state functional connectivity. Cereb Cortex. 29:1607–1618. [DOI] [PMC free article] [PubMed] [Google Scholar]
- Cui L, Gong X, Tang Y, Kong L, Miao C, Geng H, Ke X, Fei W. 2016. Relationship between the LHPP gene polymorphism and resting-state brain activity in major depressive disorder. Neural Plast. 2016:9162590. [DOI] [PMC free article] [PubMed] [Google Scholar]
- Cuthbert BN, Insel TR. 2013. Toward the future of psychiatric diagnosis: the seven pillars of RDoC. BMC Med. 11:126. [DOI] [PMC free article] [PubMed] [Google Scholar]
- Davis JM, Chen N. 2004. Dose response and dose equivalence of antipsychotics. J Clin Psychopharmacol. 24:192–208. [DOI] [PubMed] [Google Scholar]
- Dumoulin SO, Bittar RG, Kabani NJ, Baker CL Jr, Goualher GL, Pike GB, Evans AC. 2000. A new anatomical landmark for reliable identification of human area V5/MT: a quantitative analysis of sulcal patterning. Cereb Cortex. 10:454–463. [DOI] [PubMed] [Google Scholar]
- Ernst T, Kreis R, Ross BD. 1993. Absolute quantitation of water and metabolites in the human brain. 1. Compartments and water. J Magn Reson. 102:1. [Google Scholar]
- Fitzgerald PJ. 2013. Gray colored glasses: is major depression partially a sensory perceptual disorder? J Affect Disord. 151:418–422. [DOI] [PubMed] [Google Scholar]
- Frahm J, Bruhn H, Gyngell ML, Merboldt KD, Hanicke KD, Sauter R. 1989. Localized high-resolution proton NMR spectroscopy using stimulated echoes: initial applications to human brain in vivo. Magn Reson Med. 9:79–93. [DOI] [PubMed] [Google Scholar]
- Francesmonneris A,Pincus H,First M. 2013. Diagnostic and statistical manual of mental disorders. 5th ed. Washington, DC: American Psychiatric Association. [Google Scholar]
- Friston KJ, Williams S, Howard R, Frackowiak RS, Turner R. 1996. Movement-related effects in fMRI time-series. Magn Reson Med. 35:346–355. [DOI] [PubMed] [Google Scholar]
- Furey ML, Drevets WC, Hoffman EM, Frankel E, Speer AM, Zarate CA Jr. 2013. Potential of pretreatment neural activity in the visual cortex during emotional processing to predict treatment response to scopolamine in major depressive disorder. JAMA Psychiat. 70:280–290. [DOI] [PMC free article] [PubMed] [Google Scholar]
- Golomb JD, McDavitt JR, Ruf BM, Chen JR, Saricicek A, Maloney KH, Hu J, Chun MM, Bhagwagar Z. 2009. Enhanced visual motion perception in major depressive disorder. J Neurosci. 29:9072–9077. [DOI] [PMC free article] [PubMed] [Google Scholar]
- Gruetter R. 1993. Automatic, localized in vivo adjustment of all first- and second-order shim coils. Magn Reson Med. 29:804–811. [DOI] [PubMed] [Google Scholar]
- Huang Z, Zhang J, Wu J, Liu X, Xu J, Zhang J, Qin P, Rui D, Zhong Y, Ying M. 2018. Disrupted neural variability during propofol-induced sedation and unconsciousness. Hum Brain Mapp. 39:4533–4544. [DOI] [PMC free article] [PubMed] [Google Scholar]
- Huk AC, Dougherty RF, Heeger DJ. 2002. Retinotopy and functional subdivision of human areas MT and MST. J Neurosci. 22:7195–7205. [DOI] [PMC free article] [PubMed] [Google Scholar]
- Insel T, Cuthbert B, Garvey M, Heinssen R, Pine DS, Quinn K, Sanislow C, Wang P. 2010. Research domain criteria (RDoC): toward a new classification framework fro research on mental disorders. Am J Psychiatry. 167:748–751. [DOI] [PubMed] [Google Scholar]
- Jacobs RH, Barba A, Gowins JR, Klumpp H, Jenkins LM, Mickey BJ. 2016. Decoupling of the amygdala to other salience network regions in adolescent-onset recurrent major depressive disorder. Psychol Med. 46:1055–1067. [DOI] [PMC free article] [PubMed] [Google Scholar]
- Kaiser RH, Andrews-Hanna JR, Wager TD, Pizzagalli DA. 2015. Large- scale network dysfunction in major depressive disorder: a meta- analysis of resting-state functional connectivity. JAMA Psychiat. 72:603–611. [DOI] [PMC free article] [PubMed] [Google Scholar]
- Kolvoort IR, Wainio-Theberge S, Wolff A, Northoff G. 2020. Temporal integration as "common currency" of brain and self scale-free activity in resting-state EEG correlates with temporal delay effects on self-relatedness. Hum Brain Mapp. 41:4355–4374. [DOI] [PMC free article] [PubMed] [Google Scholar]
- Le TM, Borghi JA, Kujawa AJ, Klein DN, Leung HC. 2017. Alterations in visual cortical activation and connectivity with prefrontal cortex during working memory updating in major depressive disorder. NeuroImage Clin. 14:43–53. [DOI] [PMC free article] [PubMed] [Google Scholar]
- Malikovic A, Amunts K, Schleicher A, Mohlberg H, Zilles K. 2007. Cytoarchitectonic analysis of the human extrastriate cortex in the region of V5/MT+: a pobabilistic, stereotaxic map of area hOc5. Cereb Cortex. 17:562–574. [DOI] [PubMed] [Google Scholar]
- Marjanska M, Auerbach EJ, Valabregur R, Van de Moortele P-F, Adriany G, Garwood M. 2012. Localized 1H NMR spectroscopy in different regions of human brain in vivo at 7 T: T2 relaxation times and concentrations of cerebral metabolites. NMR Biomed. 25:332–339. [DOI] [PMC free article] [PubMed] [Google Scholar]
- Northoff G. 2016. How do resting state changes in depression translate into psychopathological symptoms? From ‘spatiotemporal correspondence’ to ‘spatiotemporal psychopathology’. Curr Opin Psychiatry. 29:18–24. [DOI] [PubMed] [Google Scholar]
- Northoff G, Stanghellini G. 2016. How to link brain and experience? Spatiotemporal psychopathology of the lived body. Front Hum Neurosci. 10:172. [DOI] [PMC free article] [PubMed] [Google Scholar]
- Northoff G, Magioncalda P, Martino M, Lee H-C, Tseng Y-C, Lane T. 2018. Too fast or too slow? Time and neuronal variability in bipolar disorder—a combined theoretical and empirical investigation. Schizophr Bull. 44:54–64. [DOI] [PMC free article] [PubMed] [Google Scholar]
- Northoff G. 2018. The brain's spontaneous activity and its psychopathological symptoms-"spatiotemporal binding and integration". Prog Neuropsychopharmacol Biol Psychiatry. 80:81–90. [DOI] [PubMed] [Google Scholar]
- Northoff G, Wainio-Thebergeb S, Eversc K. 2020. Is temporo-spatial dynamics the “common currency” of brain and mind? In quest of “spatiotemporal neuroscience”. Phys Life Rev. 33:34–54. [DOI] [PubMed] [Google Scholar]
- Norton DJ, McBain RK, Pizzagalli DA, Cronin-Golomb A, Chen Y. 2016. Dysregulation of visual motion inhibition in major depression. Psychiatry Res. 240:214–221. [DOI] [PMC free article] [PubMed] [Google Scholar]
- Provencher SW. 1993. Estimation of metabolite concentrations from localized in vivo proton NMR spectra. Magn Reson Med. 30:672–679. [DOI] [PubMed] [Google Scholar]
- Provencher SW. 2001. Automatic quantitation of localized in vivo 1H spectra with LCModel. NMR Biomed. 14:260–264. [DOI] [PubMed] [Google Scholar]
- Romanczuk-Seiferth N, Pöhland L, Mohnke S, Garbusow M, Erk S, Haddad L, Grimm O, Tost H, Meyer-Lindenberg A, Walter H, et al. 2014. Larger amygdala volume in first-degree relatives of patients with major depression. NeuroImage Clin. 5:62–68. [DOI] [PMC free article] [PubMed] [Google Scholar]
- Sanacora G, Mason GF, Rothman DL, Behar KL, Hyder F, Petroff OA, Rerman RM, Charney DS, Krystal JH. 1999. Reduced cortical gamma-aminobutyric acid levels in depressed patients determined by proton magnetic resonance spectroscopy. Arch Gen Psychiatry. 56:1043–1047. [DOI] [PubMed] [Google Scholar]
- Sanacora G, Gueorguieva R, Epperson CN, Wu YT, Appel M, Rothman DL, Krystal JH, Mason GF. 2004. Subtype-specific alterations of gamma-aminobutyric acid and glutamate in patients with major depression. Arch Gen Psychiatry. 61:705–713. [DOI] [PubMed] [Google Scholar]
- Scalabrini A, Vai B, Poletti S, Damiani S, Mucci C, Colombo C, Zanardi R, Benedetti F, Northoff G. 2020. All roads lead to the default-mode network-global source of DMN abnormalities in major depressive disorder. Neuropsychopharmacology. 45:2058–2069. [DOI] [PMC free article] [PubMed] [Google Scholar]
- Salmela V, Socada L, Soderholm J, Heikkila R, Lahti J, Ekelund J, Isomets E. 2021. Reduced visual contrast suppression during major depressive episodes. J Psychiatry Neurosci. 46:222–231. [DOI] [PMC free article] [PubMed] [Google Scholar]
- Schallmo MP, Kale AM, Millin R, Flevaris AV, Brkanac Z, Edden RA, Bernier RA, Murray SO. 2018. Suppression and facilitation of human neural responses. Elife. 7:e30334. [DOI] [PMC free article] [PubMed] [Google Scholar]
- Sheehan DV, Lecrubier Y, Sheehan KH, Amorim P, Janavs J, Weiller E, Hergueta T, Baker R, Dunbar GC. 1998. The mini-international neuropsychiatric interview (M.I.N.I.): the development and validation of a structured diagnostic psychiatric interview for DSM-IV and ICD-10. J Clin Psychiatry. 59(Suppl 2):22, quiz 34-57–quiz 34-33. [PubMed] [Google Scholar]
- Sheline YI, Barch DM, Price JL, Rundle MM, Raichle ME. 2009. The default mode network and self-referential processes in depression. Proc Natl Acad Sci U S A. 106:1942–1947. [DOI] [PMC free article] [PubMed] [Google Scholar]
- Song XM, Hu XW, Li Z, Gao Y, Ju X, Liu DY, Wang Q, Xue C, Cai Y, Bai R, et al. 2021. Reduction of higher-order occipital GABA and impaired visual perception in acute major depressive disorder. Mol Psychiatry. 4:1. [DOI] [PMC free article] [PubMed] [Google Scholar]
- Song Y, Shen X, Mu X, Mao N, Wang B. 2020. A study on BOLD fMRI of the brain basic activities of MDD and the first-degree relatives. Int J Psychiatry Clin Pract. 24:236–244. [DOI] [PubMed] [Google Scholar]
- Tadin D, Lappin JS, Gilroy LA, Blake R. 2003. Perceptual consequences of centre-surround antagonism in visual motion processing. Nature. 424:312–315. [DOI] [PubMed] [Google Scholar]
- Tadin D, Silvanto J, Pascual-Leone A, Battelli L. 2011. Improved motion perception and impaired spatial suppression following disruption of cortical Aaea MT/V5. J Neurosci. 31:1279–1283. [DOI] [PMC free article] [PubMed] [Google Scholar]
- Tahmasian M, Knight DC, Manoliu A, Schwerthoffer D, Scherr M, Meng C, Shao J, Peter H, Doll A, Khazaie H, et al. 2013. Aberrant intrinsic connectivity of hippocampus and amygdala overlap in the fronto-insular and dorsomedial-prefrontal cortex in major depressive disorder. Front Hum Neurosci. 7:639. [DOI] [PMC free article] [PubMed] [Google Scholar]
- Tang Y, Kong L, Wu F, Womer F, Jiang W, Cao Y, Ren L, Wang J, Fan G, Blumberg HP. 2013. Decreased functional connectivity between the amygdala and the left ventral prefrontal cortex in treatment-naive patients with major depressive disorder: a resting-state functional magnetic resonance imaging study. Psychol Med. 43:1921–1927. [DOI] [PubMed] [Google Scholar]
- Tao H, Guo S, Ge T, Kendrick KM, Xue Z, Liu Z, Feng J. 2011. Depression uncouples brain hate circuit. Mol Psychiatry. 18:101–111. [DOI] [PMC free article] [PubMed] [Google Scholar]
- Tká I, Staruk Z, Choi I, Gruetter R. 1999. In vivo 1H NMR spectroscopy of rat brain at 1 ms echo time. Magn Reson Med. 41:649–656. [DOI] [PubMed] [Google Scholar]
- Wang P, Li R, Liu B, Wang C, Huang Z, Dai R, Song B, Yuan X, Yu J, Li J. 2019. Altered static and temporal dynamic amplitude of low-frequency fluctuations in the background network during working memory states in mild cognitive impairment. Front Aging Neurosci. 11:152. [DOI] [PMC free article] [PubMed] [Google Scholar]
- Wengler K, Goldberg AT, Chahine G, Horga G. 2020. Distinct hierarchical alterations of intrinsic neural timescales account for different manifestations of psychosis. Elife. 9:e56151. [DOI] [PMC free article] [PubMed] [Google Scholar]
- Womer FY, Tang Y, Wang J, Blumberg HB, Liu J, Jiang W, Xu K, Wang F, Fan G, Ren L. 2014. Alterations in amplitude of low frequency fluctuation in treatment-naive major depressive disorder measured with resting-state fMRI. Hum Brain Mapp. 35:4979–4988. [DOI] [PMC free article] [PubMed] [Google Scholar]
- Yan CG, Wang XD, Zuo XN, Zang YF. 2016. DPABI: data processing & analysis for (resting-state) brain imaging. Neuroinformatics. 14:339–351. [DOI] [PubMed] [Google Scholar]
- Yin L, Xu X, Chen G, Mehta ND, Haroon E, Miller AH, Luo Y, Li Z, Felger JC. 2019. Inflammation and decreased functional connectivity in a widely-distributed network in depression: centralized effects in the ventral medial prefrontal cortex. Brain Behav Immun. 80:657–666. [DOI] [PMC free article] [PubMed] [Google Scholar]
- Zang YF, He Y, Zhu CZ, Cao QJ, Sui MQ, Liang M, Tian LX, Jiang TZ, Wang YF. 2007. Altered baseline brain activity in children with ADHD revealed by resting-state functional MRI. Brain Dev. 29:83–91. [DOI] [PubMed] [Google Scholar]
- Zeng LL, Shen H, Liu L, Wang L, Li B, Fang P, Zhou Z, Li Y, Hu D. 2012. Identifying major depression using whole-brain functional connectivity: a multivariate pattern analysis. Brain. 135:1498–1507. [DOI] [PubMed] [Google Scholar]
- Zhang X, Zhu X, Xiang W, Zhu X, Zhong M, Yi J, Rao H, Yao S. 2014. First-episode medication-naive major depressive disorder is associated with altered resting brain function in the affective network. PLoS One. 9:e85241. [DOI] [PMC free article] [PubMed] [Google Scholar]
- Zhang Z, Zhang H, Xie CM, Zhang M, Shi Y, Song R, Lu X, Zhang H, Li K, Wang B, et al. 2020. Task-related functional magnetic resonance imaging-based neuronavigation for the treatment of depression by individualized repetitive transcranial magnetic stimulation of the visual cortex. Sci China Life Sci. 64:96–106. [DOI] [PubMed] [Google Scholar]
- Zhang Y, Brady M, Smith S. 2001. Segmentation of brain MR images through a hidden Markov random field model and the expectation-maximization algorithm. IEEE Trans Med Imaging. 20:45–57. [DOI] [PubMed] [Google Scholar]
- Zomet A, Amiaz R, Grunhaus L, Polat U. 2008. Major depression affects perceptual filling-in. Biol Psychiatry. 64:667–671. [DOI] [PubMed] [Google Scholar]
- Zuo XN, Di Martino A, Kelly C, Shehzad ZE, Gee DG, Klein DF, Castellanos FX, Biswal BB, Milham MP. 2010. The oscillating brain: complex and reliable. Neuroimage. 49:1432–1445. [DOI] [PMC free article] [PubMed] [Google Scholar]
Associated Data
This section collects any data citations, data availability statements, or supplementary materials included in this article.