

Abstract
The goal of human-on-a-chip systems is to capture multi-organ complexity and predict the human response to compounds within physiologically relevant platforms. The generation and characterization of such systems is currently a focal point of research given the long-standing inadequacies of conventional techniques for predicting human outcome. Functional systems can measure and quantify key cellular mechanisms that correlate with the physiological status of a tissue, and can be used to evaluate therapeutic challenges utilizing many of the same endpoints used in animal experiments or clinical trials. Culturing multiple organ compartments in a platform creates a more physiologic environment (organ-organ communication). Here is reported a human 4-organ system composed of heart, liver, skeletal muscle and nervous system modules that maintains cellular viability and function over 28 days in serum-free conditions using a pumpless system. The integration of non-invasive electrical evaluation of neurons and cardiac cells and mechanical determination of cardiac and skeletal muscle contraction allows the monitoring of cellular function especially for chronic toxicity studies in vitro. The 28 day period is the minimum timeframe for animal studies to evaluate repeat dose toxicity. This technology could be a relevant alternative to animal testing by monitoring multi-organ function upon long term chemical exposure.
Keywords: multi-organ system, electrical function, mechanical function, serum-free, 28-day
Graphical Abstract
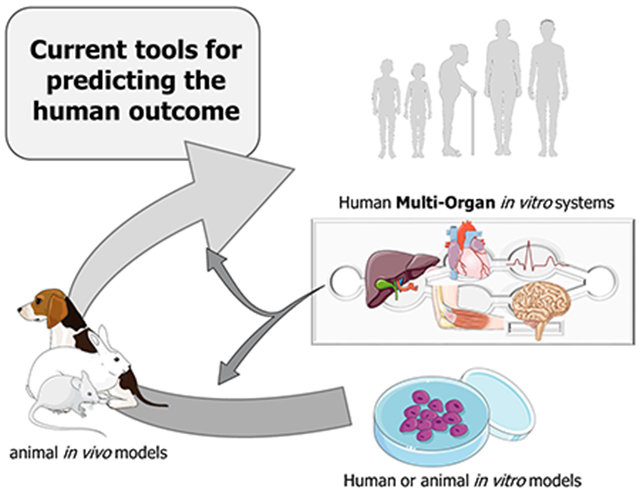
Human multi-organ in vitro platforms are designed to reproduce human in vivo complexity in vitro, reducing the need for animal experimentation and improving human prediction. Incorporating functional readouts into these systems enables closer approximation to clinical measurements, reducing the need for traditional biochemical metrics. Establishing a long-term multi-organ platform enables studying chronic drug administration, currently difficult for in vitro models.
1. Introduction
Efforts generating novel in vitro models to better predict a compounds toxicity in humans are increasing[1–4], as a consequence of poor prediction during toxicology evaluations with the current study models.[5–7] New in vitro models that incorporate features from in vivo models have great potential to improve human prediction by not relying on cellular viability and biomarker measurements.[1, 8–10] This new generation of in vitro models is referred to as Body-on-a-chip or Human-on-a-chip platforms. These systems are capable of reproducing organ-like functions and allowing organ-to-organ communication, as in vivo models do, by linking different organ representatives together under the same blood flow surrogate. By integrating BioMicroElectroMechanical systems (BioMEMs) with cellular constructs, organ function features, relative to in vivo, can be recreated and monitored. For instance organ functions such as; cardiac and neuronal electrical activity, cardiac and skeletal muscle contractile (mechanical) force, hepatic metabolism, skin, gastrointestinal and blood-brain barriers selective permeability have already been demonstrated in single organ devices.[10] Since these are in vitro systems, human cells can be used, conferring a higher fidelity to predict human outcomes, and reducing the reliance of animal use. This is especially true for chronic testing, which is needed to recapitulate the 28 day animal experiments needed to evaluate systemic toxicity of compounds.[11]
The toxicity and efficacy of new compounds are studied upon acute (single administration at high concentrations, over a short-term period) and chronic (repeated or continuous administration at lower concentrations, over an extended period) exposures. In vitro models are mostly used for the mechanism of action validation (efficacy) and acute toxicity screening phase. While for the chronic toxicity and PKPD studies, toxicologists still rely primarily on animal in vivo models, due to the limitations of the currently used in vitro models for long-term evaluation. One of the reasons for this is that current in vitro models lack complexity (organ-organ communication), have a short half-life and their outcomes are difficult to extrapolate to human organ functions.[11] The generation of novel in vitro models that overcomes the above limitations, like body-on-a-chip platform, could reduce or replace the use of animal in vivo models for the long-term studies of toxicity and to develop PKPD models.
Several research groups, including ours, have developed different body-on-a-chip models that allowed the co-culture of different organ representatives for long-term cultures.[12–15] However, none have developed a platform that co-cultures four different human organ representatives, under serum-free conditions, flow driven by a pumpless system, and allowing non-invasive recording of the cellular function in real-time for 28 days. We have upgraded a previous body-on-a-chip model,[14] to introduce non-invasive functional recordings to monitor long-term organ function in real-time. The ability to now utilize non-invasive monitoring of electrical and mechanical functions directly brings human-on-a-chip system closer to emulating human response to administered compounds. Maintaining these systems for 28 days enables to study chronic toxicity of compounds in vitro with functional readouts more predictive of human function. This is especially true for the cosmetic industry, where the EU has banned the use of animals to evaluate toxicity of ingredients.
2. Design and fabrication of the multi-organ platform for functional non-invasive recordings
2.1. The microfluidic platform
A microfluidic platform was designed to culture up to five organ representatives, and to enable long-term culture based on a previous 4-organ system utilized for acute evaluations.[14] Modifications to reduce the size of the system, improve flow characteristics, and incorporate functional measurements for non-invasive monitoring of electrical and mechanical properties for long-term culture were introduced driven by computational fluid dynamic modeling. The housing was reduced in size by a factor of approximately two in both length and width, in order to minimize the device footprint and use less medium. The design and drawing were performed using Autodesk Inventor and translated to a laser cutter (Universal Laser Systems, Vienna, Austria, Versalaser PLS 75W laser cutter) to machine the parts. The new design incorporated laser cutting fabrication of the housing material (poly(methyl methacrylate), instead of polycarbonate) and gaskets, to improve tolerances and decrease fabrication time. To enable non-invasive optical measurements the chamber geometry was defined by the gaskets, allowing for a smooth acrylic surface, necessary for enhanced optical properties. Laser cut holes allowed for the introduction of stainless steel wire electrodes into the cantilever (CL) compartments for broad field electrical stimulation. An opening toward the edge of the housing immediately over the contact pads of the custom multielectrode array (cMEA) was added to connect the cMEAs via an elastomeric connector and custom-designed printed circuit board to a commercial amplifier system for measurement of electrical activity inside the system (Figure 1). The individual chips were cultured separately until complete differentiation before insertion in the system.
Figure 1. Non-invasive technology to monitor cellular function in the 4-Organ system.
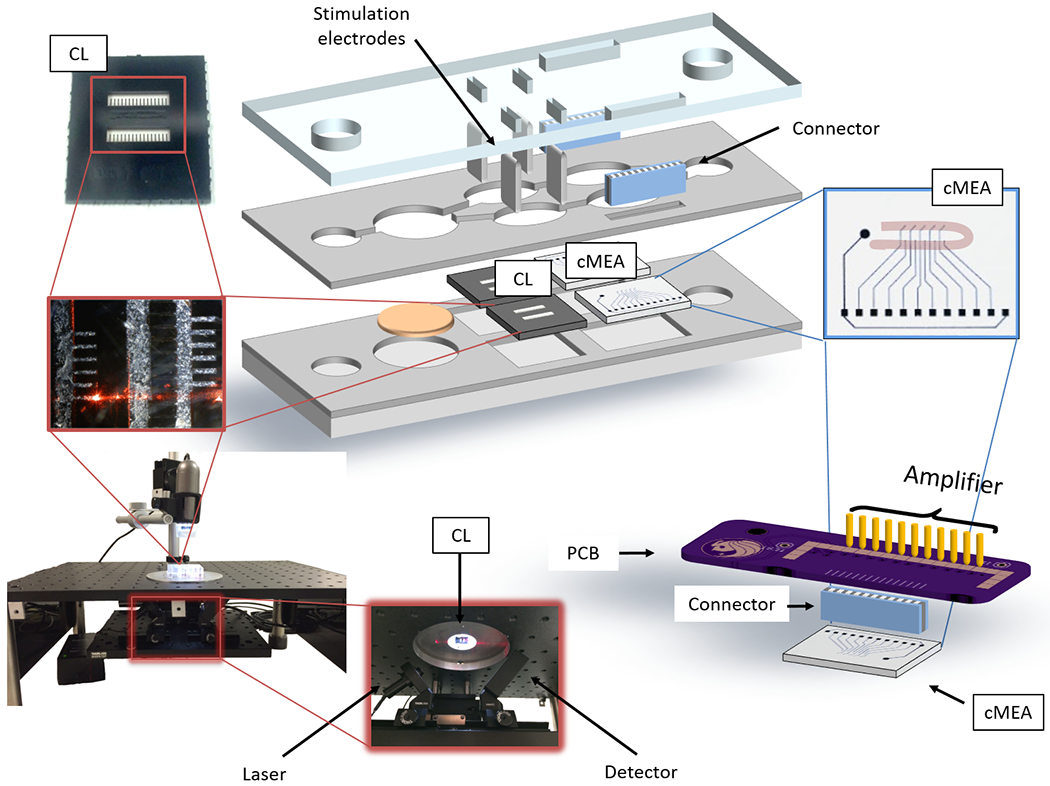
Schema of the microfluidic platform and the interface used to measure the mechanical and electrical functional activity. Electrical signals were recorded from the MEA chips (cMEA) utilizing a MultiChannel Systems MEA amplifier via a printed circuit board and an elastomeric connector (right). Cardiac and skeletal muscle contractile function was measured under stimulation with inserted electrodes from the cantilever chips (CL) using a laser-deflection based apparatus and a detector (left).
2.2. BioMEM chips
The incorporation of the non-invasive technology into the platform was done adapting the bioMEM chips and their detection methods to work inside the microfluidic systems. The design of the cMEA chip enabled non-invasive recordings of the platform using a commercial amplifier. [16–17] The reduced size (1.5 cm x 2 cm) of the chip allowed its incorporation in the microfluidic device for measurements of electrical activity from cardiomyocytes or motoneurons. Each chip included 10 electrodes of 80 μm in diameter separated by a 1000 μm pitch (electrode-electrode), distributed in 2 rows (Figure 1 and 2, chambers C and E). cMEA chip fabrication is detailed in the Experimental Section. To enable cell patterning, surfaces were modified with a PEG-terminated silane (cytophobic material) and later ablated in the region of the electrodes (with a U-pattern shape of 150 μm in width) to selectively remove the PEF to enable remodification of the ablated region. For the motoneuron cultures, a DETA (N-1(3-(trimethoxysilyl) propyl) diethylenetriamine) reaction was performed on the ablated PEG to modify the ablated regions with the cytophilic silane. For the cardiac patterns collagen was physisorbed from a solution. Contact angle measurements and X-ray photoelectron spectroscopy (XPS) were performed to confirm successful chemistry modifications. The methodologies for surface modification, photolithography, and XPS determination have been described previously.[16–18] Surfaces were sterilized in absolute ethanol prior to cell plating. Sterile rectangular PDMS chambers (50 mm2) were temporally adhered on the chip surface to restrict the cell adherence to the electrodes area and removed 1 day after plating.
Figure 2. Diagram of the pumpless microfluidic system with representative non-invasive mechanical and electrical functional readouts of the 4-Organ co-culture.
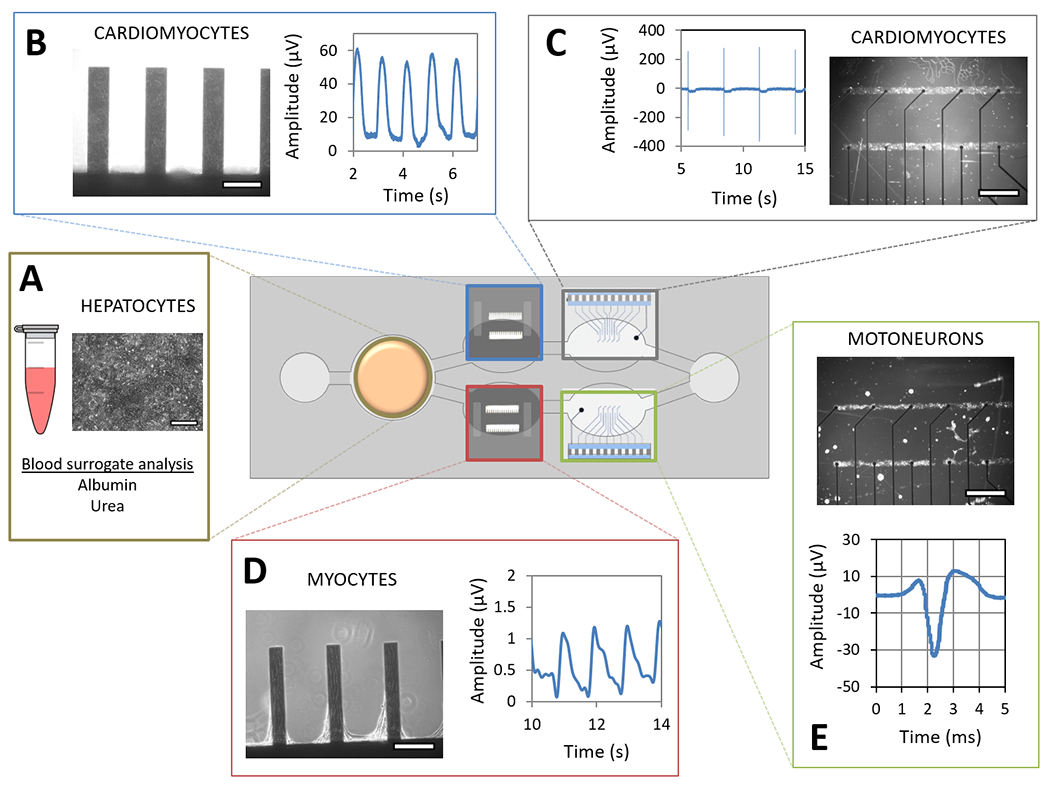
An acrylic housing holds PDMS gaskets that define the microfluidic pathway and the organ compartments along the path. Cells were cultured on their respective surfaces and compartments for 28 days. Representative images of hepatocytes on coverslip (compartment A (250 μm scale)), cardiomyocytes on cantilever (compartment B (250 μm scale)), and pattern on cMEA chips (compartment C (1000 μm scale)), skeletal muscle myotubes on cantilever chips (compartment D (250 μm scale)) and motoneurons pattern on cMEA chips (compartment E (1000 μm scale)) show each cell type in a different location in the system. Medium exchange was performed daily through both reservoirs, and the supernatant was used to quantify hepatic function (A). The contractile machinery of cardiomyocytes and myotubes was challenged on the cantilever chips using a laser-deflection based apparatus that recorded cantilever movement and a wave amplitude (B and D). The electrical signal of cardiomyocytes and motoneurons was recorded from the cMEAs connected to an amplifier via a printed circuit board and an elastomeric connector, translating current changes detected on the electrodes into field potential waveforms (C and E).
The cantilever chips were previously designed and validated by using the reflection of a laser beam as the detection system.[17, 19–21] To enable the non-invasive recording inside the housing, the microfluidic device was redesigned using an acrylic material to allow the laser to cross the microfluidic platform and illuminate the chip inside without diffraction. This required switching the milling done on the polycarbonate material to create the microfluidic path of the original system[14] to using a laser cut gasket to create the microfluidic path. Cantilever chips (exterior 2.25 cm2; interior 32 cantilevers [length 750 μm x width (100-muscle or 150-cardiac μm) x height 4 μm]) (Figure 1 and 2, chambers B and D), were designed and fabricated to include 2 rows of 16 cantilevers each for measuring contractile force (mechanical function) from differentiated myocytes (cardiomyocytes and skeletal muscle myotubes). Chips were fabricated from silicon-on-insulator (SOI) wafers using standard photolithographic and deep reactive ion etching techniques at the Cornell Nanoscale Science & Technology Facility (CNF) as previously described. [17, 19, 21–22] A 15 min oxygen plasma treatment was used to clean and to increase the hydrophilicity of the silicon cantilevers. Surfaces were then treated with a 0.1% (v/v) mixture of DETA in toluene at 65°C. After 30 min, the surfaces were rinsed three times with toluene and then oven dried at 110°C overnight. Contact angle measurements and XPS were performed to confirm successful deposition of the organosilane on the surface. An additional ablation step of the organosilane on the border of the cantilever was required for skeletal muscle chips in order to restrict the area for the myotubes to a 50 μm width in the center of the cantilever. The cantilever chips were stored in a desiccator until further use. Prior to the cell plating, the chips were sterilized in absolute ethanol and placed on top of a fluorinated silane glass coverslip to enhance the cantilevers cell coverage.[23] To restrict the plating area, double rectangular PDMS chambers (50 mm2 / row) were temporarily adhered on the top of the cantilever chips during cell plating. Both, the fluorinated silane coverslips and the PDMS chamber were removed 1 day after plating.
2.3. Organ constructs
2.3.1. Liver
The system utilized human primary hepatocytes, as a physiologic representative of liver. Cryopreserved human primary hepatocytes (Massachusetts General Hospital (MGH), Boston, MA, USA, lots Hw36 and Hw40) were thawed according to manufacturer’s instructions and plated on collagen coated glass coverslips in MGH medium (formulation defined in the Experimental Section). Coverslips (15 mm diameter round glass) were ethanol sterilized and coated with 60 μg/mL collagen type I (Thermo Fisher Scientific, Waltham, MA, USA, A1048301, diluted in acidified (0.02 M acetic acid) 1X PBS) for 30 min at 37°C in 24-well plates. After incubation, collagen was removed and human primary hepatocytes were plated at a density of 3 x 10⁵ cells/coverslip (1700 cells/mm2). Both cell suspension and collagen solution were applied as a bubble on the coverslip (200 μL for collagen and 100 μL for cell suspension), without spreading, to prevent cell migration from the coverslip to the plate well. Three to four hours after cell seeding, bubbles were covered with 500 μL of MGH medium, followed by complete medium renewal (500 μL) to ensure elimination of dead cells. Full media change was repeated the following day, and every other day subsequently.
2.3.2. Heart
Cryopreserved human iPSc derived cardiomyocytes (Cellular Dynamic International, CDI, Madison, WI, USA) were thawed according to manufacturer’s instructions. Patterned (ablated PEG) cMEA chips and DETA coated cantilever chips were sterilized with absolute ethanol and aligned to the PDMS chambers. Next, a 10 μg/mL (on the cMEAs) or 50 μg/mL (on the cantilevers) fibronectin solution (1X PBS) was incubated for 30 min at 37°C onto the surfaces and rinsed three times with 1X PBS. Cardiomyocytes were plated on cMEA (1000 cells/mm2) and cantilevers (2,222 cells/mm2) with HSL2 medium.[14, 16–17] The following day (1 Day in Vitro (DIV)) PDMS chambers and fluorinated surfaces were removed, cells were topped with medium (2 mL for cMEA and 1 mL for CL) and half-medium change was performed every three days.
2.3.3. Skeletal muscle
Cryopreserved human skeletal myoblasts were obtained from H. Vandenburg from Brown University, or from Lonza (Basel, Switzerland, lots 436427 and 436084), and were cultured as in[14] with minor modifications. Patterned DETA cantilever chips were sterilized with absolute ethanol and aligned in the PDMS chambers, then coated with 60 μg/mL collagen type I (same as above) for 30 min at 37°C and rinsed three times with 1X PBS. Human skeletal muscle progenitors were plated on cantilevers (300 cells/mm2) in hSKM Growth Medium (Lonza, Basel, Switzerland). The following day (1 DIV), PDMS chambers and fluorinated surfaces were removed and the medium was replaced with NBActive4 medium (differentiation medium) (Brain Bits, Springfield, IL, USA).
2.3.4. Nervous system
Cryopreserved human motoneurons were expanded and differentiated as previously described in the Hybrid Systems Laboratory (HSL).[24] Patterned cMEA chips with DETA backfilled on ablated PEG were sterilized with absolute ethanol and aligned to the PDMS chambers. Next, surfaces were coated with 3 μg/mL laminin (diluted in mQ water) for 30 min at 37°C, then laminin was replaced with 60 μg/mL collagen type I (same as for hepatocytes) for another 30 min at 37°C, and rinsed three times with 1X PBS before plating. Cells were plated (300 cells/mm2) in differentiation medium.[24] The following day (1 DIV), PDMS chambers were removed and the medium was fully replaced (2 mL).
2.4. Assembly and maintenance of the platform
Two days before the assembly, the housing systems were ethanol sterilized and air dried. The following day the systems were passivated with a 0.3 mg/mL BSA solution and the cells (cardiomyocytes 6 DIV, myotubes 4 DIV and motoneurons 4 DIV) were coated with a collagen hydrogel sheet (100 μL of 75 μg/mL neutralized Collagen type I), except for the hepatocytes (hepatocytes 6 DIV). On the day of assembly, the corresponding surfaces were transferred, with the cell side up, in the designated compartment of the system (Figure 2), and topped with HSL3 medium (290 mOsm/Kg).[14] The housing systems were secured and placed in petri dishes (150 mm diameter, 15 mm height) containing two smaller petri dishes (33 mm diameter) with sterile water to maintain humidity to reduce evaporation. The cells were cultured in the microfluidic devices on a rocker platform (VWR, Radnor, PA, USA, 12620-906-EACH) inside a humid atmosphere incubator at 37°C and 5% CO2 for up to 28 days. From the day of assembly and during the following month, the cells were fed with a reduced osmolarity HSL3 medium (sodium chloride concentration was adjusted to achieve a 250 mOsm/Kg osmolarity, measured with a Fiske™ 210 Micro-Sample Osmometer, Thermo Fisher Scientific, Waltham, MA, USA) to counteract osmotic variations within the microfluidic system due to a slight water evaporation with time. Medium exchange was done every 24 h, in which 30% of the total medium volume was exchanged through the reservoirs (Figure 1). With this adjustment the osmolarity in the housing systems was maintained at approximately 290 mOsm/Kg throughout the experiment. Cell morphology was monitored and images of each chamber were taken daily to track changes using an inverted phase contrast microscope (Carl Zeiss, Oberkochen, Germany, Axiovert 200) with a 10X objective and AxioVision AC software. Hepatic markers, urea and albumin, were monitored from the daily medium exchange. Cardiac, muscle and neuronal functions were measured non-invasively two times per week starting on day 4 after assembly. The multi-organ system was disassembled on day 28 followed by the cytochrome p450 enzymatic activity endpoint assays. The systems (housing and gaskets) and chips were soaked in a 1% (w/v) Tergazyme solution overnight. After, the systems were rinsed repetitively with MilliQ water and stored until next use, whereas the chips were sequentially rinsed with distilled water - reagent alcohol - acetone, and later treated with a 20 min O2 plasma protocol. Both were reused until any damage was observed.
3. Characterization and validation of the microfluidic platform
A microfluidic platform that promotes the co-culture of human hepatocytes, cardiomyocytes, skeletal muscle myotubes and motoneurons under the same serum-free blood surrogate and flow was designed to enable non-invasive function readouts of all organ representatives in real-time for a 28 day period (Figure 2). The recirculation of the medium in the platform was achieved by a pumpless gravity driven system controlled by a rocker platform located inside a cell culture incubator. The oscillatory rocking maintained adequate mixing of nutrients and enabled sufficient gas exchange through the reservoirs. Modeling of the flow dynamics in the system by mimicking the oscillatory profile from the sinusoidal rocking was used to keep the maximum shear stress below 0.05 dynes/cm2 at the bottom wall of each chamber where the cells were located as detailed in (Figure 3). A transient flow model driven by the gravity induced of the rocking system was developed with CFD (CFD, CFD-ACE+ (ESI Group, Paris, France)), as described previously in[23] to compute the shear stresses at the various organ chambers (Figure 3, A) and to confirm the flow profiles of each chamber. The sinusoidal rocking scheme was selected to operate at a tilt angle of 1 degree and 1 oscillation per minute, resulting in shear stress below 0.05 dynes/cm2 (within acceptable physiologic ranges[25–26]). This technology enabled a better control of the system design to achieve the flow conditions within acceptable ranges and to redesign certain aspects of the platform in order to achieve changes in flow parameters or mass transport.
Figure 3. Computational fluid dynamic simulation of the pumpless 4-Organ microfluidic system.
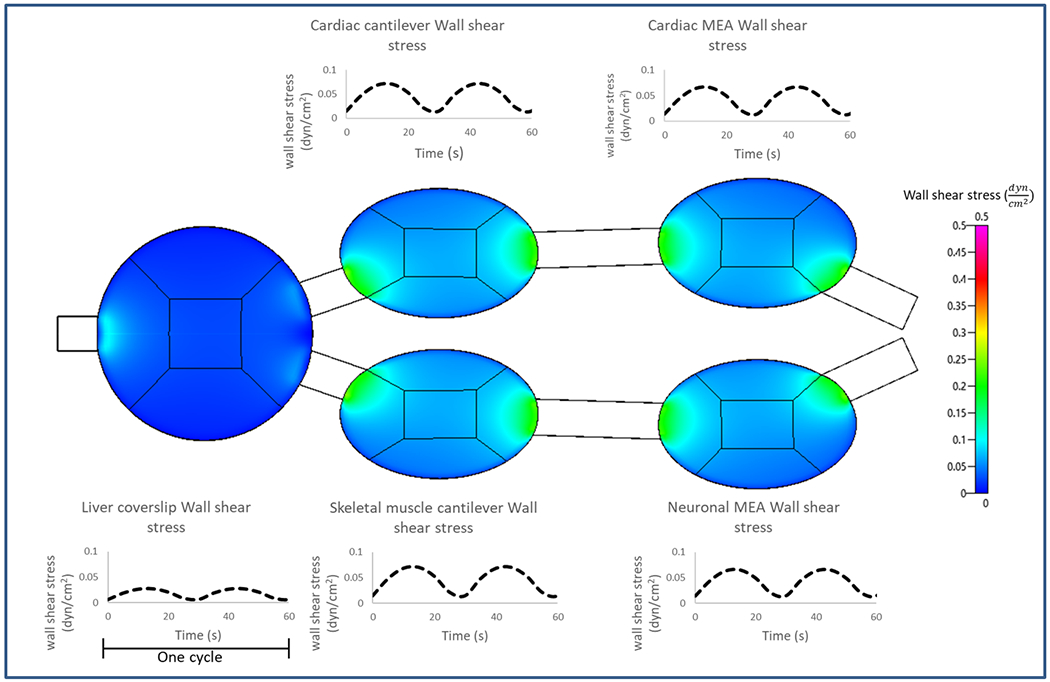
A transient model for gravity driven flow on the rocking system was developed onCFD-ACE+ (ESI Group, Paris, France) The shear stress profiles in the different organ chambers are shown as contour plots (spatially) and temporal plots over one flow cycle. The shear stresses for the liver chamber are computed over the entire chamber whereas only at the areas where the cells are patterned (center square) for the other organ chambers.
In the system, human primary hepatocytes on coverslips were located in the chamber closest to the left reservoir. Hepatic function was monitored overtime by quantifying albumin and urea produced daily from the exchanged medium (Figure 2, A). Human iPSc derived cardiomyocytes on cantilever and cMEA chips were located in the top chambers of the system. Cardiac contractile activity was measured by translating the amplitude of the cantilever displacement induced by the contractile cells into contractile force (Figure 2, B). Cardiac electrical activity was measured by electrodes that translated cardiac extracellular current differentials into field potentials (Figure 2, C). Human skeletal muscle myotubes on cantilever chips were located in the bottom left chamber of the system, and the contractile activity of muscle was measured as for the cardiomyocytes (Figure 2, D). Human motoneurons on cMEA chips were located in the bottom right chamber, and their electrical activity was measured by the same principle as for cardiac electrical activity (Figure 2, E).
3.1. The hepatic function
Hepatocytes maintained their specific morphology throughout the four-week timeframe (Figure 4, top). Over that period, hepatic albumin and urea production were quantified from the daily medium changed as previously described.[14] Urea and albumin production in the system were in range with other studies (urea[27–29] and albumin[27, 29–30]). These references were found in the literature from models that used human primary hepatocytes, however, values were artificially extrapolated to the full length of 28 days to introduce a reference in our plot (Figure 4, A–B, grey range). Although a gradual decline (less than a 30%, Figure 4, A: urea p < 0.05 and B: albumin p < 0.001) was observed for both biomarkers, the system was still sensitive to pharmacological modulation (data not included). The common medium was not an optimal medium for each organ separately, however it allowed function for all the organs in the multi-organ system. The albumin and urea production in the multi-organ system was improved in comparison to the static mono-culture controls, and hepatocytes significantly improve their outcome when they were in the presence of flow and other organ representatives in the platform. The cytochrome p450 enzymatic activity of the 1A1 (Figure 4, C) and 3A4 (Figure 4, D) isoforms was measured at endpoints, indicating that after the 28-day period in the multi-organ platform, hepatocytes maintained similar p450 enzymatic levels compared to static and flow mono-culture controls when evaluated at each 7 day timepoint (1A1 p > 0.05 and 3A4 p > 0.05). Assessing the enzymatic activity non-invasively over time in the 4-organ platform could have been done as well by measuring drug metabolism (prodrug and metabolite concentrations) from the daily exchanged medium.
Figure 4. Long-term hepatic characterization of the 4-Organ system under serum-free and flow conditions using non-invasive measurements.
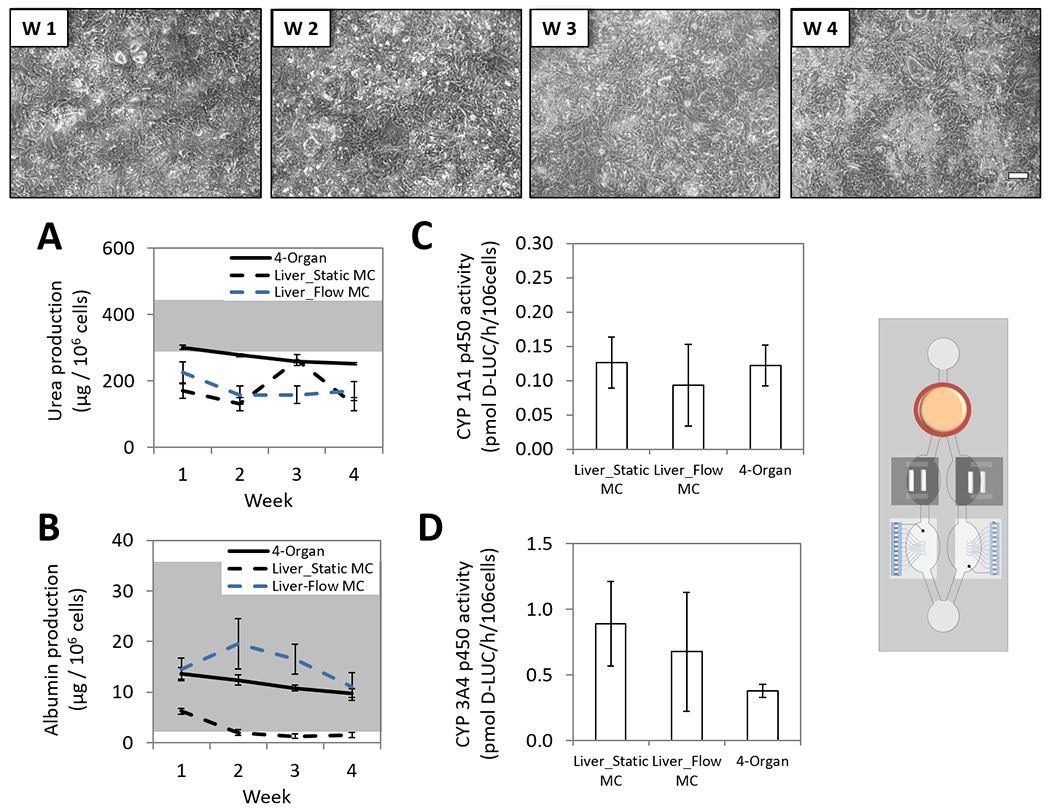
Human primary hepatocytes were co-culture in the 4-Organs system (chamber A) under a serum-free medium (HSL3) and flow for up to 28 days. Weekly morphology images of hepatocytes in the system demonstrate good morphology (top). Hepatic urea (p<0.001) and albumin (p<0.05) daily production in the 4-Organ system is plotted as weekly averages along with a range (grey fraction) of previous reported literature values using human primary hepatocytes (urea[27–29] and albumin[27, 29–30]) (A-B). Hepatic cytochrome p450 1A1 (p>0.05) and 3A4 (p>0.05) activities in the 4-Organ system were evaluated at the endpoint (C-D). All functions were compared to hepatocytes in mono-culture (static or flow), confirming that hepatic function in the 4-Organ system is preserved compared to the mono-culture conditions. (100 μm scale).
3.2. The cardiac function
The platform design enabled the separate monitoring of the electrical and the contractile (mechanical) components of cardiac function. In chamber C, cardiomyocytes were cultured on cMEA chips and in chamber B on cantilever chips (Figure 2). The morphology of the cells and the patterns were maintained throughout the 28 days (Figures 5 and 6, top). Electrical activity was measured non-invasively by connecting the cMEA chips (located inside the microfluidic system) to a MEA amplifier (located outside of the microfluidic system) through a ZEBRA® elastomer connector (FujiPoly, Carteret, NJ, USA) and a custom printed circuit board (Figure 1). Spontaneous electrical activity was recorded (during 20 s) from pattern cardiomyocytes with a MC_Rack amplifier (Multichannel Systems, Reutlingen, BW, Germany). Cardiomyocytes were also electrically stimulated using an STG 1002 stimulator (Multichannel Systems, Reutlingen, BW, Germany), with 200 μs bipolar pulses (600-1200 mV) and increasing frequencies (0.25 Hz to 4 Hz in 0.25 Hz increments) (100 s recording). The electrical stimulation establishes a pacemaker (electrode) that can modulate the rate of action potential frequency and conduction along the cardiomyocyte syncytium, allowing the study of conduction velocity and minimum interspike interval (mISI, a QT-interval analog) under controlled conditions as previously described by our group.[16–17] Data analysis was performed using Clampfit 10.3 (Molecular Devices, San Jose, CA, USA) after converting files from .mcd to .abf using the MC_DataTool (Multichannel Systems, Reutlingen, BW, Germany) and parameters were plotted as weekly averages of daily function. Beat frequency (Figure 5, A), conduction velocity (Figure 5, B) and QT-interval (Figure 5, C) were stable for over a month utilizing either spontaneous or stimulated activity. The mISI period increased during the last week of the culture (35 %, p<0.05) (Figure 5, D), however, it did not correlate with the manual measurement of the QT-interval in the field potential waveform (Figure 5, C). The mISI parameter is measured under stimulated conditions and relies on conduction properties. Although the measurements of cardiac conduction in the system show no significant differences with time (spontaneous conduction velocity p > 0.05 and stimulated conduction velocity p > 0.05), a reduction could perhaps be influencing the mISI parameter. Authors hypothesize that a slight change in the conduction of the cardiomyocyte patterns, perhaps due to an increase in the fibroblast to cardiomyocyte ratio over time, could have been detected earlier using the mISI parameter than with the conduction velocity measurement.
Figure 5. Long-term cardiac electrical characterization of the 4-Organ system under serum-free and flow conditions using non-invasive measurements.
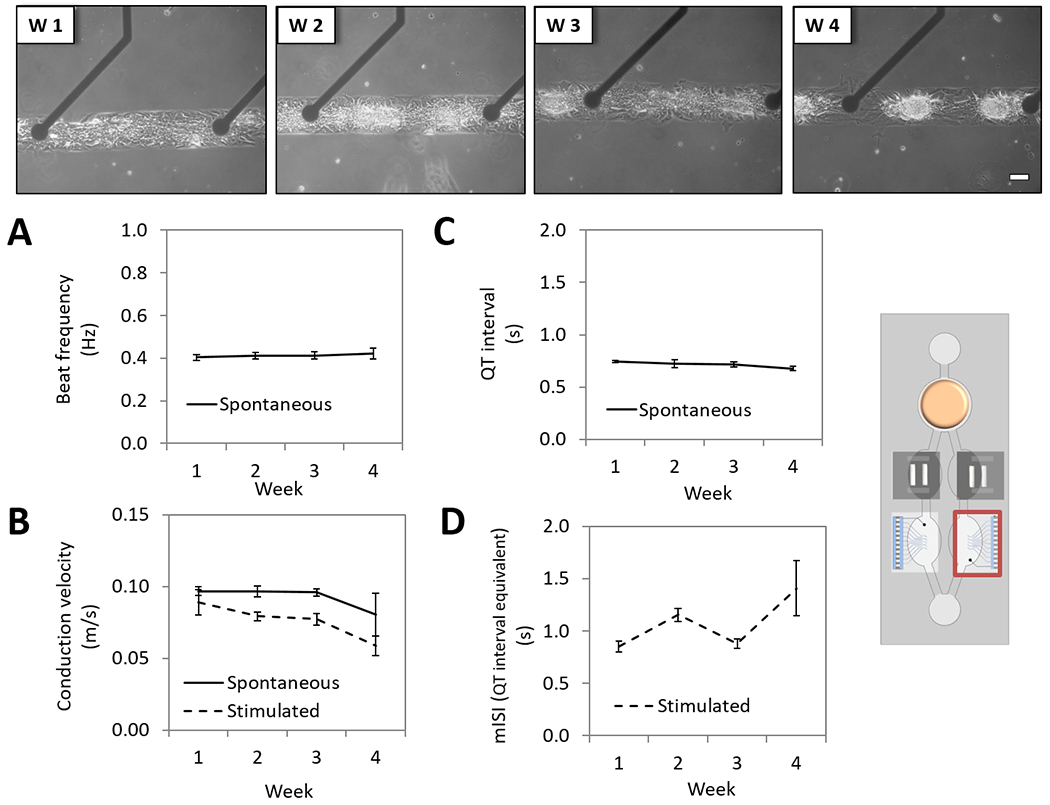
Human iPSc derived cardiomyocytes pattern on custom MEA chips (chamber C) were co-culture in the 4-Organs system under a serum-free medium (HSL3) and flow for up to 28 days. Weekly morphology images of pattern cardiomyocytes on cMEA chip in the system demonstrate good morphology and stable pattern (top). Cardiac electrical parameters studied under spontaneous or stimulated conditions showed stable function over 28 days; beat frequency (p>0.05) (A), conduction velocity (spontaneous p>0.05, stimulated p>0.05) (B) and QT-interval (p>0.05), except for the mISI (p<0.001) (D). (100 μm scale).
Figure 6. Long-term cardiac contractile characterization of the 4-Organ system under serum-free and flow conditions using non-invasive measurements.
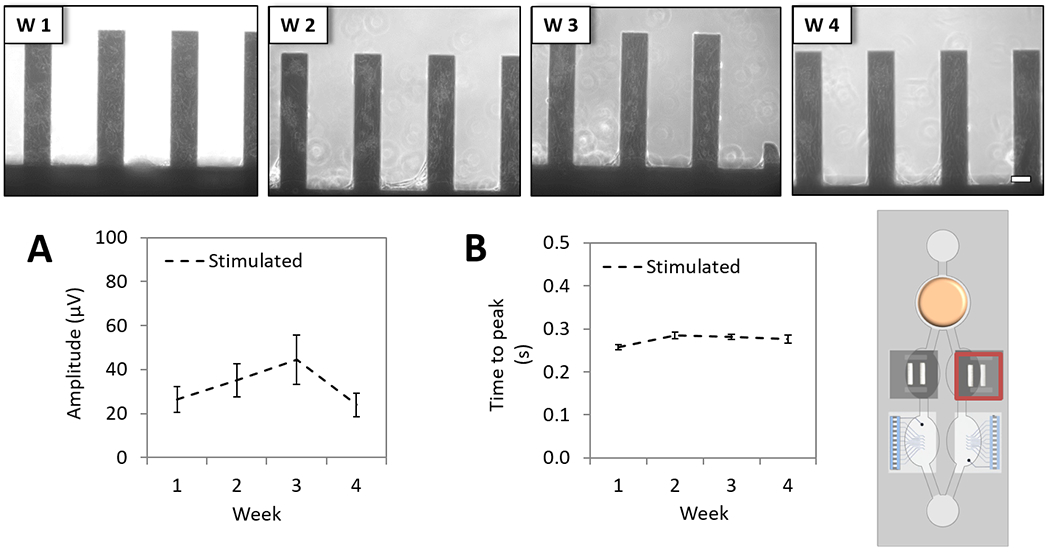
Human iPSc derived cardiomyocytes on cantilever chips (chamber B) were co-culture in the 4-Organs system under a serum-free medium (HSL3) and flow for up to 28 days. Weekly morphology images of cardiomyocytes on cantilever chips in the system demonstrate good morphology (top). Contractile parameters studied under stimulated conditions showed stable cardiac function over 28 days; contractile force (p>0.05) (A), and time to peak (p<0.05) (B). (100 μm scale).
Contractile activity (mechanical function) was acquired by measuring the movement of the cantilevers as induced by myocyte contraction (15 s recording). Activity was recorded under stimulation using a pulse stimulator (A-M Systems, Sequim, WA, USA) connected to the cantilever compartment via stainless steel electrodes integrated in the housing to apply square-waveform electrical pulses (1 Hz, duration 0.1 ms, amplitude 4 V). Measuring contractile function under stimulation was previously demonstrated not to affect the contractile force outcome and helped with improving the robustness of the assay (data not shown). The detection system was based on previous work,[17, 20–22] and upgraded to enable the recording of the contractile cardiac function directly inside the chip system (detailed in the Experimental section). Data analysis was performed using peak detection software written in Python, in which peaks were identified as local maxima above a user-defined threshold after filtering the raw data with a high-pass filter. Once the peaks were identified and verified by the user, average peak amplitude and time to peak were automatically calculated. The amplitudes of the voltage output of the laser detection system in response to myocyte contraction was directly related to force via Stoney’s equation as described previously.[20] The resulting contractile force values were expressed as absolute numbers in terms of detector voltage (μV) and plotted as weekly averages of the daily functions. Cardiomyocytes contractile force was demonstrated to be stable throughout the 28-day period in the multi-organ system (Figure 6, A), as well as time to peak (Figure 6, B). The measured time to peak of contraction needed one week to stabilize, however, the difference was below 10% and the force of contraction was stable during the second week on (Figure 6, B).
3.3. The skeletal muscle function
Skeletal muscle contractile activity stimulation was required since the myotubes were not innervated. Skeletal myotubes, cultured on top of cantilever chips in chamber D (Figure 2), maintained their morphology throughout 28 days in the multi-organ system (Figure 7, top). Data acquisition and analysis of contractile function were done similarly as the cardiac contractile measurements. The contractile activity of myotubes was studied under electrical stimulation over the 28-day period in the systems and all the measured parameters (force:Figure 7, A and time to peak: Figure 7, B) were demonstrated to be stable for 28 days.
Figure 7. Long-term skeletal muscle contractile characterization of the 4-Organ system under serum-free and flow conditions using non-invasive measurements.
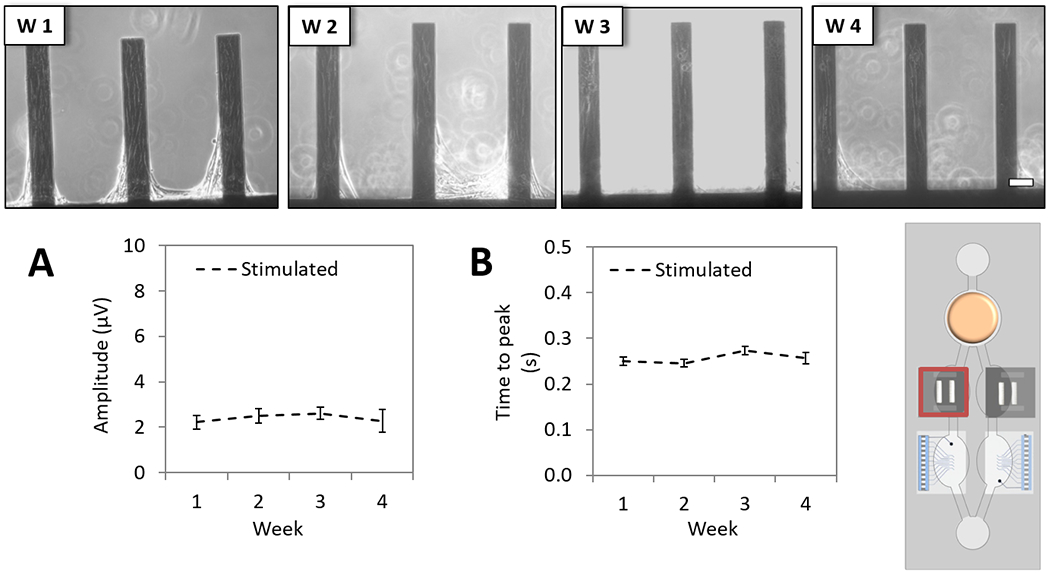
Human skeletal muscle myotubes on cantilever chips (chamber D) were co-culture in the 4-Organs system under a serum-free medium (HSL3) and flow for up to 28 days. Weekly morphology images of myotubes on cantilever chips in the system demonstrate good morphology (top). Contractile parameters studied under stimulated conditions showed stable myotubes function over 28 days; contractile force (p>0.05) (A), and time to peak (p>0.05) (B). (100 μm scale).
3.4. The nervous function
Motoneurons patterned on top of cMEA chips were susceptible to shear stress in the system to a slight degree. With the aid of the simulation described in Section 3, we studied the inclusion of shield barriers in the neuronal chamber to prolong the cellular pattern lifespan and later successfully validated the effect in the system enabling for the neuronal electrical recording up to 28 days. Coating the neurons with a diluted collagen hydrogel and including shield barriers at the entrances of chamber E protected the motoneurons from disturbing the patterns (Figure 2 and Figure 8, A). Incorporating a BBB barrier would improve the device to protect neurons from shear stress and to better mimic the physiologic conditions of being in a selective environment. The technology was previously developed, but not yet incorporated in this platform.[31] Representative images of neuronal morphology on top of the MEA electrodes demonstrated the maintenance of the neurons for 28 days in the multi-organ system (Figure 8, B). Data acquisition and analysis of spontaneously active patterned motoneurons were performed similarly to the electrical activity of cardiomyocytes, with some differences. Recordings (during 5 min) were performed in MC_Rack (Multichannel Systems, Reutlingen, BW, Germany). Raw data was first filtered with a low pass Butterworth 2nd order filter and 2499 Hz frequency cutoff, and later a high pass Butterworth 2nd order filter and 300 Hz frequency cutoff. Positive signals were sorted using a negative voltage threshold cutoff of 5 times the standard deviation of the filtered data. Among those sorted, only neuronal spikes with ≥ 10 μV amplitude and ≥ 0.1 Hz rate were consider positive. The rate and amplitude of the sorted spikes were plotted as weekly averages of the daily functions. The spike shape (Figure 8, C; reproduced with a subset of all recordings), amplitude (Figure 8, D), and rate (Figure 8, E) parameters were characterized over the 28 day period. Although motoneurons were maintained on the patterns over time, morphological changes with an increase in longer and thicker axons on the pattern were observed, but with no significant effect on the measured functional parameters demonstrating stable function of the neurons.
Figure 8. Long-term neuronal electrical characterization of the 4-Organ system under serum-free and flow conditions using non-invasive measurements.
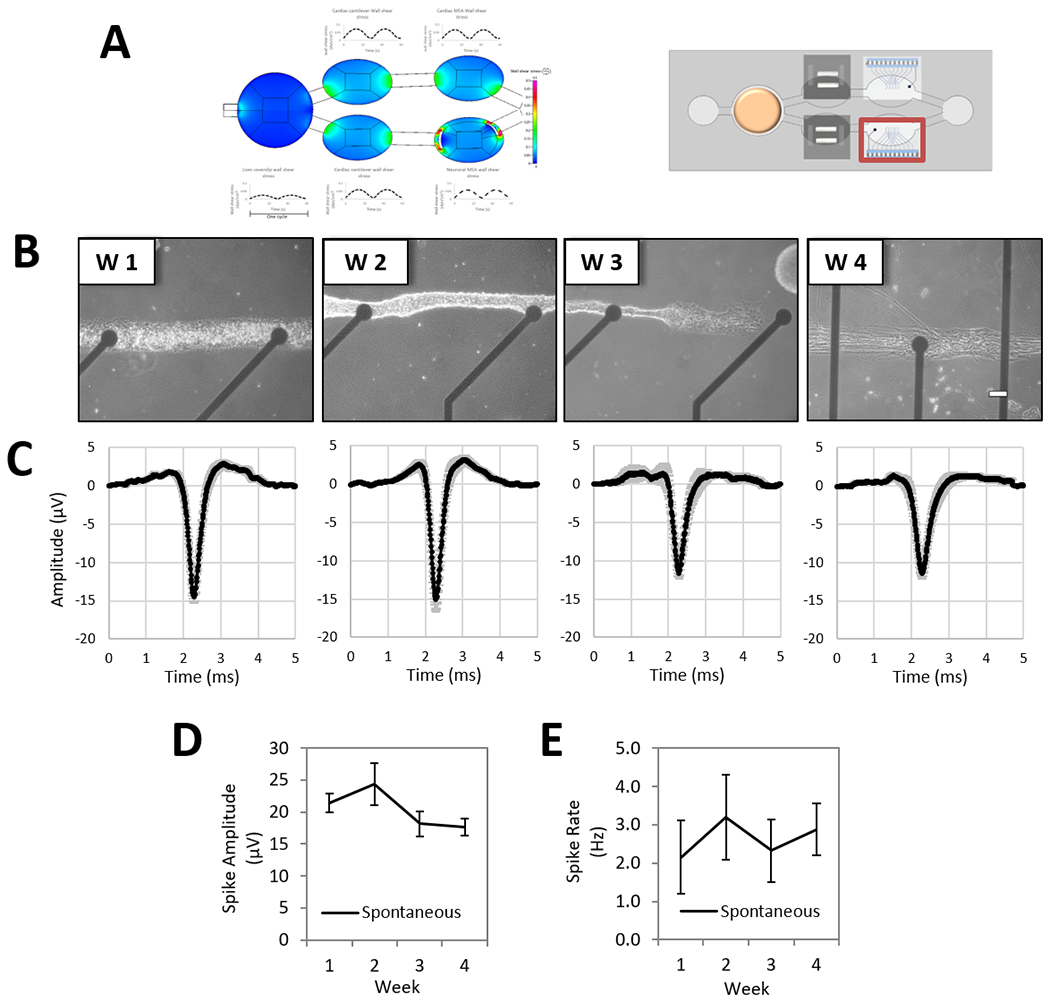
Human motoneurons pattern on custom MEA chips (chamber E) were co-culture in the 4-Organs system under a serum-free medium (HSL3) and flow for up to 28 days. To improve cell stability on the neuronal MEA patterns, the incorporation of shield barriers at the two microfluidic entrances of chamber E were simulated and later experimentally tested with successful results at protecting the patterns, and thus enabling the electrical recording up to 28 days (A). Weekly morphology images of pattern motoneurons on cMEA chip in the system demonstrate good morphology and stable pattern (B). Neuronal electrical parameters studied under spontaneous conditions showed activity over 28 days; weekly average of spike wave forms (C), spike amplitude (p=0.3) (D) and spike rate (p=0.3) (E). (100 μm scale).
4. Conclusions
This 4-Organ (multi-organ) system represents a new in vitro model that enables the co-culture of four different human derived organ representatives (heart, liver, skeletal muscle and nervous system) in a serum-free defined medium under gravitational induced flow for 28 days, and allows to monitor their function in a daily basis non-invasively. The technology will enable to perform chronic testing in a human derived in vitro model that mimics the timeframe utilized for some systemic toxicity studies currently done in animal models. The incorporation of computational flow simulation to the platform, together with experimental data will provide a tool to model the pharmacokinetics and pharmacodynamics profile of known drugs, and later on to generate mechanistic models with strong databases to predict the outcome of unknown drugs. The current technology is able to perform studies that are required for the in vitro safety evaluations mandated by the ICH guidelines.[32] The technology could allow, in a close future, to move chronic drug experiments done currently in animal in vivo models to these novel human in vitro models. In addition, the versatility of the bioengineered design has the potential to introduce studies such as; comparing hepatic phenotypes, use iPSc derived hepatocytes, adding other organs in the co-culture, drug interactions, chronic drug administrations and personalized medicine.
5. Experimental Section
cMEA chip fabrication:
Chips were fabricated from 4” fused silica wafers using standard photolithographic and microfabrication processes at the Cornell Nanoscale Science & Technology Facility (CNF). Wafers were cleaned with a Piranha dip, rinsed with water, and dried. For electrode fabrication, wafers were spin-coated with a liquid hexamethyldisilazane-based adhesion promoter followed by S1818 photoresist (Shipley, Marlborough, MA, USA). The photoresist was patterned with a quartz mask and ABM mask aligner, and an image reversal process was performed in an ammonia atmosphere oven process to produce inward sloping sidewalls in the photoresist. Electronbeam evaporation was used to deposit 10 nm titanium and 50 nm platinum on the photoresist patterned wafers, followed by a liftoff process using Microposit® remover 1165 (Dow, Austin, TX, USA). An insulation layer composed of a three-layer stack of silicon oxide/silicon nitride/silicon oxide, each 100 nm thick, was deposited using plasma enhanced chemical vapor deposition. This layer was patterned with reactive ion etching through a layer of S1818 photoresist (Shipley, Marlborough, MA, USA) to expose the electrodes and contact pads. After stripping the residual photoresist, the chips were diced using a dicing saw. A CDE ResMap Resistivity 4-pt Probe station was used to confirm continuity of the metal layers before deposition of the insulation layer, high electrical resistance of the insulation layer and complete etching of the insulation layer above the pads and electrodes. A 15 min oxygen plasma treatment was used to clean and to increase the hydrophilicity of the chips.
MGH medium:
DMEM (sodium pyruvate, phenol red, glutamine and glucose free from Thermo Fisher Scientific, Waltham, MA, USA, A14430-01), 10% FBS (Thermo Fisher Scientific, Waltham, MA, USA, 16000-044), 1X Antibiotic and antimycotic (Thermo Fisher Scientific, Waltham, MA, USA, 15240-062), 20 mM hydrocortisone (Sigma, St. Louise, MO, USA, H0888), 250 U insulin (Sigma, St. Louise, MO, USA, I9278), 71.4 μg/mL glucagon (Sigma, St. Louise, MO, USA, G2044) and 0.2 μg/mL EGF (Epidermal Growth Factor) (Sigma, St. Louise, MO, USA, E9644).
CL chip mechanical function detection system:
A red photodiode laser and a sensor (2D Lateral Effect Position Sensor from Thorlabs Inc., Newton, NJ) were both mounted on linear stages (Newport Corporation, Irvine, CA, USA) on the underside of a stage resulting in x-y mobility of the bottom platform (Figure 1). A computer program created with LabVIEW (National Instruments, Austin, TX, USA) was used for PC instrument control and data acquisition. Furthermore, a microscope camera (DinoCapture 2.0 model from DinoLite, AnMo Electronics Corporation, Hsinchu, Taiwan) was placed above the stage to visualize the laser hitting the cantilevers to ensure alignment of the laser beam to the cantilever tip. The system stage is fitted with a heating chamber specific for the microfluidic device and controlled to 37°C with a PID controller during the experiment.
Statistical methods:
Values were expressed as the mean ± SE of a minimum of three independent experiments. Data was evaluated with unpaired Student’s t-Test, run with a two-tail distribution and homo- or heteroscedastic variances when analyzing the overall change between two conditions (i.e. control vs. experimental condition). One-way ANOVA was used to study changes in one parameter (i.e. time). All statistical analyses were performed with Microsoft Excel and differences with p-values < 0.05 were taken as statistically significant.
Acknowledgments
We acknowledge support from the research collaboration and grant from L’Oreal Corporation as well as an NIH SBIR Phase II grant number R44 TR001326-01A1. We thank Daniel H. Elbrecht and Lee Kumanchik for their contribution to the initial phase of this work.
Footnotes
Disclosure of Potential Conflict of Interest
The authors confirm that competing financial interests exist but there has been no financial support for this research that could have influenced its outcome. However, JJH and MLS have a potential competing financial interest, in that a company has been formed to market services for types of cells like this in body-on-a-chip devices.
References
- 1.Esch MB, Smith AS, Prot JM, Oleaga C, Hickman JJ, Shuler ML, Adv. Drug Deliv. Rev 2014, 69-70, 158–69. [DOI] [PMC free article] [PubMed] [Google Scholar]
- 2.Hutson MS, Alexander PG, Allwardt V, Aronoff DM, Bruner-Tran KL, Cliffel DE, Davidson JM, Gough A, Markov DA, Mccawley LJ, Mckenzie JR, Mclean JA, Osteen KG, Pensabene V, Samson PC, Senutovitch NK, Sherrod SD, Shotwell MS, Taylor DL, Tetz LM, Tuan RS, Vernetti LA, Wikswo JP, Appl. In Vitro Toxicol 2016, 2, 97–102. [Google Scholar]
- 3.Loskill P, Marcus SG, Mathur A, Reese WM, Healy KE, PLoS One. 2015, 10, e0139587. [DOI] [PMC free article] [PubMed] [Google Scholar]
- 4.Miller PG, Shuler ML, Biotechnol. Bioeng 2016, 113, 2213–2227. [DOI] [PubMed] [Google Scholar]
- 5.Cook D, Brown D, Alexander R, March R, Morgan P, Satterthwaite G, Pangalos MN, Nat. Rev. Drug Discov 2014, 13, 419–31. [DOI] [PubMed] [Google Scholar]
- 6.Ribas J, Sadeghi H, Manbachi A, Leijten J, Brinegar K, Zhang YS, Ferreira L, Khademhosseini A, Appl. In Vitro Toxicol 2016, 2, 82–96. [DOI] [PMC free article] [PubMed] [Google Scholar]
- 7.Siramshetty VB, Nickel J, Omieczynski C, Gohlke BO, Drwal MN, Preissner R, Nucleic Acids Res. 2016, 44, D1080–6. [DOI] [PMC free article] [PubMed] [Google Scholar]
- 8.Bhatia SN, Ingber DE, Nat. Biotechnol 2014, 32, 760–72. [DOI] [PubMed] [Google Scholar]
- 9.Marx U, Andersson TB, Bahinski A, Beilmann M, Beken S, Cassee FR, Cirit M, Daneshian M, Fitzpatrick S, Frey O, Gaertner C, Giese C, Griffith L, Hartung T, Heringa MB, Hoeng J, De Jong WH, Kojima H, Kuehnl J, Leist M, Luch A, Maschmeyer I, Sakharov D, Sips AJ, Steger-Hartmann T, Tagle DA, Tonevitsky A, Tralau T, Tsyb S, Van De Stolpe A, Vandebriel R, Vulto P, Wang J, Wiest J, Rodenburg M, Roth A, ALTEX. 2016, 33, 272–321. [DOI] [PMC free article] [PubMed] [Google Scholar]
- 10.Wang YI, Oleaga C, Long CJ, Esch MB, Mcaleer CW, Miller PG, Hickman JJ, Shuler ML, Exp. Biol. Med. (Maywood). 2017, 242, 1701–1713. [DOI] [PMC free article] [PubMed] [Google Scholar]
- 11.Denny KH, Stewart CW, in Nonclinical Drug Development. Academic Press. 2017, p. 109. [Google Scholar]
- 12.Maschmeyer I, Lorenz AK, Schimek K, Hasenberg T, Ramme AP, Hubner J, Lindner M, Drewell C, Bauer S, Thomas A, Sambo NS, Sonntag F, Lauster R, Marx U, Lab Chip. 2015, 15, 2688–99. [DOI] [PubMed] [Google Scholar]
- 13.Materne EM, Maschmeyer I, Lorenz AK, Horland R, Schimek KM, Busek M, Sonntag F, Lauster R, Marx U, J. Vis. Exp 2015, e52526. [DOI] [PMC free article] [PubMed] [Google Scholar]
- 14.Oleaga C, Bernabini C, Smith AS, Srinivasan B, Jackson M, Mclamb W, Platt V, Bridges R, Cai Y, Santhanam N, Berry B, Najjar S, Akanda N, Guo X, Martin C, Ekman G, Esch MB, Langer J, Ouedraogo G, Cotovio J, Breton L, Shuler ML, Hickman JJ, Sci. Rep 2016, 6, 20030. [DOI] [PMC free article] [PubMed] [Google Scholar]
- 15.Xiao S, Coppeta JR, Rogers HB, Isenberg BC, Zhu J, Olalekan SA, Mckinnon KE, Dokic D, Rashedi AS, Haisenleder DJ, Malpani SS, Arnold-Murray CA, Chen K, Jiang M, Bai L, Nguyen CT, Zhang J, Laronda MM, Hope TJ, Maniar KP, Pavone ME, Avram MJ, Sefton EC, Getsios S, Burdette JE, Kim JJ, Borenstein JT, Woodruff TK, Nat. Commun 2017, 8, 14584. [DOI] [PMC free article] [PubMed] [Google Scholar]
- 16.Natarajan A, Stancescu M, Dhir V, Armstrong C, Sommerhage F, Hickman JJ, Molnar P, Biomaterials. 2011, 32, 4267–74. [DOI] [PMC free article] [PubMed] [Google Scholar]
- 17.Stancescu M, Molnar P, Mcaleer CW, Mclamb W, Long CJ, Oleaga C, Prot JM, Hickman JJ, Biomaterials. 2015, 60, 20–30. [DOI] [PMC free article] [PubMed] [Google Scholar]
- 18.Edwards D, Stancescu M, Molnar P, Hickman JJ, ACS Chem. Neurosci 2013, 4, 1174–82. [DOI] [PMC free article] [PubMed] [Google Scholar]
- 19.Das M, Wilson K, Molnar P, Hickman JJ, Nat. Protoc 2007, 2, 1795–801. [DOI] [PubMed] [Google Scholar]
- 20.Pirozzi KL, Long CJ, Mcaleer CW, Smith AS, Hickman JJ, Appl. Phys. Lett 2013, 103, 83108. [DOI] [PMC free article] [PubMed] [Google Scholar]
- 21.Wilson K, Das M, Wahl KJ, Colton RJ, Hickman J, PLoS One. 2010, 5, e11042. [DOI] [PMC free article] [PubMed] [Google Scholar]
- 22.Oleaga C, Legters G, Bridges LR, Kumanchik L, Martin C, Cai Y, Schnepper M, Mcaleer CW, Long CJ, Hickman JJ, in Pharmacology and Toxicology, (Eds: Clements M, Roquemore L), Humana Press: New York: 2017, pp. 229–246. [Google Scholar]
- 23.Smith AS, Long CJ, Mcaleer C, Bobbitt N, Srinivasan B, Hickman JJ, J. Vis. Exp 2014, e51866. [DOI] [PMC free article] [PubMed] [Google Scholar]
- 24.Guo X, Gonzalez M, Stancescu M, Vandenburgh HH, Hickman JJ, Biomaterials. 2011, 32, 9602–11. [DOI] [PMC free article] [PubMed] [Google Scholar]
- 25.Esch MB, Mahler GJ, Stokol T, Shuler ML, Lab Chip, 2014, 14, 3081–92. [DOI] [PMC free article] [PubMed] [Google Scholar]
- 26.Sung JH, Kam C, Shuler ML, Lab Chip. 2010, 10, 446–55. [DOI] [PubMed] [Google Scholar]
- 27.Esch MB, Prot JM, Wang YI, Miller P, Llamas-Vidales JR, Naughton BA, Applegate DR, Shuler ML, Lab Chip. 2015, 15, 2269–77. [DOI] [PMC free article] [PubMed] [Google Scholar]
- 28.Ukairo O, Kanchagar C, Moore A, Shi J, Gaffney J, Aoyama S, Rose K, Krzyzewski S, Mcgeehan J, Andersen ME, Khetani SR, Lecluyse EL, J. Biochem. Mol. Toxicol 2013, 27, 204–12. [DOI] [PubMed] [Google Scholar]
- 29.Ullrich A, Stolz DB, Ellis EC, Strom SC, Michalopoulos GK, Hengstler JG, Runge D, ALTEX. 2009, 26, 295–302. [DOI] [PubMed] [Google Scholar]
- 30.Nishimura M, Hagi M, Ejiri Y, Kishimoto S, Horie T, Narimatsu S, Naito S, Drug Metab. Pharmacokinet 2010, 25, 236–42. [DOI] [PubMed] [Google Scholar]
- 31.Wang YI, Abaci HE, Shuler ML, Biotechnol. Bioeng 2017, 114, 184–194. [DOI] [PMC free article] [PubMed] [Google Scholar]
- 32.ICH Guidelines. 2016; Available from: http://www.ich.org/products/guidelines.html.