Abstract
Methanotrophic bacteria in an organic soil were enriched on gaseous mixing ratios of <275 parts per million of volume (ppmv) of methane (CH4). After 4 years of growth and periodic dilution (>1020 times the initial soil inoculum), a mixed culture was obtained which displayed an apparent half-saturation constant [Km(app)] for CH4 of 56 to 186 nM (40 to 132 ppmv). This value was the same as that measured in the soil itself and about 1 order of magnitude lower than reported values for pure cultures of methane oxidizers. However, the Km(app) increased when the culture was transferred to higher mixing ratios of CH4 (1,000 ppmv, or 1%). Denaturing gradient gel electrophoresis of the enrichment grown on <275 ppmv of CH4 revealed a single gene product of pmoA, which codes for a subunit of particulate methane monooxygenase. This suggested that only one methanotroph species was present. This organism was isolated from a sample of the enrichment culture grown on 1% CH4 and phylogenetically positioned based on its 16S rRNA, pmoA, and mxaF gene sequences as a type II strain of the Methylocystis/Methylosinus group. A coculture of this strain with a Variovorax sp., when grown on <275 ppmv of CH4, had a Km(app) (129 to 188 nM) similar to that of the initial enrichment culture. The data suggest that the affinity of methanotrophic bacteria for CH4 varies with growth conditions and that the oxidation of atmospheric CH4 observed in this soil is carried out by type II methanotrophic bacteria which are similar to characterized species.
Methane-oxidizing bacteria inhabit the aerobic interfaces of methanogenic environments and reduce the potential methane (CH4) emissions from these environments (7, 15, 30). Atmospheric CH4, which has a present mixing ratio of 1.7 parts per million of volume (ppmv), is also oxidized microbially in aerobic upland soils (15). This process represents about 10% of the atmospheric CH4 sink (10).
The identity of these atmospheric-CH4 oxidizers is unknown. Whereas soil CH4 oxidation rates can remain steady for >4 months at 1.7 ppmv of CH4 (34), calculations based on the kinetic constants of known methanotrophic species suggest that these organisms are incapable of such extended survival (6). Atmospheric CH4 should not supply sufficient cellular maintenance energy plus reducing power for the methane monooxygenase (MMO) enzyme. Studies with Methylosinus trichosporium and Methylobacter albus (Methylomicrobium album) seem to confirm this (32, 34).
However, the kinetic properties of CH4 oxidation in upland soils are different from those in pure methanotroph cultures. Apparent half-saturation constants [Km(app)] of various type I and II methanotrophs range from 0.8 to 66 μM CH4 (5, 18). While some of these values are overestimated due to diffusion limitation, a lower limit of 0.8 to 2 μM is probable (18). Environmental samples from the aerobic interfaces of methanogenic habitats, such as lake sediments and landfill cover soils, have Km(app) values in the same range (7, 39). However, the Km(app) values for upland forest and agricultural soils are 1 to 3 orders of magnitude lower, at 10 to 280 nM CH4 (1, 3, 7, 8, 13). Although a lower-affinity activity can be induced by enrichment with atmospheres containing 10% CH4 (1), the methanotrophs normally active in these soils seem to be adapted to reduced CH4 levels. Either uncharacterized species are involved in atmospheric-CH4 oxidation or unknown physiological changes are induced in known methanotrophic species living in these soils.
The Km(app) for CH4 consumption in an organic soil from Ottawa, Canada, was estimated as 80 to 90 nM (8). This is in the same order of magnitude as values measured in other aerobic upland soils, although slightly higher. Values as low as 10 nM have been measured in soils (1, 3, 7, 13). Here we report on experiments aimed at enriching and characterizing the organisms responsible for the high-affinity activity in this organic soil.
MATERIALS AND METHODS
Sampling site.
The study site has been described previously (8, 9). It is an organic (60% combustible matter), neutral (pH 6.7 to 7.2) soil located on the Central Experimental Farm of Agriculture and Agri-Food Canada in Ottawa. The soil was sampled from a depth of 5 to 20 cm in August 1993.
Enrichment of soil with <275 ppmv of CH4.
Enrichment cultures were made in nitrate mineral salts medium (NMS) (14) containing 3 nM Cu and 1 mM phosphate buffer at pH 6.0. Deionized distilled or twice-distilled water was used. Initially, 0.15 g of soil was added to 10 ml of NMS in 125-ml serum vials. The vials were capped with autoclaved butyl rubber stoppers, and CH4 was added at a final gaseous mixing ratio of 75 ppmv. The enrichment cultures were incubated at 25°C. The CH4 was replaced after declining to below 25 ppmv. After 7 months, and periodically thereafter for 4 years, subsamples of the enrichment culture were transferred into fresh medium. The CH4 mixing ratio in the vials varied considerably during this enrichment period. It declined to 1 to 50 ppmv of CH4 before being replaced but never exceeded 275 ppmv.
Some modifications were made during the enrichment period. Two years into the enrichments and thereafter, a pH 6.8 buffer and a 10-times-strength trace element solution (30 nM Cu) were used in the NMS medium. Since the butyl rubber stoppers often exuded inhibitory compounds after being autoclaved, the stoppers used after the initial transfer were sterilized by washing them in ethanol (50 to 80% [vol/vol]) followed by rinsing them three times in sterile distilled water.
All experiments described below were performed after the initial 4-year enrichment period. During this time, the culture had been diluted to >1020 times the initial soil inoculum. Within this period a serial dilution series had been performed, and only the highest positive dilution (107 times) was maintained.
Kinetic experiments.
Half-liter batches of the culture were grown on <200 ppmv of CH4 for 1 to 4 months. Since our aim was to study substrate affinity rather than specific activity, cell counts were not done. However, from the dilution series described in the previous section, methanotroph densities of <107 cells ml−1 could be expected after such incubation times. Aliquots (2 to 8 ml, depending on the experiment) of the culture were transferred to 14-ml serum vials, and chloramphenicol at a final concentration of 50 μg liter−1 was added to prevent further enzyme production. The vials were capped with butyl rubber stoppers and injected with CH4 at mixing ratios ranging from 5 to 1,000 ppmv. The vials were incubated at 25°C and rotated around the short axis at 21 rotations per min. At 1- to 2-day intervals for 3 to 10 days, CH4 was measured by injection of 0.3-ml gas samples into a Carlo Erba gas chromatograph equipped with a flame ionization detector (oven temperature, 100°C; injector temperature, 140°C; 3-m by 3-mm Porapak Q column).
Methane oxidation rates were estimated by linear regressions of CH4 mixing ratios versus time. The regressions were effectively linear at CH4 levels greater than the Km(app) (r2, usually >0.95), proving that initial rates were being measured. The maximum decline of CH4 over the incubations was always <50%. At each CH4 concentration, blank vials containing only water were included to estimate CH4 removal during gas chromatographic sampling and to correct the CH4 oxidation rates in the culture. These corrected rates were plotted against the CH4 levels at the time midpoint and fitted to a Michaelis-Menton hyperbolic model by using the least-squares iterative fitting procedure of Origin 4.1 (Microcal Software, Inc., Northampton, Maine).
Transfer of the enrichment culture into CH4 at higher mixing ratios.
The enrichment culture was inoculated into 50 ml of NMS in 125-ml serum vials and grown on CH4 at initial mixing ratios of 1,000 ppmv and 1%. The CH4 was replaced after declining to <20% of these initial values. The CH4 was replaced five times for the 1,000-ppmv treatment and six times for the 1% treatment. Kinetic experiments were then performed as described above at a range of 20 to 3,000 ppmv of CH4 (for the 1,000-ppmv enrichment culture, 1-ml aliquots were diluted to 2 ml and measured at 2-day intervals for 6 days; for the 1% enrichment culture, 1-ml aliquots were diluted to 6 ml total and measured at 1 or 2 intervals of 3 h).
Isolations.
Members of the low-CH4 enrichment culture (<275 ppmv of CH4) were isolated by performing a decimal dilution series in liquid NMS medium and making spread plates of each dilution onto NMS medium solidified with 15 g of Bacto Agar (Difco Laboratories, Detroit, Mich.) liter−1. The plates were incubated at 25°C in closed chambers containing a gaseous mixing ratio of 3% CH4. Colonies which formed on plates of the highest two dilutions showing growth (105 to 106 times the initial inoculum) were restreaked for isolation (i) onto NMS solidified with Noble agar (Difco) and incubated under 3% CH4 and (ii) onto plates of a general medium for culturing nonfastidious organisms, R2A agar (Difco), and incubated under air. Because we failed to isolate a methanotroph in this way (see Results), the procedure was repeated with a sample of the enrichment culture grown on 1% CH4 (see the previous section).
DNA extraction.
Extraction of DNA from the low-CH4 enrichment culture (<275 ppmv of CH4) and from the various isolates was adapted from the procedure of Moré et al. (28). Approximately 1 g of sterilized (170°C for 4 h) zirconia-silica beads of 0.1-mm diameter (Biospec Products Inc., Bartlesville, Okla.) was added to cell pellets in 2-ml screw-cap tubes. The cells and beads were suspended by vortexing them in 800 μl of NaH2PO4-Na2HPO4 buffer (120 mM; pH 8) and 260 μl of sodium dodecyl sulfate solution (10% [wt/vol] sodium dodecyl sulfate, 0.1 M NaCl, 0.5 M Tris-HCl, pH 8). The cells were lysed in a bead beater (Fastprep FP120; Savant Instruments Inc., Farmingdale, N.Y.) at a setting of 6.5 m s−1 for 45 s. The tubes were centrifuged for 3 min at 12,000 × g, and the supernatant was collected. The beads were then resuspended in 700 μl of NaH2PO4-Na2HPO4 buffer, and the DNA extraction was repeated. Proteins and debris were precipitated from the supernatant by adding 2.5 volumes of 7.5 M ammonium acetate, incubating the solution for 5 min on ice, and centrifuging it at 12,000 × g for 3 min. The DNA was precipitated by centrifugation (4°C; 45 min; 12,000 × g) with 70% (vol/vol) isopropanol added. The DNA pellet was washed with 70% (vol/vol) ethanol at 4°C, dried, and resuspended in 200 μl of elution buffer (Bio-Rad, Munich, Germany).
Comparative 16S rRNA gene sequence analysis.
PCR-mediated amplification of the 16S rRNA genes from positions 28 to 1491 (numbering according to the International Union of Biochemistry nomenclature for Escherichia coli 16S rRNA) and sequencing analyses were done as previously described (22). Phylogenetic placement of strain LR1 was performed with the ARB program package (37). The 16S ribosomal DNA (rDNA) sequence of strain LR1 was integrated into a database of about 6,000 complete or partial bacterial 16S rRNA sequences (24, 31, 38) with the automatic alignment tool of the ARB program package. This procedure showed strain LR1 to be a member of the alpha subclass of the class Proteobacteria. The phylogenetic position of strain LR1 was determined in more detail by comparing its 16S rDNA gene sequence with alpha proteobacterial reference sequences. The tree topology was evaluated by a distance matrix analysis. For phylogenetic inference, the only nucleotide sequence positions considered were those which contained identical nucleotides in at least 50% of a representative selection of 16S rRNA sequences from the major lineages of the alpha subclass of proteobacteria (1,353 nucleotide sequence positions). Evolutionary distance values between pairs of microorganisms were calculated with the Felsenstein correction (ARB) (11). The tree was constructed by the neighbor-joining algorithm (33). The statistical significance values of interior branch points were tested in a bootstrap analysis by the neighbor-joining method (ARB; 1,000 data resamplings).
Comparative analysis of pmoA and mxaF gene fragments. (i) PCR amplification.
Primers targeting gene fragments of pmoA (A189f and A682r) (16), coding for a subunit of particulate MMO (pMMO), and of mxaF (mxaF f1003 and mxaF r1561) (25, 27), coding for the large subunit of methanol dehydrogenase, were used for PCR amplification. A GC clamp (CCCCCCCCCCCCCGCCCCCCGCCCCCCGCCCCCGCCGCCC) was attached to the 5′ end of each forward primer. PCR was performed in 50-μl reaction mixtures with an Eppendorf (Hamburg, Germany) gradient cycler. Taq polymerase (Perkin-Elmer Applied Biosystems, Branchburg, N.J.) was added to 0.5 μM concentrations of each primer and a PCR premix (Epicentre Technologies, Madison, Wis.). The mxaF fragment was amplified as described previously (27). For the pmoA amplification a touchdown program was developed, consisting of an initial denaturing step (94°C; 3 min) followed by 20 touchdown cycles (62 to 52°C), eight further cycles (52°C for 1 min followed by 72°C for 45 s), and a final extension (72°C; 5 min). The PCR products were analyzed on 3% agarose gels stained with ethidium bromide.
(ii) DGGE.
PCR products were separated on 1-mm-thick polyacrylamide gels (6.5% [wt/vol] 37.5:5 acrylamide-bisacrylamide) (Bio-Rad) poured on GelBond support medium (FMC Bio Products, Rockland, Maine). They were prepared and run in Tris-acetic acid-EDTA buffer (0.04 M Tris-base, 0.02 M sodium acetate, 1 mM EDTA) at pH 7.4 and 60°C. The Dcode electrophoresis system (Bio-Rad) was used for separation. Denaturing gradient gel electrophoresis (DGGE) conditions for the various PCR products were optimized by perpendicular DGGE. For the pmoA fragments, a gradient of 35 to 80% denaturant (80% corresponded to 6.5% [vol/vol] acrylamide, 5.6 M urea, and 32% [vol/vol] deionized formamide) at a constant voltage of 200 V for 6 h was used. For the mxaF fragments, a gradient of 20 to 70% denaturant at a constant voltage of 150 V for 5 h was used. The gels were stained with 1:50,000 (vol/vol) SYBR-green I (Biozym, Hessisch-Oldendorf, Germany) for 30 min and then scanned on a PhosphorImager (Molecular Dynamics, Sunnyvale, Calif.).
(iii) DNA sequencing and construction of pmoA- and mxaF-based trees.
Distinct bands were excised from the SYBR-green-stained gels with sterile pipette tips and suspended in 200 μl of H2O. The bands were reamplified and rerun on DGGE to ensure purity.
The PCR products from the excised bands were purified with the Easy-Pure DNA purification kit (Biozym). The concentration and purity of the PCR products were determined by absorption at 260 and 280 nm of a 1:20 dilution. The sequencing reactions were performed in both directions with the PRISM dye terminator cycle-sequencing kit (Perkin-Elmer Applied Biosystems). Products of the cycle-sequencing reaction were purified from excess dye terminators and primers with Microspin G-50 columns (Pharmacia, Uppsala, Sweden) and sequenced on an automatic DNA sequencer (model 373A; Perkin-Elmer Applied Biosystems). Phylogenetic trees were constructed with the cluster alignment algorithm of the DNA-Star software package (Lasergene Inc., Madison, Wis.).
Comparative sequence analysis of mmoX.
A gene fragment of mmoX coding for the alpha subunit of soluble MMO (sMMO) was amplified from both the low-CH4 enrichment culture (<275 ppmv of CH4) and the methanotrophic isolate LR1 with primers (mmoX f882 and mmoX r1403) under PCR conditions described previously (25). The resulting PCR products were checked for size and purity on a 1.5% agarose gel and purified with the Prep-A-Gene system (Bio-Rad). Sequencing was performed as described above.
Nucleotide sequence accession numbers.
The nucleotide sequences of the nearly complete 16S rRNA gene and of partial mmoX, mxaF, and pmoA genes and gene fragments of strain LR1 have been deposited in the EMBL, GenBank, and DDBJ nucleotide sequence databases under accession no. Y18442, Y18440, Y18441, and Y18443, respectively.
RESULTS
Soil enrichment cultures grown on <275 ppmv of CH4.
Soil enrichment cultures grown on 10 to 20% CH4 display low-affinity kinetics [Km(app)> 1 μM (Table 1)]. We therefore chose a lower CH4 mixing ratio in an attempt to enrich for higher-affinity methanotrophic activity.
TABLE 1.
Km(app) values measured for methanotrophic bacteria, methanotrophic enrichment cultures, and soila
| Sample (reference) |
Km(app) (μM CH4)
|
|
|---|---|---|
| <1 μM | >1 μM | |
| Literature | ||
| Methanotrophs, MMO (5, 18) | 0.8–66 | |
| Aerobic interfaces of methanogenic soil (7, 39) | 1.0–11 | |
| Aerobic upland soils (1, 3, 7, 8, 13) | 0.010–0.280 | |
| Aerobic upland soils, enriched with 20% CH4 (1) | 0.015–0.450 | 1.7–28 |
| Organic soil (8) | 0.060–0.280b | |
| Organic soil, enriched with 10% CH4 (8a) | 2.7–6.7 | |
| This study | ||
| Enrichment culture | ||
| Grown on <275 ppmv of CH4 | 0.056, 0.083, 0.173, 0.186 | |
| Transferred to 1,000 ppmv of CH4 | 0.330, 0.566 | |
| Transferred to 1% CH4 | 1.96, 2.60 | |
| Coculture; type II methanotroph LR1 + Variovorax sp. | 0.129, 0.177, 0.183, 0.188 | |
For the literature, the range of reported values is shown. For experimental data, values from at least two trials (each with a separately grown culture) are shown.
Estimated as 80 to 90 nM in the absence of NH4+.
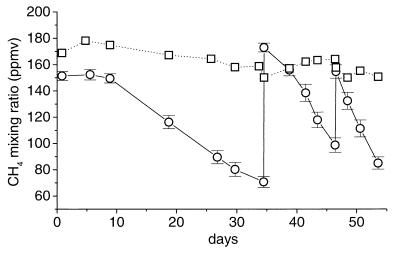
The CH4 oxidation rate of soil inoculated into NMS showed a gradual increase with time when the soil was incubated at CH4 mixing ratios of as little as 75 ppmv. An enrichment culture was obtained by continuous growth on <275 ppmv of CH4 for 4 years. The increase in activity was very slow, typically requiring a week or more to double. An example showing the increasing rate of CH4 oxidation over time in the enrichment culture is shown in Fig. 1. Blank vials containing uninoculated medium plus CH4, which were sampled in exactly the same way as the enrichment cultures, never developed methanotrophic activity. Therefore, contamination of the cultures with a methanotroph from another source was unlikely.
FIG. 1.
Oxidation of CH4 at mixing ratios of <200 ppmv (○) in closed vials (125 ml) containing 50 ml of NMS inoculated with the enrichment culture at day 0. Methane was added to the vials at 34 and 46 days. The data are the means of results with six vials ± 1 standard error of the mean. □, mean of results with three uninoculated vials.
Kinetics.
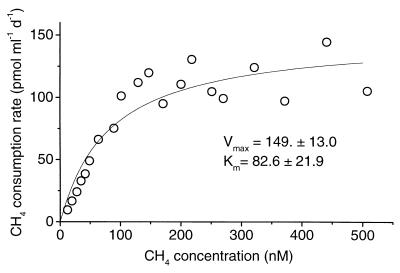
A typical kinetic curve from the low-CH4 enrichment culture is shown in Fig. 2. The measured Km(app) in four trials varied from 56 to 186 nM CH4 (40- to 132-ppmv mixing ratio) (Table 1). This range overlaps the Km(app) estimated for the organic soil itself (Table 1).
FIG. 2.
Kinetic curve of CH4 oxidation in a soil enrichment culture which was grown continuously on CH4 at a gaseous mixing ratio of <275 ppmv. Each symbol represents the mean of results with two samples.
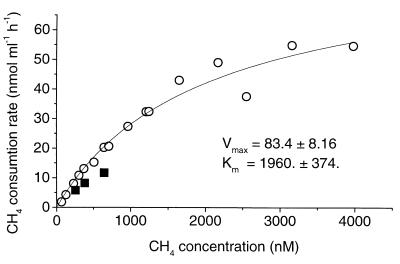
When samples of the enrichment were transferred to new medium and grown on CH4 at higher mixing ratios, the Km(app) values increased (Table 1). Growth on 1,000 ppmv of CH4 resulted in Km(app) values higher than those in the initial low-CH4 enrichment (<275 ppmv of CH4) but still lower than those in pure methanotroph cultures. Enrichments grown on 1% CH4 had Km(app) values typical for methanotrophic cultures (Table 1). A kinetic curve for a culture grown on 1% CH4 is shown in Fig. 3. The high Km(app) value was not a result of phase transfer limitation or poor mixing of CH4, as demonstrated by the fact that diluting the culture 1:1 with water resulted in about a 50% reduction of the CH4 oxidation rate (Fig. 3).
FIG. 3.
Kinetic curve of CH4 oxidation in a soil enrichment culture initially grown on CH4 at a gaseous mixing ratio of <275 ppmv and later on 1% CH4. Each symbol represents the mean of results with two samples. ■, samples diluted 1:1 with water.
Members of the methanotrophic enrichment culture.
When samples of the low-CH4 enrichment culture (<275 ppmv of CH4) were plated onto NMS agar, various types of colonies grew. These had sizes and morphologies typical of heterotrophic organisms which grow on trace contaminants in the medium (14). Four separate organisms which grew when transferred to complex medium (R2A agar) were isolated. These were identified based on partial 16S rRNA gene sequences. The closest relatives of these isolates were “Pseudomonas pavonacea” IAM1155 (similarity, 99.0% based on an analyzed stretch corresponding to E. coli 16S rRNA numbering positions 104 to 1293), Variovorax paradoxus (similarity, 99.2%; numbering positions 158 to 1192), Bradyrhizobium elkanii USDA76 (similarity, 98.5%; numbering positions 28 to 819), and Hyphomicrobium vulgare MC-750 (similarity, 96.9%; numbering positions 28 to 908).
None of these isolates consumed CH4 in pure culture, and none showed a pmoA gene product (data not shown). However, transfer of the low-CH4 (<275 ppmv of CH4) liquid enrichment culture to an atmosphere containing 1% CH4 resulted in a turbid culture which did produce thick methanotroph colonies (14) when streaked onto NMS agar and grown on 3% CH4. Isolated colonies of a methanotroph designated LR1 were selected and stored in liquid NMS on 1% CH4.
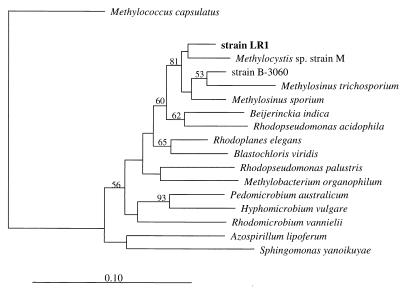
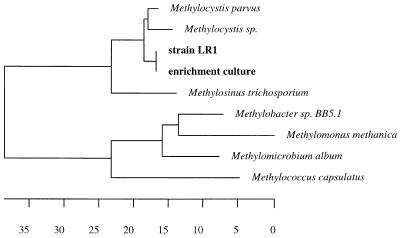
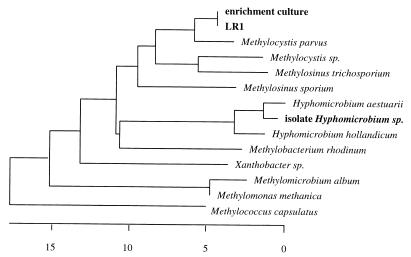
Gene primers for mmoX (coding for the alpha subunit of sMMO) and pmoA (coding for a subunit of pMMO) both gave a signal from isolate LR1. The membership of strain LR1 within the type II methanotrophs of the Methylocystis/Methylosinus cluster in the alpha subclass of the class Proteobacteria was clearly shown by comparative analysis of its 16S rRNA (Fig. 4), its pmoA (Fig. 5), and its mxaF (Fig. 6) gene sequences.
FIG. 4.
Phylogenetic tree, based on 16S rRNA gene sequences, showing the relationship of isolate LR1 to other type II methanotrophs of the Methylocystis/Methylosinus group and to representative members of the alpha subclass of the class Proteobacteria. The 16S rRNA gene sequence from Methylococcus capsulatus was used as an outgroup reference. The numbers indicate the bootstrap values (percentage of outcome) for the respective interior branch points from a neighbor-joining test. Only values above a threshold of 50% are shown. The scale bar represents the estimated number of base changes per nucleotide sequence position.
FIG. 5.
Unrooted phylogenetic tree, based on derived amino acid sequences of pmoA gene fragments, showing the identity of the pmoA product from isolate LR1 and that from the high-affinity enrichment culture (grown on <275 ppmv of CH4) and their relationship to other methanotrophic species. The distance bar represents percent dissimilarity.
FIG. 6.
Unrooted phylogenetic tree, based on derived amino acid sequences of mxaF gene fragments, showing the identity of the mxaF product from isolate LR1 and that from the high-affinity enrichment culture (grown on <275 ppmv of CH4) and their relationship to other methylotrophic species. The distance bar represents percent dissimilarity.
DGGE analyses.
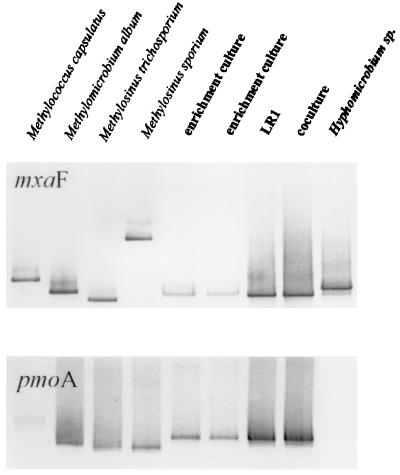
The results of the DGGE analyses suggested that there was a single methanotrophic species present in the low-CH4 enrichment culture (<275 ppmv of CH4). The pmoA primer system, which should detect all known methanotrophic species, produced a single band on the DGGE for the enrichment (Fig. 7). Although methanotrophs appear to contain two copies of pmoA (36), these are not always distinguishable on DGGE. Two pmoA bands were occasionally evident from methanotroph isolates when DGGE gels were silver stained, but only a single band was evident from the enrichment culture and from isolate LR1 (data not shown).
FIG. 7.
DGGE patterns of DNA, amplified with primers for mxaF and pmoA, from selected methanotrophic strains (first four lanes), the high-affinity enrichment culture (grown on <275 ppmv of CH4), the methanotrophic isolate LR1, a coculture of LR1 with a Variovorax sp., and a Hyphomicrobium sp. isolated from the enrichment culture.
The mxaF primer system also produced only one clear band (Fig. 7). A second faint band may have been present in the mxaF gel, but is migration pattern corresponded to that of a methylotrophic Hyphomicrobium sp. isolated from the culture. The sequences of the pmoA (Fig. 5), mxaF (Fig. 6), and mmoX (data not shown) PCR products retrieved from the low-CH4 enrichment (grown on <275 ppmv of CH4) were all identical to those of the respective PCR products retrieved from isolate LR1.
Isolate LR1 was therefore the only detectable methanotroph in the enrichment culture grown on <275 ppmv of CH4. The data cannot completely rule out the possibility that another methanotroph was present, perhaps in much lower abundance, but its mxaF, pmoA, or mmoX genes were not detected. They also cannot rule out the possibility that an organism without either mxaF, pmoA, or mmoX was responsible for the high-affinity CH4 oxidation. Unidentified species were present in the enrichment, as shown by a DGGE performed with a universal 16S rDNA primer system (data not shown). In this gel, several bands were visible which did not have the same migration patterns as any of the five isolated organisms described above.
Isolate LR1 was therefore grown in a coculture with the Variovorax sp. isolated from the enrichment. The Variovorax was included because it stimulated the growth of LR1, although alone it could not consume CH4 (data not shown). This coculture was grown on <275 ppmv of CH4 for 4 to 5 months, and kinetic curves were measured as previously described. A Km(app) value of 129 to 188 nM was estimated in this coculture (Table 1). This range overlaps that of the more complex enrichment culture and is considerably lower than any range previously reported for methanotrophic bacteria. Isolate LR1 was therefore probably the high-affinity CH4 oxidizer in the initial, low-CH4 enrichment culture (<275 ppmv of CH4).
DISCUSSION
Methanotrophs in soils exposed to only atmospheric CH4 possess a higher affinity for CH4 than do pure cultures of methanotrophic bacteria, which are routinely grown on CH4 at mixing ratios of 10 to 20% (Table 1). There is no conclusive evidence indicating whether this high-affinity activity is carried out by novel organisms or simply by known methanotrophs behaving in an unknown manner. Recently it was shown that the Km(app) (CH4) in M. albus varied depending on whether the organisms were grown on CH4 or methanol as an energy source (4). This demonstrates that the Km(app) in known methanotrophic bacteria changes with culture conditions, although neither reported value was near the low-nanomolar Km(app) values measured in upland soil (both were >1 μM) (4). The Km(app) of soils enriched with CH4 at high mixing ratios has also been shown to vary with the CH4 supply, but again only in the Km(app) range of >1 μM (19).
Our data suggest two major points: that a type II methanotrophic species in mixed culture can exhibit Km(app) values which vary depending on the CH4 supply and that the Km(app) of such a culture can approach that measured in upland soils when low CH4 mixing ratios (<275 ppmv) are used for growth. We produced a methanotrophic enrichment culture which, based on its pmoA, mmoX, and mxaF products, contained a single detectable methanotroph. This organism (LR1) was a type II species of the Methylosinus/Methylocystis group. In the enrichment culture, and in a coculture containing only LR1 and a Variovorax sp., growth on <275 ppmv of CH4 resulted in Km(app) values of 56 to 188 nM. However, when the CH4 mixing ratio was raised to 1%, the Km(app) shifted upward to a value typical for methanotrophic isolates (>1 μM [Table 1]).
The organic soil from which our enrichment cultures were made consumes atmospheric CH4 over much of the year (9). We previously measured Km(app) values of 60 to 280 nM CH4 in this soil, estimating the value in the absence of inhibitory NH4+ as 80 to 90 nM (8). Because the Km(app) values in our cultures grown on <275 ppmv of CH4 were in the same range as these values, species such as LR1 could be the active methane oxidizers in this soil. It is therefore unnecessary here to postulate novel organisms as the agents of atmospheric-methane oxidation. The 16S rRNA gene sequence, as well as sequences for the functional genes pmoA and mxaF, which are also useful phylogenetic markers for methanotrophic bacteria (26, 27), all showed that LR1 clusters with other type II species and does not belong to a novel lineage of methanotrophs.
The Km(app) values in our cultures grown on <275 ppmv of CH4 were lower than the lowest previously reported value for methanotrophic isolates. However, the values in our cultures, and in the organic soil itself, are higher than those measured in many other upland soils. These can be as low as 10 nM (1, 3, 13). This organic soil is periodically methanogenic (9) and possibly supports a methanotrophic flora different from that of other soils. Although organisms such as LR1 may account for atmospheric-CH4 oxidation in this organic soil, other species may dominate in other soils. On the other hand, the fact that the Km(app) in our cultures was variable suggests that even lower values may be inducible under more oligotrophic conditions.
The CH4 concentration was a key factor in determining Km(app), but this could be mediated through the MMO enzyme, the methanotroph, or the bacterial community as a whole. Only apparent kinetic coefficients are measured in a study with a mixed microbial community, and it cannot be assumed that these represent true enzyme properties. A variety of reasons could therefore account for the variable Km(app). We propose three possibilities. (i) A modified form of MMO is responsible for high-affinity activity. (ii) The measured Km(app) is diffusion limited and affected by physiological properties of methanotrophs which change with growth conditions. Although the specific CH4 uptake rate in methanotrophs (10−15 mol of CH4 cell−1 h−1) (15) is 100 to 1,000 times lower than the maximum rate of CH4 diffusion through the cell boundary layer (calculated with the van Smoluchowski equation [21]), diffusion limitation could occur if cells aggregate or if the cell envelope presents a diffusion barrier (21). In a diffusion-limited system the measured Km(app) values are affected by the aggregation, the specific activity, or the envelope structure of the cells. (iii) It is difficult to apply simple Michaelis-Menton kinetics to a complex terreactant enzyme such as MMO. The Km(app) for a substrate is a function of both an equilibrium constant (binding of substrate to enzyme) and a reaction rate constant (decomposition to product). These may be altered by the availability of cosubstrates. For example, it might be expected that the cosubstrate NADH is more limiting in methanotrophic cultures grown on <275 ppmv of CH4 than in those grown on 1% CH4. If NADH limitation slowed the decomposition of the MMO-CH4 complex (although this does not agree with the present model of the sMMO reaction sequence [23]), a lower Km(app) could result (35).
Methane oxidation rates in soil have been stimulated by incubation on >1,000 ppmv of CH4 (1, 2, 29, 34). Transient or minor increases may follow incubation with less CH4 (3, 12), but until now no study had produced a long-term methanotrophic enrichment with <300 ppmv of CH4 (2, 4, 20, 34). It has been suggested that periodic methanogenic events (9) or alternate substrates, such as methanol (4, 17), are necessary for growth and maintenance of the methanotrophs which consume atmospheric CH4 in soils. The results of the present study demonstrate that methanotrophs are more oligotrophic than previously believed but they do not contradict these theories. Our data suggest that the Km(app) value of known methanotrophic species is dependent on environmental conditions, especially the CH4 supply, and therefore that the low Km(app) values measured in upland soils do not necessarily imply that novel species of “atmospheric-methane oxidizers” exist.
In summary, we propose that organisms closely related to known type II methanotrophic species contribute to high-affinity atmospheric CH4 consumption in an organic soil and that the Km(app) value of methanotrophic organisms is determined by the conditions under which they are cultured, especially by the CH4 supply.
ACKNOWLEDGMENTS
P.F.D. was supported by stipends from the Max-Planck Gesellschaft (Germany) and Eco-Research Council (Canada). Portions of the investigation were supported by grants from the EC RTD Programme Biotechnology (contract BIO4-CT96-0419) and the Natural Sciences and Engineering Research Council of Canada (contract GP3252 to R.K.).
We thank Thomas Lukow and Sonja Fleissner for technical assistance.
REFERENCES
- 1.Bender M, Conrad R. Kinetics of CH4 oxidation in oxic soils exposed to ambient air or high CH4 mixing ratios. FEMS Microbiol Ecol. 1992;101:261–270. [Google Scholar]
- 2.Bender M, Conrad R. Effect of CH4 concentrations and soil conditions on the induction of CH4 oxidation activity. Soil Biol Biochem. 1995;27:1517–1527. [Google Scholar]
- 3.Benstead J, King G M. Response of methanotrophic activity in forest soil to methane availability. FEMS Microbiol Ecol. 1997;23:333–340. [Google Scholar]
- 4.Benstead J, King G M, Williams H G. Methanol promotes atmospheric methane oxidation by methanotrophic cultures and soils. Appl Environ Microbiol. 1998;64:1091–1098. doi: 10.1128/aem.64.3.1091-1098.1998. [DOI] [PMC free article] [PubMed] [Google Scholar]
- 5.Carlsen H N, Joergensen L, Degn H. Inhibition by ammonia of methane utilization in Methylococcus capsulatus (Bath) Appl Microbiol Biotechnol. 1991;35:124–127. [Google Scholar]
- 6.Conrad R. Capacity of aerobic microorganisms to utilize and grow on atmospheric trace gases (H2, CO, CH4) In: Klug M J, Reddy C A, editors. Current perspectives in microbial ecology. Proceedings of the Third International Symposium on Microbial Ecology. Washington, D.C: American Society for Microbiology; 1984. pp. 461–467. [Google Scholar]
- 7.Conrad R. Soil microorganisms as controllers of atmospheric trace gases (H2, CO, CH4, OCS, N2O, and NO) Microbiol Rev. 1996;60:609–640. doi: 10.1128/mr.60.4.609-640.1996. [DOI] [PMC free article] [PubMed] [Google Scholar]
- 8.Dunfield P, Knowles R. Kinetics of inhibition of methane oxidation by nitrate, nitrite, and ammonium in a humisol. Appl Environ Microbiol. 1995;61:3129–3135. doi: 10.1128/aem.61.8.3129-3135.1995. [DOI] [PMC free article] [PubMed] [Google Scholar]
- 8a.Dunfield, P., and R. Knowles. Unpublished data.
- 9.Dunfield P F, Topp E, Archambault C, Knowles R. Effect of nitrogen fertilizers and moisture content on CH4 and N2O fluxes in a humisol: measurements in the field and intact soil cores. Biogeochemistry. 1995;29:199–222. [Google Scholar]
- 10.Duxbury J M, Mosier A R. Status and issues concerning agricultural emissions of greenhouse gases. In: Drennen T E, Kaiser H M, editors. Agricultural dimensions of global climate change. Delray Beach, Fla: St. Lucie Press; 1993. pp. 229–258. [Google Scholar]
- 11.Felsenstein J. PHYLIP (phylogeny inference package), version 3.5c. Seattle: Department of Genetics, University of Washington; 1993. [Google Scholar]
- 12.Gulledge J, Doyle A P, Schimel J P. Different NH4+ inhibition patterns of soil CH4 consumption: a result of distinct CH4-oxidizer populations across sites? Soil Biol Biochem. 1997;29:13–21. [Google Scholar]
- 13.Gulledge J, Schimel J P. Low-concentration kinetics of atmospheric CH4 oxidation in soil and mechanism of NH4+ oxidation. Appl Environ Microbiol. 1998;64:4291–4298. doi: 10.1128/aem.64.11.4291-4298.1998. [DOI] [PMC free article] [PubMed] [Google Scholar]
- 14.Hanson R S, Netrusov A I, Tsuji K. The obligate methanotrophic bacteria Methylococcus, Methylomonas, and Methylosinus. In: Balows A, Trüper H G, Dworkin M, Harder W, Schleifer K H, editors. The prokaryotes. New York, N.Y: Springer Verlag; 1991. pp. 2350–2365. [Google Scholar]
- 15.Hanson R S, Hanson T E. Methanotrophic bacteria. Microbiol Rev. 1996;60:439–471. doi: 10.1128/mr.60.2.439-471.1996. [DOI] [PMC free article] [PubMed] [Google Scholar]
- 16.Holmes A J, Costello A, Lidstrom M E, Murrell J C. Evidence that particulate methane monooxygenase and ammonia monooxygenase may be evolutionarily related. FEMS Microbiol Lett. 1995;132:203–208. doi: 10.1016/0378-1097(95)00311-r. [DOI] [PubMed] [Google Scholar]
- 17.Jensen S, Priemé A, Bakken L. Methanol improves methane uptake in starved methanotrophic microorganisms. Appl Environ Microbiol. 1998;64:1143–1146. doi: 10.1128/aem.64.3.1143-1146.1998. [DOI] [PMC free article] [PubMed] [Google Scholar]
- 18.Joergensen L, Degn H. Mass spectrometric measurements of methane and oxygen utilization by methanotrophic bacteria. FEMS Microbiol Lett. 1983;20:331–335. [Google Scholar]
- 19.Kightley D, Nedwell D B, Cooper M. Capacity for methane oxidation in landfill cover soils measured in laboratory-scale microcosms. Appl Environ Microbiol. 1995;61:592–601. doi: 10.1128/aem.61.2.592-601.1995. [DOI] [PMC free article] [PubMed] [Google Scholar]
- 20.King G M, Schnell S. Effect of increasing atmospheric methane concentration on ammonium inhibition of soil methane consumption. Nature (London) 1994;370:282–284. [Google Scholar]
- 21.Koch A L, Wang C H. How close to the theoretical diffusion limit do bacterial uptake systems function? Arch Microbiol. 1982;131:36–42. doi: 10.1007/BF00451496. [DOI] [PubMed] [Google Scholar]
- 22.Liesack W, Finster K. Phylogenetic analysis of five strains of gram-negative, obligate anaerobic, sulfur-reducing bacteria and the description of Desulfuromusa gen. nov., including Desulfuromusa kysingii sp. nov., Desulfuromusa bakii sp. nov., and Desulfuromusa succinoxidans sp. nov. Int J Syst Bacteriol. 1994;44:753–758. [Google Scholar]
- 23.Lipscomb J D. Biochemistry of the soluble methane monooxygenase. Annu Rev Microbiol. 1994;48:371–399. doi: 10.1146/annurev.mi.48.100194.002103. [DOI] [PubMed] [Google Scholar]
- 24.Maidak B L, Olsen G J, Larsen N, Overbeek R, McCaughey M J, Woese C. The RDP (ribosomal database project) Nucleic Acids Res. 1997;25:109–110. doi: 10.1093/nar/25.1.109. [DOI] [PMC free article] [PubMed] [Google Scholar]
- 25.McDonald I R, Kenna E M, Murrell J C. Detection of methanotrophic bacteria in environmental samples with the PCR. Appl Environ Microbiol. 1995;61:116–121. doi: 10.1128/aem.61.1.116-121.1995. [DOI] [PMC free article] [PubMed] [Google Scholar]
- 26.McDonald I R, Murrell J C. The particulate methane monooxygenase gene pmoA and its use as a functional gene probe for methanotrophs. FEMS Microbiol Lett. 1997;156:205–210. doi: 10.1111/j.1574-6968.1997.tb12728.x. [DOI] [PubMed] [Google Scholar]
- 27.McDonald I R, Murrell J C. The methanol dehydrogenase structural gene mxaF and its use as a functional gene probe for methanotrophs and methylotrophs. Appl Environ Microbiol. 1997;63:3218–3224. doi: 10.1128/aem.63.8.3218-3224.1997. [DOI] [PMC free article] [PubMed] [Google Scholar]
- 28.Moré M I, Herrick J B, Silva M C, Ghiorse W C, Madsen E L. Quantitative cell lysis of indigenous microorganisms and rapid extraction of microbial DNA from sediment. Appl Environ Microbiol. 1994;60:1572–1580. doi: 10.1128/aem.60.5.1572-1580.1994. [DOI] [PMC free article] [PubMed] [Google Scholar]
- 29.Nesbit S P, Breitenbeck G A. A laboratory study of factors affecting methane uptake by soils. Agric Ecosys Environ. 1992;41:39–54. [Google Scholar]
- 30.Reeburgh W S, Whalen S C, Alperin M J. The role of methylotrophy in the global methane budget. In: Murrell J C, Kelly D P, editors. Microbial growth on C1 compounds. Andover, United Kingdom: Intercept Ltd.; 1993. pp. 1–14. [Google Scholar]
- 31.Rodriguez-Tomé P, Stoehr P J, Cameron G N, Flores T P. The European Bioinformatics Institute (EBI) databases. Nucleic Acids Res. 1996;24:6–12. doi: 10.1093/nar/24.1.6. [DOI] [PMC free article] [PubMed] [Google Scholar]
- 32.Roslev P, King G M. Survival and recovery of methanotrophic bacteria starved under oxic and anoxic conditions. Appl Environ Microbiol. 1994;60:2602–2608. doi: 10.1128/aem.60.7.2602-2608.1994. [DOI] [PMC free article] [PubMed] [Google Scholar]
- 33.Saitou N, Nei M. The neighbor-joining method: a new method for reconstructing phylogenetic trees. Mol Biol Evol. 1987;4:406–425. doi: 10.1093/oxfordjournals.molbev.a040454. [DOI] [PubMed] [Google Scholar]
- 34.Schnell S, King G M. Stability of methane oxidation capacity to variations in methane and nutrient concentrations. FEMS Microbiol Ecol. 1995;17:285–294. [Google Scholar]
- 35.Segel I H. Enzyme kinetics: behavior and analysis of rapid equilibrium and steady-state enzyme systems. New York, N.Y: John Wiley & Sons, Inc.; 1993. [Google Scholar]
- 36.Semrau J D, Chistoserdov A, Lebron J, Costello A, Davagnino J, Kenna E, Holmes A J, Finch R, Murrell J C, Lidstrom M E. Particulate methane monooxygenase genes in methanotrophs. J Bacteriol. 1995;177:3071–3079. doi: 10.1128/jb.177.11.3071-3079.1995. [DOI] [PMC free article] [PubMed] [Google Scholar]
- 37.Strunk O, Ludwig W. ARB: a software environment for sequence data. Munich, Germany: Technische Universität München; 1996. [Google Scholar]
- 38.Van de Peer Y, Nicolaï S, De Rijk P, De Wachter R. Database on the structure of small ribosomal subunit RNA. Nucleic Acids Res. 1996;24:86–91. doi: 10.1093/nar/24.1.86. [DOI] [PMC free article] [PubMed] [Google Scholar]
- 39.Whalen S C, Reeburgh W S, Sandbeck K A. Rapid methane oxidation in a landfill cover soil. Appl Environ Microbiol. 1990;56:3405–3411. doi: 10.1128/aem.56.11.3405-3411.1990. [DOI] [PMC free article] [PubMed] [Google Scholar]


