

Abstract
Acyclovir and similar nucleoside analogs form an essential frontline treatment for various herpesvirus infections of the eye. However, these drugs have low ocular retention when delivered topically and need to be administered several times every day. We have previously demonstrated that acyclovir loaded into activated carbon can be used to significantly decrease dosage frequency in a murine model of ocular infection. In this study, we demonstrate that other nucleoside analogs such as ganciclovir, penciclovir and famciclovir have excellent loading and release profile similar to acyclovir. Similarly we also demonstrate that nucleoside analog loaded carbons termed DECON are effective at very low concentrations in treating active viral infection of human corneal epithelial cells. In this study, using a variety of techniques to evaluate corneal dryness, nerve sensitivity, intraocular pressure, corneal thickness, and somatic inflammation, we report that DECON is well tolerated after administration three times daily over the course of four weeks.
Keywords: Activated carbon, herpes simplex virus, topical delivery, acyclovir, nucleoside analogs, ocular toxicity
Graphical Abstract

1. Introduction
Herpes simplex virus type-1 (HSV-1) is the leading cause of infectious blindness in the developed world1–9. Recent estimates place seroprevalence of the virus at 48.1% in the United States 10, 11. Although this prevalence appears to have decreased slightly in recent years, HSV-1 has remained a foremost area of research in the field of virology. While initial infection gives rise to a number of relatively benign diseases including cold sores and blisters, the virus establishes life-long latency in the sensory ganglia when left unchecked 12. From this point, it is not uncommon for the virus to reactivate spontaneously or by physical or mental stress to cause more serious complications including ulcerative and/or stromal keratitis 13. The host response to these recurrent infections may ultimately lead to blindness due to irreversible scarring and neovascularization 13.
The current established method of treatment via nucleoside analog acyclovir (ACV) shows significant and effective viral suppression 14–16. However, systemic ACV administration remains an untenable long-term solution because of its renal toxicity, diminishing long-term efficacy and emergence of resistant viral strains 17–20. Importantly, ACV is ineffective when administered topically and hence trifluridine, an analog, is prescribed for topical treatment of ocular keratitis 21, 22. However, trifluridine needs to be administered up to 9 times daily to ensure effective ocular retention of the drug 23. Antiviral alternatives including penciclovir (PCV), ganciclovir (GCV), and famciclovir (FCV) provide protection similar to ACV, but these are subject to their own limitations, none proving reliable substitutes for topical administration as they stand currently24–26. Given that there are currently no viable vaccines to prevent HSV-1, it is important to develop safe and effective topical delivery agents for nucleoside analogs that can improve upon existing treatment modalities by minimizing the drawbacks associated with these drugs.
Outlining systems which deliver drugs to the target tissue in new ways through the development of novel drug platforms is one area of research which may resolve some of the limitations presented by current treatments. Candidates for ocular drug platforms are specifically desirable as they are convenient and high in patient compliance 27. However, because of the unique and sensitive anatomy of the eye, platforms must demonstrate several specific qualities before they might be considered viable. Namely, those platforms should circumvent the protective aspects of the ocular surface which inhibit the absorption of administered drugs and account for the reduction in uptake via the blink reflex28. New platforms should improve drug bioavailability by increasing retention time, demonstrate biocompatibility by proving themselves nontoxic, and show tolerability when translated to an in vivo model29–31. Developing approaches include microemulsions, in situ forming gels, and nanoparticle systems, but the research space can only be improved by the inclusion of more delivery methods32–34
Our lab has previously uncovered the potential use of drug-encapsulated carbon (DECON) as a sustained drug delivery platform27. Unlike traditional methods of topical treatment that suffer from low retention time on mucosa, DECON showed sustained potency in vivo--effectively reducing dosage frequency by 6 fold 35. Having demonstrated this, we are now interested in elucidating the other qualities of this carbon. That is, we have had yet to inquire about the versatility of DECON loading capabilities to the nucleoside analogs of ACV such as PCV, GCV, and FCV. We have also yet to elucidate the drug loading and release profile and deduce the toxicity of the platform when translated to a living model. Therefore, in the present study, after proving efficacy of the loaded DECON particles at curbing HSV-1 infection, we investigated the loading and release profile of DECON via mass spectrometry and NMR for DECON loaded with ACV and its analogs. We also use a variety of techniques including OCT imaging, esthesiometry, and tonometry to assess in vivo toxicity.
2. Materials and methods
2.1. Materials
A list of all the materials used in this article is mentioned in the table below.
| Name of Material | Company | Catalog Number |
|---|---|---|
| Phosphate Buffer Saline - PBS | GIBCO | 10010072 |
| Dulbecco’s modified Eagle’s medium - DMEM | GIBCO | 41966029 |
| Minimum Essential Medium - MEM | GIBCO | 11095080 |
| OptiMEM | GIBCO | 31985047 |
| Trypsin-EDTA (0.05%), phenol red | GIBCO | 25-300-062 |
| Fetal bovine serum (FBS) | Sigma Aldrich | F2442 |
| Penicillin/streptomycin (P/S) | GIBCO | 15140148 |
| Human corneal epithelial cells (HCEs) - passaged in MEM supplemented with 10% FBS and 1% P/S | K. Hayashi (National Eye Institute) | RCB1834 HCE-T |
| Vero cells passaged in DMEM supplemented with 10% FBS and P/S | American Type Culture Collection ATCC | CRL-1586 |
| HSV-1 17GFP | grown in house | - |
| Crystal violet | Sigma Aldrich | C6158 |
| Activated carbon | US Research Nanomaterials, Inc. | US1076 |
| Famciclovir | Selleckchem | 103541–044 |
| Ganciclovir | Selleckchem | 103539–948 |
| Penciclovir | Selleckchem | 103544–174 |
| Acyclovir | Selleckchem | 101756–318 |
2.21. Drug loading studies
Activated carbon was pre-weighed and UV sterilized overnight prior to making a 10 mg/mL sterile stock solution in PBS. ACV, PCV, GCV and FCV stock solutions were prepared in DMSO at a concentration of 50 mM and stored as small aliquots of 10 μL at −80 °C until use. One mL of 1mg/mL solution of activated carbon was prepared from the stock in micro-centrifuge tubes followed by the addition of 10 μL of ACV, PCV, GCV, FCV or DMSO. These tubes were incubated at room temperature overnight on a rocker to enable drug loading. The following morning samples were centrifuged to precipitate activated carbon particles and supernatant was sent for mass spectrometry analysis to assess extent of drug loading. Drug loading studies were performed in triplicate to assess the deviation between replicates.
2.22. Nuclear magnetic resonance analysis
To a 0.1 mg/mL solution of activated carbon in deuterated water, ACV was added such that the final concentration of ACV was 2 mM. This solution was incubated at room temperature for approximately 1 hour prior to loading the sample in to a NMR tube and prepped for one dimensional proton spectrum (Bruker 600MHz AVANCE NMR Spectrometer). After initial shimming, lock, tune and proton pulse calibration, the samples were analyzed. This was repeated at 24 and 48 h post mixing ACV with activated carbon to understand any significant changes to the ACV spectrum.
2.3. Drug release studies
Drug loaded activated carbon or DECON particles were suspended in PBS for a period of 24, 48, 72 or 96 hours at room temperature. At the suggested time points, samples were centrifuged to separate the carbon from the supernatant and the supernatant was sent for mass spectrometry analysis to determine the extent of drug release over the given time point. All the experiments were performed in triplicate to assess the standard deviation of the experiment.
2.4. Mass spectrometry analysis
Mass spectrometry analysis was performed by the Mass Spectrometry Core in Research Resources Center of University of Illinois at Chicago. Acyclovir (ACV), Famciclovir (FCV), Ganciclovir (GCV) and Penciclovir (PCV) were supplied as a solution of 0.5mM. Initial stock solution of the 4 analytes, as a 1μM solution was made by diluting with 50% methanol in water. It was further diluted to 500nM, 200nM, 100nM, 50nM, 25nM, 10nM and 5nM using 50% MeOH in water as the spiking standards to prepare the standard curve. (All solvents were LCMS grade). Lysergic acid diethylamide-D3 (LSD-D3) was used as the IS, purchased from Sigma-Aldrich as a solution of 100 μg/mL in Acetonitrile (ACN, Part number: L-002). It was diluted to 10 ng/mL as the working solution for standard curve/sample preparation. Calibrators used to construct the standard curve were prepared by spiking in the standard spiking solution and IS working solution (final IS concentration 1ng/mL). ACV-DECON, PCV-DECON, GCV-DECON and FCV-DECON were diluted in 50% methanol to get to the linear range for detection. Samples for LC/MS were prepared by mixing the sample and IS working solution. 5μL of the calibrator/sample was injected into an AB SCIEX 5500 QTRAP coupled with Agilent 1290 UPLC system. All samples were eluted by Agilent Poroshell column 120 EC-C18 2.7 μm, 2.1 × 100 mm (P/N 695775–902) with a flow rate of 300 μL/min. The column compartment was kept at 40 °C. LC elution started with 95% mobile phase A (0.1% FA in H2O) for 1 min, followed by a linear gradient increase of mobile phase B (0.1% FA in ACN) from 5% to 90% in 4 minutes. Column was washed with 90% B for 2 min then re-equilibrated back to the initial condition (95% A) for 3 minutes. The auto-sampler was maintained at 10 °C. MS data was acquired by MRM scan at positive mode. The ESI spray voltage and source temperature were kept at 4.5 kV and 500 °C respectively. A standard curve of the analytes (ACV, PCV, GCV and FCV) was plotted with the concentration as the X axis and the peak area ratio of analytes/LSD-D3 as the Y axis (Figure 1, 2, 3 and 4). The accuracy of each calibrator was within the acceptable range of 15%. The lower limit of quantitation (LLOQ) and limit of detection (LOD) was tabulated and good concentration-response linearity was established over the range from 5 femto moles to 1 pico mole on the column.
Fig 1. Evaluation of drug loading and release from DECON.
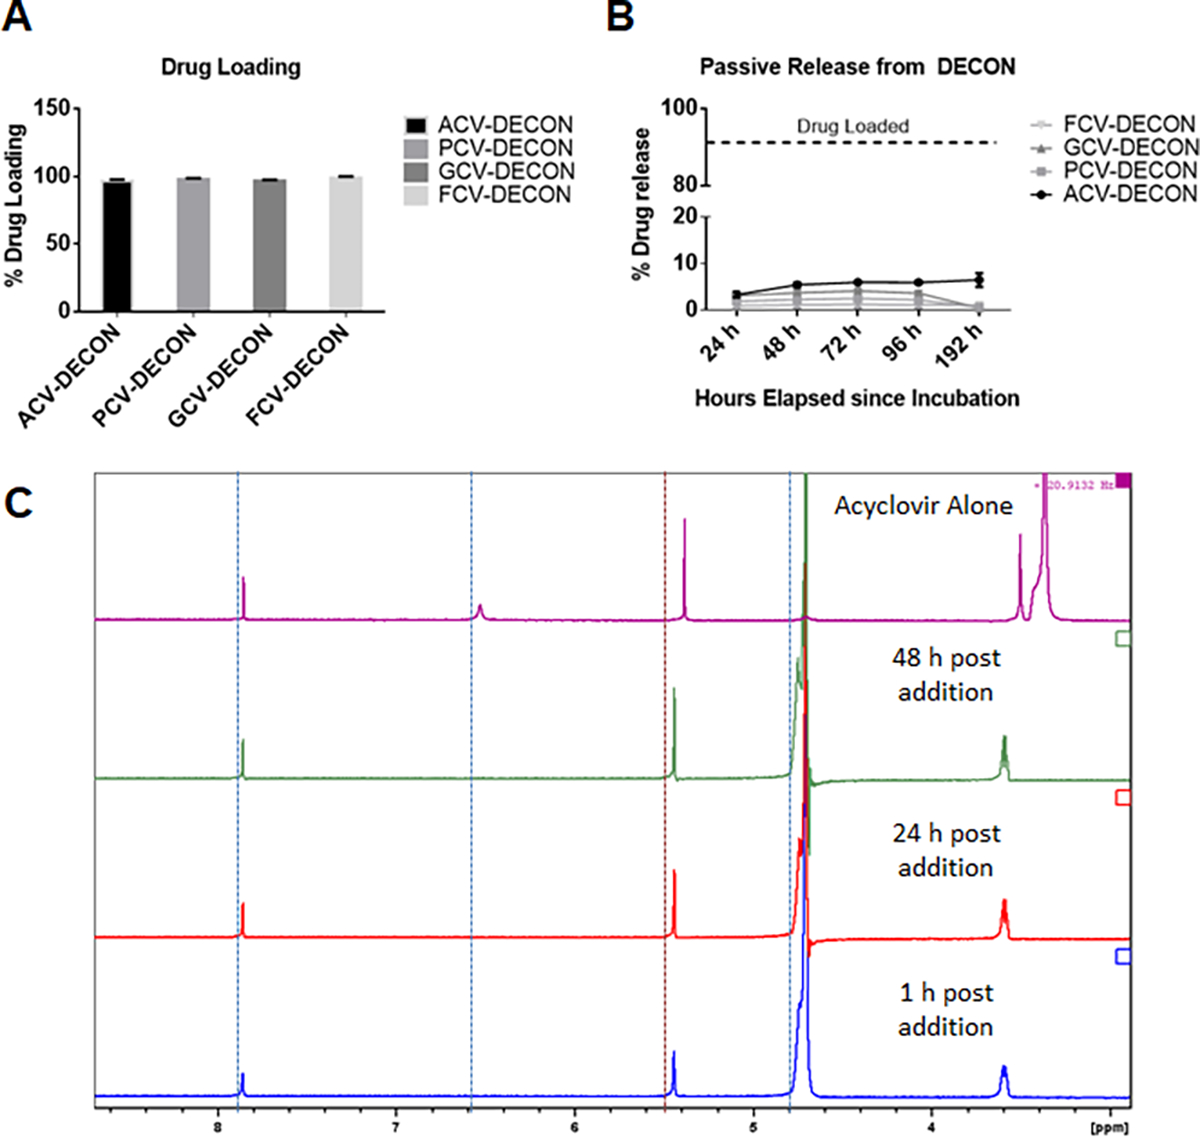
10 μL of 50 mM ACV, PCV, GCV or FCV were incubated with 0 or 1 mg/mL of activated carbon particles dispersed in PBS at room temperature overnight. (A) Post incubation, the activated carbon was separated from the PBS solution by centrifugation. This supernatant contained any drug that was not loaded into the carbon and sent for mass spectrometric evaluation. Triplicate results showing extent of drug loaded onto the carbon by the evaluation of non-loaded drug in the supernatant. (B) Activated carbon particles were washed with PBS 3 times prior to resuspending them in fresh PBS for a period of 24, 48, 72 or 96 hours. The samples at the specified time were centrifuged at 10,000g and the supernatant was evaluated for the extent of drug released from the carbon via mass spectrometry. (C) One dimensional proton spectrum of residual acyclovir in solution of D2O after the addition of activated carbon. The 1D proton spectra are displayed in order, from bottom to top: 2 mM acyclovir in the presence of 0.1 mg/mL activated carbon at 1, 24, and 48 hours after mixing. At the very top, is the 1D proton spectrum of acyclovir in D2O alone.
Fig 2. In vitro antiviral activity of ACV, PCV, GCV and FCV loaded DECON.
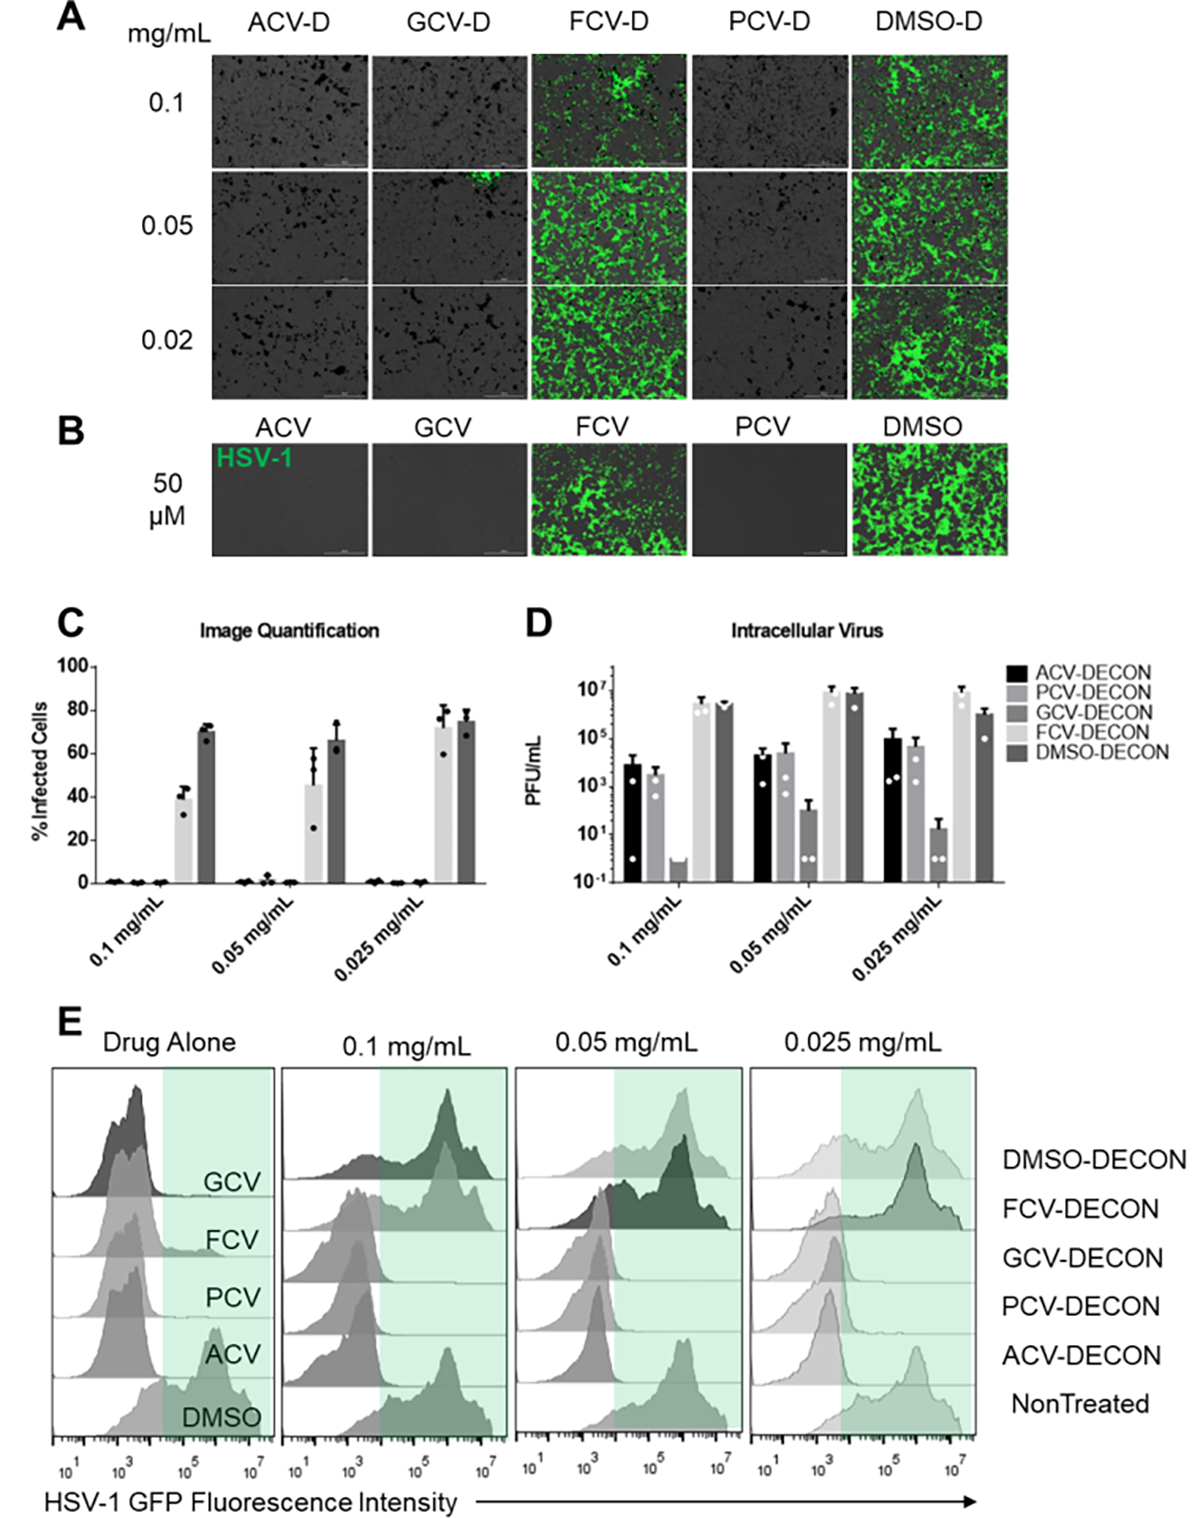
Human corneal epithelial (HCE) cells were infected with HSV-1 17 GFP, a GFP producing reporter virus at an MOI of 0.1. ACV, GCV FCV or PCV loaded DECON along with DMSO loaded DECON at shown concentrations was added therapeutically at 2 hours post infection and incubated for the next 22 hours.(A) Representative fluorescent images showing extent of infected cells (green) in each treatment group. (B) As a positive control, ACV, GCV, FCV and PCV were added at 2 hours post infection and imaged at 24 hours post infection. (C) Quantitative analysis of the fluorescence seen from 3 images taken from triplicate experiments. (D) Plaque assay data representing extent of infectious virus present in the cells post treatment with various DECON particles at different concentrations. (E) Flow cytometry data represented as histograms showing extent of infected cells based on GFP fluorescence recorded due to HSV-1 infection. Green panel in each of the data sets segregates the HSV-1 positive population from those non-infected.
Figure 3. DECON treatment does not significantly impact corneal dryness.
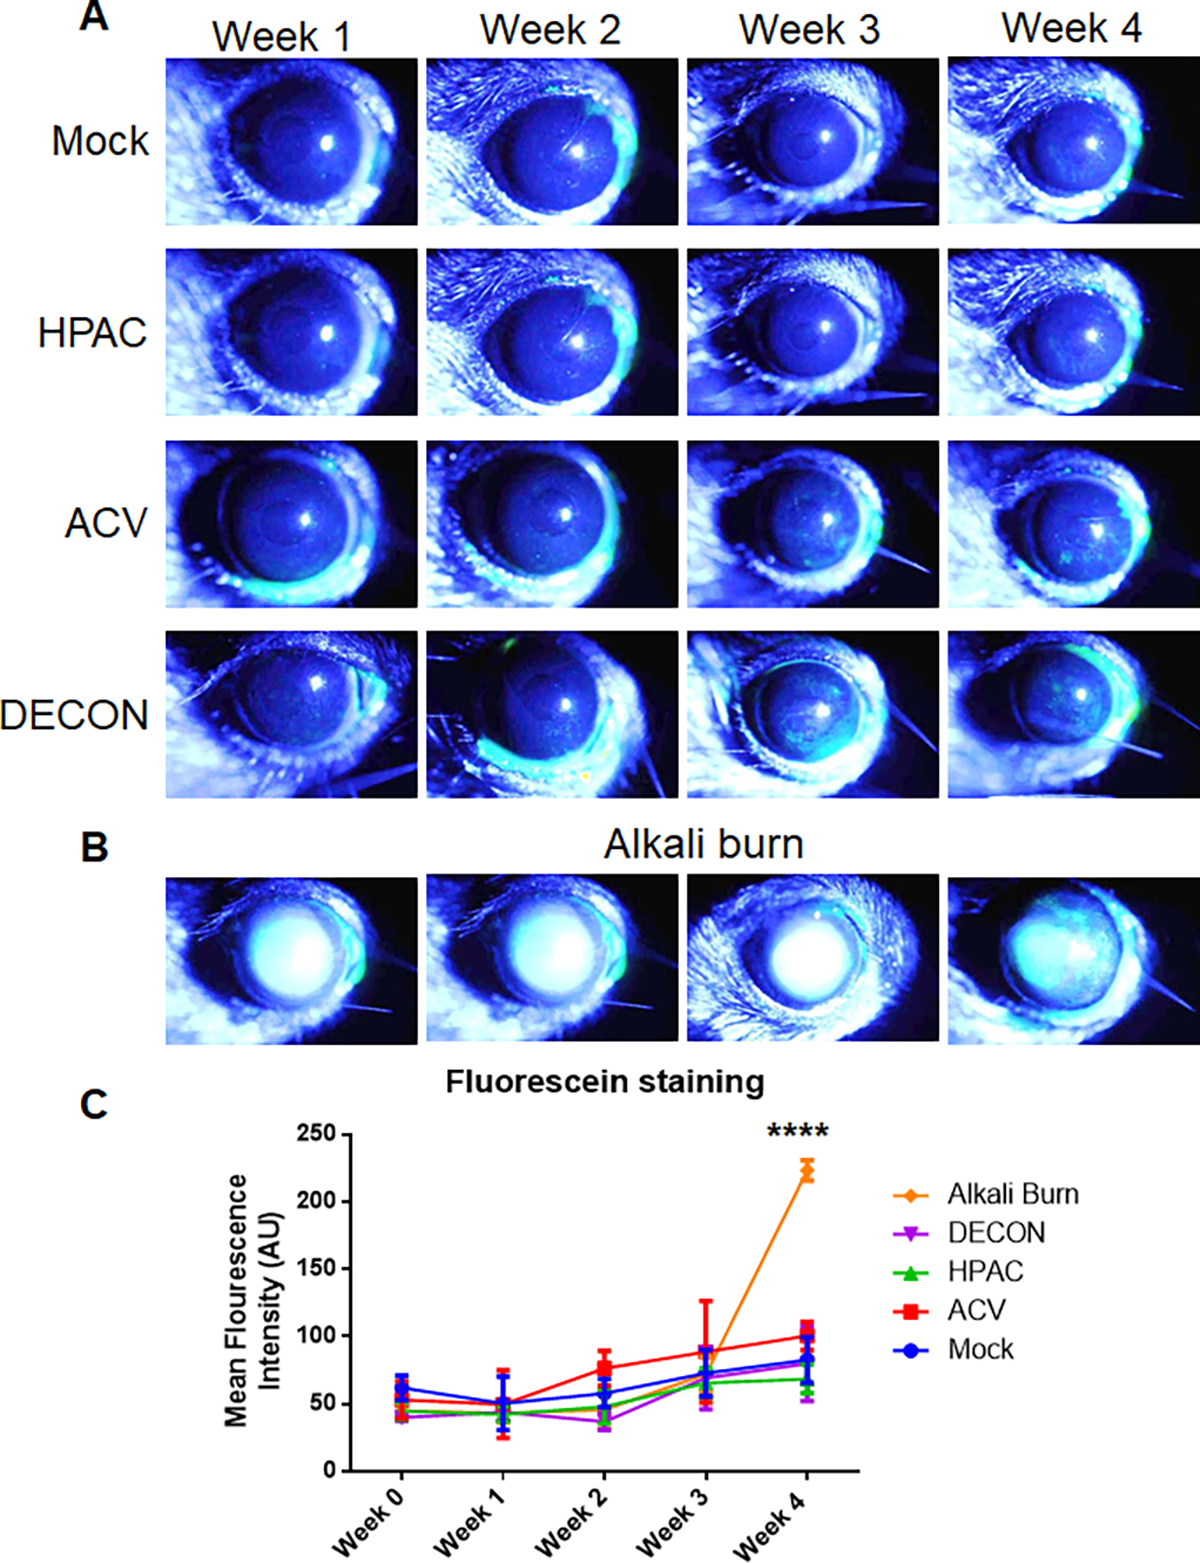
Over 4 weeks, DECON, HPAC, ACV, and PBS (mock) were administered 3 times a day. NaOH was introduced during week 4 to a separate group of mice as a control. (A) Anesthetized mice were placed in a holder and imaged weekly with a slit-lamp to visualize the whole corneas. A drop of fluorescein dye was instilled on the corneal surface followed by manual blinking of the eye. The eyes were then washed with artificial tears, dried and representative corneal images were procured in the GFP channel. Green staining represents fluorescein retention on the ocular surface which is an indirect indicator of corneal dryness. (B) An identical imaging process was followed for the NaOH treated mice, one week after the first administration of base. Images in A and B have been over exposed to be able to view minute differences between the groups. (C) Quantitative analysis of the fluorescein dye was performed using an unbiased method in ImageJ software. The values were interpreted such that greater mean fluorescence intensity (AU) was considered drier.
Figure 4. DECON treatment has no effect on ocular sensitivity or intraocular pressure.
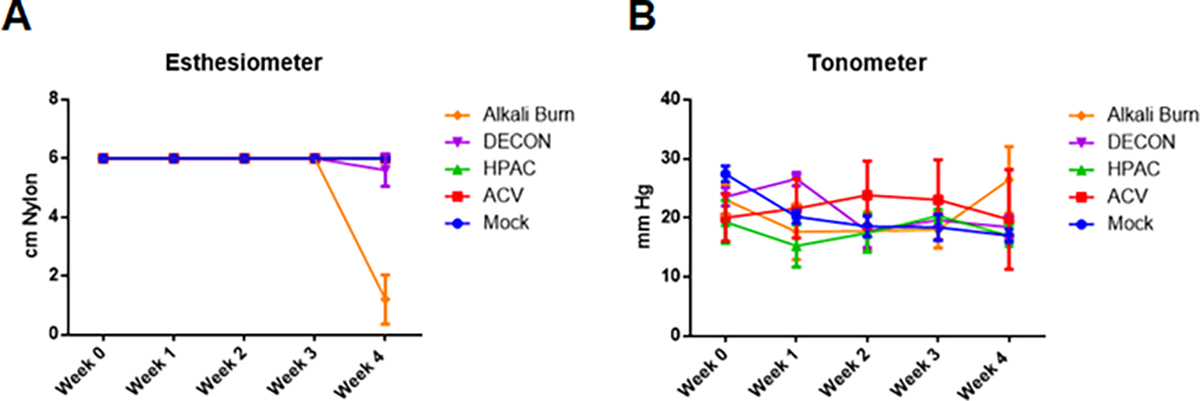
Over 4 weeks, DECON, HPAC, ACV, and PBS (mock) were administered 3 times a day. NaOH was introduced during week 4 to a separate group of mice as a control. (A) Once a week, corneal sensitivity was assessed with an esthesiometer on wake mice. Values were interpreted such that a lower number indicated lower corneal sensitivity. (B) Once a week, intraocular pressure (IOP) was measured with a tonometer, averaged across triplicates. The device was calibrated specifically for use in murine models such that an increase in mmHg indicated an increase in IOP.
2.5. HSV-1 infection of HCEs
HCEs were seeded in a 24 well plate and waited overnight to reach confluency. HCEs were infected with 0.1 multiplicity of infection (MOI) HSV-1 17 GFP for a period of 2 h in OptiMEM. Dilutions of various DECON particles were prepared in whole MEM in parallel and added to cells after the virus incubation. At 24 hours post infection (hpi), cells were imaged using BioTek Lionheart LX instrument, followed by their processing for plaque assay analysis or flow cytometry analysis.
2.6. Plaque assay
Plaque assay was performed using methods mentioned previously36. Infected cells were ultrasonicated using a probe sonicator on ice followed by 10-fold serial dilution in micro-centrifuge tubes. Samples were then overlaid on Vero cells for 2 hours to facilitate infection followed by replacing the media with 5% methylcellulose laden DMEM. Cells were incubated for 3 days before they were fixed using 100% methanol and stained with crystal violet. Plaques were counted manually and entered into the statistical analysis software to visualize the results.
2.7. Flow cytometry
Flow cytometry was performed using protocols described previously 37. Briefly, HSV-1 17 GFP infected cells treated with DECON were detached from the plate using enzyme free Hank’s buffer solution. Given that infected cells fluoresce in the GFP/FITC channel, flow cytometry can be used a means to analyze how many cells are infected in a given population. Cells were washed with PBS and fixed in 4% PFA prior to passing through a 700 micron filter. Cells were washed and resuspended in fresh PBS prior to analyzing them using BD Accuri C6 plus flow cytometer machine. Dead and clumped cells were gated out and a minimum of 10,000 events were collected for each of the gated samples. FlowJo software (version 6) was used to analyze and visualize the results as a histogram with GFP fluorescence intensity in the X axis.
2.8. Murine mode of treatment administration
Animals were handled according to the institutional animal care and use committee (IACUC) protocols endorsed by the University of Illinois at Chicago (animal care committee #20–065). This treatment also followed the guidelines indicated by the association of research in vision and ophthalmology (ARVO) under the Statement for the Use of Animals and Ophthalmic and Vision Research, emphasizing the importance of humane, responsible, and ethical use of laboratory animals in research. Eight week old male C57BL6 mice were used in our studies. Three times a day for four weeks, mice were treated with 5 μL of PBS, 50 μM ACV, 0.1 mg/mL highly porous activated carbon (HPAC), or 0.1 mg/mL ACV loaded DECON. A fifth group of mice was treated with 0.5 N NaOH in the fourth week alone to simulate progressive deterioration of the eye due to toxicity. Sodium hydroxide induced corneal burn model is a model of ocular surface diseases commonly used to study pathological and physiological changes induced by injuries, including the use of toxic substances to the eye38–40. Murine eyes were treated with 0.5% proparacaine hydrochloride for 1 minute prior to the addition of alkali solution. The alkali solution was added to a 2 mm square Whatman-filter paper prior to placing the filter paper the cornea for exactly 10 seconds. The filter paper was quickly removed, and any residual solution was removed by washing the cornea with 10 mL of PBS for 30 seconds. Animals were observed every day for a period of 7 days while being treated with a topical anesthetic and antibiotic (3% Gentamicin solution). Ocular toxicity was monitored once per week by a variety of methods listed below. At the end of 4 weeks, mice were euthanized. Similar to dosage mentioned above 8 week old female C57BL6 mice were administered with PBS, HPAC, ACV or ACV loaded DECON 3 times a day intravaginally to investigate the tolerability of the drugs in vivo. At the end of 4 weeks, mice were euthanized and the vaginal tissue was collected to histological analysis.
2.9. Ocular toxicity evaluation
Ocular toxicity via slit-lamp imaging, optical coherence tomography (OCT), esthesiometry, and tonometry was conducted once per week under anesthesia 41. Eight week old C57BL6 mice were administered PBS (mock), (50 μM) ACV, (0.1 mg/mL) HPAC, or (0.1 mg/mL) ACV loaded DECON to the right eye, with their left eyes remaining untreated.
2.91. Esthesiometry
A manual esthesiometer was employed in order to examine nerve sensitivity (12/100 mm, LUNEAU SAS, France). Sensitivity was operationalized by comparing the observed length of the esthesiometer’s nylon fiber when a blink response was elicited from wake mice to an expected length in a healthy eye42. At full length, 6 cm, the nylon fiber was pressed to the center of the cornea, a stimulus that should initiate a blink reflex from the mouse. If no response was given, the fiber was shortened by 0.5 cm, and the process was repeated. The length at which a blink was given was recorded, and the mouse was then categorized according to the following: 5.5–6 cm meant no sensitivity loss, 3.5–5.5 cm meant moderate sensitivity loss, and less than 3.5 cm meant severe sensitivity loss.
2.92. Tonometry
A tonometer (Icare® TONOLAB, TONOVET) was used to evaluate intraocular pressure (IOP)43. Prior to data collection, the device which has been pre-calibrated to murine models was switched on and the tonometer probe was placed inside the specified slot. Triplicate measurements were taken on wake mice by treatment group, and tips were changed between each sample set to avoid cross-contamination.
2.93. Slit-lamp biomicroscopic imaging44
Once the esthesiometry and tonometry evaluation was performed on wake mice, they were anaesthetized via intraperitoneal injection of a cocktail of ketamine (100 mg/kg) and xylazine (5 mg/kg). Anesthetized mice were placed onto a holder and positioned in such a way that the entire cornea could be visualized under the slit lamp biomicroscope. The slit-lamp bio microscope (Haag-Streit AG, Koeniz, Switzerland) was set to take a burst of images at 10X magnification. In this way, drying of the imaged eye was avoided. 10 μL of 1% fluorescein dye was added to murine eyes and were blinked manually 5 times prior to washing the eyes with hanks balanced salt solution. The animal eyes were then imaged in the GFP channel to capture fluorescein staining on the corneal surface. Corneal images were processed in ImageJ software to evaluate the extent of staining on individual eyes.
2.94. Optical coherency tomography (OCT)
The anesthetized mice were probed for corneal thickness using a Phoenix Micron IV (Phoenix Technology group, CA, USA) OCT instrument45. Mice were placed on a movable pedestal and subsequently moved close to the OCT probe. At the beginning of experimentation, the light intensity, focus, angle, and contrast were standardized and held constant throughout the entirety of the four week data collection process. Following image capture, the corneal thickness by epithelial, by stromal, and by gross were measured in order to assay for inflammation. Less than 5% variation in thickness was considered normal, 5 to 10% variation was considered moderately inflamed, and greater than 10% variation was considered severely inflamed.
2.10. Statistical analysis
All statistical analysis performed in this manuscript was carried out in GraphPad Prism software (Version 6). Flow cytometry histograms were produced in FlowJo software (Version 10). Error bars shown in the figures represent ± standard deviation from three independent measurements. Asterisks denote a significant difference, as determined by One-Way ANOVA or Two-way ANOVA tests: *p < 0.05; **p < 0.01; ***p < 0.001; no symbol represents non-significant results.
3. Results and discussion
3.1. Activated carbon has very high loading efficiency for all nucleoside analogs
Similar to the experiments previously reported by our group 35, 1 mg of activated carbon was loaded with either 112 mg of ACV, 126 mg of PCV, 127 mg of GCV or 160 mg of FCV by adding 10 μL of 50 mM stock solutions to 1 mL of 1mg/mL activated carbon. After incubating the solutions overnight, carbon-free supernatants were analyzed for the absolute quantity of the nucleoside analogs via mass spectrometry. Mass spectrometry data revealed that 96.7±0.91% of ACV, 98.1±0.54% of PCV, 96.8±0.57% of GCV and 99.02±0.79% of FCV were loaded into activated carbon (Figure 1A).
3.2. Evaluation of passive drug release from activated carbon
Next, we wanted to determine whether the drug loaded onto the carbon was stable and if any of it released over a period of 4 days. In our previous study, we demonstrated that a single dose of ACV loaded DECON can inhibit viral replication for a period of 2 days. Hence we hypothesized that DECON was able to stably remain on the corneal surface and elute the drug. Our release studies performed for 4 days revealed that less than 10% of the total drug was eluted into the suspended solution and the elution amount remained constant even after four days. The released amounts were 5.3±0.48% for ACV, 2.2±0.63% for PCV, 3.6±0.67% for GCV and 1.1±0.93% for FCV.
These results correlated with our NMR spectra showing lower ACV signal in ACV and activated carbon mixed samples (Figure 1C). The large peak just to the right of the 5.0 ppm mark is residual H2O signal and should be disregarded. The three remaining, smaller peaks originate from protons found in acyclovir. A very slight increase in signal intensity is observed over a time course from 1, 24 to 48 hours (from bottom to top). The three remaining, smaller peaks originate from protons found in acyclovir. Specifically, the signals near 5.4 and 3.6 ppm arise from the –CH2− groups in the moiety linked to the guanosine ring. Relative to the top spectrum, the shift of these two signals suggest that this segment or portion of acyclovir interacts with or is bound to AC. However, this does not exclude the interaction of the guanosine heterocyclic ring. The presence of only a single observable proton of the heterocyclic ring makes it difficult to judge the extent of interaction between AC and the guanosine group or acyclovir. While we do not completely understand the interaction between ACV and activated carbon, the NMR spectrum suggests the adsorption of ACV might be dependent on its -CH2− side chain in the guanosine ring.
3.3. ACV, PCV, GCV and FCV loaded DECON show significant antiviral activity in vitro
Given the low drug elution ability of DECON particles, we wanted to understand whether these particles when presented to cells would release the drug at a concentration that was antiviral in nature. To our surprise, GCV and PCV loaded DECON (GCV-D, PCV-D) showed excellent antiviral activity similar to ACV loaded DECON (ACV-D) at all the three concentrations tested (0.1, 0.05 and 0.025 mg/mL) when infected with a GFP reporter virus analyzed through fluorescence imaging (Figure 2A). FCV loaded DECON (FCV-D) on the other hand, as expected had lower yet significant antiviral activity. FCV is a prodrug that is converted to PCV upon liver metabolism and hence the lower efficacy of the antiviral drug alone and the DECON loaded version as well (Figure 2B). Plaque assays conducted using these samples showed significant decrease in viral load for GCV-D and PCV-D in addition to ACV-D with PCV-D showing the highest activity at all three concentrations (Figure 2D). These results were further confirmed by performing a flow cytometry based assay which also showed that ACV, GCV and PCV loaded DECON were effective at inhibiting virus induced GFP production at all the concentrations tested (Figure 2E). FCV-D showed concentration dependent antiviral activity, albeit at a lower efficacy than that of other drugs tested.
3.4. Treatment with DECON does not contribute to corneal dryness
While DECON treatment is protective when administered therapeutically on murine corneal tissue, the safety and tolerability of DECON remains to be tested. In this regard, we dosed mice 3 times daily for 4 weeks topically on the corneal surface at a concentration of 0.1 mg/mL. Every week, we evaluated the tolerability using clinically relevant metrics. One of the metrics was to evaluate corneal dryness. To evaluate corneal dryness, we used slit-lamp imaging assisted by a fluorescein stain (Fig. 3A). Starting in the third week, we introduced NaOH as a second control. While treatment with PBS was expected to result in a normally hydrated cornea, i.e., no treatment, the NaOH control was expected to induce severe corneal dryness (Fig. 3B). Ultimately, while all groups varied significantly from this “alkali burn” control group, no significant differences in staining were observed amongst the four other groups. During the measurement taking process, the murine eyes were manually blinked 5 times to ensure no dryness was occurring apart from what would be caused by the treatment. The final results indicated that there was no systematic dryness caused by the HPAC particle, acyclovir, or their derivative, the DECON particle (Fig. 3C).
3.5. Long-term exposure to DECON has no marked effects on nerve sensitivity or intraocular pressure
Another metric that was used to evaluate corneal tolerability was to check for loss of sensation on the corneal surface. Once per week, wake mice were tested for their corneal sensitivities with an esthesiometer outfitted with a nylon thread probe tip. For each mouse, the thread was extended to 6 cm and gently pressed to the center of the cornea, intending to elicit a blink response. The initiation of a blink response indicated sensitivity to that stimulus level while unsuccessful initiation resulted in a re-test after the thread length was reduced by 0.5 cm. For a period of 3 weeks, we observed no change in corneal sensitivity for murine corneas treated with DECON, HPAC, or ACV when compared with the PBS control (Fig. 4A). In the 4th week, a slight decrease in sensitivity was observed in the DECON treatment group, but this drop was not statistically significant. All treatment groups differed significantly from the alkali burn group which experienced a dramatic loss in sensitivity in the week the NaOH was administered.
Alongside this testing, tonometry was carried out to ascertain the changes in intraocular pressure over time. The tonometer, calibrated for use in murine models, showed no meaningful changes in intraocular pressure amongst any of the groups. Contrary to expectations, we also did not observe an increase in IOP in the NaOH burn group after the fourth week (Fig. 4B).
3.6. Administration of DECON does not cause changes to the corneal thickness
Under anesthesia, the mice were assayed for changes in corneal thickness, a marker of inflammation. OCT measurements were taken of the murine corneas using a Micron IV with light conditions standardized at the beginning of experimentation. From these measurements, we observed that the corneal structures, including sub-corneal epithelium and stroma, remained essentially unchanged for PBS, ACV, HPAC, and DECON treated groups for the duration of the experiment (Fig. 5A). This was untrue, however, of the alkali burn group which revealed dramatically increased corneal thickness in the week of NaOH administration (Fig. 5B). A box and whisker plot, quantifying these observations in microns, reflects these findings (Fig. 5C).
Figure 5. OCT imaging revealed no increase in corneal thickness following four week administration of DECON.
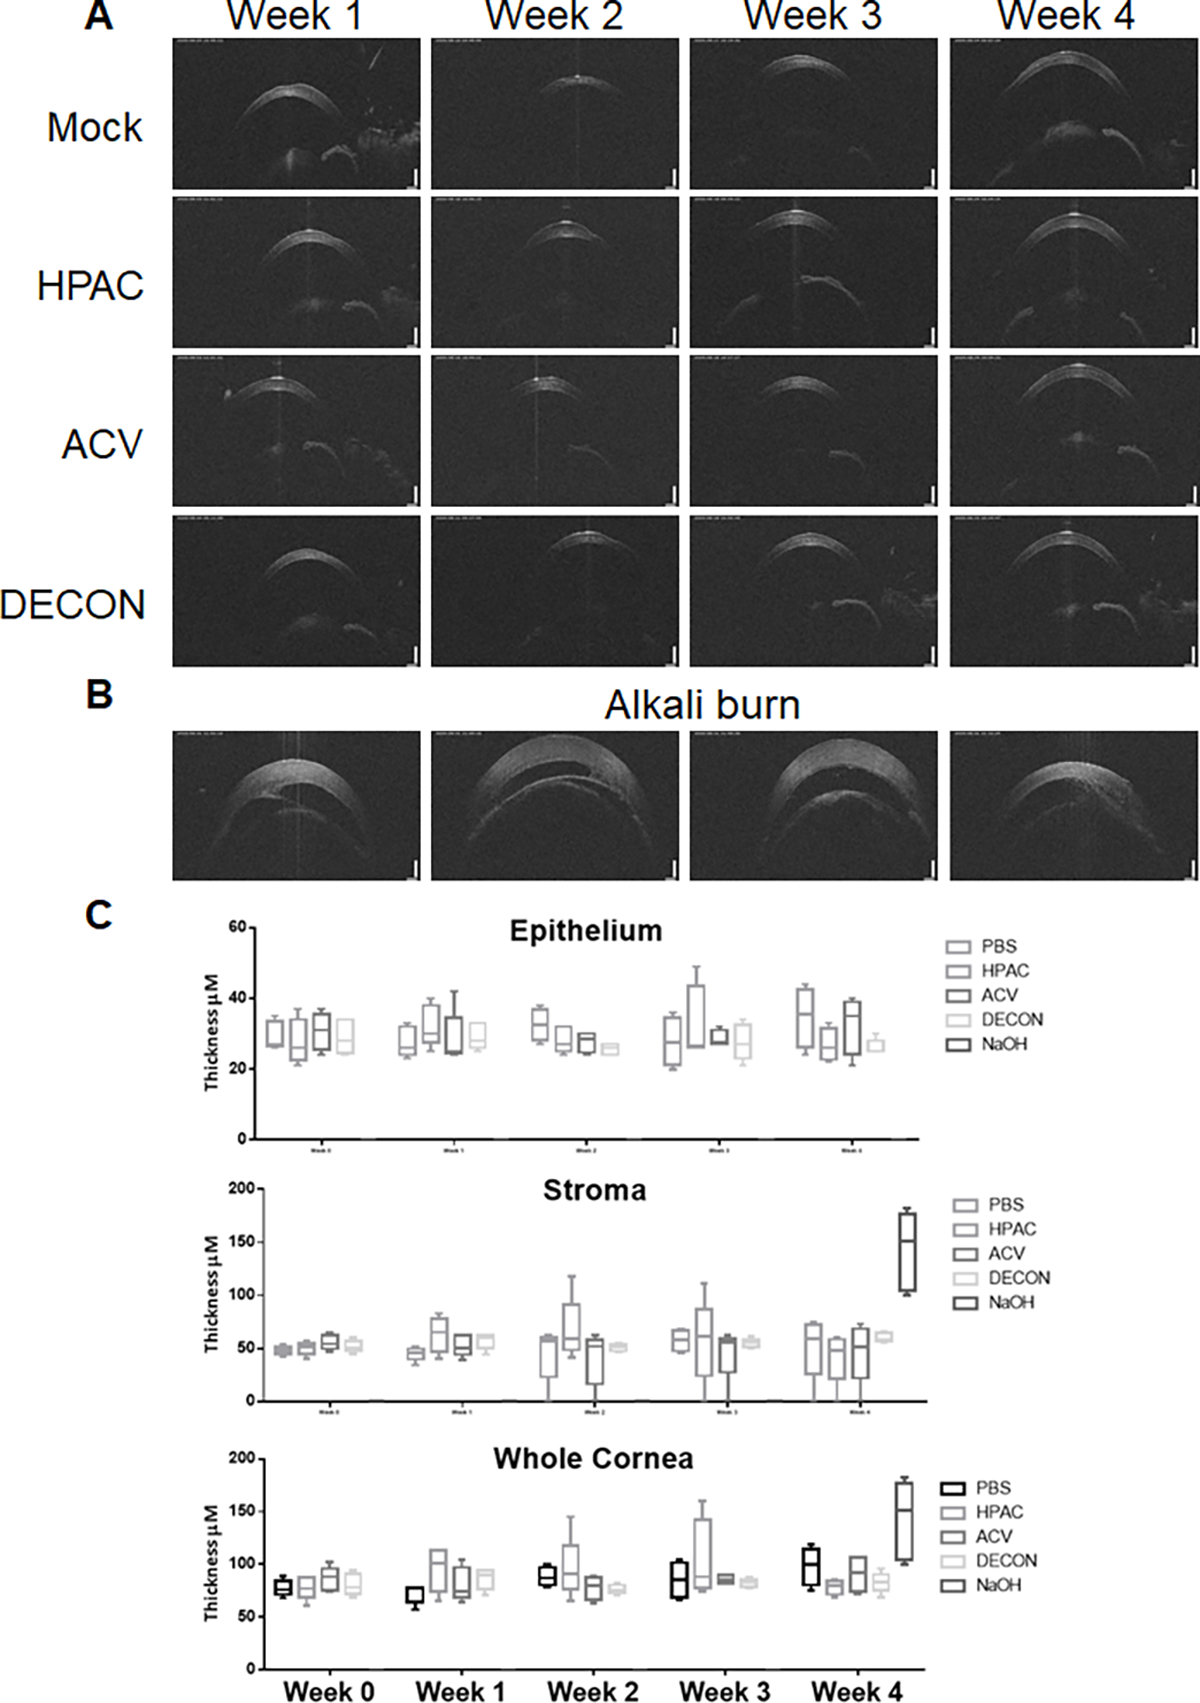
(A) Anesthetized mice were placed onto a holder and analyzed with an OCT probe weekly. On the first day of measurement, light intensity, focus, angle, and contrast were standardized and held constant for the duration of experimentation. (B) The same procedure was repeated for the alkali burn group at week 4, one week after administration of NaOH. (C) A box and whisker plot of the data taken during each week of experimentation was generated for epithelial, stromal, and aggregate corneal thickness.
4. Discussion
Ocular drug delivery is a major field of study that concentrates on two major aspects; (1) frequency of administration and (2) retention of the drug on the corneal surface. Many ocular delivery systems such as hydrogels 46, polymeric nanoparticles 47 and nanostructured lipid carriers (NLC) 48 have been used in the past, all of which have their advantages and disadvantages relative to the topical eyedrops more commonly used in drug delivery. Hydrogels use hydrophilic molecules in a 3-D network with a high capacity to absorb and retain water in an attempt to overcome the limitations of traditional ocular drug delivery systems. These systems use gelling polymers which form films upon contact with ocular tissue or in response to changes in temperature, ionic concentration, or pH in order to prolong drug residence, sustain release, and utilize co-delivery of multiple drugs. However, hydrogels have largely only been tested with small molecule drugs 46. On the other hand, polymeric nanoparticle treatments aim to overcome the many varying barriers that prevent drug distribution throughout different tissues in the eyes, such as the cornea, sclera, and blood barriers, which all prevent drug entry. As each part of the eye has its own unique conditions for entry, nanoparticles can be designed with specific size, charge, solubility, composition, and administration route in order to address these issues and increase the bioavailability of the drug49. To more easily pass through the cornea and reach the iris, sclera, or lens, nanoparticles such as poly(caprolactone) (PCL) have been designed to be used alongside benzalkonium chloride, to increase penetration 47. Conversely, PCL has been used with a mucoadhesive coat to confer a positive charge and increase residence time with the cornea. Because polymeric nanoparticles are created for a specific drug, they are the most diverse delivery system and have high specificity to a certain area of the eye. This drug delivery system is most useful and unique in its application in carrying drugs to deeper parts of the eye, which may not be necessary considering ocular herpes largely affects the cornea. NLCs use an oil to dissolve the drug which is combined with solid lipid particles in order to encapsulate the drug more completely and increase bioavailability of the treatment. Because they are solid at room temperature, NLCs provide a slow-release option for drugs and are relatively safe to administer, though they may have a low capacity to hold a sufficient amount of medication. In terms of ocular uses, NLCs have already been used to administer anti-inflammatory (Ibuprofen, Flurbiprofen, triamcinolone acetonide) drugs to ocular tissue 48. Relative to these ocular drug delivery systems, DECON does not require the same specificity in its creation and may play a dual-role by both acting as an effective carrier of acyclovir and as a method of trapping virions (Yadavalli et al., 2019). HPAC shows a higher loading volume of NCLs and can overcome to limitations of hydrogels difficulty in loading hydrophobic drugs50. However, the effects of carbon on adsorption of drug delivery may indicate a negative impact on the bioavailability of certain drugs which could limit its applications51. Carbon-based technologies show promise in the area of targeted drug release in response to certain stimuli52. Further research into the ability of DECON and other carbon-based technology’s ability to permeate beyond the cornea for release into other ocular tissues may reveal it’s ability to treat pathogens that travel beyond the routes taken by HSV-1 infection.
5. Conclusions
In this study, we have evaluated the ability of activated carbon particles to load and sustainably release ACV and 3 other nucleoside analogues using mass spectrometric analysis. The activated carbon particles loaded with the drug, termed as DECON were also able to show excellent antiviral activity even when dosed therapeutically at 0.025 mg/mL. Furthermore, we showed that sustained administration of 0.1 mg/mL DECON particles to the eyes and vaginal tissue is very well tolerated and does not cause any unforeseen toxicity. In this regard, we conclude that DECON is a safe, efficacious and cost effective addition to the list of agents for topical delivery of antiviral agents to the ocular and vaginal tissue. Future studies on this agent will include the evaluation of multiple types of active pharmaceutical components including but not limited to peptides, antibodies, oligonucleotides and small molecules with varying molecular weights and surface charges. These studies will also include the use of different activated carbon particles with modified surface chemistry to accommodate the delivery of different drugs.
Acknowledgements
This work was supported by NIH grants P30EY001792, R01EY024710, and R01AI139768 to D.S. This work was also supported by Chancellor’s Translational Research Initiative grant to D.S. The authors would like to acknowledge the help provided by Dr. Ali Djalilian, Tara Nguyen and Ruth Zelkha from the UIC Department of Ophthalmology. The authors would like to acknowledge the Mass Spectrometry Core for providing analytical services to assess drug loading and drug release from DECON particles.
Footnotes
Conflicts of interest
There are no conflicts to declare.
Publisher's Disclaimer: This is a PDF file of an unedited manuscript that has been accepted for publication. As a service to our customers we are providing this early version of the manuscript. The manuscript will undergo copyediting, typesetting, and review of the resulting proof before it is published in its final form. Please note that during the production process errors may be discovered which could affect the content, and all legal disclaimers that apply to the journal pertain.
References
- 1.Tsatsos M et al. Herpes simplex virus keratitis: an update of the pathogenesis and current treatment with oral and topical antiviral agents – comment. Clin. Exp. Ophthalmol. 45, 932 (2017). [DOI] [PubMed] [Google Scholar]
- 2.Lairson DR, Begley CE, Reynolds TF & Wilhelmus KR Prevention of herpes simplex virus eye disease: a cost-effectiveness analysis. Arch. Ophthalmol. 121, 108–112 (2003). [DOI] [PubMed] [Google Scholar]
- 3.Song X et al. A Multi-Center, Cross-Sectional Study on the Burden of Infectious Keratitis in China. PloS one 9, e113843 (2014). [DOI] [PMC free article] [PubMed] [Google Scholar]
- 4.Marchi S, Trombetta CM, Gasparini R, Temperton N & Montomoli E Epidemiology of herpes simplex virus type 1 and 2 in Italy: a seroprevalence study from 2000 to 2014. J Prev Med Hyg 58, E27–E33 (2017). [PMC free article] [PubMed] [Google Scholar]
- 5.Sukik L, Alyafei M, Harfouche M & Abu-Raddad LJ Herpes simplex virus type 1 epidemiology in Latin America and the Caribbean: Systematic review and meta-analytics. PLoS One 14 (2019). [DOI] [PMC free article] [PubMed] [Google Scholar]
- 6.Kasubi MJ et al. Prevalence of antibodies against herpes simplex virus types 1 and 2 in children and young people in an urban region in Tanzania. J. Clin. Microbiol. (2006). [DOI] [PMC free article] [PubMed] [Google Scholar]
- 7.Bradley H, Markowitz LE, Gibson T & McQuillan GM Seroprevalence of Herpes Simplex Virus Types 1 and 2—United States, 1999–2010. J Infect Dis 209, 325–333 (2014). [DOI] [PubMed] [Google Scholar]
- 8.Malkin JE et al. Seroprevalence of HSV-1 and HSV-2 infection in the general French population. Sex Transm Infect 78, 201–203 (2002). [DOI] [PMC free article] [PubMed] [Google Scholar]
- 9.Xu F et al. Trends in Herpes Simplex Virus Type 1 and Type 2 Seroprevalence in the United States. JAMA 296, 964–973 (2006). [DOI] [PubMed] [Google Scholar]
- 10.Fleming DT et al. Herpes simplex virus type 2 in the United States, 1976 to 1994. N Engl J Med 337, 1105–1111 (1997). [DOI] [PubMed] [Google Scholar]
- 11.Xu F et al. Trends in herpes simplex virus type 1 and type 2 seroprevalence in the United States. J. Am. Med. Assoc. 296, 964–973 (2006). [DOI] [PubMed] [Google Scholar]
- 12.Farooq AV & Shukla D Corneal latency and transmission of herpes simplex virus-1. Future Virol. 6, 101–108 (2011). [DOI] [PMC free article] [PubMed] [Google Scholar]
- 13.Koganti R, Yadavalli T, Naqvi RA, Shukla D & Naqvi AR Pathobiology and treatment of viral keratitis. Exp Eye Res 205, 108483 (2021). [DOI] [PMC free article] [PubMed] [Google Scholar]
- 14.Wilhemus K et al. Acyclovir for the prevention of recurrent herpes simplex virus eye disease. Herpetic Eye Disease Study Group. N Engl J Med 339, 300–306 (1998). [DOI] [PubMed] [Google Scholar]
- 15.Wood AJJ, Whitley RJ & Gnann JW Jr. Acyclovir: A Decade Later. N. Engl. J. Med. 327, 782–789 (1992). [DOI] [PubMed] [Google Scholar]
- 16.Elion GB Acyclovir: Discovery, mechanism of action, and selectivity. Journal of Medical Virology 41, 2–6 (1993). [DOI] [PubMed] [Google Scholar]
- 17.Yildiz C, Ozsurekci Y, Gucer S, Cengiz A & Topaloglu R Acute kidney injury due to acyclovir. CEN Case Rep 2, 38–40 (2013). [DOI] [PMC free article] [PubMed] [Google Scholar]
- 18.Ogura H et al. Acyclovir resistant acute herpes simplex encephalitis associated with acute retinal necrosis: A case report and review of the literature. Rinsho Shinkeigaku 57, 230–233 (2017). [DOI] [PubMed] [Google Scholar]
- 19.Piret J & Boivin G Resistance of herpes simplex viruses to nucleoside analogues: mechanisms, prevalence, and management. Antimicrob Agents Chemother 55, 459–472 (2011). [DOI] [PMC free article] [PubMed] [Google Scholar]
- 20.Crumpacker CS et al. Resistance to Antiviral Drugs of Herpes Simplex Virus Isolated from a Patient Treated with Acyclovir. New Engl. J. Med. 306, 343–346 (1982). [DOI] [PubMed] [Google Scholar]
- 21.Lass JH, Langston RH, Foster CS & Pavan-Langston D Antiviral medications and corneal wound healing. Antiviral Res. 4, 143–157 (1984). [DOI] [PubMed] [Google Scholar]
- 22.Carmine AA, Brogden RN, Heel RC, Speight TM & Avery GS Trifluridine: a review of its antiviral activity and therapeutic use in the topical treatment of viral eye infections. Drugs 23, 329–353 (1982). [DOI] [PubMed] [Google Scholar]
- 23.Wilhelmus KR The treatment of herpes simplex virus epithelial keratitis. Trans Am Ophthalmol Soc 98, 505–532 (2000). [PMC free article] [PubMed] [Google Scholar]
- 24.Chou TY & Hong BY Ganciclovir ophthalmic gel 0.15% for the treatment of acute herpetic keratitis: background, effectiveness, tolerability, safety, and future applications. Ther Clin Risk Manag 10, 665–681 (2014). [DOI] [PMC free article] [PubMed] [Google Scholar]
- 25.Birkmann A & Zimmermann H HSV antivirals – Current and future treatment options. Current Opinion in Virology 18, 9–13 (2016). [DOI] [PubMed] [Google Scholar]
- 26.Koganti R, Yadavalli T & Shukla D Current and emerging therapies for ocular herpes simplex virus type-1 infections. Microorg. 7 (2019). [DOI] [PMC free article] [PubMed] [Google Scholar]
- 27.Patel A, Cholkar K, Agrahari V & Mitra AK Ocular drug delivery systems: An overview. World J Pharmacol 2, 47–64 (2013). [DOI] [PMC free article] [PubMed] [Google Scholar]
- 28.Gote V, Sikder S, Sicotte J & Pal D Ocular Drug Delivery: Present Innovations and Future Challenges. J Pharmacol Exp Ther 370, 602–624 (2019). [DOI] [PubMed] [Google Scholar]
- 29.Jumelle C, Gholizadeh S, Annabi N & Dana R Advances and limitations of drug delivery systems formulated as eye drops. Journal of Controlled Release 321, 1–22 (2020). [DOI] [PMC free article] [PubMed] [Google Scholar]
- 30.Kang-Mieler JJ, Rudeen KM, Liu W & Mieler WF Advances in ocular drug delivery systems. Eye (London) 34, 1371–1379 (2020). [DOI] [PMC free article] [PubMed] [Google Scholar]
- 31.Subrizi A et al. Design principles of ocular drug delivery systems: importance of drug payload, release rate, and material properties. Drug Discovery Today 24, 1446–1457 (2019). [DOI] [PubMed] [Google Scholar]
- 32.Morrison PWJ & Khutoryanskiy VV Advances in ophthalmic drug delivery. Therapeutic Delivery 5, 1297–1315 (2014). [DOI] [PubMed] [Google Scholar]
- 33.Morrison PW & Khutoryanskiy VV Drug delivery. Drug delivery 5, 1297–1315 (1993). [DOI] [PubMed] [Google Scholar]
- 34.Üstündağ Okur N, Çağlar EŞ & Siafaka PI Novel Ocular Drug Delivery Systems: An Update on Microemulsions. Journal of Ocular Pharmacology and Therapeutics 36, 342–354 (2020). [DOI] [PubMed] [Google Scholar]
- 35.Yadavalli T et al. Drug-encapsulated carbon (DECON): A novel platform for enhanced drug delivery. Sci Adv 5, eaax0780 (2019). [DOI] [PMC free article] [PubMed] [Google Scholar]
- 36.Yadavalli T et al. Targeting Herpes Simplex Virus-1 gD by a DNA Aptamer Can Be an Effective New Strategy to Curb Viral Infection. Mol. Ther. Nucl. Acids 9, 365–378 (2017). [DOI] [PMC free article] [PubMed] [Google Scholar]
- 37.Yadavalli T et al. Standalone or combinatorial phenylbutyrate therapy shows excellent antiviral activity and mimics CREB3 silencing. Sci. Adv. 6 (2020). [DOI] [PMC free article] [PubMed] [Google Scholar]
- 38.Abdelkader H, Fathalla Z, Moharram H, Ali TFS & Pierscionek B Cyclodextrin Enhances Corneal Tolerability and Reduces Ocular Toxicity Caused by Diclofenac. Oxid Med Cell Longev 2018, 5260976 (2018). [DOI] [PMC free article] [PubMed] [Google Scholar]
- 39.Bai J, Qin H & Zhao S Research on mouse model of grade II corneal alkali burn. Int J Ophthalmol 9, 487–490 (2016). [DOI] [PMC free article] [PubMed] [Google Scholar]
- 40.Anderson C, Zhou Q & Wang S An Alkali-burn Injury Model of Corneal Neovascularization in the Mouse. J Vis Exp (2014). [DOI] [PMC free article] [PubMed] [Google Scholar]
- 41.Yadavalli T et al. Prior inhibition of AKT phosphorylation by BX795 can define a safer strategy to prevent herpes simplex virus-1 infection of the eye. Ocul Surf 18, 221–230 (2020). [DOI] [PMC free article] [PubMed] [Google Scholar]
- 42.Rao K, Leveque C & Pflugfelder SC Corneal nerve regeneration in neurotrophic keratopathy following autologous plasma therapy. Br J Ophthalmol 94, 584–591 (2010). [DOI] [PMC free article] [PubMed] [Google Scholar]
- 43.Pease ME, Cone FE, Gelman S, Son JL & Quigley HA Calibration of the TonoLab Tonometer in Mice with Spontaneous or Experimental Glaucoma. Invest Ophthalmol Vis Sci 52, 858–864 (2011). [DOI] [PMC free article] [PubMed] [Google Scholar]
- 44.Danjo Y, Hazlett LD & Gipson IK C57BL/6 mice lacking Muc1 show no ocular surface phenotype. Invest Ophthalmol Vis Sci 41, 4080–4084 (2000). [PubMed] [Google Scholar]
- 45.King R et al. Genomic locus modulating corneal thickness in the mouse identifies POU6F2 as a potential risk of developing glaucoma. PLoS Genet 14, e1007145 (2018). [DOI] [PMC free article] [PubMed] [Google Scholar]
- 46.Fang G, Yang X, Wang Q, Zhang A & Tang B Hydrogels-based ophthalmic drug delivery systems for treatment of ocular diseases. Materials Science and Engineering: C 127, 112212 (2021). [DOI] [PubMed] [Google Scholar]
- 47.Swetledge S, Jung JP, Carter R & Sabliov C Distribution of polymeric nanoparticles in the eye: implications in ocular disease therapy. J. Nanobiotechnology 19 (2021). [DOI] [PMC free article] [PubMed] [Google Scholar]
- 48.Chauhan I, Yasir M, Verma M & Singh AP Nanostructured Lipid Carriers: A Groundbreaking Approach for Transdermal Drug Delivery. Advanced pharmaceutical bulletin 10, 150 (2020). [DOI] [PMC free article] [PubMed] [Google Scholar]
- 49.Begines B et al. Polymeric Nanoparticles for Drug Delivery: Recent Developments and Future Prospects. Nanomaterials (Basel, Switzerland) 10, 1403 (2020). [DOI] [PMC free article] [PubMed] [Google Scholar]
- 50.Hoare TR & Kohane DS Hydrogels in drug delivery: Progress and challenges. Polymer (Guilford) 49, 1993–2007 (2008). [Google Scholar]
- 51.LAUFEN H & LEITOLD M The effect of activated charcoal on the bioavailability of piroxicam in man. International journal of clinical pharmacology, therapy and toxicology (1980) 24, 48–52 (1986). [PubMed] [Google Scholar]
- 52.Hasnain MS et al. in Stimuli Responsive PolymericNanocarriers for Drug Delivery Applications (eds Makhlouf, A. S. H. & Abu-Thabit, N. Y.) 321–344 (Woodhead Publishing, 2019). [Google Scholar]