

Highlights
-
•
A fast and easy LC-MS/MS method was developed for the quantification of clobazam and N-desmethylclobazam.
-
•
This validated method is simple, reproducible, sensitive and robust.
-
•
The data presented can be used as a guide by clinicians in determining drug adherence by assessing positivity rates of the parent drug and corresponding metabolite.
Abbreviations: CLB, Clobazam; CLRW, Clinical Laboratory Reagent Water; CLIA, Clinical Laboratory Improvement Amendment; DAD, Diode Array Detector; ESI, Electrospray ionization; IRB, Institutional Review Board; LLOQ, lower limit of quantification; LOD, limit of detection; LC-MS/MS, liquid chromatography tandem mass spectrometry; MRM, multiple reaction monitoring; N-CLB, N-desmethylclobazam; TDM, Therapeutic drug monitoring; UV, Ultraviolet; ULOQ, upper limit of quantification
Keywords: Clobazam, N-Desmethylclobazam, Plasma, LC-MS/MS, Retrospective data analysis
Abstract
Introduction
Clobazam is a benzodiazepine drug, used to treat Lennox-Gastaut syndrome in patients aged 2 years and older.
Objective
To support patient care, our laboratory developed a liquid chromatography tandem mass spectrometry (LC-MS/MS) method for the quantification of clobazam (CLB) and its major active metabolite N-desmethylclobazam (N-CLB) in human plasma or serum samples.
Methods
The chromatographic separation was achieved with an Agilent Zorbax Eclipse Plus C-18 RRHD column with mobile phase consisting of 0.05% formic acid in 5 mM ammonium formate, pH 3.0 and 0.1% formic acid in acetonitrile at a flow rate of 600 µL/minute and an injection volume of 5 µL. The detection was performed on a triple quadrupole mass spectrometer in multiple reaction monitoring mode to monitor precursor-to-product ion transitions in positive electrospray ionization mode.
Results
The method was validated over a concentration range of 20–2000 ng/mL for CLB and 200–10,000 ng/mL for N-CLB. The lower limit of quantification was 20 ng/mL for CLB and 200 ng/mL for N-CLB with good accuracy and precision. The method performance was successfully evaluated by comparison with two different external laboratories. Retrospective data analysis was performed to evaluate the positivity rate and metabolic patterns for clobazam from our patient population, as a reference laboratory. Among the positive samples, both parent and metabolite were detected in 96.4% of the samples.
Conclusion
The method was developed to support therapeutic drug monitoring and the data generated from retrospective analysis could be useful for result interpretation in conjunction with clinical patient information.
Introduction
Benzodiazepines are class of drugs that are prescribed for the treatment of various medical conditions, such as anxiety, insomnia, epilepsy, depression and muscle relaxation [1], [2]. The use of benzodiazepine drugs can increase the risk of drug abuse, misuse and addiction [3]. Clobazam (CLB) is one of the designer benzodiazepines which is more potent than other benzodiazepine drugs [4]. When CLB is administered with alcohol or other CNS depressants, adverse effects, such as drowsiness, respiratory depression, coma and death can occur [2], [3], [5], [6]. CLB is indicated for adjunctive treatment of Lennox-Gastaut syndrome in patients aged 2 years and older [3]. Although the mechanism of action of CLB is not fully elucidated, it is a 1,5-benzodaizepine derivative, with GABA-A receptor agonist activity [7], [8]. CLB has a half-life of 10–50 hr and is metabolized primarily through N-demethylation by CYP3A4/5, to N-desmethylclobazam (N-CLB), which has about 20% of the pharmacological activity as the parent drug [9], [10]. N-CLB has a longer half-life than the parent drug of 30 – 80 hr. Metabolism of CLB and N-CLB by CYP2C19 forms minor metabolites, 4′-hydroxyclobazam and 4′hydroxy-N-desmethylclobazam [10].
The analytical methods for therapeutic drug monitoring (TDM) of CLB and N-CLB, currently consist of lab developed tests, which are not standardized among clinical laboratories. According to drafted guidance of the US Food and Drug Administration (2021), for bioequivalence studies CLB and its active metabolite N-CLB in plasma should be measured [11]. Therefore, it is desirable to have single method for simultaneous determination of both analytes. There are several published methods for determination of CLB and N-CLB in biological matrices using gas chromatography (GC) [12], high-performance liquid chromatography (HPLC)/UV (ultraviolet) [13], [14], and HPLC/DAD (diode array detector) [15]. However, there are only a couple of published manuscripts that report use of liquid chromatography with tandem mass spectrometry (LC-MS/MS) for determination of CLB in plasma [16], [17] and the sample preparation procedures include liquid–liquid or solid-phase extraction. There are also LC-MS/MS methods that include a multi-panel of benzodiazepines drugs and CLB in different biological matrices [18], [19], [20], [21].
The purpose of the present study was to establish an LC-MS/MS method for simultaneous determination of CLB and N-CLB in human serum or plasma. The validated method required only 50 µL of serum or plasma and demonstrates excellent performance in terms of accuracy, imprecision, and reproducibility. Retrospective data analysis of authentic patient samples was performed to evaluate the metabolic patterns for CLB and its major active metabolite N-CLB using the developed and validated method.
Materials and methods
Chemicals and reagents
CLB (1.0 mg/mL in methanol), N-CLB (1.0 mg/mL in 90/10 acetonitrile/DMSO), CLB-13C6 (100 µg/mL in methanol) and N-CLB-13C6 (100 µg/L in acetonitrile) stocks were purchased from Cerilliant (Round Rock, TX). Liquid chromatography mass spectrometry (LC-MS) grade methanol, acetonitrile, formic acid, ethyl acetate, and ammonium hydroxide were purchased from VWR (Radnor, PA). Powdered ammonium formate was purchased from Sigma-Aldrich (St. Louis, MO).
Preparation of calibration standards and quality control samples
A working solution for CLB was prepared by diluting CLB stock (1.0 mg/mL in methanol) in methanol for a final concentration of 20,000 ng/mL. The CLB working solution and the N-CLB stock (1.0 mg/mL in 90/10 acetonitrile/DMSO) were used to prepare six calibration standards and three quality controls in human plasma. Final concentrations of the calibration standards were 20, 50, 400, 800, 1,400, and 2,000 ng/mL for CLB and 200, 400, 2,000, 4,000, 7,000, and 10,000 for N-CLB. The concentrations for the quality controls were 60, 500, and 1,200 ng/mL for CLB and 600, 3,000, and 6,000 for N-CLB. The working solution, calibration standards, and the quality controls were stored at −70 °C for up to 8 months. Internal standard working solution was prepared by spiking CLB-13C6 (100 µg/mL in methanol) and N-CLB-13C6 (100 µg/L in acetonitrile) stocks into sodium phosphate buffer (0.1 M, pH 6) for a final concentration of 200 ng/mL for CLB and 1,000 ng/mL for N-CLB.
Instrumentation and chromatographic conditions
The analysis was performed using an AB SCIEX Triple-Quad 5500 tandem mass spectrometer (MS) using positive electrospray ionization (ESI) and multiple reaction monitoring (MRM) mode of acquisition. The analyte was separated using Agilent Zorbax Eclipse Plus C-18 RRHD column (2.1 × 50 mm, 1.8 µm) attached to a CTC PAL HTC-xt-DLQ autosampler and Agilent 1260 infinity series binary pump, degasser, and column oven. The mobile phase consists of 0.05% formic acid in 5 mM ammonium formate, pH 3.0 (mobile phase A) and 0.1% formic acid in acetonitrile (mobile phase B) at a flow rate of 600 µL/minute. The starting gradient conditions were 20% mobile phase B and were increased to 40% mobile phase B over 2.5 min, again increased to 90% mobile phase B at 3.5 min and lastly returns to starting conditions of 20% mobile phase B by 4.5 min. The MS parameters included a curtain gas of 20 psi, a collision gas of 12 psi, IonSpray voltage of 5500 V, source temperature of 700 °C, nebulizer gas of 75 psi, and heater gas of 50 psi. All data were recorded and processed using Analyst 1.7.2. Two MRM transitions were chosen for each analyte, as shown in Table 1.
Table 1.
MRM transitions for clobazam and N-desmethylclobazam and their internal standards.
| Compound Name | Retention Time (min) | Precursor ion (m/z) | Product ion (m/z) | Declustering Potential (DP) | Collision Energy (volts) | Cell Exit Potential (volts) |
|---|---|---|---|---|---|---|
| Clobazam | 2.2 | 301.1 | 224.1 | 125 | 46 | 18 |
| 215.1 | 64 | 13 | ||||
| Clobazam-13C6 | 2.21 | 307.1 | 230.1 | 60 | 46 | 15 |
| 221.1 | 63 | 23 | ||||
| N-Desmethylclobazam | 1.61 | 287.1 | 210.1 | 139 | 42 | 20 |
| 181.1 | 62 | 14 | ||||
| N-Desmethylclobazam-13C6 | 1.62 | 293.1 | 216.1 | 141 | 44 | 29 |
| 187.1 | 62 | 21 |
Sample preparation
50 µL of serum or plasma were transferred to a deep well 96 well plate, then mixed with 50 µL of internal standard solution (IS) prepared in sodium phosphate buffer (0.1 M, pH 6). After the samples were vortexed for 10 min and reached equilibrium, the samples were diluted with 500 µL of sodium phosphate buffer. The samples were vortexed for another 1 min before the samples were transferred to a PSCX preassembled column array (Positive Strong Cation Exchange, SPEware, Baldwin Park, CA). The samples were washed with 0.5 mL of Clinical Laboratory Reagent Water (CLRW), followed by 1.0 mL of 10:10:80 acetonitrile: methanol: CLRW. After the wash, columns were dried for 5 min at high pressure before elution by gravity with 1.0 mL of freshly prepared 98:2 ethyl acetate: ammonium hydroxide into a new deep well 96 well plate. The elution solvent was evaporated to dryness at 40 °C under a stream of nitrogen, then reconstituted in 1.0 mL of 25% methanol.
Method validation
This method was validated according to the Clinical Laboratory Standards Institute (CLSI 62A) guideline. For linearity studies a six-point calibration curve was extracted at the beginning of the run and evaluated using linear regression with 1/x weighting. The calibration standards ranged from 20 to 2,000 ng/mL for CLB and 200–10,000 ng/mL for N-CLB. Six additional concentrations within the analytical measurement range (AMR) were extracted as unknown samples and quantitated using the calibration curve.
Sensitivity was determined by analyzing six replicates of spiked blank human plasma at 20/200, 16/150, 12/100, 8/50, 5/25 ng/mL (CLB/N-CLB). The concentration at 20/200 ng/mL is the lower limit of quantification (LLOQ) for the assay, three additional concentrations below the LLOQ were evaluated for the limit of detection (LOD). Intra-day and inter-day accuracy and imprecision were determined by extracting six replicates of three concentrations of CLB and N-CLB across the AMR. The concentrations were 60/600 ng/mL, 600/2,000 ng/mL, and 2,000/10,000 ng/mL. Four batches of inter-day precision were extracted on different days, while only one batch was extracted for intra-day precision on the same day.
Method comparison for the LC-MS/MS method was determined by comparing patient sample results with two outside national clinical laboratories. One hundred and ninety patient samples were sent to Lab A for CLB concentration comparison and 55 patient samples were sent to Lab B for CLB and N-CLB concentration comparison. Deming regression with a 95% confidence interval was used to generate a slope, and correlation coefficient for the datasets. The criteria for acceptance required slope to be between 0.80 and 1.20 with intercept ≤ LLOQ and R to be ≥ 0.90.
For analyte stability in solvent and human plasma, freeze thaw, room temperature, and long-term storage stability was evaluated. Freeze thaw stability was determined by freezing analyte in solvent and human plasma at −70 °C for at least 24 h before thawing on the benchtop for at least two hours. A total of four freeze thaws were evaluated for this assay. Room temperature stability was determined by storing analyte in solvent and human plasma at 20 °C for 12 h before evaluation. Long term storage was determined for both analytes in human plasma at −70 °C, −20 °C, and 4 °C. For long term storage stability in solvent only storage at −70 °C was evaluated. Up to 8 months of long-term storage stability was evaluated for both analytes in solvent and human plasma. Re-injection reproducibility of extracted samples was compared with freshly extracted calibration standards, patient samples, and quality controls (T = 0) with extracted samples stored in 4 °C to 8 °C for six days (T = 144 h).
Carryover studies were undertaken by injecting 21 samples alternating between low and high sample concentrations. The low concentration was prepared at LLOQ levels, and the high concentration was prepared at two times the upper limit of quantification (ULOQ).
Interference between the analyte and internal standard channels were tested by extracting analyte and internal standard only samples and checking to see if there were contributions in the other channel. Hemolysis, lipemic, and icteric interference were evaluated by extracting five replicates of in five different samples spiked to a final concentration of 1620 mg/dL of hemolyzed blood, 17.6 mg/dL of bilirubin, and 4474 mg/dL of triglyceride in spiked human plasma samples. Dilution integrity was validated by diluting three different concentrations of CLB and N-CLB above the ULOQ. The samples were diluted 1:2 and 1:5 to fit the AMR for the assay.
The maximum batch size was tested by extracting 133 samples in one analytical batch. The maximum batch size was determined by analyzing a batch containing two calibration curves, patient samples, and quality controls. The first calibration curve was extracted at the beginning of the run, while the second was extracted at the end of the run to bracket all patient samples. The internal standard response for all samples should be within ± 50% of the average response. Additionally, the accuracy of the calibration curve, and the two replicates of the quality control samples should be within ± 15% of the expected concentration.
For matrix effect evaluation, 20 negative patient samples were extracted and injected. During the injection of the patient samples post-column infusion of CLB and N-CLB at concentrations 400/2000 ng/mL was evaluated. No suppression or enhancement areas should be observed within ± 0.5 min of the retention time for both CLB and N-CLB and a compound is said to be not impacted by matrix effect if the average suppression/enhancement exceeds ± 25% from the baseline (Based on the College of American Pathologist (CAP) checklist).
National reference laboratory data
Historical data were retrieved and de-identified at the ARUP Laboratories (Salt Lake City, UT), according to protocols approved by the University of Utah Institutional Review Board (IRB). In total, results from 5079 specimens (∼15 months of testing) were retrieved for retrospective data analysis from individual test codes for clobazam and metabolite in serum/plasma from the time the validated method went live in the production lab. The specimens were collected from the patients who were prescribed CLB by their clinicians. This study evaluated positivity rates, patterns of quantitative results of parent drug and/or metabolite, and the ratios of metabolite to parent drug. The limitation of this study was that dose and patient clinical history was not provided in the laboratory information system at ARUP Laboratories.
Results and discussion
Linearity
The calibration curve was linear over a concentration range of 20–2,000 ng/mL for CLB and 200–10,000 ng/mL for N-CLB. All analytes had a best fit following a linear regression with 1/x weighting and had an R2 > 0. 990. The unknown samples quantified by the calibration curve had a coefficient of variance (% CV) of less than 10% for all levels, and the accuracy was between 90 and 100% of the expected concentration.
Sensitivity and precision
The LLOQ for CLB is 20 ng/mL and N-CLB is 200 ng/mL. The six replicates had a %CV of 5% with an overall accuracy of 99%. The LOD criteria was met for CLB at 5 ng/mL and N-CLB for 25 ng/mL. Fig. 1 shows the chromatography of clobazam and N-desmethylclobazam at LLOQ concentrations. The intra-day and inter-day imprecision for CLB and N-CLB was less than 5%, with a total imprecision of less than 5%. Table 2, Table 3 summarize the accuracy and precision for CLB and N-CLB. The sensitivity and precision of the developed method is comparable to previously published methods that used LC-MS/MS for the analysis [23], [24].
Fig. 1.

Chromatography of clobazam and N-desmethylclobazam at the LLOQ (no color).
Table 2.
CLB precision and accuracy results.
| Intra-Batch (First Batch) |
Inter-batch |
|||||||
|---|---|---|---|---|---|---|---|---|
| Sample | N | Mean Calculated Concentration (ng/mL) | Accuracy (%) | CV (%) | N | Mean Calculated Concentration (ng/mL) | Accuracy (%) | CV (%) |
| Low | 5 | 58.6 | 97.7 | 2.89 | 20 | 58.4 | 97.3 | 1.17 |
| Medium | 5 | 566 | 94.3 | 1.77 | 20 | 577 | 96.2 | 1.03 |
| High | 5 | 1,994 | 99.7 | 3.34 | 20 | 1,998 | 99.9 | 2.3 |
Table 3.
N-CLB precision and accuracy results.
| Intra-Batch (First Batch) |
Inter-batch |
|||||||
|---|---|---|---|---|---|---|---|---|
| Sample | N | Mean Calculated Concentration (ng/mL) | Accuracy (%) | CV (%) | N | Mean Calculated Concentration (ng/mL) | Accuracy (%) | CV (%) |
| Low | 5 | 565 | 94.2 | 1.77 | 20 | 577 | 96.2 | 1.03 |
| Medium | 5 | 1,982 | 99.1 | 2.42 | 20 | 1,971 | 98.6 | 1.38 |
| High | 5 | 9,944 | 99.4 | 2.86 | 20 | 9,760 | 97.6 | 2.5 |
Method comparison
The LC-MS/MS method met acceptance criteria for method comparison with Lab A and Lab B. See Fig. 2 for Deming regression plots for CLB comparison between Lab A, Lab B, and ARUP Laboratories, and Fig. 3 for N-CLB comparison between Lab B and ARUP Laboratories. For CLB, the regression equation for the 190-patient sample sent to Lab A was y = 1.06x + 1.59 with an r = 0.988, while regression equation for the 55 patient samples sent to Lab B was y = 1.04x − 6.02 with an r = 0.997. For N-CLB, the regression equation for the 55 samples was y = 1.11x − 99.9 with an r = 0.995. Twelve patient samples sent to Lab A showed a bias of > 20% which is around 6.3% of the total samples sent to Lab A. One patient sample sent to Lab B for N-desmethylclobazam showed a > 20% bias which is around 1.8% of the total samples sent to Lab B.
Fig. 2.

Method comparison for clobazam comparing ARUP Laboratories with Lab A and Lab B (no color).
Fig. 3.
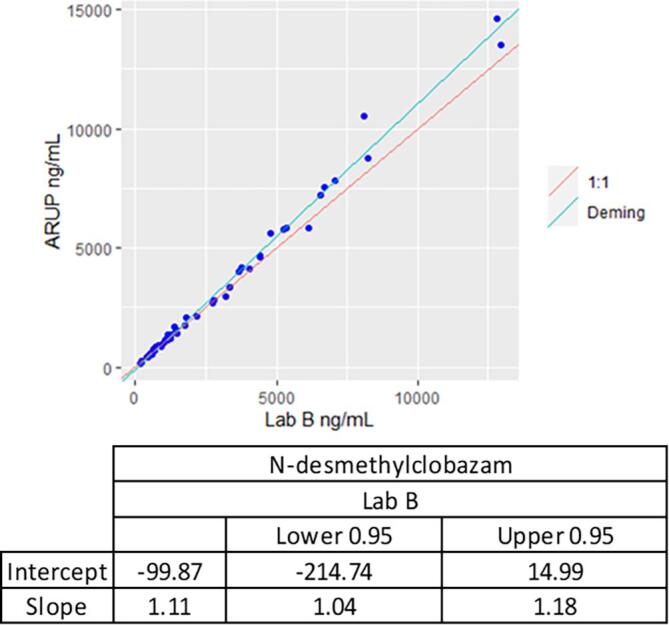
Method comparison for N-desmethylclobazam comparing ARUP Laboratories and Lab B.
Sample stability
The stability of the analytes was investigated under a variety of storage and process conditions for both analytes. CLB stability in solvent is summarized in Table 4 and stability of CLB and N-CLB in matrix is summarized in Table 5. All stability tests were calculated along with a freshly extracted calibration curve and QC samples and extracted in replicates of five. Extract stability was observed in both CLB and N-CLB for up to 144 h. Calibration standards showed 93% to 106% accuracy at 144 h for both analytes. Quality controls samples showed 101% to 106% accuracy, and all patient samples showed 96% to 110% accuracy at 144 h for both analytes. Of note, N-CLB is generally more stable than CLB [25], [26], [27].
Table 4.
Solvent stability for clobazam.
| Conditions | Duration | Accuracy (%) | CV (%) |
|---|---|---|---|
| Freeze thaws | 4 | 98% | 3% |
| Room temperature (20 °C) | 12 h | 97% | 1% |
| Storage Stability (-70 °C) | 8 months | 96% | 3% |
Table 5.
Clobazam and N-desmethylclobazam stability in human plasma.
| Clobazam |
N-desmethylclobazam |
||||||||
|---|---|---|---|---|---|---|---|---|---|
| Conditions | Duration | Temperature | Accuracy (%) | CV (%) | Condition | Duration | Temperature | Accuracy (%) | CV (%) |
| Freeze thaws | 4 | N/A | 106% | 6% | Freeze thaws | 4 | N/A | 104% | 4% |
| Storage Stability | 12 h | 20 °C | 107% | 2% | Storage Stability | 12 h | 20 °C | 103% | 2% |
| 8 months | −70 °C | 106% | 3% | 8 months | −70 °C | 103% | 2% | ||
| 8 months | −20 °C | 105% | 3% | 8 months | −20 °C | 101% | 3% | ||
| 2 months | 5 °C | 108% | 5% | 2 months | 5 °C | 100% | 3% | ||
Carryover
Carryover was not observed at 4000 ng/mL for CLB or 20,000 ng/mL for N-CLB. The amount of carryover observed for CLB was 0.42 ng/mL which is 2.1% of the LLOQ. The amount of carryover observed for N-CLB was 6.4 ng/mL which is 3.2% of the LLOQ.
Interference
Cross contribution of analyte and internal standard channels showed less than 0.11% of the LLOQ. There was no significant cross contribution observed for CLB and N-CLB. The average accuracy for the five hemolytic samples was 105% for CLB and 104% for N-CLB. The average accuracy for the five lipemic samples was 108% for CLB and 107% for N-CLB. The average accuracy for the five icteric samples was 105% for CLB and 104% for N-CLB.
Dilution integrity
For CLB, the mean value of the diluted samples at each level was within ± 10% of the expected concentration (92% for level 1, 90%, for level 2 and 93% for level 3) and the CV at each level was within 3% (1% for level 1, 2% for level 2, and 1% for level 3). For N-CLB the mean value of the diluted samples at each level was within ± 10% of the expected concentration (94% for level 1, 90%, for level 2 and 92% for level 3) and the CV at each level was within 3% (3% for level 1, 2% for level 2, and 1% for level 3). Level 1 for both CLB and NC LB was diluted two times, and Level 2 and Level 3 for CLB and N-CLB was diluted 5 times. Samples can be diluted two times or five times, if necessary, to fit the calibration curve.
Maximum batch size
The internal standard response for 133 samples including calibration curve, quality controls and patient samples was within 75% of the average response for both CLB and N-CLB. For CLB and N-CLB, the accuracy of the front and back calibration curve was within 10% of expected concentrations. The quality controls for CLB were 95.3% (low), 95.4% (medium) and 106% (high) of expected concentrations. The quality controls for N-CLB were 101% (low), 106% (medium), and 101% (high).
Matrix effect
No suppression or enhancement areas were seen within ± 0.5 min of the retention time. Fig. 4 shows the ion trace for one of the 20 patient samples. The retention time for CLB is 2.2 min and N-CLB is 1.61 min. Hence, matrix effect is not a concern for the quantification of these analytes. This effect is similar to many studies reported earlier [6], [16], [17], [28] but contradicts the findings from the matrix effect tested by M. De Boeck et al. [22].
Fig. 4.

Ion Trace for Suppression Studies at 400/2000 ng/mL of CLB/N-CLB (no color).
Metabolic patterns of clobazam in serum/plasma
Metabolite patterns were analyzed using 5079 plasma specimens containing 2639 males and 2427 females in the age range of 0–101 years old. Among these specimens, 96.9% of specimens (4924 out of 5079) were positive for CLB and N-CLB. The parent drug was detected without metabolite in 1.9% (N = 99) of positive specimens and the metabolite was detected without the parent drug in 1.1% (N = 56) of positive specimens. There were 54.3% (N = 2759) of positive specimens reported within the therapeutic range (30–300 ng/mL) of CLB and 52.6% (N = 2672) of positive specimens reported within the therapeutic range (300–3000 ng/mL) for N-CLB (https://ltd.aruplab.com/Tests/Pub/3002508). From this population, 19.3% (N = 945) of positive specimens were reported in the toxic range (>500 ng/mL) for CLB and 26.5% (N = 1288) of positive specimens were reported in the toxic range (>5000 ng/mL) for N-CLB. The percent of patient samples with concentration of N-CLB greater than the ULOQ (10,000 ng/mL) was 0.1% of positive specimens (N = 5) and there were no patients in this data set with concentrations of CLB >2000 ng/mL. The median concentrations of CLB and N-CLB were 261 and 2488 ng/mL respectively; the 90th percentile was 654 and 8811 ng/mL respectively in the positive specimens. The concentration ratios of N-CLB to CLB span a wide range from 0.6 to 733 (Fig. 5). The concentrations of the pharmacologically active metabolite N-CLB, are typically higher than its parent drug CLB [29]. The average N-CLB:CLB ratio was 12 and 75% of patients had metabolite to parent drug ratios less than 25, as shown in Fig. 5. Metabolite to parent ratios are influenced by several factors, including dose, frequency of administration and pharmacogenetics. Individuals who have genetic variation in CYP3A4/5, may lead to poor metabolism or metabolism could be inhibited from drug-drug interactions, which leads to low metabolite to parent ratios [29]. Individuals who have induced CYP3A4/5 metabolism will have higher metabolite to parent ratios [29]. Individuals who are poor metabolizers for CYP2C19 or have inhibited CYP2C19 activity, will have higher concentrations of N-CLB than CLB [10]. Therefore, TDM for CLB and N-CLB is recommended for dose optimization [10], [29].
Fig. 5.
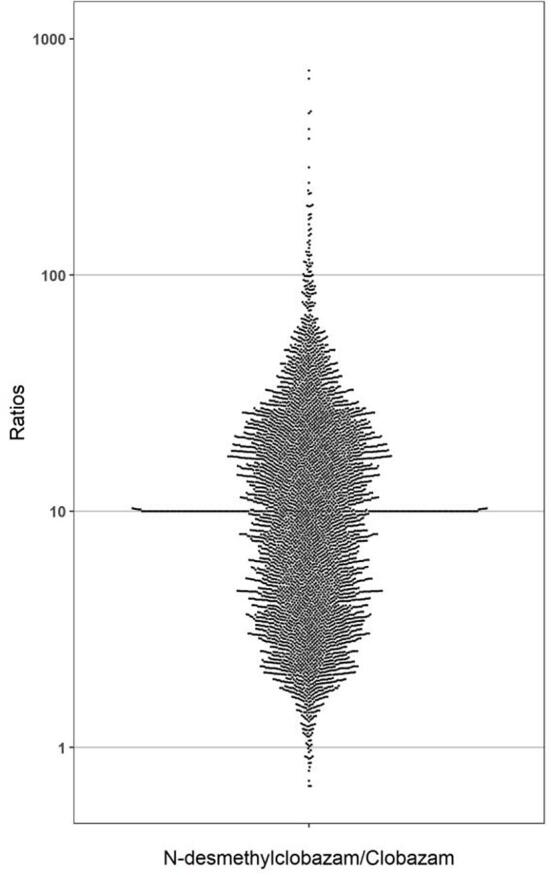
The distribution of ratios of N-desmethylclobazam/clobazam in serum/plasma.
Conclusion
In this study, a LC-MS/MS method was validated for the quantification of CLB and N-CLB in human plasma or serum. The method validation included experiments for linearity, precision, sensitivity, matrix effect, carryover, method comparison and stability. Data analysis from validation experiments met acceptance criteria for clinical testing. An advantage of this analytical method was that it afforded a wider analytical measurement range for CLB and N-CLB to accommodate 99% of patient results in our reference lab patient population. The analytical measurement range for CLB and N-CLB in our method was wider than a previous published method, with an AMR of 50–2000 ng/mL [22]. Retrospective data from the laboratory information system at a national clinical reference laboratory were evaluated. Our study highlighted the metabolic patterns of clobazam and its metabolite in serum or plasma. Data from this study may be helpful to assist with result interpretation for therapeutic drug monitoring. Patients with high N-CLB:CLB ratios, >25, may indicate poor or inhibited metabolism for CYP2C19 or a drug-drug interaction that may induce the metabolism of CYP3A4 [10].
Funding
This research did not receive any specific grant from funding agencies in the public, commercial, or not-for-profit sectors.
Declaration of Competing Interest
The authors declare that they have no known competing financial interests or personal relationships that could have appeared to influence the work reported in this paper.
Acknowledgments
Acknowledgements
The authors want to thank the staff of the Clinical Toxicology 2 section at ARUP Laboratories for their support during the validation process and the transition of the assay into the production lab. We would also like to thank Michael Palmer for providing de-identified retrospective data and the ARUP Institute for Clinical and Experimental Pathology.
Data availability
The data underlying this article are available in the article.
Institutional review board
Institutional Review Board (IRB)/Ethics Committee approval was obtained.
Contributor Information
Amol O. Bajaj, Email: amol.bajaj@aruplab.com.
Kamisha L. Johnson-Davis, Email: kamisha.johnson-davis@aruplab.com.
References
- 1.McCall W.V. A psychiatric perspective on insomnia. J. Clin. Psychiatry. 2001;62(Suppl 10):27–32. [PubMed] [Google Scholar]
- 2.Rudolph U., Knoflach F. Beyond classical benzodiazepines: novel therapeutic potential of GABAA receptor subtypes. Nat. Rev. Drug Discov. 2011;10(9):685–697. doi: 10.1038/nrd3502. [DOI] [PMC free article] [PubMed] [Google Scholar]
- 3.Onfi (clobazam). [cited 2022 February 25]; Available from: https://www.onfi.com/.
- 4.Moosmann, B., L.A. King, and V. Auwärter, Designer benzodiazepines: A new challenge. World Psychiatry, 2015. 14(2): p. 248. [DOI] [PMC free article] [PubMed]
- 5.Garretty D.J., Wolff K., Hay A.W.M., Raistrick D. Benzodiazepine misuse by drug addicts. Ann. Clin. Biochem. 1997;34(1):68–73. doi: 10.1177/000456329703400110. [DOI] [PubMed] [Google Scholar]
- 6.Mei, V., et al., Validation of an LC-MS/MS Method for the Quantification of 13 Designer Benzodiazepines in Blood. J Anal Toxicol, 2019. 43(9): p. 688-695. [DOI] [PubMed]
- 7.Besson M., Daali Y., Di Lio A., Dayer P., Zeilhofer H.U., Desmeules J. Antihyperalgesic effect of the GABA(A) ligand clobazam in a neuropathic pain model in mice: a pharmacokinetic-pharmacodynamic study. Basic Clin. Pharmacol. Toxicol. 2013;112(3):192–197. doi: 10.1111/bcpt.12017. [DOI] [PubMed] [Google Scholar]
- 8.Remy C. Clobazam in the treatment of epilepsy: a review of the literature. Epilepsia. 1994;35(Suppl 5):S88–S91. doi: 10.1111/j.1528-1157.1994.tb05978.x. [DOI] [PubMed] [Google Scholar]
- 9.Tolbert D., Larsen F. A comprehensive overview of the clinical pharmacokinetics of clobazam. J. Clin. Pharmacol. 2019;59(1):7–19. doi: 10.1002/jcph.1313. [DOI] [PMC free article] [PubMed] [Google Scholar]
- 10.de Leon J., Spina E., Diaz F.J. Clobazam therapeutic drug monitoring: a comprehensive review of the literature with proposals to improve future studies. Ther. Drug Monit. 2013;35(1):30–47. doi: 10.1097/FTD.0b013e31827ada88. [DOI] [PMC free article] [PubMed] [Google Scholar]
- 11.Bioequivalence Studies With Pharmacokinetic Endpoints for Drugs Submitted Under an Abbreviated New Drug Application. 08/20/2021.
- 12.Tedeschi G., Riva R., Baruzzi A. Clobazam plasma concentrations: pharmacokinetic study in healthy volunteers and data in epileptic patients. Br. J. Clin. Pharmacol. 1981;11(6):619–622. doi: 10.1111/j.1365-2125.1981.tb01180.x. [DOI] [PMC free article] [PubMed] [Google Scholar]
- 13.Bolner A., Tagliaro F., Lomeo A. Optimised determination of clobazam in human plasma with extraction and high-performance liquid chromatography analysis. J. Chromatogr. B Biomed. Sci. Appl. 2001;750(1):177–180. doi: 10.1016/s0378-4347(00)00440-0. [DOI] [PubMed] [Google Scholar]
- 14.Rouini M., Ardakani Y.H., Hakemi L., Mokhberi M., Badri G. Simultaneous determination of clobazam and its major metabolite in human plasma by a rapid HPLC method. J. Chromatogr. B Analyt. Technol. Biomed Life Sci. 2005;823(2):167–171. doi: 10.1016/j.jchromb.2005.06.031. [DOI] [PubMed] [Google Scholar]
- 15.Akerman K.K. Analysis of clobazam and its active metabolite norclobazam in plasma and serum using HPLC/DAD. Scand. J. Clin. Lab. Invest. 1996;56(7):609–614. doi: 10.3109/00365519609090595. [DOI] [PubMed] [Google Scholar]
- 16.Mikayelyan A., et al. Protein precipitation method for determination of clobazam and N-desmethylclobazam in human plasma by LC-MS/MS. Biomed. Chromatogr. 2020;34(1) doi: 10.1002/bmc.4710. [DOI] [PubMed] [Google Scholar]
- 17.Christian S., Patel R., Shivprakash A. Rapid and sensitive LC-MS/MS Aassay for the determination of Clobazam in human plasma using Electro spray ionization technology. Int. J. Pharm. Sci. Res. 2018:2369–2377. [Google Scholar]
- 18.Déglon J., Versace F., Lauer E., Widmer C., Mangin P., Thomas A., Staub C. Rapid LC-MS/MS quantification of the major benzodiazepines and their metabolites on dried blood spots using a simple and cost-effective sample pretreatment. Bioanalysis. 2012;4(11):1337–1350. doi: 10.4155/bio.12.42. [DOI] [PubMed] [Google Scholar]
- 19.Kintz P., Villain M., Concheiro M., Cirimele V. Screening and confirmatory method for benzodiazepines and hypnotics in oral fluid by LC-MS/MS. Forensic Sci. Int. 2005;150(2-3):213–220. doi: 10.1016/j.forsciint.2004.12.040. [DOI] [PubMed] [Google Scholar]
- 20.Odoardi S., Fisichella M., Romolo F.S., Strano-Rossi S. High-throughput screening for new psychoactive substances (NPS) in whole blood by DLLME extraction and UHPLC-MS/MS analysis. J. Chromatogr. B Analyt. Technol. Biomed Life Sci. 2015;1000:57–68. doi: 10.1016/j.jchromb.2015.07.007. [DOI] [PubMed] [Google Scholar]
- 21.Laloup M., Fernandez M.d.M.R., De Boeck G., Wood M., Maes V., Samyn N. Validation of a liquid chromatography-tandem mass spectrometry method for the simultaneous determination of 26 benzodiazepines and metabolites, zolpidem and zopiclone, in blood, urine, and hair. J. Anal. Toxicol. 2005;29(7):616–626. doi: 10.1093/jat/29.7.616. [DOI] [PubMed] [Google Scholar]
- 22.De Boeck M., Missotten S., Dehaen W., Tytgat J., Cuypers E. Development and validation of a fast ionic liquid-based dispersive liquid-liquid microextraction procedure combined with LC-MS/MS analysis for the quantification of benzodiazepines and benzodiazepine-like hypnotics in whole blood. Forensic Sci. Int. 2017;274:44–54. doi: 10.1016/j.forsciint.2016.12.026. [DOI] [PubMed] [Google Scholar]
- 23.Nakamura M., Ohmori T., Itoh Y., Terashita M., Hirano K. Simultaneous determination of benzodiazepines and their metabolites in human serum by liquid chromatography-tandem mass spectrometry using a high-resolution octadecyl silica column compatible with aqueous compounds. Biomed. Chromatogr. 2009;23(4):357–364. doi: 10.1002/bmc.1122. [DOI] [PubMed] [Google Scholar]
- 24.Smink B., Brandsma J., Dijkhuizen A., Lusthof K., Gier J., Egberts A., Uges D. Quantitative analysis of 33 benzodiazepines, metabolites and benzodiazepine-like substances in whole blood by liquid chromatography-(tandem) mass spectrometry. J. Chromatogr. B Analyt. Technol. Biomed. Life Sci. 2004;811(1):13–20. doi: 10.1016/j.jchromb.2004.03.079. [DOI] [PubMed] [Google Scholar]
- 25.Dixon R.B., Mbeunkui F., Wiegel J.V. Stability study of opioids and benzodiazepines in urine samples by liquid chromatography tandem mass spectrometry. J. Anal. Sci. Technol. 2015;6(1):17. [Google Scholar]
- 26.Gautam, L., S.D. Sharratt, and M.D. Cole, Drug facilitated sexual assault: detection and stability of benzodiazepines in spiked drinks using gas chromatography-mass spectrometry. PLoS One, 2014. 9(2): p. e89031. [DOI] [PMC free article] [PubMed]
- 27.Papadoyannis I., Uddin M.N., Samanidou V. Stability study of six 1,4-benzodiazepines in bio-fluids stored at-20°C. Chiang Mai Journal of Science. 2010;37 [Google Scholar]
- 28.Garcia, L., et al., Novel and Nonroutine Benzodiazepines and Suvorexant by LC-MS-MS. J Anal Toxicol, 2021. 45(5): p. 462-474. [DOI] [PubMed]
- 29.Kosaki K., Tamura K., Sato R., Samejima H., Tanigawara Y., Takahashi T. A major influence of CYP2C19 genotype on the steady-state concentration of N-desmethylclobazam. Brain Dev. 2004;26(8):530–534. doi: 10.1016/j.braindev.2004.02.010. [DOI] [PubMed] [Google Scholar]
Associated Data
This section collects any data citations, data availability statements, or supplementary materials included in this article.
Data Availability Statement
The data underlying this article are available in the article.