

SUMMARY
Immune checkpoint blockade (ICB) has been a remarkable clinical advance for cancer; however, the majority of patients do not respond to ICB therapy. We show that metastatic disease in the pleural and peritoneal cavities is associated with poor clinical outcomes after ICB therapy. Cavity-resident macrophages express high levels of Tim-4, a receptor for phosphatidylserine (PS), and this is associated with reduced numbers of CD8+ T cells with tumor-reactive features in pleural effusions and peritoneal ascites from patients with cancer. We mechanistically demonstrate that viable and cytotoxic anti-tumor CD8+ T cells upregulate PS and this renders them susceptible to sequestration away from tumor targets and proliferation suppression by Tim-4+ macrophages. Tim-4 blockade abrogates this sequestration and proliferation suppression and enhances anti-tumor efficacy in models of anti-PD-1 therapy and adoptive T cell therapy in mice. Thus, Tim-4+ cavity-resident macrophages limit the efficacy of immunotherapies in these microenvironments.
INTRODUCTION
Tissue-resident macrophages originate from embryonic precursors that seed tissues during development and can self-maintain locally throughout life with tissue-specific levels of replacement by circulating precursors (Bleriot et al., 2020). In addition to the immunosuppressive activity of infiltrating myeloid populations (Engblom et al., 2016), it has been shown that tissue-resident macrophages in solid organs can promote tumor progression in cancer (Bowman et al., 2016; DeNardo and Ruffell, 2019; Loyher et al., 2018; Zhu et al., 2017). The mechanisms by which this abundant pre-existing cell type impairs anti-tumor immunity remain to be further elucidated. Elegant pre-clinical studies have demonstrated that peritoneal, pleural, and pericardial spaces contain a distinct population of cavity-resident macrophages that are ontogenically, transcriptionally, and functionally related (Buechler et al., 2019). The pleural and peritoneal cavities represent immunosuppressive environments that are common sites of cancer progression (Donnenberg et al., 2019; Morano et al., 2016; Porcel et al., 2015). Concordantly, an analysis of lesions grouped by anatomic sites revealed that pleural lesions in patients with non-small cell lung cancer (NSCLC) were substantially less responsive to PD-1 pathway blockade compared to other sites (Osorio et al., 2019). Hence, we hypothesized that cavity-resident macrophages may impair anti-tumor activity in these anatomic spaces and sought to define the mechanisms underlying this impairment.
RESULTS
Metastatic involvement of the serous body cavities is associated with worse clinical outcomes from immune checkpoint blockade
To evaluate whether malignant involvement of the serous body cavities was associated with inferior clinical outcomes to ICB, we performed a retrospective analysis of 500 patients with metastatic NSCLC treated at Memorial Sloan Kettering Cancer Center (MSKCC) with either anti-PD(L)-1 or combined anti-PD-1 and anti-CTLA-4 blockade. We observed that radiographic evidence of malignancy in the peritoneal or pleural cavity, was associated with an inferior response rate compared to the total cohort (response was radiologically defined per RECIST v.1.1, Figure 1A, S1A). Patients in the MSKCC cohort with radiographical evidence of pleural or peritoneal disease also manifested a worse progression-free (PFS) and overall survival (OS) after the start of ICB on univariate analysis (Figure 1B–E). In contrast, as a comparator, patients with adrenal metastases did not have worse PFS or OS outcomes after ICB on univariate analysis (Figure S1C–D). In order to account for the concomitant presence of metastases in multiple sites in patients, we performed a multivariate analysis utilizing the Cox Proportional Hazards model for metastatic lesions involved in at least 5% of the total patient cohort. On this multivariate analysis, we confirmed that metastatic involvement of the pleural and peritoneal cavities was associated with worse PFS and OS (Figure 1F–G). Of note, metastatic involvement of the liver and bone was also associated with worse PFS and OS on both univariate and multivariate analyses (Figure 1F–G, S1E–H), which is consistent with recent reports that these anatomic sites also represent immunosuppressed microenvironments (Jiao et al., 2019; Lee et al., 2020; Yu et al., 2021). Brain metastases were associated with worse PFS, but not OS, on univariate analysis and there was no association on multivariate analysis (Figure 1F–G, S1I–J). Involvement of the thoracic lymph nodes (LN) was common and associated with worse PFS and OS on univariate analysis, but this association was seen only for OS upon multivariate analysis (Figure 1F–G, S1K–L).
Figure 1. Malignant involvement of the serous body cavities is associated with worse clinical outcomes in patients treated with immune checkpoint blockade.
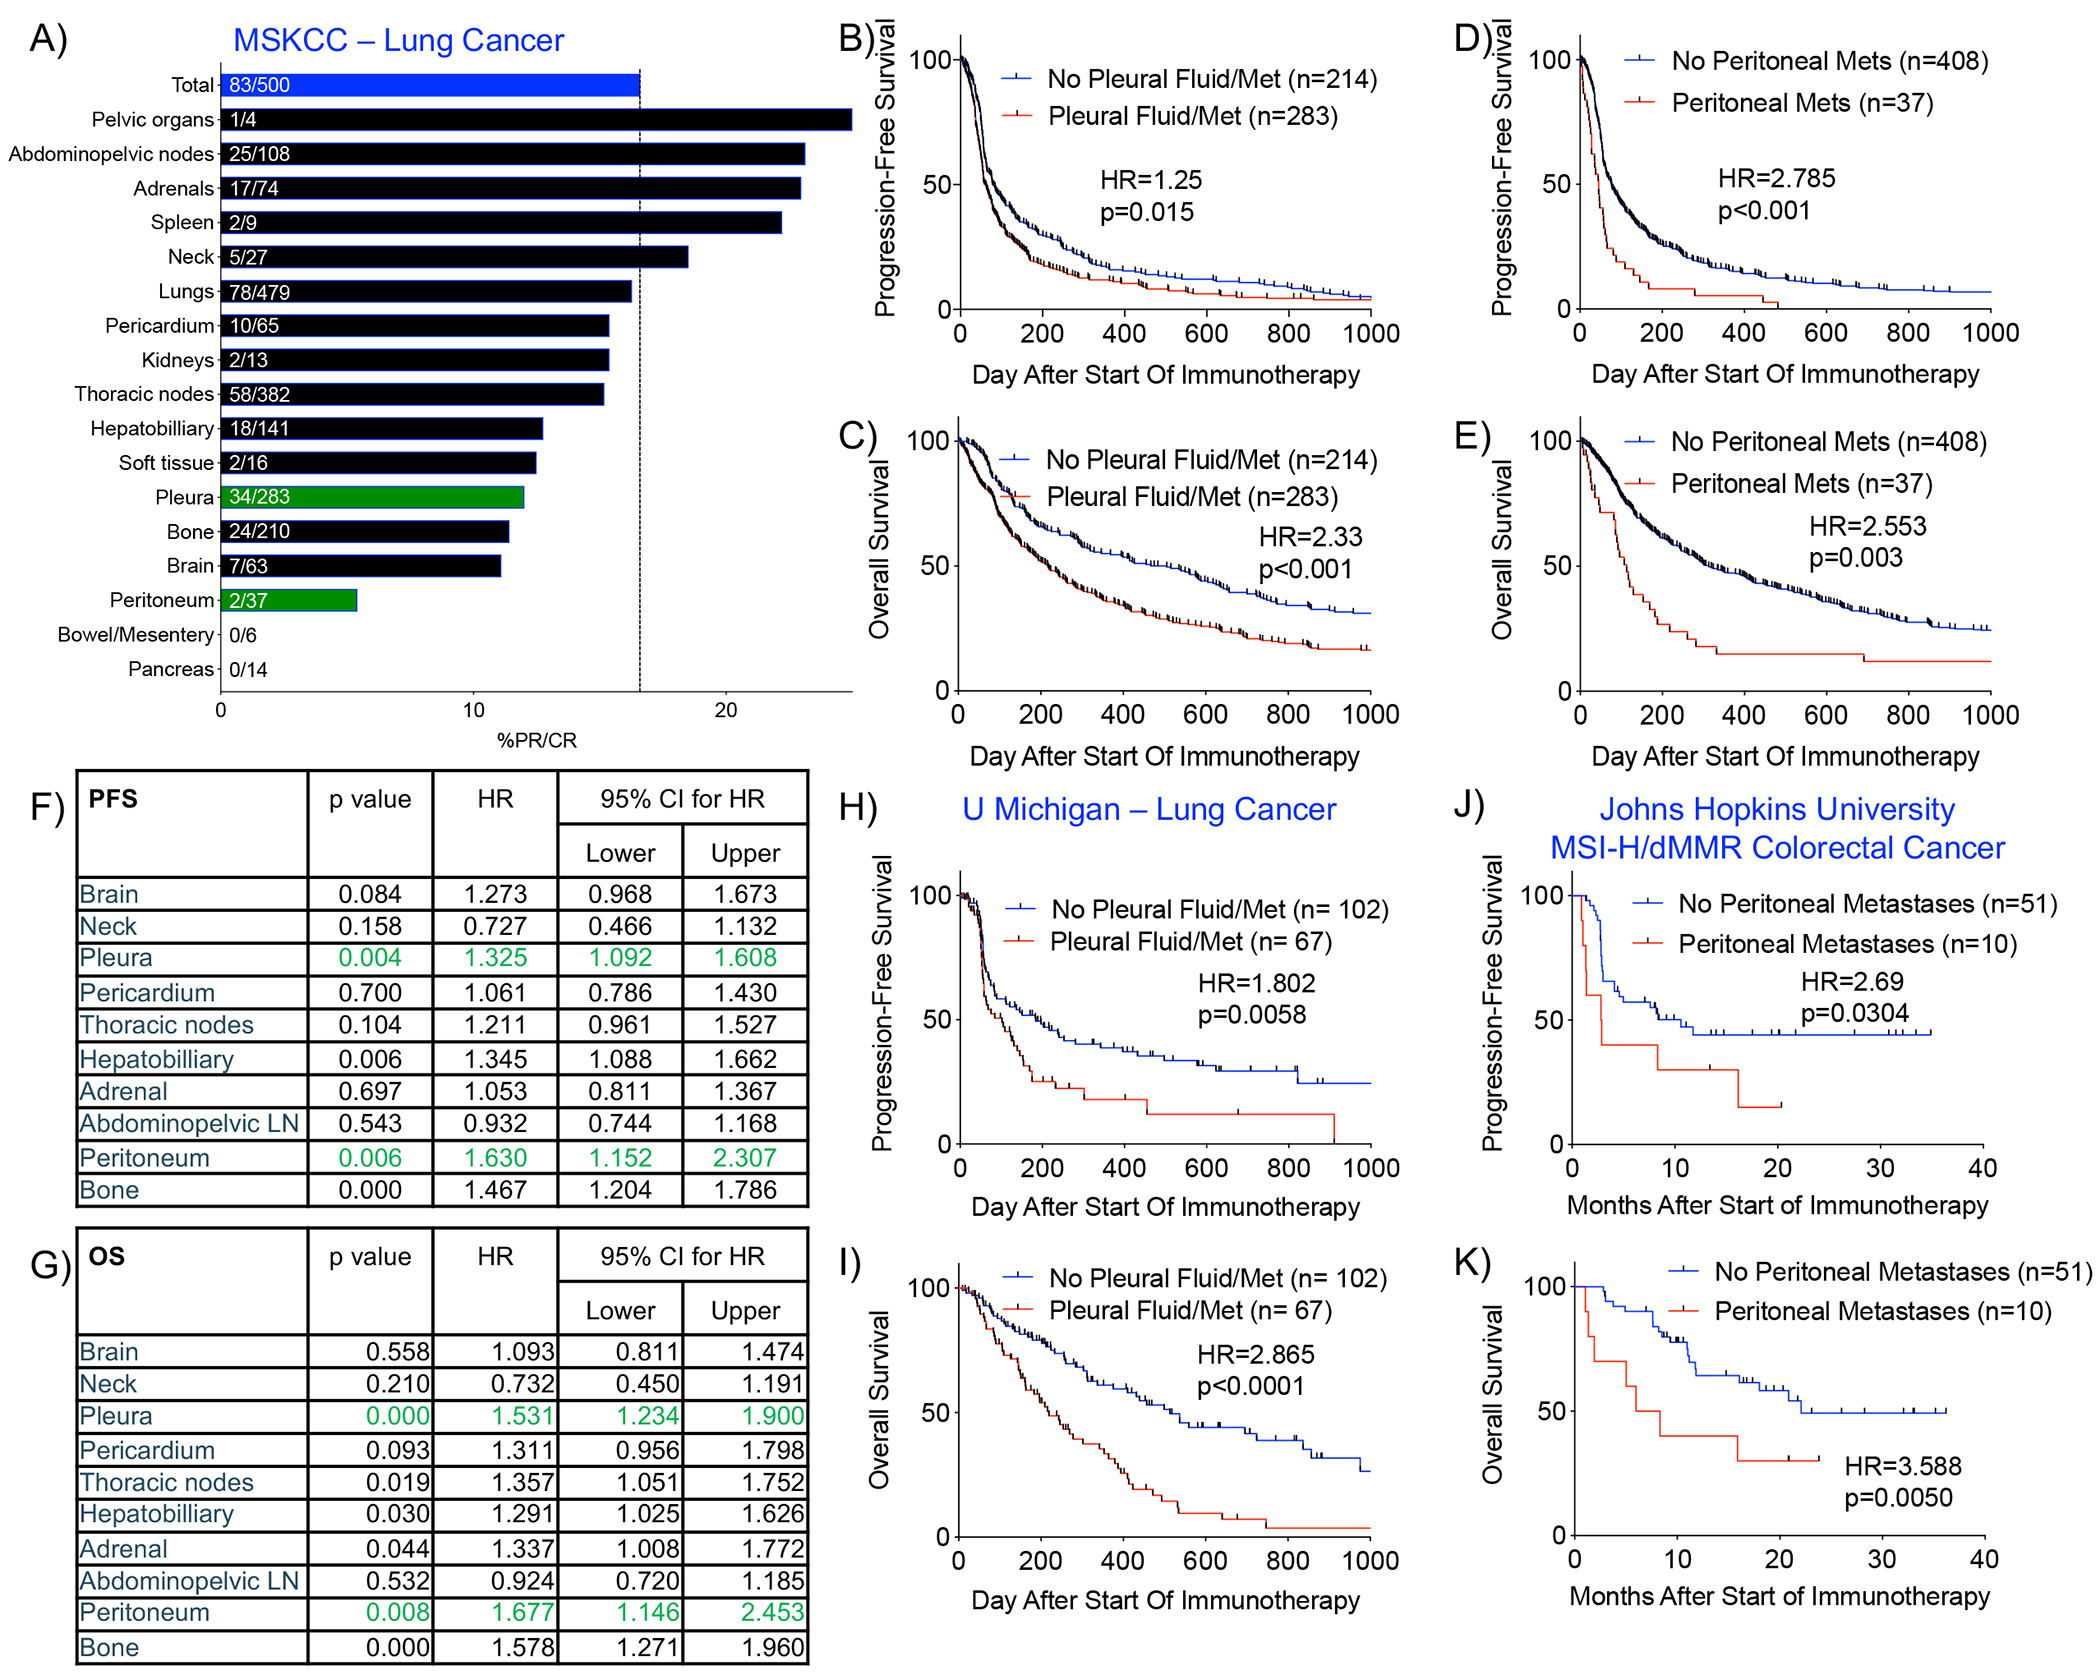
A) % partial or complete response (%PR/CR) among patients with NSCLC at MSKCC who received ICB and whose pre-ICB imaging was annotated for metastatic involvement of various anatomic sites. %PR/CR in the total cohort is indicated by the blue bar (83/500=16.6%). B-C) Progression-free (PFS) and overall survival (OS) among MSKCC patients with NSCLC treated with ICB with or without evidence of metastatic involvement of the pleural cavity. D-E) PFS and OS among patients with or without evidence of metastatic involvement of the peritoneal cavity. F-G) Multivariate analyses of PFS and OS using Cox Proportional Hazard Model taking into account concomitant involvement of multiple metastatic sites. H-I) PFS and OS among patients with NSCLC at University of Michigan with or without metastatic involvement of the pleural cavity. (J-K) PFS and OS among patients from Johns Hopkins University with MSI-H/dMMR colorectal cancer with or without metastatic involvement of the peritoneal cavity. Statistical analyses of survival curves were performed with Mantel-Cox test. See also Figure S1.
To assess the generalizability of these findings, we analyzed an independent cohort of 170 patients receiving ICB at University of Michigan (Figure S1B). Similar to the MSKCC cohort, patients with radiographic evidence of pleural metastases had inferior PFS and OS (Figure 1H–I). There were an insufficient number of patients with peritoneal metastases in the University of Michigan cohort (n=3) to address the prognostic/predictive implications of peritoneal metastases in this cohort. Again, patients with adrenal metastases did not have worse PFS or OS after ICB in the University of Michigan cohort (Figure S1M–N). In order to assess whether metastases to the serous body cavities are associated with worse outcomes in other cancers, we re-queried baseline radiographical data from a cohort of 61 patients with microsatellite instability (MSI)-high colorectal cancer who underwent treatment with ICB therapy at Johns Hopkins University (previously published (Le et al., 2017; Osorio et al., 2019)) and assessed for differential survival outcomes in patients. Concordant with our findings in lung cancer, we observed worse PFS and OS in the patients who were noted to have peritoneal metastases at the start of treatment (Fig 1J–K). These clinical outcomes data support the notion that the serous body cavities represent an immunosuppressed microenvironment.
Tim-4 is expressed on cavity-resident macrophages and not infiltrating tumor-associated macrophages
Murine peritoneal and pleural macrophages express high levels of the phosphatidylserine receptor Tim-4, and Tim-4 marks the tissue-resident population in the serous body cavities, comprising both embryonic-derived and bone marrow precursor-derived populations (Bain et al., 2016; Miyanishi et al., 2007; Wong et al., 2010). Abrogation of Tim-4 in mice is associated with autoantibody production and enhanced anti-tumor activity, implicating Tim-4 in immune regulation (Cunha et al., 2018; Miyanishi et al., 2007; Rodriguez-Manzanet et al., 2010). We hypothesized that the site-specific presence of Tim-4+ macrophages might contribute to differential clinical outcomes of anatomically distinct metastatic lesions. By performing immunohistochemistry of human tissues and flow cytometry of murine and human tissues, we found Tim-4 to be expressed on macrophages from the peritoneal and pleural cavities, but not on benign or malignant tissues of the adrenal gland or lung (Figure 2A–B). In mice, Tim-4 expression was found on the “large” F4/80high MHC IIlow but not the “small” F4/80low MHC IIhigh subset of cavity macrophages (Ghosn et al., 2010) (Figure S2A). Consistent with prior reports (Albacker et al., 2013; Scott et al., 2016; Wong et al., 2010), we also found Tim-4 expression on liver Kupffer cells and lymphoid tissue macrophages (Figure S2B–C). In line with publicly available microarray and RNA sequencing data at the Immunological Genome Consortium (Heng et al., 2008), we did not find evidence of Tim-4 expression on steady-state murine or human circulating monocytes (Figure S2D–E), nor did we find Tim-4 expression on murine peritoneal tumor-associated monocytes (Bain and Jenkins, 2018) (Figure S2F), nor other hematopoietic cells of the serous body cavities (Figure S2G–H).
Figure 2. Tim-4 is expressed on human serous body cavity macrophages and is inversely correlated with the frequency of CD8+ CD39+ T cells.

A) Immunohistochemistry staining of Tim-4 on histological tissue section of benign adrenal gland, cytospun malignant peritoneal ascites from a patient with NSCLC, cytospun malignant pleural effusion from a patient with NSCLC, and tissue section of benign lung. Positive cells are indicated by arrowhead. B) Flow cytometric expression of Tim-4 protein on steady-state C57BL/6 murine adrenal CD3− CD19− CD11b+ F4/80+ macrophages, peritoneal CD3− CD19− CD11b+ F4/80+ macrophages, pleural CD3− CD19− CD11b+ F4/80+ macrophages, and lung CD3− CD19− CD11bint F4/80+ CD11c+ I-A/I-E+ macrophages (top row). Human tissues were obtained from patients with NSCLC with malignant involvement of indicated tissues (bottom row). All human macrophage populations were gated as CD3− CD14+. Blue histogram indicates isotype control; red histogram indicates Tim-4 stain. C-F) Flow cytometry staining of VSIG-4, CD102, and Tim-4 on CD3− CD14+ peritoneal and pleural macrophages from patients with lung cancer. G-H) Flow cytometry expression of VSIG4, CD102, and Tim-4 on CD3− CD14+ pericardial macrophages in a patient with NSCLC and peritoneal macrophages from a patient with ovarian cancer. I) Among 55 pleural, peritoneal, and pericardial fluid biospecimens from patients with lung cancer, fraction of patients considered to have low vs high Tim-4 expression. J) %CD8+ T lymphocytes isolated from the peritoneal, pleural, or pericardial fluid specimen of patients with lung cancer. Mean ± SEM is displayed, n=27-28. Statistical analysis performed with two-sided student’s t test. n.s. = not significant. K) Representative staining for CD39 and PD-1 on CD8+ T cells from pleural effusions of patients MSK1139b and MSK1266a. L) %CD39+ among CD8+ T cells isolated from peritoneal, pleural, or pericardial fluid biospecimens of patients with lung cancer as in (J). Mean ± SEM is displayed, n=27-28. Statistical analysis performed with two-sided student’s t test. See also Figure S2–5.
In order to determine the global expression pattern of Tim-4, we performed positron emission tomography (PET) imaging and biodistribution assays of radioactively-labelled anti-murine Tim-4 antibody. We observed strong Tim-4 signal in the liver, spleen, bones, and lymph nodes that was reduced by co-infusion of excess amounts of unlabeled antibody (Figure S3A–B). This is indicative of specific uptake and is consistent with the expression pattern that we had documented by IHC and flow cytometry in resident macrophages in those tissue compartments (Figure S2A–B). While uptake was observed in B16F10 melanoma and MC38 colon carcinoma tumors that were subcutaneously implanted, this signal increased after co-infusion of excess amounts of unlabeled antibody, which indicates non-specific blood pooling in these presumably well-vascularized tumor beds (Figure S3A–B). This lack of specific uptake in the subcutaneous tumors also suggested that Tim-4 was not expressed on tumor-associated macrophages or the tumor cells themselves. To directly assess this, we performed flow cytometry on F4/80+ CD11b+ tumor-associated macrophages and CD45− FSChigh tumor cells in four different murine tumor models and consistently found no expression of Tim-4 (Figure S3C–E). Concordantly, we did not observe Tim-4 expression on human CD45− FSChigh tumor cells from the serous body cavities of patients with NSCLC (Figure S3F). When we assessed for Tim-4 expression in tumors that have metastasized into tissues with native Tim-4+ macrophages (e.g. liver, lymph node, and spleen), we observed Tim-4 staining only in the native tissue compartment, not the invading tumor area (Figure S3G). Taken together, our studies in murine and human systems demonstrate specific Tim-4 expression on resident macrophages, but not on monocytes, tumor-associated macrophages, or tumor cells.
High levels of Tim-4 on human cavity-resident macrophages are associated with reduced CD8+ CD39+ T cells
Bulk RNA sequencing revealed that murine Tim-4+ macrophages expressed high levels of Vsig4, Gata6, Adgre1 (F4/80) and Icam2 (CD102) (Figure S4A–B, Table S1), which are highly expressed by resident peritoneal macrophages (Bain and Jenkins, 2018). We confirmed protein expression of VSIG4 and CD102 on murine Tim-4+ cavity-resident macrophages (Figure S4C). In order to better characterize the human counterparts of these murine cavity-resident macrophages, we performed detailed clinical annotation and flow cytometry on 55 consecutive serous body cavity fluid biospecimens from patients with lung cancer comprising 52 pleural effusions, 2 peritoneal ascites, and 1 pericardial effusion (Table S2). Protein expression of VSIG4 and CD102 was consistently observed on human CD3− CD14+ cavity-resident macrophages from patients with lung cancer (Figure 2C–G). We also observed similar expression in the peritoneal ascites fluid of patients with ovarian cancer (Figure 2H), which is concordant with two reports that utilized VSIG4 as a marker of human peritoneal resident macrophages (Irvine et al., 2016; Xia et al., 2020). Unlike murine peritoneal macrophages, human pleural and peritoneal macrophages do not appear to express GATA-6 (Figure S4D). There was notable interpatient variability in Tim-4 staining intensity on human CD3− CD14+ macrophages (Figure 2C–H) with nearly half of the samples in the lung cancer cohort having high levels of Tim-4 expression on macrophages (Figure 2I). On univariate analysis, age, gender, prior tobacco use, cytopathology status, prior chemotherapy, recent thoracic radiation, prior immunotherapy, and time elapsed since stage IV diagnosis were not associated with high expression of Tim-4 on macrophages (Figure S5A–H). We did note that fluid samples from EGFR-mutant lung cancers were enriched for high levels of Tim-4 on cavity-resident macrophages relative to KRAS-mutant lung cancers (Figure S5I), which may contribute to the particularly poor response of EGFR-mutant lung cancers to ICB therapy (Hastings et al., 2019). Although we did not observe differences in total CD8+ T cells (Figure 2J), fluid samples with high levels of Tim-4+ macrophages were associated with a reduced percentage of CD39+ among CD8+ T cells (Figure 2K–L), which are enriched for tumor antigen-reactive cytotoxic T cells (Duhen et al., 2018; Simoni et al., 2018). CD8+ PD-1+ T cells have also been associated with tumor reactivity (Gros et al., 2014) and improved responses to immunotherapy in lung cancer (Kumagai et al., 2020; Thommen et al., 2018). When we evaluated for PD-1 expression on CD8+ T cells in patients with low and high expression of Tim-4 on cavity-resident macrophages, we also observed an inverse correlation between Tim-4 expression on macrophages and PD-1 level on CD8+ T cells (Figure S5J–K). Therefore, there is substantial inter-patient variability in Tim-4 level on cavity-resident macrophages from patients with lung cancer, and higher levels are associated with the reduced presence of CD8+ T cells with phenotypic features of tumor reactivity.
Tim-4 abrogation improves anti-PD-1 efficacy in a murine model of peritoneal carcinomatosis
Based on these clinical observations and the expression pattern of Tim-4, we reasoned that Tim-4+ macrophages might promote immunosuppression, and that Tim-4 blockade could represent a strategy to enhance the efficacy of ICB in these microenvironments. To further explore this, we established a model of peritoneal carcinomatosis with a MC38 colon carcinoma cell line expressing luciferase and GFP (MC38-LG). All mice displayed peritoneal tumor burden as measured by bioluminescence one week after tumor challenge (Figure 3A) and this was associated with an infiltration of CD8+ T cells and an expansion of both Tim-4− and Tim-4+ macrophages (Figure S6A–C). Notably, recent work in a murine ovarian peritoneal carcinomatosis model revealed that the expansion of the Tim-4− macrophage compartment was attributable to infiltrating myeloid cells, whereas the expansion of the Tim-4+ macrophage compartment was largely attributable to local proliferation of resident macrophages (Xia et al., 2020). Whereas abrogation of Tim-4− macrophages did not affect tumor growth, depletion of Tim-4+ macrophages impaired tumor growth in the peritoneal cavity.
Figure 3. Antibody blockade and genetic abrogation of Tim-4 enhances responses to anti-PD-1 therapy in mice.

A) Bioluminescence images from individual C57BL/6 mice at indicated times after peritoneal tumor challenge (TC) with MC38-Luciferase-GFP. Mice received isotype control antibodies (Iso-Iso), anti-Tim-4 and isotype (αTim-4-Iso), isotype and anti-PD-1 (Iso-αPD-1), or anti-Tim-4 and anti-PD-1 (αTim-4-αPD-1). One representative of three independent experiments is depicted. B) Bioluminescence measured as photons per second (p/s) at week three after TC in C57BL/6 mice treated as indicated. N=27-28 at start of experiment, pooled from three independent experiments. Statistical analysis performed with two-sided Mann-Whitney U test. C) Kaplan-Meier survival curve for C57BL/6 mice treated as in (B). Statistical analysis performed with Mantel-Cox test. D-E) Absolute number of CD8+ T cells and CD8+ CD39+ T cells in the peritoneal cavity of C57BL/6 mice 14 days after tumor challenge and treated as in (B). N=10-15, pooled from ≥2 independent experiments. Statistical analyses performed with two-sided student’s t test. F) Bioluminescence measured at week three after TC in Tim-4 Het or KO mice treated as indicated. N=26-31 at start of experiment, pooled from three independent experiments. Statistical analysis performed with two-sided Mann-Whitney U test. G) Kaplan-Meier survival curve for mice treated as in (F). Statistical analysis performed with Mantel-Cox test. H-I) Absolute number of CD8+ T cells and CD8+ CD39+ T cells in the peritoneal cavity of C57BL/6 mice 14 days after TC and treated as in (F). N=5, representative of 2 independent experiments. Statistical analyses performed with two-sided student’s t test. J) Tumor growth curves as measured by in vivo bioluminescence signal from individual C57BL/6 mice at indicated times after peritoneal TC with HKP1-Luc-mCherry. K) Kaplan-Meier survival curve for mice treated as in (J). Statistical analysis performed with Mantel-Cox test. For plots B, D, E, F, H, and I, mean ± SEM is displayed. See also Figure S6.
In our MC38-LG model, treatment of mice with anti-PD-1 monotherapy starting one week after tumor inoculation reduced tumor burden and increased survival (Figure 3A–C). Although antibody blockade of Tim-4 alone starting one week after tumor challenge had no durable effect on tumor burden or survival, it enhanced the protection afforded by anti-PD-1 blockade (Figure 3A–C). This was associated with an increase in total CD8+ and CD8+ CD39+ T cells in the peritoneal cavity (Figure 3D–E). We confirmed these results utilizing mice that were genetically deficient in Tim-4 (Tim-4 KO, Figure 3F–I). Surviving mice were protected from tumor re-implantation with the parental MC38 cell line, indicating that the protective immunity was conferred against native MC38 tumor antigens rather than GFP or luciferase (Figure S6D–E). We further verified this in a second model of peritoneal carcinomatosis with CT26 colon adenocarcinoma (Figure S6F–G). In a third model of peritoneal carcinomatosis with the KrasG12D p53−/− lung cancer cell line carrying the reporter proteins Luciferase and mCherry (HKP1-Luc-mCherry), we also observed enhanced tumor control and survival in mice treated with both anti-Tim-4 and anti-PD-1 (Figure 3J–K).
In the MC38 model, Tim-4 abrogation did not deplete peritoneal Tim-4+ macrophages or alter the levels of PD-L1 or MHC II on Tim-4+ macrophages, nor did Tim-4 abrogation significantly reduce the number of other myeloid cells or regulatory T cells (Figure S6H–U). In order to better mechanistically understand how Tim-4 abrogation enhances anti-tumor activity, we performed bulk RNA sequencing of sorted Tim-4+ macrophages from anti-PD-1-treated MC38-LG-bearing animals that were also treated with isotype control or anti-Tim-4 (Figure S6V, Table S3A). After DESeq2 analysis, we observed 770 genes that were differentially expressed between Tim-4+ macrophages from these two groups of mice. Among macrophage-associated genes, anti-Tim-4 treatment reduced the expression of Ptgs2, Tgfb2, and Tdo2, while increasing expression of Stab1 and Mrc1 (Table S3B). Consistent with the flow cytometry data, Tim-4 blockade was not associated with a decrease in PD-L1 or increase in MHC II expression (Table S3B–C). Surprisingly, despite sorting for Tim-4+ macrophages – with standard doublet exclusion settings, a large number of T cell transcripts were uncovered (e.g. Gzmd, Gzme, Gzmc, Gzmf, Prf1, Gzmb, Trbc2, Cd8b1, Tigit, Eomes, Thy1, Trac, Ctla4, Gzma, Tox, Nkg7, Lck, Cd3e, Pdcd1, Cd4, Tnfrsf4, Lag3, Tbx21, and Tnfrsf18). These T cell-associated transcripts were reduced in mice receiving concomitant Tim-4 blockade (Table S3D). These results pointed to a Tim-4-dependent interaction of T cells with cavity-resident macrophages (e.g. engulfment or adhesion) that impeded the function of tumor-cytolytic T cells and reduced the efficacy of anti-PD-1 therapy.
T cell activation upregulates PS levels on viable and cytotoxic CD8+ T cells
To further define how T cells might interact with Tim-4+ macrophages, we assessed the phospholipid level of the Tim-4 ligand PS on CD8+ T cells. Murine T cells localize PS to the immunological synapse upon antigen encounter and it has been hypothesized that this serves as a protective mechanism for the cytotoxic T cell to prevent self-cytotoxicity upon degranulation (Rudd-Schmidt et al., 2019). Concordantly, human CD8+ T cells can reversibly upregulate PS upon antigen recognition (Fischer et al., 2006). Thus, we sought to identify contexts in which CD8+ T cells increase PS levels. Although commonly considered a cell death marker, we observed that after a variety of antigen-independent and antigen-dependent activation stimuli in both murine and human settings, viable CD8+ T cells upregulate PS levels (as assessed by Annexin V staining) while retaining low levels of Caspase 3/7 (hereafter named PShigh) (Figure 4A–B). This increase in PS on CD8+ T cells coincided with population expansion of the PShigh compartment (Fig S7A) and the rise of other activation markers including CD44, PD-1, and CD39, and with increased cell size (Figure S7B–C). Notably, per-cell PS phospholipid levels appeared to peak and decline 24-48 hours after T cell activation (Figure 4A–B, S7B–C and (Fischer et al., 2006)), whereas other activation markers such as CD39 in particular retained durable expression (Figure S7B–C). The durability of the CD39 marker was observed even if the T cell activation stimulus was removed after 24 hours (Fig S7B–C). We observed a population of viable CD8+ T cells with high levels of PS in the peritoneal lavage fluid of MC38-LG-bearing mice and also peritoneal ascites and pleural effusion biospecimens from patients with NSCLC (Figure S7D). In contrast to the negative correlation seen with CD8+ CD39+ and CD8+ PD-1+ T cells (Figure 3L, S3J–K), a high level of Tim-4 on human serous cavity macrophages did not correlate with reduced CD8+ PShigh T cells in the subset of patients in which these data were available (Figure S7E). This may be attributable to the less durable nature of PS compared to CD39 and PD-1 levels on CD8+ T cells (Figure S7C), which may reduce the robustness of PS as a biomarker in a heterogeneous cohort of patient biospecimens.
Figure 4. PShigh CD8+ T cells are viable and enriched in cytotoxic and proliferative effectors.

A-B) Flow cytometric assessment of Annexin V on DAPI− CD8+ T cells after murine or human T cell activation. Activation stimuli include anti-mouse CD3/CD28 microbeads (αCD3/28) or PMA/Ionomycin cultured with wild-type splenocytes or SIINFEKL and gp100 peptide cultured with OT-1 and pmel transgenic splenocytes, respectively. Human PBMCs were stimulated with αCD3/28. Gray and purple lines indicate splenocytes cultured without and with T cell stimulation, respectively. Mean ± SEM is displayed, n=4-6, representative of three independent experiments. Statistical analyses were performed with two-way ANOVA with Bonferroni Post-Test. C) PSlow and PShigh viable (DAPI− caspase 3/7low) CD8+ T cells were flow-sorted from the peritoneal cavity of MC38-LG-bearing mice that were treated with anti-Tim-4 and anti-PD-1 and placed into culture with parental MC38 tumor cells. Cytotoxicity was assessed by clonogenic cytotoxicity assay. D) Representative well images taken of MC38 colonies initially plated from remnant MC38 cells after 36-hour co-culture with CD8+ T cells. E) Cytotoxicity of PSlow and PShigh viable CD8+ T cells against parental MC38 targets. N=4, representative of three independent experiments. Statistical analysis performed with two-sided student’s t test. F) Cytotoxicity of PSlow (red) and PShigh (green) viable CD8+ T cells against MC38-LG cells after 48-hour co-culture at the indicated ratios. N=4, representative of two independent experiments. Statistical analysis performed with two-sided student’s t test. G) Heat map of expression of select differentially expressed T cell-associated genes in PSlow and PShigh viable CD8+ T cells isolated from the peritoneal cavity of MC38-LG-bearing mice that were treated with anti-Tim-4 and anti-PD-1 and assessed by single cell RNA sequencing (scRNAseq). H) Dot plot of expression of select genes associated with naïve T cells, effector T cells, cytotoxicity, proliferation, and activation/exhaustion in clusters 1-4. I) UMAP embedding of clusters 1-4 from sorted PShigh and PSlow viable CD8+ T cells. J) Dot plot of expression of select genes as in (H) on paired scRNA/TCRseq of MC38-associated PShigh and PSlow viable CD8+ T cells. See also Figure S7–9.
In order to assess the functional anti-tumor properties of PSlow and PShigh CD8+ T cells, we sorted these populations from mice bearing MC38-LG tumor that were treated with anti-Tim-4 and anti-PD-1 (Figure 4C) and assessed cytotoxicity. We observed that the PShigh fraction exerted greater cytotoxicity against both the parental MC38 (Figure 4D–E) and MC38-LG cells utilized in the tumor challenge (Figure 4F), indicating that these cells were not only viable, but in fact preferentially cytotoxic.
Single cell RNA sequencing indicates that CD8+ T cells expressing high levels of PS are associated with a highly cytotoxic state
In order to more comprehensively characterize PSlow and PShigh CD8+ T cells, we performed paired single cell RNA and TCR sequencing on 20,155 sorted PSlow and PShigh CD8+ T cells from MC38-LG-bearing mice that were treated with anti-Tim-4 and anti-PD-1. We observed that the PShigh CD8+ T cells differentially expressed higher levels of the proliferation marker Mki67, cytotoxic molecules (Gzmb, Gzmc, Gzmd, Gzme, Gzmf, Gzmg, Prf1), and activation/exhaustion genes (Tnfsf4, Tnfsf9, Pdcd1, Entpd1, Lag3, Havcr2), while PSlow CD8+ T cells had greater expression of naïve T cell markers, such as Ccr7 and Sell (Figure 4G, Table S4). In MC38-LG-bearing mice, we confirmed by flow cytometry that PShigh CD8+ T cells displayed higher levels of CD44, PD-1, CD39 and forward scatter (Figure S8A–D). We also confirmed by flow cytometry that PShigh CD8+ T cells expressed a higher level of granzyme B, and this was not reduced with short-term culture with macrophages (Figure S8E). We also observed that PShigh CD8+ T cells expressed greater levels of phosphatidylserine synthetases (Ptdss1 and Ptdss2), which synthesize PS, and also scramblases (Plscr1, Plscr3, Plscr4, Xkr8), which transport PS to the outer leaflet (Table S4B), suggesting active transcriptional activity promoting the PShigh state. Consistent with the recent report that T cells utilize phosphatidylserine to prevent self-cytotoxicity upon degranulation (Rudd-Schmidt et al., 2019), we observed that PS expression on murine CD8+ T cells tightly correlates with the expression of the degranulation marker CD107a after activation (Fig S8F–G).
In order to obtain a more refined view of CD8+ T cell states at the single-cell level, we performed unsupervised network-based clustering and identified four basic subclusters (Figure 4H–I, S9A, Table S5). Cluster 1 differentially expressed Tcf7, Ccr7, Lef1, Il7r, and Sell, which are consistent with naive CD8+ T cells. Cluster 2 differentially expressed genes associated with cytotoxicity (Gzmb, Gzmk) and proliferation (Stmn1a, Pclaf, Mki67, Hist1h1b, Top2a, Rrm2, Hist1h2ae, Tuba1b) and also expressed the highest levels of genes associated with activation/exhaustion (Entpd1, Havcr2, Tigit, Lag3, Pdcd1, Batf, Tox). Whereas cluster 3 differentially expressed cytotoxicity genes (Nkg7, Gzmb, Prf1, Fasl, Ifng) and activation/exhaustion genes (Pdcd1, Lag3), Cluster 4 differentially expressed naïve markers (Il7r, Tcf7) and effector genes (Icos, Cd28, Gzmk). We observed that PShigh CD8+ T cells were more likely to comprise the proliferating-cytotoxic cluster 2, whereas the PSlow CD8+ T cells were more prevalent in the naïve cluster 1 (Figure 4I). Notably, although we anticipated that PSlow CD8+ T cells would represent bystander T cells, there was substantial overlap (38.8% for TRA genes and 38.7% for TRB genes) in the T cell clonotypes observed in PSlow vs PShigh CD8+ T cells (Figure S9B), which indicated clonal relationships between the two subpopulations. We next sought to identify MC38-associated TCR sequences by procuring the top 10% most frequent VDJ sequences observed in mice bearing subcutaneous MC38 tumors in a prior study (Lee et al., 2019). We examined our scRNAseq data and observed that these MC38-associated TCR sequences were comparably represented in both subsets (Figure S9C). We identified the MC38-associated sequences in 166 PShigh and 247 PSlow CD8+ T cells that expressed 37 and 49 MC38-associated VDJ genes, respectively. When we compared the transcriptional profile of the PShigh and PSlow CD8+ T cells carrying these MC38-associated TCR sequences, we observed that the PShigh state was associated with enhanced expression of genes associated with proliferation and cytotoxicity (Figure 4J). Thus, the functional differences in PShigh vs PSlow CD8+ T cells were still present even when adjusting for TCR reactivity.
Tim-4+ cavity-resident macrophages sequester PShigh cytotoxic CD8+ T cells
We next assessed whether Tim-4 blockade enhanced the numbers of peritoneal PShigh CD8+ T cells in mice and indeed found increased numbers of these preferentially cytotoxic cells in dual anti-Tim-4 and anti-PD-1-treated mice or anti-PD-1-treated Tim-4 KO mice (Figure 5A–B). It has been reported that Tim-4+ lymph node macrophages clear antigen-specific T cells and this contributes to T cell contraction after infectious challenge and respiratory tolerance (Albacker et al., 2010; Albacker et al., 2013). To determine whether phagocytic clearance of PShigh activated T cells occurred in the serous body cavities, we flow-sorted DAPI− CD8+ T cells and dual labeled the cells with Cell Trace Violet (CTV) for general tracking and the pH sensitive dye Cypher5E to indicate phagocytosis. After intraperitoneal transfer, we did not find accumulation of Cypher5E signal in peritoneal macrophages (Figure S9D), arguing against phagocytosis of viable DAPI− PShigh CD8+ T cells. It has been elegantly shown that macrophages impede CD8+ T cells from reaching malignant cells in the tumor microenvironment (Peranzoni et al., 2018). We hypothesized that homing to malignant cells would be a challenge in the open spaces of serous body cavities and that “distracting” adhesive interactions with Tim-4+ macrophages could represent an additional barrier. Indeed, we observed preferential CTV accumulation on Tim-4+ macrophages, which is suggestive of preferential adhesion (Figure S9D–E). Thus, we next asked whether Tim-4-PS adhesive interactions could contribute to immunosuppression in the serous body cavities. To test this, we activated DAPI− CD8+ T cells obtained from UBC-GFP mice, which have universal expression of GFP in all cells (in order to remove the additional labeling step for convenience) and co-cultured with peritoneal macrophages. After 1–2 hours of co-culture, fewer CD8+ T cells were recovered from the non-adherent fraction after co-culture with isotype antibody-treated macrophages, which is indicative of an adhesive interaction (Figure 5C–D). Moreover, we were able to recover greater numbers of total and PShigh CD8+ T cells from the non-adherent fraction in the wells with peritoneal macrophages blocked with Tim-4 antibody (Figure 5C–D). There was no statistically significant difference in the number of recovered PSlow CD8+ T cell fractions (Figure 5E). We also observed reduced numbers of CD8+ T cells remaining in the macrophage-adherent layer (Figure 5F), indicating an abrogation of Tim-4-mediated sequestration. When CTV-labeled activated human CD8+ T cells were co-cultured with macrophages obtained from effusion or ascites biospecimens from patients with high levels of Tim-4 expression on macrophages, we also noted sequestration after co-culture with macrophages (Figure 5G–H). In order to better characterize these interactions, we performed time-lapse confocal microscopy between activated murine GFP+ CD8+ T cells and Cell Trace Far-Red labeled macrophages. We documented long-lasting interactions between macrophages and activated T cells lasting up to 12 hours and fewer interactions were observed in the setting of Tim-4 blockade (Figure 5I). In order to evaluate the functional consequences of these interactions, we flow-sorted DAPI− PShigh CD8+ T cells from anti-PD-1-treated MC38-LG-bearing Tim-4 KO mice and placed them into co-culture with parental MC38 tumor cells with or without co-culture with macrophages. We observed that cytotoxicity of MC38 tumor cells was reduced when the CD8+ T cells were pre-cultured with isotype-treated macrophages, and this phenomenon was reversed when the macrophages were pre-treated with anti-Tim-4 (Figure 5J). Thus, we demonstrate that functional sequestration of viable and cytotoxic PShigh CD8+ T cells by Tim-4+ macrophages is a targetable mechanism of suppression in the serous body cavities.
Figure 5. Tim-4+ macrophages functionally sequester PShigh CD8+ T cells.

A) Absolute number of PShigh CD8+ T cells in the peritoneal cavity of C57BL/6 mice 14 days after tumor challenge and treated as indicated. N=15, pooled from three independent experiments. Statistical analysis performed with two-sided student’s t test. B) Absolute number of PShigh CD8+ T cells in Tim-4 Het or KO mice 14 days after tumor challenge and treated as indicated. N=5, representative of two independent experiments. Statistical analysis performed with two-sided student’s t test. C-F) Absolute number of GFP+ DAPI− CD8+ T cells, GFP+ DAPI− PShigh CD8+ T cells, and GFP+ DAPI− PSlow CD8+ T cells in the non-adherent fraction or GFP+ DAPI− CD8+ T cells in the adherent fraction after culture alone or after co-culture with isotype- or anti-Tim-4-treated macrophages. N=6, representative of two independent experiments. Statistical analysis performed with two-sided student’s t test. G-H) Absolute number of CTV+ CD8+ T in the non-adherent or adherent fraction after culture alone or after co-culture with human macrophages obtained from the indicated biospecimens. N=3, representative of two independent experiments. Statistical analysis performed with two-sided student’s t test. I) Single frame image of confocal microscopy of GFP+ CD8+ T cells (green) adherent to Isotype- or Anti-Tim-4-treated Cell Trace Far Red+ macrophages (red) after 1hr of co-culture. See also Video S1 for 6 hours of imaging. Quantification of GFP+ cells adherent to Cell Trace Far Red+ macrophages on confocal microscopy. Representative of three independent experiments. Statistical analysis performed with two-way ANOVA with Sidak post-test. J) Cytotoxicity of PShigh CD8+ T cells sorted from the peritoneal cavity 14 days after tumor challenge with MC38-LG and treated with anti-Tim-4 and anti-PD-1. The T cells were initially cultured alone or with Isotype- or anti-Tim-4-treated macrophages for 1-2hr prior to removal of a silicon separator, which allowed the T cells to access the parental MC38 cell line. Cytotoxicity was assessed by Celigo well imaging after 40hr of culture. N=6, representative of two independent experiments. Statistical analysis performed with two-sided student’s t test. For all plots, mean ± SEM is displayed. See also Figure S9.
Tim-4+ cavity-resident macrophages impair the proliferation of CD8+ T cells
We and others have previously shown that macrophage-lineage cells can directly suppress T cell proliferation (De Henau et al., 2016; DeNardo and Ruffell, 2019). We reasoned that reduced Tim-4-mediated sequestration might potentially reduce the suppression of CD8+ T cell proliferation by the cavity-resident macrophages, and this could potentially explain the greater quantity of CD8+ T cells found in the peritoneal cavity of mice receiving concomitant abrogation of Tim-4 and PD-1. We initially performed in vitro CD8+ T cell suppression assays with murine peritoneal macrophages and splenic CD8+ T cells that were activated with anti-CD3/CD28 microbeads. We observed substantial suppression when the CD8+ T cells were cultured in the presence of peritoneal macrophages (Figure 6A–B). During our flow cytometric assessment of CD39 on CD8+ T cells, we had noted that both murine and human Tim-4+ macrophages also express high levels of CD39 (Figure 6C), which is a critical enzyme in the biosynthesis of the immunosuppressive molecule adenosine. We reasoned that the suppression of CD8+ T cell proliferation may be partially mediated by CD39 activity. When we inhibited CD39 with sodium metatungstate, we observed a partial reversal of this suppression (Figure 6A–B). Notably, CD39 inhibition did not increase proliferation of steady-state or activated CD8+ T cells that were not cultured with macrophages, suggesting that the cellular target of CD39 inhibition was macrophages. When human CD8+ T cells were activated in the presence of peritoneal or pleural macrophages from patients with lung cancer, we also observed similar suppression of proliferation that was partially dependent on CD39 (Fig 6D–G). In order to test whether Tim-4-mediated suppression of CD8+ T cells was relevant in vivo, we assessed Ki67 levels on peritoneal CD8+ T cells ten days after MC38-LG tumor challenge and observed greater CD8+ T cell proliferation in mice treated with both anti-Tim-4 and anti-PD-1 (Fig 6H). In order to test Tim-4-mediated suppression in another in vivo setting, we utilized a model of intraperitoneal carcinomatosis with MC38-Ova and infused pre-activated OT-1 CD8+ T cells (that recognizes Ovalbumin, Ova). We observed greater numbers of proliferated CTVlow OT-1 CD8 T cells 48 hours after intraperitoneal infusion into mice that were treated with anti-Tim-4 (Figure 6I). Importantly, this enhanced proliferation of adoptively transferred OT-1 T cells with anti-Tim-4 treatment was associated with greater survival in MC38-Ova-bearing mice (Figure 6I). Thus, Tim-4 blockade may also be a strategy to enhance the efficacy of adoptive T cell therapies that are being infused into serous body cavities, which is currently being explored in clinical trials (Grosser et al., 2019; Koneru et al., 2015).
Figure 6. Tim-4+ macrophages impair proliferation of activated CD8+ T cells.

A) Flow cytometry plots of CTV dilution by murine CD8+ T cells with the indicated co-culture conditions. B) Graphical compilation of data shown in panel A. N=3, representative of three independent experiments. Statistical analysis performed with two-sided student’s t test. C) Flow cytometry plots of CD39 expression (red) compared to FM1 (blue) for murine CD11b+ Tim-4+ or human CD14+ macrophages. D-E) Flow cytometry plots of CTV dilution by human CD8+ T cells with the indicated co-culture conditions, including co-culture with macrophages from MSK 347c and 1366a. F-G) Graphical compilation of data shown in panel D or E. N=3, representative of two independent experiments. H) Quantification of flow cytometric expression of Ki67 on CD8+ T cells obtained from the peritoneal cavities of MC38-LG bearing mice that were treated with Isotype and anti-PD-1 or anti-Tim-4 and anti-PD-1. N=10, representative of two independent experiments. Statistical analysis performed with two-sided student’s t test. I) Quantification of CTV dilution in CD45.2+ CD8+ T cells obtained from MC38-Ova-bearing animals 48 hours after infusion of pre-activated OT-1 cells (left panels). N=10, representative of two independent experiments. For plots B, F, G, H, and I, mean ± SEM is displayed. Kaplan-Meier survival curve for mice (right panel). N=20, pooled from two independent experiments. Statistical analysis performed with Mantel-Cox test.
DISCUSSION
In this study, we describe how Tim-4-mediated sequestration of viable cytotoxic PShigh CD8+ T cells by cavity-resident macrophages represents a previously unknown physiological checkpoint that limits anti-tumor activity in peritoneal and pleural sites of cancer. As PS levels are upregulated on CD8+ T cells after lymph node priming and egress, these effectors, which are in their most cytotoxic state, are predisposed to adhesive interaction with Tim-4+ macrophages upon infiltration into serous body cavities. This interaction also impairs proliferation of the infiltrating CD8+ T cells. The functional immunosuppression that we demonstrate in this manuscript is in line with three recent reports providing evidence that peritoneal tissue-resident macrophages that are Tim-4+ promote cancer progression in the serous body cavities (Casanova-Acebes et al., 2020; Etzerodt et al., 2020; Xia et al., 2020). It is plausible that this mechanism of immunosuppression evolved to prevent excess inflammation in the serous body cavities which can impair vital cardiac, pulmonary, and gastrointestinal functions.
While we provide evidence for a Tim-4-dependent sequestration and proliferation suppression mechanism, prior work has demonstrated that Tim-4-dependent autophagic and non-canonical autophagic pathways may also impair the antigen presentation function of myeloid cells (Baghdadi et al., 2013; Cunha et al., 2018). We have not directly assessed the effect of Tim-4 on antigen presentation in the serous body cavities and this mechanism may potentially be of greater relevance in other microenvironments, such as lymph nodes where antigen presentation predominantly occurs and where Tim-4+ macrophages are also found. Future work will elucidate whether the sequestration and proliferation suppression mechanisms that we have observed in the pleural and peritoneal cavities are also relevant in other anatomic compartments, such as the liver and secondary lymphoid organs. Our pre-clinical studies were performed in previously characterized relatively immunogenic murine models that are sensitive to ICB. This selects for models in which a robust intrinsic CD8+ T cell response is already present and our proposed mechanism is dependent on this. Whether Tim-4 blockade will be effective in truly “cold” tumors is a subject of future investigation. While we provide evidence that high levels of Tim-4 on cavity-resident macrophages in patients with lung cancer are associated with lower levels of CD8+ T cells with features of tumor reactivity (e.g. PD-1 and CD39), we have not confirmed in these biospecimens that these cells are indeed tumor-reactive. Another limitation of our findings in murine models is that the cancer cells were directly introduced into the peritoneal cavity. This may have greatest relevance for primary malignancies of the serous body cavities, such as primary peritoneal cancer or mesothelioma, and may limit extrapolation to malignancies that metastasize to these sites. Finally, our murine model did not evaluate Tim-4 abrogation in the context of dual ICB, which is utilized clinically in some contexts; future studies will assess whether the paradigm of Tim-4 mediated sequestration is relevant in the context of dual ICB with anti-PD-(L)1 and anti-CTLA-4.
Malignant pleural effusions and ascites are prevalent in cancer and portend poor oncological outcomes. Our findings highlight a mechanism of immunosuppression mediated by Tim-4+ macrophages in the serous body cavities and nominate Tim-4 blockade as a strategy to enhance the efficacy of CD8+ T cell-based immunotherapies.
STAR Methods
RESOURCE AVAILABILITY
Lead Contact
Further information and requests for resources and reagents should be directed to and will be fulfilled by the Lead Contact, Taha Merghoub (merghout@mskcc.org).
Materials Availability
This study did not generate new unique reagents.
Data and Code Availability
Bulk and single cell RNA-seq data presented in this study has been deposited in Gene Expression Omnibus database with accession numbers GSE174151 and GSE174241, respectively.
EXPERIMENTAL MODEL AND SUBJECT DETAILS
Clinical outcomes from immune checkpoint blockade
A retrospective review of 500 non-small cell lung cancer patients who received their first dose of ICB between April 18, 2011 and March 25, 2016 were analyzed for sites of metastatic involvement, response rate, progression-free survival, and overall survival. Response was radiologically defined per RECIST v.1.1. This study was approved by the MSKCC institutional review board and was conducted in accordance with the US Common Rule. A second cohort of 170 non-small cell lung cancer patients from University of Michigan who were treated between 2012 and 2015 was also retrospectively assessed. Approval of the University of Michigan Institutional Review Boards and patients’ consents was waived following Institutional Review Board protocol review. A third cohort of 61 colorectal cancer patients with mismatch repair deficiency treated with pembrolizumab from 2013-2016 was also analyzed (Le et al., 2017; Osorio et al., 2019). Peritoneal involvement was coded when patients had lesions noted in the omentum, abdomen, or peritoneum. Mesenteric involvement was coded separately. Multivariate analysis for metastatic sites involved in ≥5% of the MSKCC cohort was performed in SPSS with the Cox Proportional Hazards Model.
Human biospecimens
Primary tumors and pleural/peritoneal/pericardial effusions were obtained with informed consent from patients under protocol #06–107 approved by MSKCC.
Cell lines
MC38-LG, MC38 and CT26 tumor cells were maintained in RPMI supplemented with 10% FBS and 1% P/S (complete RPMI media). HKP1 and LLC tumor cells were maintained in DMEM supplemented with 10% FBS and 1% P/S (complete DMEM media). B16F10 cells were maintained in RPMI + 7.5% FBS + 1% P/S (prepared by MSKCC Media Preparation Core Facility). Cells were checked at least every 6 months and were negative for mycoplasma.
Mouse models
8-12 week old C57BL/6J and BALB/c animals were purchased from Jackson Laboratories for syngeneic tumor challenge experiments. Timd4−/− animals (Miyanishi et al., 2012) were re-derived from frozen sperm obtained from Riken Bioresource Center and maintained on a C57BL/6J line. C57BL/6-Tg(UBC-GFP)30Scha/J (004353), KrasLSL-G12D/+, and Trp53fl/fl, OT-1 TCR transgenic, and pmel transgenic mice were obtained from Jackson Laboratories. All mouse experiments were approved by the MSKCC Internal Animal Care and Use Committee. Mice were maintained under specific pathogen-free conditions, and food and water were provided ad libitum.
METHOD DETAILS
Immunohistochemistry
The immunohistochemistry detection of Tim-4 antibody was performed at Molecular Cytology Core Facility of MSKCC, using Discovery XT processor (Ventana Medical Systems, Roche - AZ). A rabbit polyclonal Tim-4 antibody was used at 0.2mg/ml concentration. The incubation with the primary antibody was done for 5 hours followed by 60 minutes with 5.75mg/ml biotinylated goat anti-rabbit IgG (Vector labs, cat#: PK6101). Blocker D, Streptavidin-HRP and DAB detection kit (Ventana Medical Systems) were used according to the manufacturer’s instructions. Slides were counterstained with hematoxylin and coverslipped with Permount (Fisher Scientific). A subset of Tim-4 IHC staining was performed on cytospun human pleural effusion and peritoneal ascites. Other Tim-4 IHC staining was performed on normal tissue microarray and metastatic cancer array. Slides were scanned with Pannoramic Flash P250 (3DHistech, Hungary). For Figure 2A and S2A, isotype staining was initially performed on benign lung, liver, spleen, lymph node, and bone marrow tissue and then slides were scanned. Afterwards, the initially isotype-stained slides were stained for anti-Tim-4 and then the slides were re-scanned.
Human tissue preparation and cellular isolation
Normal human lung, primary human lung cancer, and adrenal metastases were minced with a razor blade and digested in GentleMACS enzyme mix for 30–60 minutes according to manufacturer’s recommendations. Peritoneal ascites, pleural effusion, and pericardial effusion biospecimens were obtained between August 3, 2018 and March 3, 2020. The fluid was initially centrifuged in 225ml polypropylene conical tubes (BD) at 500g for 10 minutes and the supernatant was discarded. The cell pellet was resuspended in human complete medium (RPMI + 10% human serum albumin + 1% penicillin with streptomycin + 0.1% amphotericin). For study of fluid biospecimen macrophages, Tim-4 mean fluorescence intensity with a fold change ≥2 relative to isotype control was considered high. Cutoffs of 1.5, 2, 2.5, and 3 were considered and 2 was chosen since it represented the maximal AUC on the receiver-operator curve. This study was approved by the MSKCC Institutional Review Board and was conducted in accordance with the US Common Rule.
PET Imaging
8-10 week old female C57BL/6 mice bearing subcutaneously implanted MC38 tumors on their left lower flank and B16F10 tumors on the right lower flank were administered the 89Zr-labeled anti-TIM4 antibody ([89Zr]Zr-DFO-TIM4) intravenously via a lateral tail vein injection. One set of animals (n=2) received 150μCi; 5.55MBq; 34μg of [89Zr]Zr-DFO-TIM4 suspended in 200μl chelexed-PBS, whereas the other set of animals received an eighteen-fold higher dose (610μg) of unlabeled anti-TIM4 antibody in addition to the 34μg of [89Zr]Zr-DFO-TIM4 dose of 150μCi; 5.55MBq per mouse. The animals were anesthetized by inhalation of 2% isoflurane (Baxter Healthcare) and medical air and gas mixture and placed on the scanner bed. PET data for each mouse were recorded via static scans at various time points after injection of the radioimmunoconjugates. PET images of the bilateral tumor model were acquired using a mouse hotel in the Inveon PET/CT scanner (Siemens Healthcare), and the images were analyzed using AMIDE software. Briefly, the 3-dimensional ordered subset expectation maximization (3D OSEM) reconstructed images were calibrated for the injected dose of the tracer and smoothed using a Gaussian function by applying a full width at half maximum (FWHM) value of 1.5 prior to overlaying the PET and CT images.
Ex vivo biodistribution profiling:
Ex vivo biodistribution studies were performed in a separate set of bilateral MC38 and B16F10 tumor-bearing mice that received 30μCi; 1.11MBq of activity in 7.5μg of [89Zr]Zr-DFO-TIM4 suspended in 150μL PBS via lateral tail vein injection. For the blocking arm of the experiment, animals were co-injected with a 54-fold excess of unlabeled antibody. Animals (n=4 per group) were euthanized by CO2 asphyxiation at 144 hours after injection of [89Zr]Zr-DFO-TIM4. Following euthanasia, organs of interest including the blood, heart, lungs, liver, spleen, stomach, pancreas, large intestine, small intestine, kidneys, bone, muscle, tail, and the tumor(s) were harvested, weighed, and assayed for radioactivity on a gamma counter calibrated for 89Zr. Counts were converted into activity using a calibration curve generated from known standards. Count data was background and decay corrected to the time of injection, and the percent injected dose per gram (%ID/g) and percent of injected dose per organ (%ID) was calculated by normalization to the total activity injected per mouse.
Intraperitoneal tumor challenge and treatment schedule
C57BL/6 mice were administered 1×10⁶ MC38-LG, 0.5 ×10⁶ MC38-Ova, or 0.25 ×10⁶ HKP1 intraperitoneally and BALB/c mice were administered 0.2×10⁶ CT26 tumor cells intraperitoneally. Mice were randomized into their respective groups one week after tumor challenge. For survival experiments with immune checkpoint blockade, mice received 0.250mg of isotype control, anti-Tim-4, and/or anti-PD-1 intraperitoneally twice a week after randomization for a total of six doses. Mice were euthanized when mice gained >20% of initial weight or when they displayed other signs of distress (e.g. pallor, lethargy, poor mobility, poor feeding, poor ambulation). Surviving animals were rechallenged intraperitoneally with parental tumor cell line (MC38 for mice originally tumor challenged with MC38-LG and CT26 for mice originally tumor challenged with CT26) 90-120 days after initial tumor challenge. For immunophenotyping of the peritoneal cavity, mice received the first two doses as specified above and peritoneal lavage was performed two weeks after tumor challenge.
Other models of tumor challenge
C57BL/6 mice were administered 0.25×10⁶ B16F10, 1×10⁶ MC38, or 0.20×10⁶ LLC subcutaneously. KrasLSL-G12D/+; Trp53fl/fl mice were intranasally administered with 5×10⁸ PFU Adeno-Cre and harvested 6 months afterwards.
Mouse tissue preparation and cellular isolation
Peritoneal lavage of mice was performed by infusing 3ml of ice cold complete RPMI media intraperitoneally and collecting the infusate. Inguinal lymph node and spleen were dissected from mice and mashed with the handle of a 3ml syringe (Falcon) against a 70μm filter (Greiner). Bone marrow was flushed with 1ml of complete RPMI media. Liver was finely minced with scissors and digested with collagenase A and bovine DNAse I in RPMI for 45 min. The liver preparation underwent two rounds of centrifugation at 30g for 3 minutes with collection of supernatant after each step. After centrifugation, the cell pellet underwent RBC lysis (Lonza).
Flow cytometry
Cells were incubated with anti-CD16/32 monoclonal antibody (for murine cells) and TruFCX (for human cells) to block nonspecific binding, and then stained (15 min, 4 °C) with appropriate dilutions of various combinations of fluorochrome-conjugated anti-mouse antibodies. Intracellular staining was performed with the Foxp3 kit. CD107a antibody was added to culture with GolgiStop (BD) 5-6 hr prior to planned analysis. GATA-6 staining was performed according to manufacturer’s instructions. In experiments to assess Caspase 3/7 activity, NucView488 Caspase-3 was added to the staining cocktail at 2μM. Annexin V was stained simultaneously with other surface molecules in Annexin V buffer.
Murine macrophage populations were gated for Fig 2B as follows: steady-state adrenal (CD3− CD19− CD11b+ F4/80+), peritoneal (CD3− CD19− CD11b+ F4/80+), pleural (CD3− CD19− CD11b+ F4/80+), and lung (CD3− CD19− CD11bint F4/80+ CD11c+ I-A/I-E+). Human macrophage populations were gated as CD3− CD14+.
Populations were gated for Fig S6H–N as follows: Tim-4+ macrophages (CD3− B220− CD11bhigh F4/80high Tim-4+), neutrophils (CD3− B220− Tim-4− F4/80− Gr-1+), Gr-1hi monocytes (CD3− B220− Tim-4− F4/80int Gr-1+), Gr-1lo monocytes (CD3− B220− Tim-4− F4/80int Gr-1−), and regulatory T cells (CD4+ Treg, CD3+ CD8− CD4+ Foxp3+).
Populations were gated for Fig S6O–U as follows: Large peritoneal macrophages (CD3− B220− CD11bhigh F4/80high), neutrophils (CD3− B220− F4/80− Gr-1+), Gr-1hi monocytes (CD3− B220− F4/80int Gr-1+), Gr-1lo monocytes (CD3− B220− F4/80int Gr-1−), and regulatory T cells (CD4+ Treg, CD3+ CD8− CD4+ Foxp3+).
The stained cells were acquired on a LSRII Flow Cytometer or Cytek Aurora and the data were processed using FlowJo software (Treestar). Doublets and dead cells were excluded on the basis of forward and side scatter and Fixable Viability Dye eFluor 506, 4′,6-diamidino-2-phenylindole (DAPI, 1μg/ml), or Zombie NIR. To determine the absolute number of cells in a sample, Precision Count Beads were added immediately prior to acquisition. All depicted flow cytometry plots were pregated on non-debris (by FSC and SSC), viable (DAPI−) single CD45+ cells, unless otherwise indicated in the Figure legend.
Bulk RNA sequencing
Tim-4− and Tim-4+ macrophages were sorted from peritoneal lavage of steady-state or MC38-LG-bearing animals that were treated with anti-PD-1 with or without anti-Tim-4. Lavage was pooled from 2-3 unique, non-overlapping mice to sort 200,000 macrophages in triplicates and the sorted cells were resuspended in Trizol and frozen. Samples were shipped to Genewiz for RNA isolation, library preparation, and RNA sequencing on a HiSeq 2500. The reads were aligned in Partek Flow using STAR aligner version 2.6.1d. Differential analysis was performed with DeSeq2(R) version 3.5 using Partek Flow Software. Genes were considered differentially expressed if FDR step up was ≤ 0.05 or ≤ 0.10 (as indicated in Table legend) and fold change cutoff was set at ≤ 2 or ≥ 2.
Bioluminescence imaging
Mice were injected intraperitoneally with 100μl of 20mg/ml D-Luciferin and then anesthetized with inhalational isofurane. Ten minutes after injection of D-Luciferin, anesthetized animals were placed in the IVIS Spectrum chamber and imaged for 1 second at F/Stop 1.
Activation of CD8+ T cells
For murine CD8+ T cell activation with anti-CD3/CD28 beads or PMA/ionomycin, 2×10⁵ splenocytes from C57BL/6 mice were cultured in 0.2ml of T cell media (complete RPMI media with 50μM β-mercaptoethanol) with 50IU/ml murine IL-2 and 2×10⁵ anti-mouse CD3/CD28 Dynabeads or phorbol-12-myristate 13-acetate (81nM) with ionomycin (1.3386μM) (Cell Activation Cocktail without Brefeldin A), respectively. For antigen-specific murine CD8+ T cell activation, 2×10⁵ splenocytes from OT-1 or pmel mice were cultured in 0.2ml of T cell media with 50IU/ml murine recombinant IL-2 and 1μg/ml SIINFEKL or human GP100 peptide, respectively. IL-2 was replenished every two days. For human CD8+ T cell activation with anti-CD3/CD28 beads, 2×10⁵ previously cryopreserved human PBMC from de-identified healthy donors (NY Blood Center) were cultured in 0.2ml of T cell media with 50IU/ml human recombinant IL-2 and 2×10⁵ anti-human CD3/CD28 Dynabeads. IL-2 was replenished every two days.
Single cell RNA sequencing experimental setup
14 days after tumor challenge, peritoneal lavage was performed on five MC38-LG-bearing mice that were treated with anti-Tim-4 and anti-PD-1 on days 7 and 10. PSlow and PShigh (approximately lowest and highest 1/3 staining, respectively) populations from DAPI− CD11b− CD3+ CD8+ single T cells were sorted. During the fluorescent antibody staining period, each sample was barcoded by staining with a unique anti-murine CD45 antibody-bound hashtag oligonucleotide (TotalSeq C0301-C0305) allowing subsequent attribution to individual mice.
Single cell transcriptome sequencing
Sorted cells were stained with Trypan blue and Countess II Automated Cell Counter (ThermoFisher) was used to assess both cell number and viability. Following QC, the single cell suspension was loaded onto Chromium Chip A (10X Genomics PN 230027) and GEM generation, cDNA synthesis, cDNA amplification, and library preparation of 10,000 cells proceeded using the Chromium Single Cell 5’ Reagent Kit (10X Genomics PN 1000006) according to the manufacturer’s protocol. cDNA amplification included 16 cycles and 21.5-50ng of the material was used to prepare sequencing libraries with 14-16 cycles of PCR. Indexed libraries were pooled equimolar and sequenced on a NextSeq 500 in a 26bp/91bp paired end run using the NextSeq 500/550 High Output Kit v2.5 (150 cycles, Illumina). An average of 256 million paired reads was generated per sample.
Single cell V(D)J analysis from RNA
An aliquot of cDNA generated using the methods described above was used to enrich for V(D)J regions using the Chromium Single Cell V(D)J Enrichment Kit Mouse T Cell (10X Genomics PN 1000071) according to the manufacturer’s protocol with 10 cycles of PCR during enrichment and 9 cycles during library preparation. Indexed libraries were pooled equimolar and sequenced on a NovaSeq 6000 in a 150bp/150bp paired end run using the NovaSeq 6000 S4 Reagent Kit (300 cycles, Illumina). An average of 87 million paired reads was generated per sample.
Cell surface protein feature barcode analysis
Amplification products generated using the methods described above included both cDNA and feature barcodes tagged with cell barcodes and unique molecular identifiers. Smaller feature barcode fragments were separated from larger amplified cDNA using a 0.6X cleanup with aMPure XP beads (Beckman Coulter catalog # A63882). Libraries were constructed using the Chromium Single Cell 5’ Feature Barcode Library Kit (10X Genomics PN 1000080) according to the manufacturer’s protocol with 9 cycles of PCR. Indexed libraries were pooled equimolar and sequenced on a NovaSeq 6000 in a 150bp/150bp paired end run using the NovaSeq 6000 S4 Reagent Kit (300 cycles, Illumina). An average of 64 million paired reads was generated per sample.
Single cell transcriptome analysis
FASTQ files were imported into Partek Flow for analysis. After trimming barcode and unique molecular identifier (UMI) tags, transcript reads were aligned to STAR 2.7.3a. Reads mapping to duplicate UMIs were removed. Transcripts were quantified using the Ensembl database (mm10 - Ensembl Transcripts release 95). 20,155 cells were initially identified. QC was performed as follows: expressed genes minimum and maximum was set at 500 and 4000, respectively, and mitochondrial reads max was set at 15%. 19,156 cells representing 95.0% of initially identified cells passed QC. Counts underwent Log2 normalization. Doublets were identified by feature barcoding and after removal, 17,344 single cells (8,626 PSlow and 8,718 PShigh CD8+ T cells) were subsequently analyzed. Differential gene analysis was performed with Partek’s gene specific analysis (GSA) function. Multiple test correction was performed with Benjamini–Hochberg procedure. Select T cell-related genes with differential expression (FDR step up ≤ 0.05, fold change ≤−1.5 and ≥1.5) were selected for heat map.
For cluster-based visualization, filtered gene expression matrices and paired TCR sequences were generated using 10X Cell Ranger (version 4.0.0/3.1.0) with the Ensembl mm10 reference genome. Five mouse samples from two conditions were demultiplexed using the Seurat R package (Butler et al., 2018; Stuart et al., 2019) and Cell Ranger feature barcoding tool with antibody barcode patterns from TotalSeq. Cells were classified as positive for each hash tag oligo (HTO) with a 0.99 quantile threshold and cross sample doublets were removed. For each of the 10 samples, cells with greater than 10% mitochondrial content and fewer than 100 expressed genes were removed for quality control. Each sample was log-normalized and standard scaled using the Seurat R package. All samples were integrated and batch corrected using Harmony (version 0.1) (Korsunsky et al., 2019) into a single gene expression matrix. Unsupervised clustering using the Louvain algorithm and a 0.1 resolution yielded five cluster subsets. Four clusters with greater than 50 cells were used in subsequent analyses. Differentially expressed genes between conditions and clusters were identified using Wilcoxon Rank Sum test with a minimum log fold change of 0.1 and expressed in at least 25% of cells. Dimensionality reduction and visualization was performed with the Seurat R package.
T cell clonotype analysis
T cell receptor alpha and beta chains were reconstructed from the single cell sequencing of PSlow and PShigh CD8+ T cells. VDJ sequences were compiled from Cell Ranger and the clonal overlap of alpha and beta chains by nucleotide sequence was determined. Mouse specific barcodes were annotated with the Seurat (Stuart et al., 2019) R package and Cell Ranger feature barcoding using antibody barcode patterns from TotalSeq. Cells were classified as positive for each hash tag oligo (HTO) with a 0.99 quantile threshold and cross sample doublets were removed. In a subsequent analysis, we downloaded TCR beta sequencing data from MC38-bearing mice (Lee et al., 2019) that were available at ImmuneACCESS database from adaptivebiotech.com. Among 38703 productive rearrangements sequences, the top 10% most abundant sequences (3887 total, comprising 0.02% to 40.7% of all sequences) were considered MC38-associated and compared to the TCR beta repertoire of the PSlow and PShigh VDJ sequences. These 3887 VDJ sequences were also utilized to identify differential expression of genes specifically in MC38-associated CD8+ T cells. This identified a total of 166 PShigh and 247 PSlow T cells that expressed 37 and 49 MC38-associated VDJ genes, respectively. Expression dot plots were generated from data processed as above for cluster-based visualization.
Ex vivo cytotoxicity assay comparing PSlow vs PShigh CD8+ T cells
For cytotoxicity against parental MC38 cells, we utilized a clonogenic cytotoxicity assay as previously described (Budhu et al., 2010). Briefly, 100,000 sorted PSlow or PShigh CD8+T cells were cultured with 10,000 parental MC38 tumor cells in a 24 well plate. After 36 hours, non-adherent cells were gently washed two times with PBS, trypsinized and then plated in complete RPMI medium into a 6 well plate. After 6 days, adherent colonies were washed and stained with crystal violet solution. Images were acquired and colonies were enumerated by Celigo Imaging Cytometer. For cytotoxicity against MC38-LG cells, we plated 5000 MC38-LG cells in a flat bottom 96 well white plate (Nunclon) with a specified ratio of sorted PSlow or PShigh CD8+ T cells in a total volume of 200μl T cell media with 50IU/ml murine IL-2. After 48hours, 100μl of media was aspirated and 100μl of Bio-Glo Luciferase was added and incubated for 15 minutes. Bioluminescence was measured with a Synergy Neo plate reader.
In vitro adhesion assay
0.5×10⁶ murine peritoneal lavage cells, human malignant pleural effusion, or human peritoneal ascites in 1ml complete DMEM media were cultured on Ultra Low Attachment 24W plate (Corning) overnight (~16-18 hours). On the following day, wells were aspirated and the adherent macrophages were gently washed two times with DMEM media prior to incubation with isotype control or anti-Tim-4 (50μg/ml) for at least 15 minutes. DMEM media was then aspirated and 0.25×10⁶ sorted DAPI− GFP+ CD8+ T cells (from splenocytes activated overnight with anti-CD3/28 beads ~16-18hrs) in 1ml DMEM media were placed into the well for 1-2hr. Non-adherent cells were collected and then the wells were gently washed two additional times to collect further non-adherent cells. These cells were analyzed by flow cytometry. 1ml fresh complete DMEM media was added to the wells and the adherent cells were gently scraped off with a mini cell scraper, collected and analyzed by flow cytometry.
Confocal video microscopy
Peritoneal lavage cells from C57BL/6 mice were labeled with Cell Trace Far Red 0.2×10⁶ peritoneal lavage cells were resuspended in 500µl of DMEM media overnight in an 8 well chamber slide (Nunc Lab-Tek II, 155409PK). After gently washing off non-adherent cells, peritoneal macrophages were incubated with isotype- or anti-Tim-4 antibody (50µg/ml) for at least 15 minutes. After aspirating the antibody solution, 0.1×10⁶ sorted DAPI− GFP+ CD8+ T cells in complete DMEM media was added to the chamber wells and imaged on an inverted Laser Scanning Confocal Microscope equipped with Airyscan 2 and CO2/humidity-controlled onstage incubator (LSM 980, Zeiss) using a LCI Plan-Apochromat 40x/1.2 objective. Cells were imaged using the Multiplex CO-8Y mode for three to twelve hours. Fluorescence channels were recorded using excitation wavelengths 488nm (for GFP+ activated CD8+ T cells) and 639nm (for macrophages) (red). All imaging and processing were performed using Zeiss Zen Blue software. Tracking of T cell adhesion to macrophages over time was performed using the Trackmate program to identify the center of each T cell (green) and macrophage (red) with a difference of gaussian filter. Threshold for brightness and radius were selected on a representative tile to be analyzed. T cell positions were recorded over time. Macrophage tracks that existed for 20 frames or more were selected for analysis. Tracking results were uploaded into MATLAB and the green cells within 4.8mm of each macrophage were counted for each frame.
Ex vivo cytotoxicity assay of PShigh CD8+ T with concomitant macrophage co-culture
2 well silicon culture inserts were adhered onto the middle of wells of a 12 well plate (Ibidi, 80209). 5000 MC38 tumor cells were plated in the silicon insert overnight (2500 per 50ul per silicon well) in complete DMEM media. 2×10⁶ peritoneal cells from C57BL/6 mice were cultured overnight in 1ml of complete DMEM media in the space outside of the silicon insert. On the next day, the outer region was gently washed twice with complete DMEM media and then incubated with isotype control or anti-Tim-4 (50μg/ml) for at least 15 minutes. After aspirating the media from the outer region, 100,000 flow-sorted DAPI− PShigh Caspase3/7− CD8+ T cells in 50% complete DMEM media and 50% T cell media supplemented with 50IU/ml murine IL-2 were added to the outer region and allowed to incubate for 1hr. Afterwards, the silicon insert was removed. After 40 hours of co-culture, non-adherent cells were gently washed off with complete DMEM media and imaged by Celigo to calculate percent cytotoxicity.
Proliferation of murine CD8+ T cells in the presence of peritoneal macrophages
On day prior to the experiment, peritoneal lavage cells were plated in complete RPMI media on a 10cm dish. Celexocib (10μM), anti-TGF-β (clone 1D11, 10μg/ml), or sodium metatungstate (50μM) was plated onto respective wells of a 96 well round bottom plate (BD). After at least five rounds of gentle aspiration and washing of the 10cm plate containing the peritoneal lavage cells, adherent peritoneal macrophages were removed with a cell scraper, collected and counted. 105 peritoneal macrophages were plated per indicated well of the 96 well plate. CD8+ T cells were purified from ACK-lysed splenocytes from C57BL/6 mice utilizing the Mouse CD8a+ T Cell Isolation Kit and then 105 purified CD8+ T cells were plated onto in T cell medium with 50IU/ml murine IL-2. Certain wells were incubated with 105 anti-mouse CD3/CD28 Dynabeads for T cell activation. Flow cytometry was performed after 48 hours of culture.
Proliferation of human CD8+ T cells in the presence of human peritoneal or peritoneal macrophages
On day prior to the experiment, cryopreserved peritoneal ascites from MSK 347c and pleural effusion from MSK 1366a was thawed and cultured in human complete RPMI media on a 10cm dish. On the day of the experiment, sodium metatungstate (50μM) was plated into respective wells of a 96 well round bottom plate (BD). After at least five rounds of gentle aspiration and washing of the 10cm plate containing the peritoneal lavage cells, adherent peritoneal macrophages were removed with a cell scraper, collected and counted. 105 peritoneal or pleural macrophages were plated per indicated well on the 96 well plate. CD8+ T cells were purified from healthy donor PBMCs (NY Blood Center) utilizing the Human CD8+ T Cell Isolation Kit (EasySep) and then 105 purified CD8+ T cells were plated in Human Complete Medium with 50IU/ml human IL-2. Certain wells were incubated with 105 anti-human CD3/CD28 Dynabeads for T cell activation. Flow cytometry was performed after 48 hours of culture.
Adoptive transfer of OT-1 CD8+ T cells
Two days prior to planned infusion, ACK-lysed splenocytes were harvested from OT-1 TCR transgenic mice and cultured in T cell media with 50IU/ml murine recombinant IL-2, 1μg/ml SIINFEKL (Ova 257-264), and 10mM N-acetylcysteine. On day of infusion, CD8+ T cells were purified from the bulk culture utilizing the Mouse CD8a+ T Cell Isolation Kit, labeled with CTV, and then infused intraperitoneally into MC38-Ova-bearing CD45.1 animals at 2×10⁶ cells/mouse. 15 minutes prior to infusion, mice were administered 0.5mg of Isotype Control or Anti-Tim-4 antibody intraperitoneally and then subsequently treated with 0.25mg of Isotype Control or Anti-Tim-4 antibody twice weekly for a total of 5 additional doses.
QUANTIFICATION AND STATISTICAL ANALYSIS
Statistical analysis
Statistical analyses were performed as described in the Figure legend for each experiment. Data are expressed as mean ± SEM. Group size was determined on the basis of the results of preliminary experiments and no statistical method was used to predetermine sample size. The indicated sample size (n) represents biological replicates. Group allocation and outcome assessment were not performed in a blinded manner. Survival was measured using the Kaplan–Meier method. Statistical significance was determined by Student’s t test, Mann-Whitney U test, two-way ANOVA with Bonferroni’s Post-Test or Sidak Post-Test, and Mantel-Cox log-rank test using Prism 7 software as indicated.
Supplementary Material
Video S1. Co-culture of activated CD8+ T cells with isotype- or anti-Tim-4-treated macrophages, Related to Figure 5. Isotype-treated or Anti-Tim-4-treated Cell Trace-Far Red peritoneal macrophages (red) were co-cultured with GFP+ activated CD8+ T cells (green) and imaged for six hours. Representative of three independent experiments.
Table S1: Bulk RNA sequencing of steady-state murine Tim-4+ macrophages, Related to Figure 2. Relative to Tim-4− macrophages, 1221 genes were differentially expressed (FDR step up < 0.05, fold change ≤−2 or ≥2). Volcano plot and select genes are displayed in Figure S4A–B.
Table S2: Clinical and pathological features of serous body cavity fluid biospecimens, Related to Figure 2. 55 fluid biospecimens from patients with lung cancer (52 pleural fluid, 2 peritoneal ascites, and 1 pericardial effusion) were assessed for Tim-4 expression and CD8+ T cell composition.
Table S3: Bulk RNA sequencing of sorted Tim-4+ macrophages from anti-PD-1 treated mice, Related to Figure 3). A) Transcriptional profiling of anti-Tim-4 and anti-PD-1-treated MC38-LG-bearing mice (relative to Isotype and anti-PD-1-treated mice) was performed. 770 differentially expressed genes (FDR step up < 0.10, fold change ≤−2 or ≥2) are tabulated. B) List of select macrophage-associated genes are tabulated. C) List of select MHC II-related genes are tabulated. D) List of select T cell-related genes. Volcano plot of this data is displayed in Figure S6V.
Table S4: Single cell RNA sequencing of PSlow and PShigh CD8+ T cells from MC38-LG-bearing mice, treated with anti-Tim-4 and anti-PD-1, Related to Figure 4. A) 1789 differentially expressed genes (FDR step up < 0.05, fold change ≤−1.5 or ≥1.5) are tabulated. B) Differential expression of synthetases, scramblases, floppases, and flippases in scRNAseq of PShigh and PSlow CD8+ T cells from MC38-LG-bearing mice treated with anti-Tim-4 and anti-PD-1. Genes that were differentially increased or decreased in expression by FDR step are highlighted in green and red, respectively.
Table S5: Differentially expressed genes of scRNAseq clusters from PShigh and PSlow CD8+ T cells from MC38-LG-bearing mice treated with anti-Tim-4 and anti-PD-1, Related to Figure 4. A subset of this data is plotted in Figure 4H. UMAP visualization of these clusters are depicted in Figure 4I.
ACKNOWLEDGEMENTS:
We are grateful for experimental support from the MSKCC Molecular Cytology Core Facility (in particular Dr. Anthony Santella), MSKCC Small Animal Imaging Core Facility, the MSKCC Flow Cytometry Core Facility, and the Integrated Genomics Core (in particular Afsar Barlas), which are funded by MSK’s Cancer Center Support Grant/Core Grant (P30 CA008748). We are grateful to Maximiliano Meneses, Mariana Ward, Rebecca Landau, and Sean Guzman for their invaluable help in obtaining clinical biospecimens. We thank Dr. Shigekazu Nagata (Osaka University) for providing Tim-4 KO mice and for providing valuable feedback on our manuscript. We thank Clare Wilhelm for editing our manuscript. We are also grateful to other members of the Wolchok and Rudin laboratories for insightful discussions. This research was funded in part through the NIH NCI Cancer Center Support Grant P30 CA008748, NCI R01 CA056821, U01 CA199215, U24 CA213274, P01 CA129243, R01 CA197936, R35 CA232130, and K08 CA248723; the Ludwig Collaborative and Swim Across America Laboratory; the Emerald Foundation; the Parker Institute for Cancer Immunotherapy, MSKCC; the Department of Medicine, MSKCC; Stand Up To Cancer (SU2C)-American Cancer Society Lung Cancer Dream Team Translational research grant (SU2C-AACR-DT17-15). A.C. was supported by an MSKCC Investigational Cancer Therapeutics Training Program fellowship (T32 CA-009207) and Clinical Investigator Award from National Cancer Institute (K08 CA-248723). TS is supported by the Druckenmiller Center for Lung Cancer Research, Parker Institute for Cancer Immunotherapy (PICI) grant, International Association for the Study of Lung Cancer grant, and Department of Defense LCRP-IITRA.
DECLARATION OF INTERESTS:
JDW is a consultant for Adaptive Biotech, Amgen, Apricity, Ascentage Pharma, Arsenal IO, Astellas, AstraZeneca, Bayer, Beigene, Boehringer Ingelheim, Bristol Myers Squibb, Celgene, Chugai, Daiichi Sankyo, Dragonfly, Eli Lilly, Elucida, F Star, Georgiamune, Idera, Imvaq, Kyowa Hakko Kirin, Linneaus, Maverick Therapeutics, Merck, Neon Therapeutics, Polynoma, Psioxus, Recepta, Takara Bio, Trieza, Truvax, Trishula, Sellas, Serametrix, Surface Oncology, Syndax, Syntalogic, and Werewolf Therapeutics. JDW has received grant/research support from Bristol Myers Squibb; Sephora. JDW has equity in Tizona Pharmaceuticals, Adaptive Biotechnologies, Imvaq, Beigene, Linneaus, Apricity, Arsenal IO, and Georgiamune. JDW is a co-inventor on patent applications related to heteroclitic cancer vaccines and recombinant poxviruses for cancer immunotherapy. JDW and TM are co-inventors on patent applications related to CD40 and in situ vaccination (PCT/US2016/045970). TM is a consultant for Immunos Therapeutics and Pfizer. TM is a cofounder of and equity holder in IMVAQ Therapeutics. TM receives research funding from Bristol-Myers Squibb, Surface Oncology, Kyn Therapeutics, Infinity Pharmaceuticals, Peregrine Pharmaceuticals, Adaptive Biotechnologies, Leap Therapeutics, and Aprea Therapeutics. TM is an inventor on patent applications related to work on oncolytic viral therapy, alpha virus–based vaccine, neoantigen modeling, CD40, GITR, OX40, PD-1, and CTLA-4. C.M.R. has consulted regarding oncology drug development with AbbVie, Amgen, Ascentage, AstraZeneca, BMS, Celgene, Daiichi Sankyo, Genentech/Roche, Ipsen, Loxo and PharmaMar and is on the scientific advisory boards of Elucida, Bridge and Harpoon. Unrelated to this work, D.Z. reports clinical research support to his institution from Astra Zeneca, Plexxikon, and Genentech; and personal/consultancy fees from Merck, Synlogic Therapeutics, GSK, Genentech, Xencor, Memgen, Immunos, CrownBio, and Agenus. D.Z. is an inventor on patents related to the use of Newcastle Disease Virus that has been licensed to Merck. MDH received research grant from BMS; personal fees from Achilles, Arcus, AstraZeneca, Blueprint, BMS, Genentech/Roche, Genzyme, Immunai, Instil Bio, Janssen, Merck, Mirati, Natera, Nektar, Pact Pharma, Regeneron, Shattuck Labs, Syndax, as well as equity options from Arcus, Factorial, Immunai, and Shattuck Labs. A patent filed by MSKCC related to the use of tumor mutational burden to predict response to immunotherapy (PCT/US2015/062208) is pending and licensed by PGDx. DTL serves on advisory boards for Merck, Bristol Myers Squibb, and Janssen and has received research funding from Merck, Bristol Myers Squibb, Aduro Biotech, Curegenix, Medivir, and Nouscom. She has received speaking honoraria from Merck and is an inventor of licensed intellectual property related to technology for mismatch repair deficiency for diagnosis and therapy (WO2016077553A1) from Johns Hopkins University. SS is a shareholder of Canexia Health Inc.
Footnotes
Images for the graphical abstract were generated in BioRender.
REFERENCES
- Albacker LA, Karisola P, Chang YJ, Umetsu SE, Zhou M, Akbari O, Kobayashi N, Baumgarth N, Freeman GJ, Umetsu DT, and DeKruyff RH (2010). TIM-4, a receptor for phosphatidylserine, controls adaptive immunity by regulating the removal of antigen-specific T cells. J Immunol 185, 6839–6849. [DOI] [PMC free article] [PubMed] [Google Scholar]
- Albacker LA, Yu S, Bedoret D, Lee WL, Umetsu SE, Monahan S, Freeman GJ, Umetsu DT, and DeKruyff RH (2013). TIM-4, expressed by medullary macrophages, regulates respiratory tolerance by mediating phagocytosis of antigen-specific T cells. Mucosal Immunol 6, 580–590. [DOI] [PMC free article] [PubMed] [Google Scholar]
- Baghdadi M, Yoneda A, Yamashina T, Nagao H, Komohara Y, Nagai S, Akiba H, Foretz M, Yoshiyama H, Kinoshita I, et al. (2013). TIM-4 glycoprotein-mediated degradation of dying tumor cells by autophagy leads to reduced antigen presentation and increased immune tolerance. Immunity 39, 1070–1081. [DOI] [PubMed] [Google Scholar]
- Bain CC, Hawley CA, Garner H, Scott CL, Schridde A, Steers NJ, Mack M, Joshi A, Guilliams M, Mowat AM, et al. (2016). Long-lived self-renewing bone marrow-derived macrophages displace embryo-derived cells to inhabit adult serous cavities. Nat Commun 7, ncomms11852. [DOI] [PMC free article] [PubMed] [Google Scholar]
- Bain CC, and Jenkins SJ (2018). The biology of serous cavity macrophages. Cell Immunol 330, 126–135. [DOI] [PubMed] [Google Scholar]
- Bleriot C, Chakarov S, and Ginhoux F (2020). Determinants of Resident Tissue Macrophage Identity and Function. Immunity 52, 957–970. [DOI] [PubMed] [Google Scholar]
- Bowman RL, Klemm F, Akkari L, Pyonteck SM, Sevenich L, Quail DF, Dhara S, Simpson K, Gardner EE, Iacobuzio-Donahue CA, et al. (2016). Macrophage Ontogeny Underlies Differences in Tumor-Specific Education in Brain Malignancies. Cell Rep 17, 2445–2459. [DOI] [PMC free article] [PubMed] [Google Scholar]
- Budhu S, Loike JD, Pandolfi A, Han S, Catalano G, Constantinescu A, Clynes R, and Silverstein SC (2010). CD8+ T cell concentration determines their efficiency in killing cognate antigen-expressing syngeneic mammalian cells in vitro and in mouse tissues. J Exp Med 207, 223–235. [DOI] [PMC free article] [PubMed] [Google Scholar]
- Buechler MB, Kim KW, Onufer EJ, Williams JW, Little CC, Dominguez CX, Li Q, Sandoval W, Cooper JE, Harris CA, et al. (2019). A Stromal Niche Defined by Expression of the Transcription Factor WT1 Mediates Programming and Homeostasis of Cavity-Resident Macrophages. Immunity. [DOI] [PMC free article] [PubMed] [Google Scholar]
- Butler A, Hoffman P, Smibert P, Papalexi E, and Satija R (2018). Integrating single-cell transcriptomic data across different conditions, technologies, and species. Nat Biotechnol 36, 411–420. [DOI] [PMC free article] [PubMed] [Google Scholar]
- Casanova-Acebes M, Menendez-Gutierrez MP, Porcuna J, Alvarez-Errico D, Lavin Y, Garcia A, Kobayashi S, Le Berichel J, Nunez V, Were F, et al. (2020). RXRs control serous macrophage neonatal expansion and identity and contribute to ovarian cancer progression. Nat Commun 11, 1655. [DOI] [PMC free article] [PubMed] [Google Scholar]
- Cunha LD, Yang M, Carter R, Guy C, Harris L, Crawford JC, Quarato G, Boada-Romero E, Kalkavan H, Johnson MDL, et al. (2018). LC3-Associated Phagocytosis in Myeloid Cells Promotes Tumor Immune Tolerance. Cell 175, 429–441 e416. [DOI] [PMC free article] [PubMed] [Google Scholar]
- De Henau O, Rausch M, Winkler D, Campesato LF, Liu C, Cymerman DH, Budhu S, Ghosh A, Pink M, Tchaicha J, et al. (2016). Overcoming resistance to checkpoint blockade therapy by targeting PI3Kgamma in myeloid cells. Nature 539, 443–447. [DOI] [PMC free article] [PubMed] [Google Scholar]
- DeNardo DG, and Ruffell B (2019). Macrophages as regulators of tumour immunity and immunotherapy. Nat Rev Immunol 19, 369–382. [DOI] [PMC free article] [PubMed] [Google Scholar]
- Donnenberg AD, Luketich JD, Dhupar R, and Donnenberg VS (2019). Treatment of malignant pleural effusions: the case for localized immunotherapy. J Immunother Cancer 7, 110. [DOI] [PMC free article] [PubMed] [Google Scholar]
- Duhen T, Duhen R, Montler R, Moses J, Moudgil T, de Miranda NF, Goodall CP, Blair TC, Fox BA, McDermott JE, et al. (2018). Co-expression of CD39 and CD103 identifies tumor-reactive CD8 T cells in human solid tumors. Nat Commun 9, 2724. [DOI] [PMC free article] [PubMed] [Google Scholar]
- Engblom C, Pfirschke C, and Pittet MJ (2016). The role of myeloid cells in cancer therapies. Nat Rev Cancer 16, 447–462. [DOI] [PubMed] [Google Scholar]
- Etzerodt A, Moulin M, Doktor TK, Delfini M, Mossadegh-Keller N, Bajenoff M, Sieweke MH, Moestrup SK, Auphan-Anezin N, and Lawrence T (2020). Tissue-resident macrophages in omentum promote metastatic spread of ovarian cancer. J Exp Med 217. [DOI] [PMC free article] [PubMed] [Google Scholar]
- Fischer K, Voelkl S, Berger J, Andreesen R, Pomorski T, and Mackensen A (2006). Antigen recognition induces phosphatidylserine exposure on the cell surface of human CD8+ T cells. Blood 108, 4094–4101. [DOI] [PubMed] [Google Scholar]
- Ghosn EE, Cassado AA, Govoni GR, Fukuhara T, Yang Y, Monack DM, Bortoluci KR, Almeida SR, Herzenberg LA, and Herzenberg LA (2010). Two physically, functionally, and developmentally distinct peritoneal macrophage subsets. Proc Natl Acad Sci U S A 107, 2568–2573. [DOI] [PMC free article] [PubMed] [Google Scholar]
- Gros A, Robbins PF, Yao X, Li YF, Turcotte S, Tran E, Wunderlich JR, Mixon A, Farid S, Dudley ME, et al. (2014). PD-1 identifies the patient-specific CD8(+) tumor-reactive repertoire infiltrating human tumors. J Clin Invest 124, 2246–2259. [DOI] [PMC free article] [PubMed] [Google Scholar]
- Grosser R, Cherkassky L, Chintala N, and Adusumilli PS (2019). Combination Immunotherapy with CAR T Cells and Checkpoint Blockade for the Treatment of Solid Tumors. Cancer Cell 36, 471–482. [DOI] [PMC free article] [PubMed] [Google Scholar]
- Hastings K, Yu HA, Wei W, Sanchez-Vega F, DeVeaux M, Choi J, Rizvi H, Lisberg A, Truini A, Lydon CA, et al. (2019). EGFR mutation subtypes and response to immune checkpoint blockade treatment in non-small-cell lung cancer. Ann Oncol 30, 1311–1320. [DOI] [PMC free article] [PubMed] [Google Scholar]
- Heng TS, Painter MW, and Immunological Genome Project, C. (2008). The Immunological Genome Project: networks of gene expression in immune cells. Nat Immunol 9, 1091–1094. [DOI] [PubMed] [Google Scholar]
- Irvine KM, Banh X, Gadd VL, Wojcik KK, Ariffin JK, Jose S, Lukowski S, Baillie GJ, Sweet MJ, and Powell EE (2016). CRIg-expressing peritoneal macrophages are associated with disease severity in patients with cirrhosis and ascites. JCI Insight 1, e86914. [DOI] [PMC free article] [PubMed] [Google Scholar]
- Jiao S, Subudhi SK, Aparicio A, Ge Z, Guan B, Miura Y, and Sharma P (2019). Differences in Tumor Microenvironment Dictate T Helper Lineage Polarization and Response to Immune Checkpoint Therapy. Cell 179, 1177–1190 e1113. [DOI] [PubMed] [Google Scholar]
- Koneru M, O’Cearbhaill R, Pendharkar S, Spriggs DR, and Brentjens RJ (2015). A phase I clinical trial of adoptive T cell therapy using IL-12 secreting MUC-16(ecto) directed chimeric antigen receptors for recurrent ovarian cancer. J Transl Med 13, 102. [DOI] [PMC free article] [PubMed] [Google Scholar]
- Korsunsky I, Millard N, Fan J, Slowikowski K, Zhang F, Wei K, Baglaenko Y, Brenner M, Loh PR, and Raychaudhuri S (2019). Fast, sensitive and accurate integration of single-cell data with Harmony. Nat Methods 16, 1289–1296. [DOI] [PMC free article] [PubMed] [Google Scholar]
- Kumagai S, Togashi Y, Kamada T, Sugiyama E, Nishinakamura H, Takeuchi Y, Vitaly K, Itahashi K, Maeda Y, Matsui S, et al. (2020). The PD-1 expression balance between effector and regulatory T cells predicts the clinical efficacy of PD-1 blockade therapies. Nat Immunol 21, 1346–1358. [DOI] [PubMed] [Google Scholar]
- Le DT, Durham JN, Smith KN, Wang H, Bartlett BR, Aulakh LK, Lu S, Kemberling H, Wilt C, Luber BS, et al. (2017). Mismatch repair deficiency predicts response of solid tumors to PD-1 blockade. Science 357, 409–413. [DOI] [PMC free article] [PubMed] [Google Scholar]
- Lee JC, Mehdizadeh S, Smith J, Young A, Mufazalov IA, Mowery CT, Daud A, and Bluestone JA (2020). Regulatory T cell control of systemic immunity and immunotherapy response in liver metastasis. Sci Immunol 5. [DOI] [PMC free article] [PubMed] [Google Scholar]
- Lee KL, Benz SC, Hicks KC, Nguyen A, Gameiro SR, Palena C, Sanborn JZ, Su Z, Ordentlich P, Rohlin L, et al. (2019). Efficient Tumor Clearance and Diversified Immunity through Neoepitope Vaccines and Combinatorial Immunotherapy. Cancer Immunol Res 7, 1359–1370. [DOI] [PMC free article] [PubMed] [Google Scholar]
- Loyher PL, Hamon P, Laviron M, Meghraoui-Kheddar A, Goncalves E, Deng Z, Torstensson S, Bercovici N, Baudesson de Chanville C, Combadiere B, et al. (2018). Macrophages of distinct origins contribute to tumor development in the lung. J Exp Med 215, 2536–2553. [DOI] [PMC free article] [PubMed] [Google Scholar]
- Miyanishi M, Segawa K, and Nagata S (2012). Synergistic effect of Tim4 and MFG-E8 null mutations on the development of autoimmunity. Int Immunol 24, 551–559. [DOI] [PubMed] [Google Scholar]
- Miyanishi M, Tada K, Koike M, Uchiyama Y, Kitamura T, and Nagata S (2007). Identification of Tim4 as a phosphatidylserine receptor. Nature 450, 435–439. [DOI] [PubMed] [Google Scholar]
- Morano WF, Aggarwal A, Love P, Richard SD, Esquivel J, and Bowne WB (2016). Intraperitoneal immunotherapy: historical perspectives and modern therapy. Cancer Gene Ther 23, 373–381. [DOI] [PubMed] [Google Scholar]
- Osorio JC, Arbour KC, Le DT, Durham JN, Plodkowski AJ, Halpenny DF, Ginsberg MS, Sawan P, Crompton JG, Yu HA, et al. (2019). Lesion-Level Response Dynamics to Programmed Cell Death Protein (PD-1) Blockade. J Clin Oncol 37, 3546–3555. [DOI] [PMC free article] [PubMed] [Google Scholar]
- Peranzoni E, Lemoine J, Vimeux L, Feuillet V, Barrin S, Kantari-Mimoun C, Bercovici N, Guerin M, Biton J, Ouakrim H, et al. (2018). Macrophages impede CD8 T cells from reaching tumor cells and limit the efficacy of anti-PD-1 treatment. Proc Natl Acad Sci U S A 115, E4041–E4050. [DOI] [PMC free article] [PubMed] [Google Scholar]
- Porcel JM, Gasol A, Bielsa S, Civit C, Light RW, and Salud A (2015). Clinical features and survival of lung cancer patients with pleural effusions. Respirology 20, 654–659. [DOI] [PubMed] [Google Scholar]
- Rodriguez-Manzanet R, Sanjuan MA, Wu HY, Quintana FJ, Xiao S, Anderson AC, Weiner HL, Green DR, and Kuchroo VK (2010). T and B cell hyperactivity and autoimmunity associated with niche-specific defects in apoptotic body clearance in TIM-4-deficient mice. Proc Natl Acad Sci U S A 107, 8706–8711. [DOI] [PMC free article] [PubMed] [Google Scholar]
- Rudd-Schmidt JA, Hodel AW, Noori T, Lopez JA, Cho HJ, Verschoor S, Ciccone A, Trapani JA, Hoogenboom BW, and Voskoboinik I (2019). Lipid order and charge protect killer T cells from accidental death. Nat Commun 10, 5396. [DOI] [PMC free article] [PubMed] [Google Scholar]
- Scott CL, Zheng F, De Baetselier P, Martens L, Saeys Y, De Prijck S, Lippens S, Abels C, Schoonooghe S, Raes G, et al. (2016). Bone marrow-derived monocytes give rise to self-renewing and fully differentiated Kupffer cells. Nat Commun 7, 10321. [DOI] [PMC free article] [PubMed] [Google Scholar]
- Simoni Y, Becht E, Fehlings M, Loh CY, Koo SL, Teng KWW, Yeong JPS, Nahar R, Zhang T, Kared H, et al. (2018). Bystander CD8(+) T cells are abundant and phenotypically distinct in human tumour infiltrates. Nature 557, 575–579. [DOI] [PubMed] [Google Scholar]
- Stuart T, Butler A, Hoffman P, Hafemeister C, Papalexi E, Mauck WM 3rd, Hao Y, Stoeckius M, Smibert P, and Satija R (2019). Comprehensive Integration of Single-Cell Data. Cell 177, 1888–1902 e1821. [DOI] [PMC free article] [PubMed] [Google Scholar]
- Thommen DS, Koelzer VH, Herzig P, Roller A, Trefny M, Dimeloe S, Kiialainen A, Hanhart J, Schill C, Hess C, et al. (2018). A transcriptionally and functionally distinct PD-1(+) CD8(+) T cell pool with predictive potential in non-small-cell lung cancer treated with PD-1 blockade. Nat Med 24, 994–1004. [DOI] [PMC free article] [PubMed] [Google Scholar]
- Wong K, Valdez PA, Tan C, Yeh S, Hongo JA, and Ouyang W (2010). Phosphatidylserine receptor Tim-4 is essential for the maintenance of the homeostatic state of resident peritoneal macrophages. Proc Natl Acad Sci U S A 107, 8712–8717. [DOI] [PMC free article] [PubMed] [Google Scholar]
- Xia H, Li S, Li X, Wang W, Bian Y, Wei S, Grove S, Wang W, Vatan L, Liu JR, et al. (2020). Autophagic adaptation to oxidative stress alters peritoneal residential macrophage survival and ovarian cancer metastasis. JCI Insight 5. [DOI] [PMC free article] [PubMed] [Google Scholar]
- Yu J, Green MD, Li S, Sun Y, Journey SN, Choi JE, Rizvi SM, Qin A, Waninger JJ, Lang X, et al. (2021). Liver metastasis restrains immunotherapy efficacy via macrophage-mediated T cell elimination. Nat Med 27, 152–164. [DOI] [PMC free article] [PubMed] [Google Scholar]
- Zhu Y, Herndon JM, Sojka DK, Kim KW, Knolhoff BL, Zuo C, Cullinan DR, Luo J, Bearden AR, Lavine KJ, et al. (2017). Tissue-Resident Macrophages in Pancreatic Ductal Adenocarcinoma Originate from Embryonic Hematopoiesis and Promote Tumor Progression. Immunity 47, 597. [DOI] [PMC free article] [PubMed] [Google Scholar]
Associated Data
This section collects any data citations, data availability statements, or supplementary materials included in this article.
Supplementary Materials
Video S1. Co-culture of activated CD8+ T cells with isotype- or anti-Tim-4-treated macrophages, Related to Figure 5. Isotype-treated or Anti-Tim-4-treated Cell Trace-Far Red peritoneal macrophages (red) were co-cultured with GFP+ activated CD8+ T cells (green) and imaged for six hours. Representative of three independent experiments.
Table S1: Bulk RNA sequencing of steady-state murine Tim-4+ macrophages, Related to Figure 2. Relative to Tim-4− macrophages, 1221 genes were differentially expressed (FDR step up < 0.05, fold change ≤−2 or ≥2). Volcano plot and select genes are displayed in Figure S4A–B.
Table S2: Clinical and pathological features of serous body cavity fluid biospecimens, Related to Figure 2. 55 fluid biospecimens from patients with lung cancer (52 pleural fluid, 2 peritoneal ascites, and 1 pericardial effusion) were assessed for Tim-4 expression and CD8+ T cell composition.
Table S3: Bulk RNA sequencing of sorted Tim-4+ macrophages from anti-PD-1 treated mice, Related to Figure 3). A) Transcriptional profiling of anti-Tim-4 and anti-PD-1-treated MC38-LG-bearing mice (relative to Isotype and anti-PD-1-treated mice) was performed. 770 differentially expressed genes (FDR step up < 0.10, fold change ≤−2 or ≥2) are tabulated. B) List of select macrophage-associated genes are tabulated. C) List of select MHC II-related genes are tabulated. D) List of select T cell-related genes. Volcano plot of this data is displayed in Figure S6V.
Table S4: Single cell RNA sequencing of PSlow and PShigh CD8+ T cells from MC38-LG-bearing mice, treated with anti-Tim-4 and anti-PD-1, Related to Figure 4. A) 1789 differentially expressed genes (FDR step up < 0.05, fold change ≤−1.5 or ≥1.5) are tabulated. B) Differential expression of synthetases, scramblases, floppases, and flippases in scRNAseq of PShigh and PSlow CD8+ T cells from MC38-LG-bearing mice treated with anti-Tim-4 and anti-PD-1. Genes that were differentially increased or decreased in expression by FDR step are highlighted in green and red, respectively.
Table S5: Differentially expressed genes of scRNAseq clusters from PShigh and PSlow CD8+ T cells from MC38-LG-bearing mice treated with anti-Tim-4 and anti-PD-1, Related to Figure 4. A subset of this data is plotted in Figure 4H. UMAP visualization of these clusters are depicted in Figure 4I.
Data Availability Statement
Bulk and single cell RNA-seq data presented in this study has been deposited in Gene Expression Omnibus database with accession numbers GSE174151 and GSE174241, respectively.