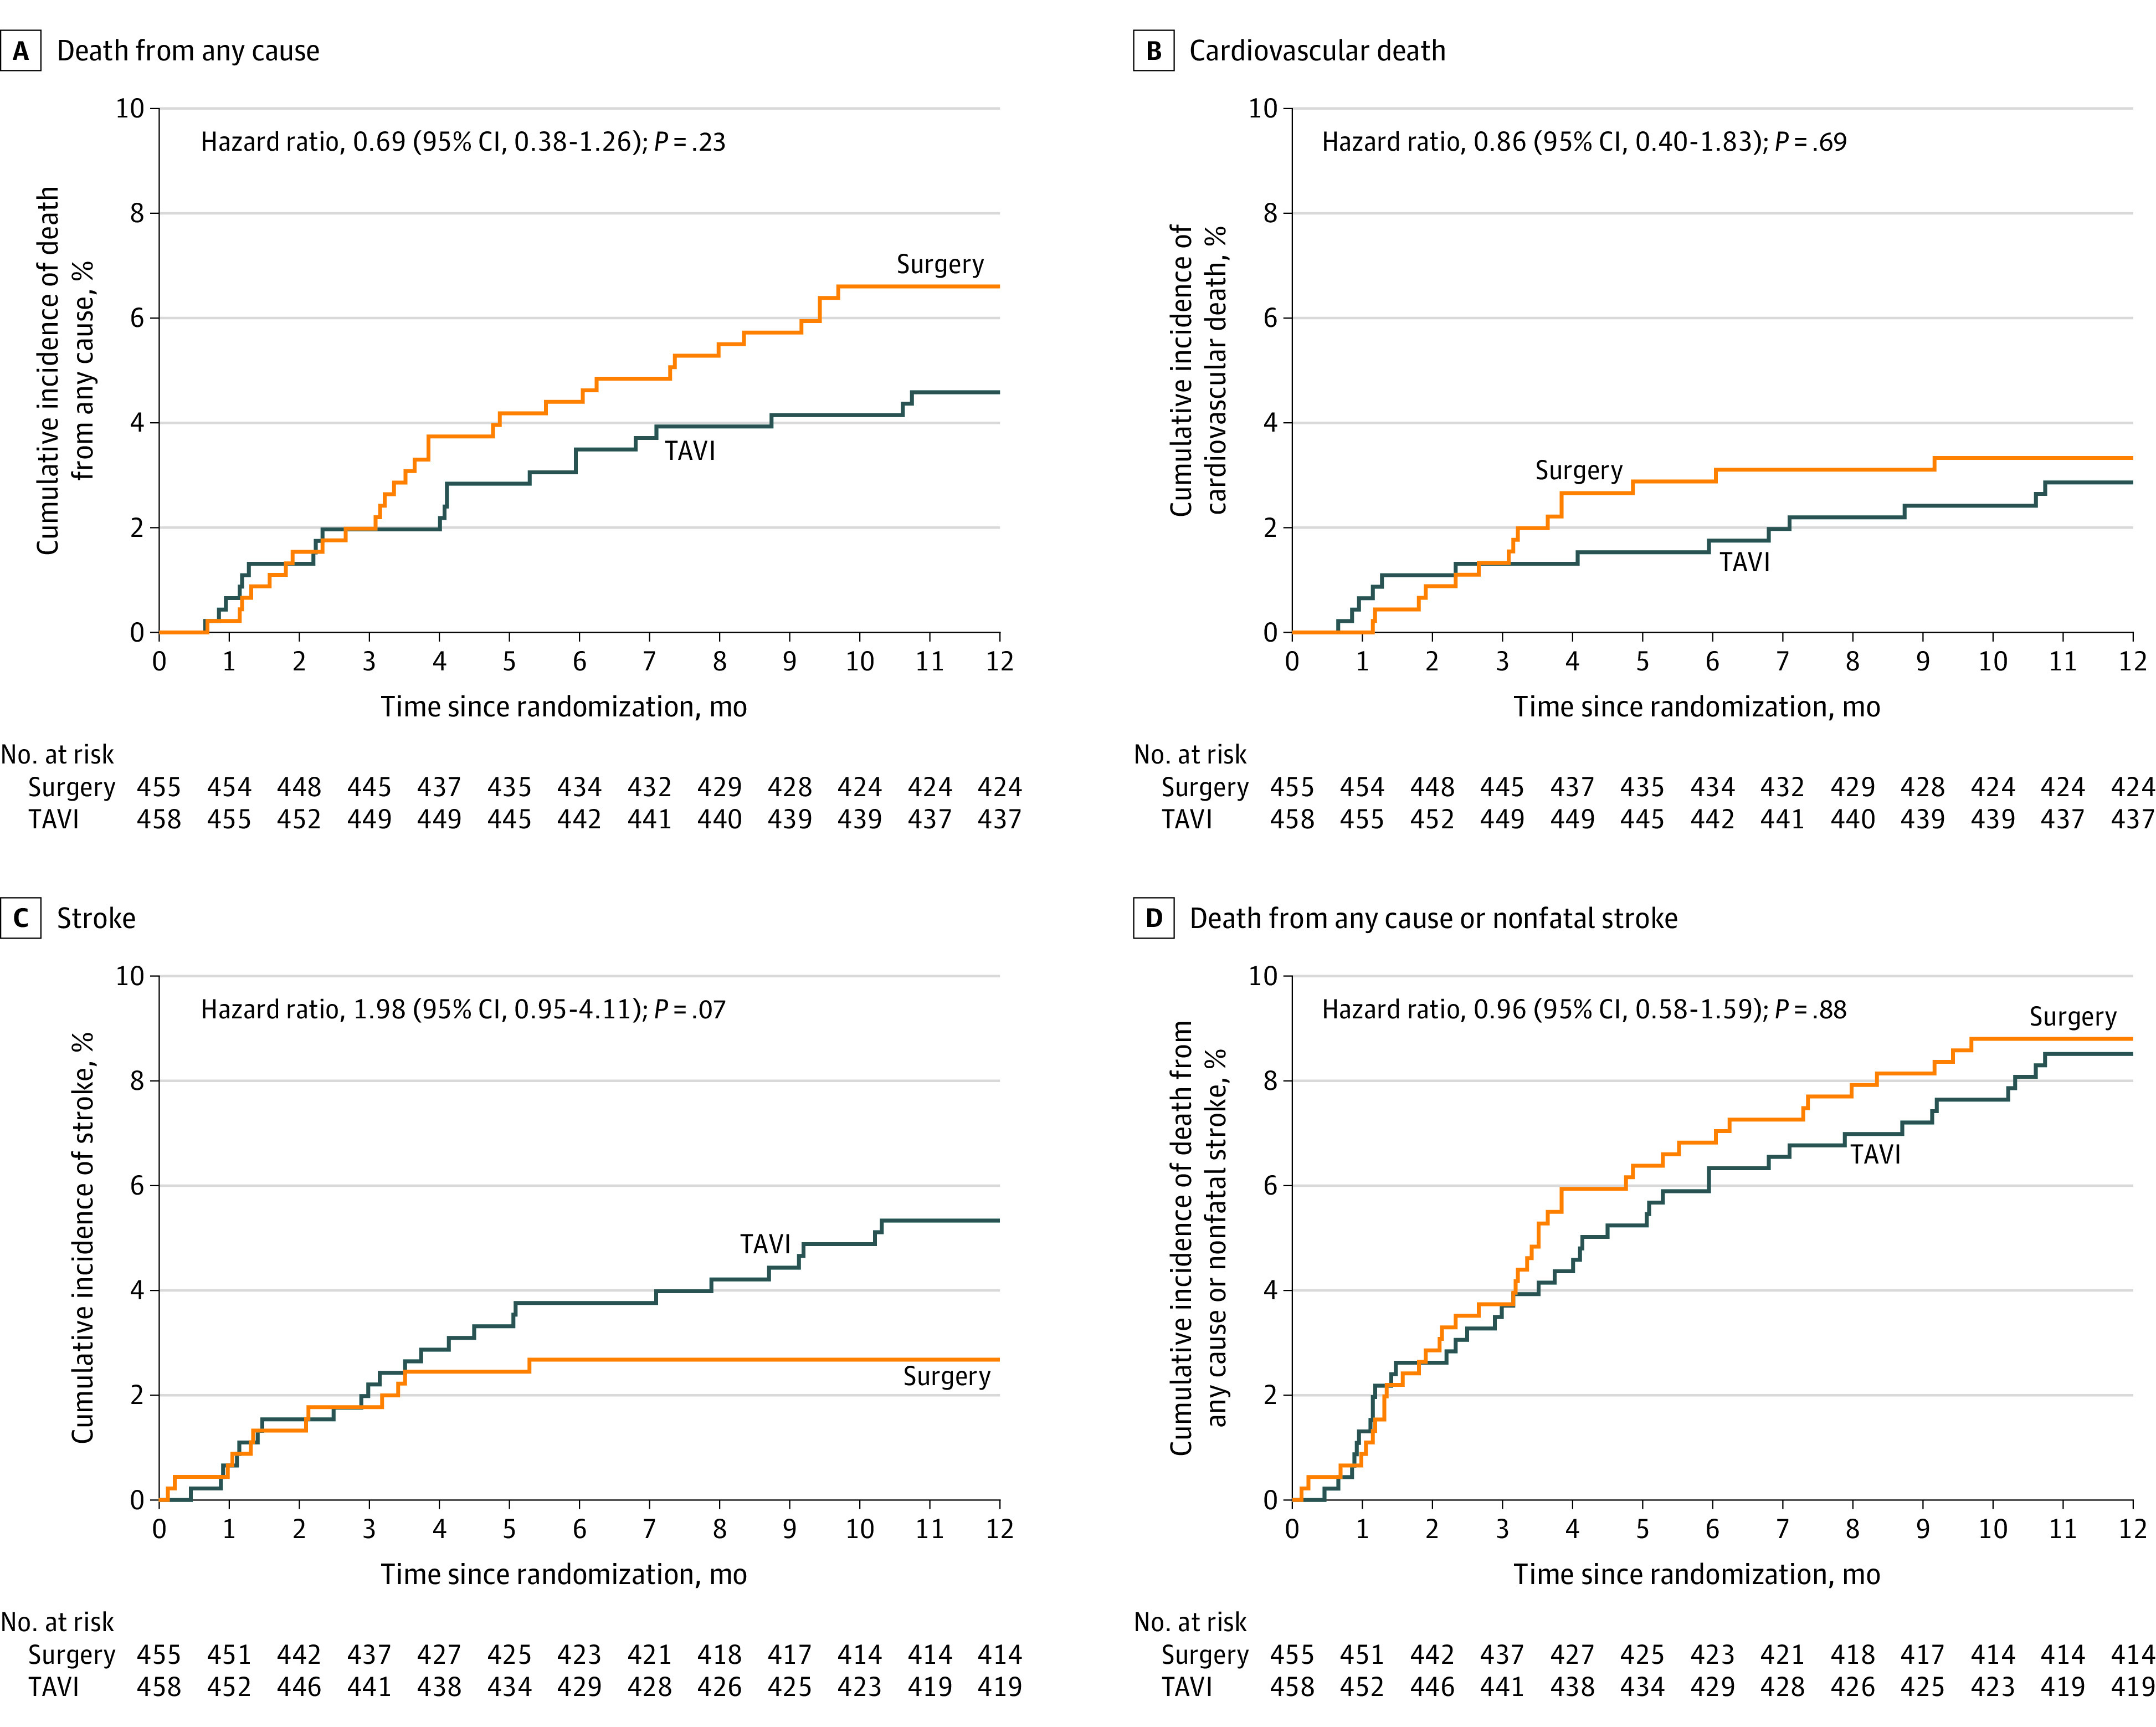
Figure 2. Time-to-Event Curves for the Primary Outcome and Major Secondary Outcomes.

Kaplan-Meier survival analysis at 1 year after randomization. All patients were followed up to the time of an event, withdrawal from the study, or 1 year after randomization. The hazard ratios are specific to the 1-year outcomes. The P values were derived from a Cox proportional hazards model, which was adjusted for randomization minimization factors and used robust SEs to account for clustering of outcomes by randomization site. Cause of death (cardiovascular vs noncardiovascular) and stroke events were adjudicated by the end points and events committee, with reference to outcome definitions based on criteria from the Valve Academic Research Consortium-215 consensus document (eMethods 5 in Supplement 2). TAVI indicates transcatheter aortic valve implantation.
