

Abstract
Cellular senescence (CS), a state of permanent growth arrest, is intertwined with tumorigenesis. Due to the absence of specific markers, characterizing senescence levels and senescence-related phenotypes across cancer types remain unexplored. Here, we defined computational metrics of senescence levels as CS scores to delineate CS landscape across 33 cancer types and 29 normal tissues and explored CS-associated phenotypes by integrating multiplatform data from ~20 000 patients and ~212 000 single-cell profiles. CS scores showed cancer type-specific associations with genomic and immune characteristics and significantly predicted immunotherapy responses and patient prognosis in multiple cancers. Single-cell CS quantification revealed intra-tumor heterogeneity and activated immune microenvironment in senescent prostate cancer. Using machine learning algorithms, we identified three CS genes as potential prognostic predictors in prostate cancer and verified them by immunohistochemical assays in 72 patients. Our study provides a comprehensive framework for evaluating senescence levels and clinical relevance, gaining insights into CS roles in cancer- and senescence-related biomarker discovery.
Keywords: cellular senescence, pan-cancer, single-cell, immunotherapy, machine learning
Introduction
Cancer is considered as an aging disease and remains the leading cause of death in the aged population [1]. Cellular senescence (CS), defined as the irreversible arrest of the cell cycle, is a critical component of the four layers of aging and cancer hallmarks [2, 3]. Senescent cells have been observed in the murine and human tumor microenvironments [4]. Currently, accumulating evidence has linked the senescent microenvironment with cancer progression and metastasis, whereas conflicting conclusions have been made across various cancer types [5–10]. One characteristic of senescent cells is the increased secretion of proinflammatory chemokines, which is termed as the senescence-associated secretory phenotype (SASP) [11]. SASP has been reported to accelerate tumor growth by facilitating immune evasion, but it can also protect against tumor development by stimulating the immune response in different contexts [11, 12]. Thus, it is of particular interest to investigate the roles of CS in diverse cancer types, which would improve the tailoring of senescence-targeted therapy in specific tumors [13].
Defining CS levels remains a critical unanswered question due to the absence of universal and specific CS markers [14]. The detections of senescent cells mainly rely on immunohistochemistry (IHC) staining for multiple biomarkers, such as senescence-associated β-galactosidase activity (SA-β-Gal), p16INKA and p21, to limit the false-positive rate observed [14, 15]. However, current experimental approaches do not usually support simultaneous staining in certain conditions [16]. Additionally, growing interest has focused on recognizing common senescent characteristics by combining several transcriptional profiles of senescent cells [17–19], but the accurate quantifications of senescence levels in cancer patients remain poorly characterized. Thus, the development of a computational method to quantify CS levels in patients is urgently needed.
It is still challenging to translate senescence-related mechanisms to clinical outcomes, as pioneering studies have mainly focused on single cancer types or nonhuman models [20–22]. The severe toxicities and limited immunotherapy responses make the prior recognition of responders a critical need [23]. Furthermore, targeting the senescence process has been proposed as a promising treatment for preventing cancer and age-related diseases [13, 24, 25]. Therefore, identifying senescence genes with significant clinical relevance would provide potential biomarkers for prognostic prediction and therapeutic targets.
Here, we defined a computational metric of senescence levels and identified the senescence landscape across 33 cancer types and 29 tissues. Our multiplatform analyses revealed the cancer-specific associations of senescence levels with genomic variations and immune molecular features. Deciphering ~212 000 single-cell profiles revealed that CS levels maintained intratumor heterogeneity and were associated with activated immune features in prostate cancer cells. Importantly, CS scores predicted immunotherapy responses and prolonged patient survival in multiple cohorts. Finally, three prognosis-related genes from CS signature were identified by machine learning algorithms in prostate cancer and were further validated in four independent cohorts and by IHC in our in-house cohort of 72 PRAD specimens. The senescence quantification and related analyses are available on an interactive online website, Tumor Cellular Senescence Estimation Resource (TCSER, http://tcser.bmicc.org). Overall, our integrated analyses provide a valuable framework for a better understanding of the context-dependent regulation of CS in cancers, shedding light on the senescence-related biomarker discoveries and therapeutic targets.
Results
Delineate senescence landscape at the pan-cancer level
Due to the lack of specific CS markers, we defined CS scores by combining multiple CS-related genes to quantify senescence levels. We hypothesized that the higher the CS levels are, the more dramatic the differences between the activities of genes positively related to CS and the activities of genes negatively related to CS. Thus, we established the CS score in three steps. We first collected previously curated gene sets of replicative cell senescence that were derived from 164 distinct cell lines (totally 1259 genes) [18], then implemented the Gene Set Variation Analysis (GSVA) [26] algorithm to separately infer the activities of positive- and negative CS-correlated genes in individual samples and finally defined CS scores as the differences between these two activities (Figure 1A).
Figure 1.

Comprehensive quantification of senescence levels in cancers and tissues. (A) Overall methodology. Workflow for integrative analysis of the CS landscape across cancers using multi-omic data. (B) Heatmaps showing correlations between the CS score and GSVA scores of oncogenic processes across 33 TCGA cancer types. (C) Average CS scores in individual cancer types. Tissue types, cancer types and average CS scores are shown from the inner circle to the outer circle. (D) Average CS scores across normal tissues in the GTEx dataset. (E) Lower CS scores in primary tumors (orange) in comparison to adjacent normal solid tissues (gray). The Wilcoxon test P-values are stated. NES, normalized enrichment score; **** indicates P < 0.0001; * indicates P < 0.05.
We then utilized complementary methods to assess the reliability of CS scores in representing senescence status. First, by pre-ranked gene set enrichment, positively CS-correlated genes were enriched in the p53 pathways, TNF-α pathway and interferon-gamma response pathway (Supplementary Figure S1A available online at https://academic.oup.com/bib), which is consistent with the enhanced inflammation and p53 activity observed during the senescence process [27]. The negative side of the CS signature was enriched in the pathways of deoxyribonucleic acid (DNA) repair, G2M checkpoint, Myc checkpoint and E2F targets (Supplementary Figure S1A available online at https://academic.oup.com/bib), which is consistent with the cessation of cell division during CS [28]. Consistently, CS scores exhibited negative correlations with the expression of oncogenic signatures, including Myc- and E2F-regulated genes, and positive correlations with tumor suppressor signatures, including RB-regulated genes (Figure 1B). These results were also in agreement with current notions that CS can be triggered by the abnormal activation of tumor suppressors and oncogenes [15]. Next, we tested whether the CS score could measure senescence levels in a similar way as widely used senescence markers (p21 and p16INK4A) in experiments. As anticipated, we found that CS genes had significant correlations with p21 and p16INK4A proteins compared with other non-CS genes (Supplementary Figure S1B and C available online at https://academic.oup.com/bib). Furthermore, we found that CS scores were able to distinguish known proliferative cells and senescent cells in 15 independent datasets (including 128 cell line samples, Supplementary Table S1 available online at https://academic.oup.com/bib) and had higher areas under the curve (AUCs) than p21 and p16 (Supplementary Figure S1D and E available online at https://academic.oup.com/bib). CS scores also showed closer associations with molecular features of three main CS hallmarks [14, 15] than p21 and p16 (Supplementary Figure S1F available online at https://academic.oup.com/bib). Briefly, these results revealed that CS scores were significantly associated with main CS features and showed better performance than the single CS marker (p21 or p16).
Next, we applied our approach to systematically profile senescence levels in ~10 000 samples across 33 cancer types in The Cancer Genome Atlas (TCGA) database (Supplementary Table S2 available online at https://academic.oup.com/bib). Tissue-specific senescence levels across cancer types were revealed (Figure 1C). Generally, cancer cells originating from urinary systems, glands and soft tissues (PRAD, KIRC, ACC and SKCM) exhibited relatively higher CS scores. In contrast, tumors originating from reproductive organs [TGCT, CESC, breast invasive carcinoma (BRCA) and OV] had lower CS scores. Moreover, we investigated the senescence levels in >9000 samples from the Genotype-Tissue Expression (GTEx) database and observed similar tissue-preferential distributions (Figure 1D). The consistent tendency of CS distribution suggests that tissue type might be an essential determinant contributing to senescence degrees of cancers. Additionally, primary tumors had lower CS scores but greater variations than adjacent normal samples (Figure 1E), implying that tumor growth is a process of escaping from CS [29, 30]. Moreover, the age at diagnosis of patients had slightly positive correlations with senescence levels of the tumor microenvironment at the pan-cancer level (coefficient = 0.136 and P-value=1.48e−04), but showed closer associations in BRCA, lung squamous cell carcinoma (LUSC) and lung adenocarcinoma (LUAD) (Supplementary Figure S1G available online at https://academic.oup.com/bib). These carcinomas mainly arise from epithelial tissues, and the significant associations observed may explain the accumulation of age-dependent senescent cells in epithelial cancers [31]. Altogether, these results suggest that our approach could robustly quantify senescence levels and systematically delineate the CS landscape across 33 cancer types and 29 tissues.
Senescence level is associated with cancer type-specific genomic variations
Increased genomic instability is a common hallmark of cancer and aging [32]; however, how genomic alterations vary with senescence in multiple cancers remains to be illustrated. To gain insights into it, we explored the associations of senescence levels with copy number variations (CNVs) and single nucleotide variants (SNVs). For CNVs, we calculated the CNV score, which is the sum of the focal, arm and chromosome levels from GISTIC2.0 [33]. By adjusting for sex, race, cancer type and age at diagnosis in the multiple linear regression, we observed a significant negative correlation between the CS score and the CNV score (Supplementary Figure S2A, available online at https://academic.oup.com/bib, coefficient = −0.81 and P-value <2e−16). Further cancer-specific analyses revealed significant correlations in 20 of 33 cancer types, particularly PRAD, LIHC and LUAD (Figure 2A). We also verified the associations using aneuploidy score (Supplementary Figure S2B available online at https://academic.oup.com/bib), which is an experimental method to measure the total number of altered chromosome arms [34]. Next, we assessed the associations of arm-level CNV gains and losses with CS scores in cancer types with sufficient samples (at least 100 samples). In general, more arm-level gains were markedly correlated with CS scores across cancer types than arm-level losses (Figure 2B and C). Meanwhile, significant arm-level alterations were relatively accumulated in certain chromosome arms, such as marked correlations of 8p and 8q with lower CS levels in PRAD patients (Figure 2B and C). Deletions of 8p and gains of 8q are important phenotypes of higher-grade prostate cancer [35], suggesting that low senescence levels might link to more aggressive phenotypes.
Figure 2.
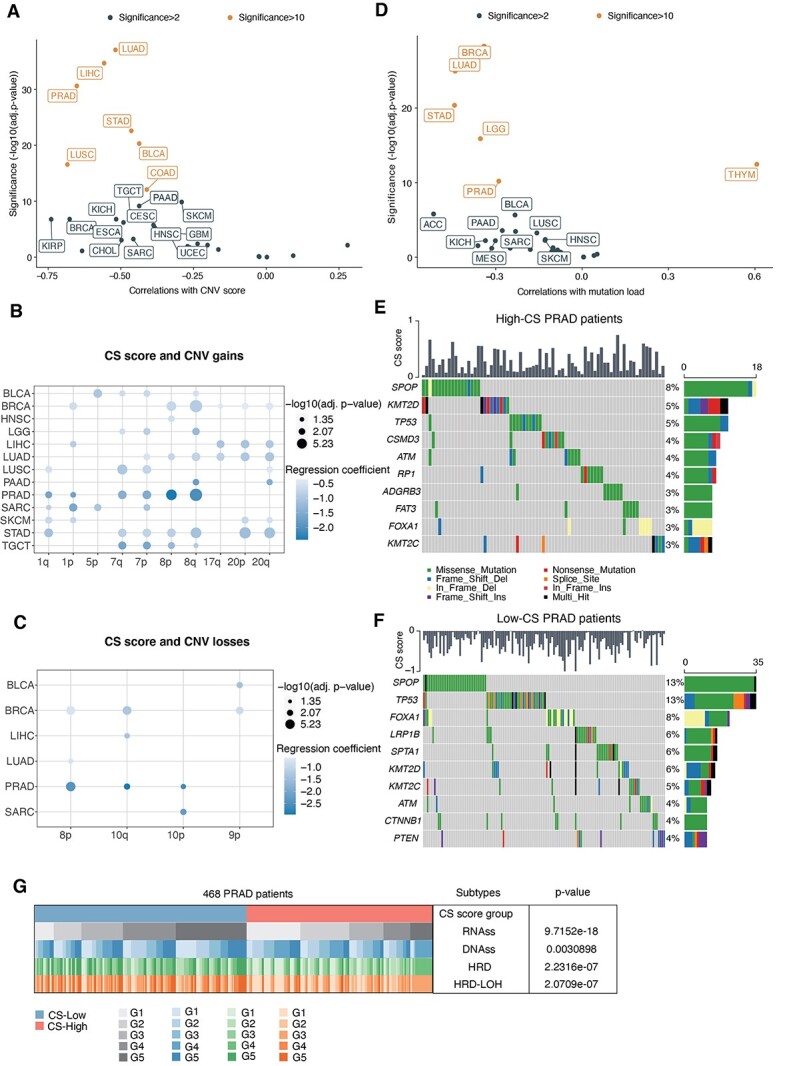
Associations between senescence levels and genomic variations at the pan-cancer level. (A) Associations between CS scores and CNV scores across TCGA cancer types (dots). Spearman correlations and significance [−log10(Benjamini–Hochberg-adjusted P-values)] are shown on the x-axis and y-axis. Labeled are significant CS-related cancers (significance > 2), and colored are those with significance >10. (B and C) Dot plots showing the associations between CS scores and arm-level CNV gains (B) and CNV losses (C). Circle size indicates significance [−log10(Benjamini–Hochberg-adjusted P-values)], and the circle color denotes coefficients in multiple logistic regression. (D) Associations between CS scores and mutation loads across TCGA cancer types (dots). (E and F) Heatmap showing the top mutation events for individual TCGA PRAD patients in the high-CS (E) and low-CS groups (F), respectively. Bar plots in the top panel represent the CS scores of individual patients. Statistical graph of mutation events for each gene is shown in the left panel. Colors are variant classifications. (G) Comparative analysis of different PRAD subtypes. Cochran–Mantel–Haenszel test P-values are stated. PRAD patients were classified into five equal subtypes (G1–G5, from the 20% to 80% quantile) based on the range of RNAss, DNAss, HRD and HRD-LOH, respectively.
For SNVs, we used a similar multiple linear regression model and found that the CS score was correlated with lower total mutation numbers (Supplementary Figure S2C, available online at https://academic.oup.com/bib, coefficient = −0.18, P < 2e−16). Additional investigations revealed significant correlations in 15 of 33 cancer types, including PRAD, BRCA and LUAD (Figure 2D). As PRAD also exhibited relatively higher CS levels (Figure 1C), we further selected this cancer type to analyze the differences in mutational events in PRAD patients between the low-CS and high-CS groups (divided by the median CS score). Microsatellite instability (MSI) is a molecular characteristic in hypermutated tumors due to a defect in mismatch repair genes [36]. Higher MSI scores were also present in the low-CS group of PRAD patients (Supplementary Figure S2D available online at https://academic.oup.com/bib). In general, the low-CS groups maintained more alterations per sample in PRAD (Supplementary Figure S2E and F available online at https://academic.oup.com/bib). Specifically, we found that missense SNVs mainly accounted for overall mutation events, especially C>T mutations. Aiming to identify the discrepancy in driver mutations between the high- and low-CS groups, we examined the top mutated oncogenic genes in individual groups, respectively (Figure 2E and F). TP53 and SPOP mutations were more frequent in the low-CS group of PRAD patients, which was also confirmed by experimental measurement of TP53 and SPOP mutations [37] (Supplementary Figure S2G available online at https://academic.oup.com/bib). Additionally, CTNNB1 mutations uniquely occurred in low-CS PRAD patients (Supplementary Figure S2H available online at https://academic.oup.com/bib). These mutations are implicated in the malignant transformation of prostate cancers [38], indicating the more malignant characteristics of low-CS patients. Consistently, we also found significant correlations of CS levels with DNA repair deficiency and tumor stemness indices in PRAD (Figure 2G).
Overall, negative correlations of CS scores with CNVs and SNVs reveal that genomic alterations occur more frequently in less-senescent and highly aggressive cancer cells than senescent cells, indicating more intensive genomic variations during the tumorigenesis process than during senescence.
Cancer-specific immune characteristics are shown in the senescent microenvironment
Tumor immunity is a critical dominator in driving tumor growth and patient prognosis [39]. To investigate the impact of senescence on tumor immunity, we applied the Estimation of STromal and Immune cells in MAlignant Tumor tissues using Expression data (ESTIMATE) algorithm [40] to evaluate the immune scores (the proportion of immune cells), stromal score (the proportion of stromal cells) and ESTIMATE score (the proportion of nontumor components) across all TCGA cancer types. We observed significant associations of the CS score with the three scores by adjusting for cancer type in multiple linear regression (Supplementary Figure S3A available online at https://academic.oup.com/bib). For the immune score, significant positive correlations were observed in 24 out of 33 cancer types, including PRAD and SKCM (Supplementary Figure S3B available online at https://academic.oup.com/bib). Senescent cells are characterized by the release of a plethora of SASP factors to contribute to tumor immunity [41]. We then evaluated the associations of senescence levels with SASP-related cytokines (Figure 3A). Higher proportions of cytokines significantly correlated with CS were shown in total SASP factors than in all immune-related genes across most cancer types, such as PRAD, SKCM and LUSC. This analysis suggests that SASP-induced immune infiltrations may also occur in senescent cancers. To test this hypothesis, we implemented the CIBERSORT algorithm [42] to deconvolute the compositions of 22 immune cells in tumor samples. As supposed, the infiltration abundances of total immune cells were significantly related to CS scores in most cancer types (25 out of 32 cancer types), while the infiltrations of specific immune cells varied in a cancer-specific pattern (Figure 3B). For instance, tumor growth-promoting macrophages (M2-like) are negatively related to the CS score in PRAD, but not all cancer types. This result implies an immunostimulatory microenvironment in senescent tumors of PRAD patients.
Figure 3.

Cancer type-specific associations of senescence levels with tumor immunity. (A) Proportions of genes significantly correlated with the CS score in SASP genes and all immune genes. Cancer types are ordered by increasing proportions of CS score-correlated genes in SASP genes. (B) Spearman correlations (color) between CS scores and the absolute abundance of 22 immune cell types estimated by CIBERSORT for individual TCGA cancer types. Columns are ordered by increased correlations of the CS score with total cell infiltration. (C) Boxplots comparing the differences in PD-L1 expression between the low- and high-CS groups for individual TCGA cancer types at the transcriptional level (upper panel) and protein level (bottom panel). (D) Significance of the Spearman correlations of CS scores with immune CYT (x-axis) and PD-L1 protein expression (y-axis) at the pan-cancer level. Colored cancer types are these with P-value < 0.01 and absolute Spearman correlation >0.1 in either direction (blue, significant in PD-L1 protein expression; yellow, significant in CYT; red, significant in both; gray, nonsignificant in both). The gray-dashed lines represent the P-value equals 0.01. (E) Representative graph of IHC staining of p21, CD45 and PD-L1 proteins in 72 PRAD patients. (F) Scatter plots showing the correlations of p21 expression with CD45 (left panel) and PD-L1 (right panel) in the IHC assay. Spearman correlations and the corresponding P-values are labeled. **** indicates P < 0.0001, *** indicates P < 0.001, ** indicates P < 0.01 and * indicates P < 0.05.
Moreover, we identified immune molecular characterizations associated with CS scores. First, we recognized key CS-related interaction pairs of immune checkpoints, such as PD1 and its ligands (PD-L1 and PD-L2), as well as CTLA and its ligands (CD80 and CD86). High CS groups showed enhanced expression of PD-L1 transcripts and proteins in PRAD and SKCM (Figure 3C). Positive correlations with other immune checkpoint genes (PD1, PD-L2, CD80 and CD86) were also prominent in PRAD and SKCM (Supplementary Figure S3C available online at https://academic.oup.com/bib). Immune cytolytic activity (CYT) score, defined as the mean of granzyme A (GZMA) and perforin (PRF1) transcripts, is a valuable index for assessing T-cell cytotoxicity and is also a biomarker for predicting immune responses [43, 44]. Next, we observed that senescent tumors maintained higher CYT in approximately half of the TCGA cancer types (Supplementary Figure S3D available online at https://academic.oup.com/bib). Finally, integrating PD-L1 protein expression and the CYT score revealed that CS scores were positively correlated with both in seven cancer types (Figure 3D), such as PRAD, SKCM and GBM. We suspected that such tumors would be more susceptible to immunotherapy in the relatively senescent microenvironment due to elevated PD-L1 expression and sufficient cytolytic T-cells.
To validate associations of the CS score with immune infiltration levels and immune molecular features, we performed IHC staining against p21 (a widely used senescence marker), CD45 (a common antigen expressed in all leukocytes) and PD-L1 in 72 PRAD patients. We obtained markedly positive correlations of p21 expression with PD-L1 and CD45 (Figure 3E and F). Collectively, our results revealed the cancer-specific connections of senescence levels with immune features and identified PRAD and SKCM that might exhibit higher susceptibility to immunotherapy in a relatively senescent microenvironment.
Single-cell analyses reveal senescence heterogeneity and associated immune signaling
To examine whether CS levels are heterogeneous in the tumor microenvironment, we used 10 single-cell datasets with a total of 97 440 cells from 107 patients (GSE141445, GSE143423, GSE146771, GSE102130, GSE131928-10X, GSE131928-Smartseq2, GSE117570, GSE143423, GSE118828 and GSE72056). Applying the standard pipeline in MAESTRO [45], we identified cell clusters and mapped them into main cell lineages (Methods and materials). Interestingly, we obtained a consistent distribution of CS levels across cell types in different datasets (Figure 4A, Supplementary Figure S4A–F available online at https://academic.oup.com/bib). The most prominent senescence levels were exhibited in stromal cells (fibroblasts and endothelial cells) in keeping with the significant correlations of CS scores and stromal scores (Supplementary Figure S3A available online at https://academic.oup.com/bib). In contrast, malignant cells showed relatively lower degrees of senescence. Among immune cells, myeloid cells had relatively higher CS scores than T-cells.
Figure 4.

Senescence heterogeneity and associated immune characteristics in tumor microenvironments. (A) Heatmaps showing the average CS scores of different cell types (stromal cells, myeloid cells, malignant cells and T-cells) in 10 single-cell datasets, which are labeled as the cancer type with accession numbers in the GEO database. (B and C) The t-distributed stochastic neighbor embedding visualization shows seven main cell types in single-cell prostate cancer data (GSE141445), colored by cell type (B) and the CS score (C). (D) Bar plots showing the top 10 enriched Reactome pathway terms of DEGs in malignant luminal cells between the high-CS (pink) and low-CS groups (green). (E) Dot plots showing the expression of selected DEGs in malignant cells between the high-CS and low-CS groups. The dot color corresponds to the average expression, and the dot size indicates the percent expressed. (F) Bubble chart showing significant ligand–receptor interactions between high-CS/low-CS malignant luminal cells (luminal_H/luminal_L) and neighboring cells. Ligands and receptors are shown on the x-axis; ligand-expressed cells and receptor-expressed cells are shown on the y-axis. The color denotes the average expression levels of ligands and receptors in interacting cells, and the bubble size indicates the significance of the interactions (permutation test in CellPhoneDB).
To dissect the impact of intratumor CS heterogeneity on the tumor microenvironment, we further analyzed 33 100 single cells from PRAD patients (GSE141445) [46]. Consistently, we observed intercellular heterogeneity of CS scores in the prostate cancer microenvironment (Figure 4B and C). Pathway enrichment of differentially expressed genes (DEGs) in cancer cells between the high-CS and low-CS groups revealed the significant enrichment of immune-related pathways in senescent cancer cells, including antigen presentation, immunoregulatory interactions and interferon-α/β signaling (Figure 4D). In particular, high-CS cancer cells presented more human leukocyte antigens (HLAs) (B2M, HLA-B and HLA-C) (Figure 4E), which suggests that senescent cancer cells could facilitate recognition and clearance by immune cells by presenting more self-antigens on the cell surface [47]. This result also implies the potential intracellular mechanisms of senescence-related regulation in cancer cells.
Senescent cells can impact local tumor immunity by changing paracrine communications [27]. Having explored the intracellular changes in senescent cancer cells, we next focused on cell–cell interactions using CellPhoneDB [48]. We found that cancer cells in the high-CS and low-CS groups preferentially communicated with different neighboring cells (Figure 4F). Low-CS cancer cells showed higher numbers of interaction pairs with endothelial cells, including CXCL1_ACKR1 and JAG1_NOTCH3. These pairs are known to promote tumor growth, invasion and metastasis [49–51]. In contrast, high-CS cancer cells showed a unique pattern of interaction pairs for T-cell recruitment and activation (CXCL12_CXCR3, CXCL12_CXCR4 and PLA2G2A_a4b1) and fewer interactions with T-cell suppressors (MIF-TNFRSF14) [52]. In summary, frequent immunostimulatory communication between senescent cancer cells and immune cells suggests the possible intercellular regulation of CS in boosting the tumor immunity of PRAD patients.
Senescence level is a potential predictor of immunotherapy response
The immune alterations in the senescence context inspired us to ask whether CS scores have the potential to predict immunotherapy. As malignant cells are major cell types in tumor biopsy [53], we first examined the posttreatment changes of CS score in malignant cells from paired pre- and posttreated patients (totally 63 032 single cells in GSE123813 and GSE117988). In the same patient, the CS scores of malignant cells from nonresponders significantly decreased after treatment, but the posttreatment CS scores significantly increased in ICB responders (Figure 5A–D). Next, we further explored more datasets (115 853 single cells in total) with unpaired ICB-treated patients by adjusting different patients as covariates in the linear model. Consistently, we observed the coefficients of CS score are positive in posttreated responders and negative in posttreated nonresponders across five single-cell ribonucleic acid (RNA)-sequencing (RNA-seq) datasets (Supplementary Figure S5A available online at https://academic.oup.com/bib). The opposite posttreatment changes in CS levels between nonresponders and responders indicate the potential of CS scores in predicting ICB responses.
Figure 5.

Associations of senescence levels with immunotherapy responses. (A and B) Uniform manifold approximation and projection plot showing main cell types in single-cell datasets of BCC patients (A, GSE123813) and MCC patients (B, GSE117988) receiving immunotherapy treatment, colored by cell types. (C and D) Violin plot showing posttreated changes of CS scores in malignant cells from responders and nonresponders of immunotherapy (C, BCC patients; D, MCC patients). The Wilcoxon test was used for P-value calculations. (E) receiver operating characteristic (ROC) curves of the CS score in distinguishing responders and nonresponders to immunotherapy in eight different cohorts (color). AUCs were calculated by ROC analysis and are labeled in the bottom right. (F) Bar plots showing the AUCs of the TIDE score (brown) and CS score (orange) for predicting the immunotherapy responses of patients in multiple cohorts. The TIDE score was calculated using the TIDE tool. The red-dashed line represents the AUC equals 0.5. **** indicates P < 0.0001, *** indicates P < 0.001, ** indicates P < 0.01 and * indicates P < 0.05. CAF, cancer-associated fibroblast; NK cell, natural killer cell; DC, dendritic cell.
To gain insights into the possible mechanisms underlying the opposite changes in CS levels observed above, we calculated the correlations between the CS score and the activities of Kyoto Encyclopedia of Genes and Genomes (KEGG) pathways in the basal cell carcinoma (BCC) cohort. Interestingly, we discovered distinctive sets of CS-related pathways and genes between responders and nonresponders (Supplementary Figure S5B and C available online at https://academic.oup.com/bib). Senescent cells from responders were associated with more immune-mediated signaling and genes, including NFATC1-activating cytotoxic T lymphocytes [54]. In contrast, senescent cells from nonresponders were linked to tumorigenesis-related signaling and molecules, such as BIRC3, which plays a prosurvival role in cancer cells [55], and TNFAIP3, which contributes to malignant phenotypes [56]. Further investigations are needed to explain the potential mechanisms that modulate CS-associated differences in response to ICB therapy.
Furthermore, we investigated the predictive power of CS scores in larger samples (542 patients in 8 ICB-treated cohorts) [44, 57–63]. CS scores exhibited the predictive significance for the ICB response rate, with a mean AUC of approximately 0.68 (Figure 5E). Furthermore, we applied the Tumor Immune Dysfunction and Exclusion (TIDE) tool, a creative computational method of predicting ICB responses [64], to evaluate the predictive efficiency of the TIDE score in multiple ICB cohorts and observed that the CS score exhibited higher AUCs than the TIDE score in the melanoma and kidney cancer cohorts (Figure 5F), which was in line with the CS-related immune molecular alterations in these cancer types (Figure 3D). Collectively, these results indicate that CS levels are associated with different biological behaviors between responders and nonresponders and have the potential to predict ICB responses.
Senescence level predicts active immune response and better prognosis in prostate cancer
As significant associations of CS scores with immune features were observed above, we next hypothesize these associations could make CS scores prognostic predictors. Using the Cox proportional hazards model by adjusting for age, sex, race and cancer type as covariates, we observed that higher CS scores were generally related to decreased hazards for both overall survival (OS) and progression-free survival (PFS) in the TCGA [hazard ratio (HR) = 0.92 for OS; HR = 0.83 for PFS] (Supplementary Figure S6A and B available online at https://academic.oup.com/bib). Further analyses of individual cancer types revealed that high senescence levels were associated with prolonged survival in PRAD (Figure 6A and B). As abundant immune infiltration in tumors has been considered a routine prognostic factor [65], this result is in line with the positive correlation of the CS score with the total cell infiltration in PRAD (Figure 3B).
Figure 6.
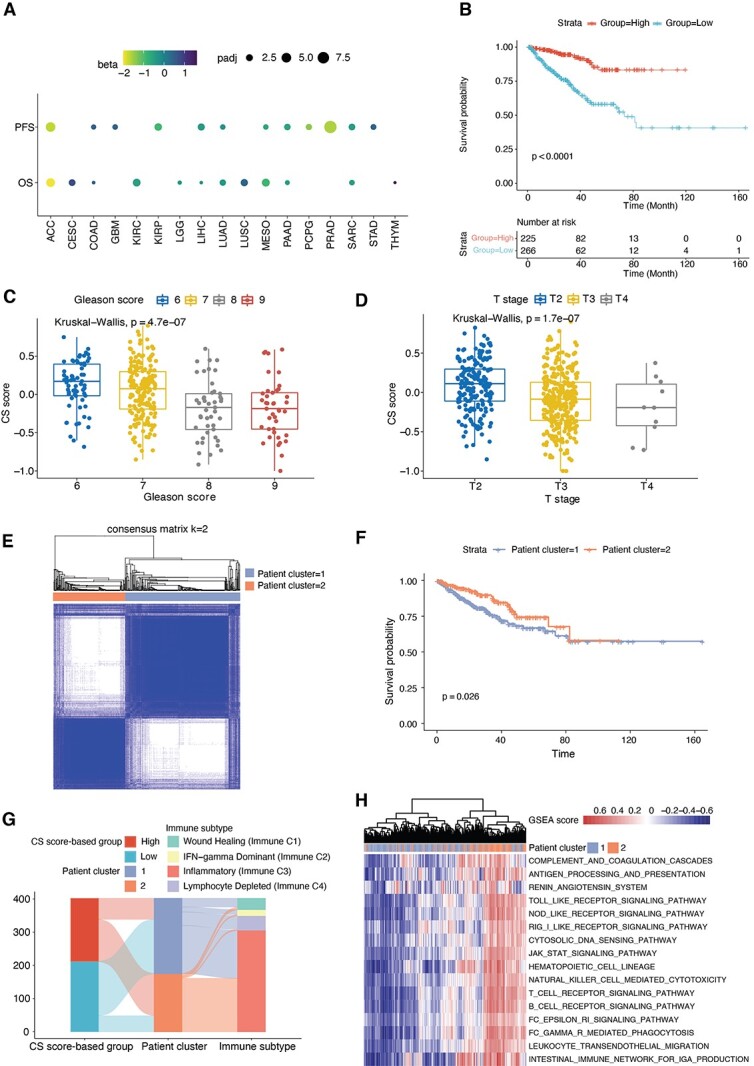
Identifying the clinical relevance of senescence levels. (A) Cox proportional hazards model analysis of the CS score for PFS (top) and OS (bottom). The circle size denotes the Benjamini–Hochberg-adjusted −log10 P-value, and the color denotes the beta coefficient of the CS score. A beta value < 0 indicates a trend toward a high CS score with better survival. (B) Kaplan–Meier curves of PFS for the high and low groups stratified by the median CS score in TCGA PRAD. Time is measured in months, and the log-rank test P-value is reported. The numbers of patients at risk are shown over time in the bottom panel. (C and D) Box plots showing the CS score across Gleason scores (C) and T stages (D) of PRAD patients in the TCGA. Kruskal–Wallis test P-values are stated. (E) Consensus clustering identified two distinct clusters based on the CS signature in transcriptome data of PRAD patients (k = 2). (F) Kaplan–Meier curves of PFS for PRAD patient clusters (Cluster 1 and Cluster 2) identified from the consensus clustering results. Time is measured in months, and the log-rank test P-value is reported. (G) Sankey diagrams illustrating the associations between patients grouped by CS scores, patient clusters and TCGA immune subtypes. (H) Hierarchical clustering of GSEA scores for all immune-related pathways in the KEGG database, annotated by patient cluster in the color bar.
We then selected PRAD to examine the impact of senescence levels on clinical indices. Lower CS scores were observed in patients with higher Gleason scores, T stages and N stages (Figure 6C and D, Supplementary Figure S6C available online at https://academic.oup.com/bib), indicating that senescent tumors maintain fewer malignant properties. To further confirm this finding and test the robustness of CS score-based groups, we extracted the expression of all genes in the CS signature and performed consensus clustering to divide PRAD patients into two groups (Figure 6E, Supplementary Figure S6D and E available online at https://academic.oup.com/bib). The unsupervised method revealed two clusters (Cluster 1 and Cluster 2), and patients in Cluster 2 exhibited better survival (Figure 6F). As anticipated, patients in Cluster 2 were mainly from the high-CS group and maintained more inflammatory immune phenotypes (Immune C3) than immunosuppressive phenotypes (Immune C1 and C4) (Figure 6G). Additionally, hierarchical clustering of all immune pathways in the KEGG database also displayed a similar grouping as the consensus clustering-based classification (Figure 6H), indicating overall immune activation in the senescent tumor microenvironment. Altogether, our analyses indicate the potential prognostic value of the CS score in recognizing PRAD patients with better survival and active immune responses.
Construct and validate senescence predictor in prostate cancer
To facilitate clinical applications of the CS signature for prognosis, we employed three machine learning-based algorithms to select critical features from all CS genes (Figure 7A, Methods and materials). We collected 5 PRAD cohorts with 1159 patients and applied the TCGA PRAD cohort as a training dataset and others as independent validation datasets [66–69]. Ten, 3 and 21 significant genes were identified by least absolute shrinkage and selection operator (LASSO), random forest and boruta (RFB) and extreme gradient boosting (XGBoost), respectively. The three common genes [sperm-associated antigen 5 (SPAG5), transforming acidic coiled-coil protein-3 (TACC3), trophinin-associated protein (TROAP)] of the three algorithms were selected to construct multiple Cox regressions. We defined the CS predictor as follows: CS predictor = −0.00358 × (expression of SPAG5) − 0.0367 × (expression of TACC3) − 0.0697 × (expression of TROAP). As expected, the CS predictor showed significant associations with the CS score in both TCGA data and four independent cohorts (Supplementary Figure S7F available online at https://academic.oup.com/bib). Then, we classified the patients into high and low groups according to the median value of the CS predictor. Patients with lower CS predictors suffered from significantly worse prognosis with faster disease progression in all five cohorts (Figure 7B–F) (log-rank P-value < 0.05). In addition, we estimated the predictive power of the CS predictor in each cohort. The CS predictor displayed excellent performance for 1-year-, 3-year- and 5-year progressions, with an average AUC of approximately 0.7 in the TCGA training dataset and the four testing datasets (Supplementary Figure S7A–E available online at https://academic.oup.com/bib). Consistently, worse tumor grades showed lower CS predictors in TCGA PRAD patients (Figure 7G), which was further evidenced by the expression of the three genes among different tumor stages (Supplementary Figure S7G available online at https://academic.oup.com/bib).
Figure 7.

Senescence genes are potential predictors of patient prognosis in prostate cancer. (A) Overall strategies for selecting three key genes in the CS signature to predict the PFS of PRAD patients in the TCGA. (B–F) Kaplan–Meier curves of PFS for patients with high and low CS predictor scores in five published PRAD cohorts, including the testing dataset (TCGA) and four validation datasets (PRJCA001124, MSKCC cohort, Setlur et al.’s cohort and GSE70769). Time is measured in months, and the log-rank test P-value is reported. The numbers of patients at risk are shown over time in the bottom panel. (G) Boxplots showing the CS predictor scores among different T stages in TCGA PRAD, colored by T stage. The Kruskal–Wallis test was used for P-value calculation. (H) Heatmap showing the quantitative results of the TACC3, SAPG5, TROAP proteins, and their corresponding CS predictor scores in IHC assays of 72 PRAD patients. (I) Representative IHC graph of TACC3, SAPG5 and TROAP expression in three PRAD patients. Tumor grades and Gleason scores are indicated in the bottom panel. (J) Boxplots comparing CS predictor scores among different tumor grades of PRAD patients. Kruskal–Wallis test P-values are stated. (K) Correlations of Gleason scores with CS predictor scores in PRAD patients. Linear regression lines are drawn (red line) with 95% CIs (gray zone); Spearman correlation and corresponding P-values are stated.
Aiming to validate the predictive value of the CS predictor, we enrolled 72 PRAD patients and performed IHC staining against SPAG5, TACC3 and TROAP (Figure 7H and I). Based on the quantitative results, we calculated the CS predictors of individual patients and found that they were markedly correlated with lower tumor grades and Gleason scores (Figure 7J and K). Correlations were also observed for the three genes, respectively (Supplementary Figure S7H and I available online at https://academic.oup.com/bib). Altogether, these results illustrate CS predictor is significantly correlated with the clinical outcomes of PRAD patients in diverse cohorts, indicating that the three hub genes from the CS signature could be potential prognostic biomarkers in PRAD.
Discussion
CS is an essential cellular process in both aging and cancer, while comprehensive assessments of the senescent landscape and associated features at pan-cancer level remain unexplored. Additionally, CS functionality as either a tumor suppressor or a tumor stimulator remains under intense debate [27]. To gain insights into this, we established a computational approach for CS quantification and revealed the connections of CS with genomic features, immune phenotypes and clinical outcomes in individual cancer types. Identifying cancer-specific associations with CS could lead to the rational choice of senescence-targeted therapy in specific cancer types. Additionally, three CS genes significantly predicted patient survival in various cohorts, suggesting their potential as prognostic biomarkers. Thus, based on the computational metrics of CS levels, our findings provide a framework for better understanding CS-related modulations in the tumor microenvironment and could guide further experiments and biomarker identification.
To the best of our knowledge, we are the first to provide a comprehensive evaluation of senescence levels at the pan-cancer level by integrating multiple senescence-related genes and proposing a metric (CS score) of tumor senescence. This multiparametric metric leverages the common features of senescent cells across a spectrum of diverse cell types, overcoming the shortage of lacking CS-specific makers and providing the same criteria for comparing senescence levels across cancer types. In addition, this transcriptome-level measurement can be applied at a single-cell level, which may help to evaluate CS levels in these cells lacking detectable senescence markers by experiments. Using this approach, we observed the CS score was higher in the adjacent normal samples and was decreased with clinical parameters of aggressive phenotypes. These negative associations with tumor aggressiveness suggest the premalignant features of senescent tumor cells, which is in line with the greater presence of senescent cells in premalignant tumors than in malignant tumors [4]. In addition, we discovered tissue type-related distributions of CS scores across TCGA cancer types and consistent intercellular heterogeneity of senescence levels across diverse single-cell datasets, suggesting the critical contribution of tissue types and cell origins to the CS score.
With our approach, we were able to provide insights into CS functions in tumor immunity. First, we revealed the relationships between senescence levels and immune features in individual cancer types, deepening our understanding of the exact roles of CS in context-dependent mediation [70]. Second, CS scores showed positive correlations with total cell infiltration levels and PD-L1 expression in particular cancer types, including melanoma and prostate cancer. These prominent associations may provide possible explanations for age-dependent immune dysfunctions in these two cancer types [71, 72]. Third, we observed that senescent cancer cells from PRAD patients exhibited activated immune properties, showing increased expression of HLA genes and frequent communication with T-cells. These results suggest potential mechanisms underlying previous observations that immune surveillance of senescent cells enhanced immune clearance and limited tumor progression [70]. Further investigations based on the assessment of CS levels would facilitate mechanistic understanding at the systems level in more age-related diseases.
Senescence-related genes have clinical implications in patient prognosis and immunotherapy response. On the one hand, we applied three machine learning-based algorithms to identify three hub genes predicting the survival of PRAD patients and validated these genes in ~660 patients as well as 72 PRAD patients by IHC. Consistent with the negative correlations with patient prognosis, the three genes played protumor roles in influencing malignant behaviors in prostate cancers via various mechanisms [73–75], while the senescence-related mechanisms in prostate cancers need further experimental investigations. As the three-genes-based predictor is more feasible to detect, CS predictor would have promising clinical applications in prognosis predictions. On the other hand, we observed the significant correlations of the CS score with known predictors of ICB therapy, including critical immune checkpoint proteins (PD1, PDL1 and CTLA4), tumor mutation burden, tumor aneuploidy and cytolytic immune infiltrates [43, 76–80]. Indeed, we found the predictive power of the CS score in the ICB response in cancer types where CS scores showed significant associations with immune molecular features. Additionally, opposite alterations in CS scores post-ICB treatment between responders and nonresponders at the single-cell level, together with significant correlations of PD-L1 and p21 expression in the IHC assay, further support the capabilities of the CS score to predict ICB responses effectively. As discussed in our review [81] and preclinical success in pancreas cancer [82], additional studies focusing on the combination therapy of senescence-related treatment with immunotherapy would be a promising strategy to augment clinical success in certain cancers.
There are several limitations in our study. First, our GSVA-based strategy of defining senescence levels depends on the compositions of gene signature. The gene signature-independent methods are worthy of further investigation to enhance the technical novelty. Second, though GSVA is more stable than other algorithms in evaluating gene set activity in UMI-based single-cell RNA-seq datasets [83], the high dropout events might affect the accuracy of the CS score in evaluating senescence levels. Thus, some cautions should be exerted when interpreting the CS score in less-qualified single-cell RNA-seq datasets. Third, due to the limited number of patients with immunotherapy treatment in current studies, we observed only the associations of CS scores with immune responses in several cohorts. These relationships need to be further verified in larger samples, and the practical applications of the CS score in clinical cohorts also need more investigations. Lastly, more experimental validations are needed to comprehensively interpret CS scores, especially in data with small sample sizes.
To facilitate senescence assessment, we made this approach available as an interactive website TCSER (http://tcser.bmicc.org), which allows users to evaluate CS levels and recognize CS-associated immune cells and molecules in user-customed and public transcriptome data. In summary, based on computational metrics of CS levels, our findings provide a framework for better understanding of CS-related modulations in the tumor microenvironment and would advance the development of biomarker identification and personalized therapeutic strategies in clinical oncology.
Methods and materials
Data and resources
Somatic mutation data (mutation annotation format), RNA-seq data [transcripts per million (TPM)] and associated clinical data for 33 cancer types (10 495 samples) (Supplementary Table S2 available online at https://academic.oup.com/bib) were downloaded from the TCGA database using the R package ‘TCGAbiolinks’ (version 2.14.1) [37]. Proteomic data in the TCGA and the gene expression matrix and related information in the GTEx database were collected from UCSC Xena (http://xena.ucsc.edu/public/). Expression profiles of immunotherapy cohorts were retrieved through accession numbers (BLCA_EGAS #00001002556, GC_PRJEB25780, NSCLC_GSE126044, SKCM_GSE115821, Zhao2019_Glioblastoma, Miao2018_Kidney, Lauss2017_Melanoma and Raize2017_Melanoma). Information from four PRAD validation cohorts was downloaded from PRJCA001124, MSKCC cohort, Setlur et al.’s cohort and GSE70769 [66–69].
Single-cell RNA-seq data were collected from the Gene Expression Omnibus (GEO) database (https://www.ncbi.nlm.nih.gov/geo/), Single Cell Portal database (https://singlecell.broadinstitute.org/single_cell) and Tumor Immune Single-cell Hub database (http://tisch.comp-genomics.org/home/) [84]. Single-cell RNA-seq data of different cancers contain BRCA (GSE143423, 4375 cells), CRC (GSE146771, 5220 cells), GBM (GSE102130, 3057 cells), GBM (GSE131928-10X, 13 558 cells), GBM (GSE131928-Smartseq2, 7930 cells), NSCLC (GSE117570, 11 453 cells), NSCLC (GSE143423, 12 193 cells), OV (GSE118828, 1909 cells), SKCM (GSE72056, 4645 cells) and PRAD (GSE141445, 33 100 cells). Single-cell RNA-seq data of immunotherapy-treated cohorts contain melanoma patients (GSE115978, 6173 cells), BCC patients (GSE123813, 52 917 cells), Merkel cell carcinoma (MCC) patients (GSE117988, 10 148 cells), triple negative breast cancer patients (GSE136206, 27 532 cells) and leptomeningeal metastases patients (Prakadan et al. [85]data, 18 103 cells).
The stemness score (RNAss and DNAss), homologous recombination deficiency (HRD), homologous recombination deficiency-loss of heterozygosity (HRD-LOH), immune subtypes and leukocyte fractions of TCGA samples were downloaded from the UCSC Xena database. Immune genes were defined as 1043 genes involved in all immune pathways from the KEGG databases. SASP genes were collected from the Reactome database (https://reactome.org/). CYT score is the mean transcriptional expression of GZMA and PRF1 [43].
CS score calculation
We collected previously curated gene sets of replicative CS from the published literature [86]. The 1259 genes within the CS signature were divided into 2 gene sets: 525 positive CS-related genes and 734 negative CS-related genes. We used GSVA [26] to calculate the activities of two gene sets in individual samples, respectively. The CS scores were defined as the differences between positive CS-related activities and negative CS-related activities. The significance levels of CS scores were estimated from the permutation test by randomly selecting gene sets with the same gene number (1259 genes) as the CS signature for 100 times in one sample. Tumor samples were divided into high-CS and low-CS groups based on median CS scores. For single-cell RNA-seq datasets, we used the same GSVA method as above by function enrichIt in R package ‘escape’ to calculate the CS score for every single cell.
Evaluating the robustness of the CS score
We validated the robustness of the CS score using four complementary approaches. First, we performed pre-ranked gene set enrichment analysis of the CS signature in the hallmark gene sets of the Molecular Signatures Database (MSigDB) by the R package ‘fgsea’. We also obtained the GSVA scores of c6 oncogenic signatures in MSigDB for all TCGA samples and then calculated Spearman correlations between the CS scores and these GSVA scores. Second, we evaluated Spearman correlations of the transcriptional expression of CS genes and non-CS genes with the protein expression of p16INK4A and p21 across all TCGA samples. Third, we compared predictive capability of CS scores, p21 and p16 expression in recognizing senescent cells in 128 cells from 15 independent datasets (Supplementary Table S1 available online at https://academic.oup.com/bib). Binomial linear models were built between the CS score and senescence information by the function glm in R. The AUCs for individual datasets were estimated using R package ‘pROC’. P16 was not included in the analysis of induced senescent cells due to missing values in most datasets. Finally, with cancer type as the covariate, linear models were built between molecular features of three main CS hallmarks and CS score/p21 expression/p16 expression in TCGA data. Three main CS hallmarks contain DNA damage, cell-cycle arrest and SASP [14, 15]. DNA damage can be reflected by HRD and total mutation load [87–89]. Stemness scores (DNAss and RNAss) represent the activated status of cell cycle. Core SASP genes (IL-1α/IL-6/IL-8/IL-1β/CXCL1/CXCL2) were collected from experimental protocol [90]. Leukocyte fractions were affected by SASP factors in cancers [91].
Genomic variation analysis
CNVs were analyzed using GISTIC 2.0 [33] to identify arm- and focal-level alterations in 25 TCGA cancer types with >100 samples. Significant broad events were considered alterations occurring in >70% of one arm with q values < 0.25. We defined CNV scores based on the previous reports [92]. For focal-level events, the ratios of log2 copy number were divided into the following scores: 2 if log2 ratio ≥ 1, 1 if log2 ratio < 1 and ≥0.25, 0 if log2 ratio < 0.25 and ≥−0.25, −1 if log2 ratio < −0.25 and ≥−1 and −2 if log2 ratio < −1. The focal score of a tumor was the sum of all focal-level scores in the tumor. The arm- and chromosome-level scores were defined by a similar procedure. Chromosome-level events were considered events in which both arms had the same log2 ratio. The overall CNV score of a tumor was the sum of focal-level, arm-level and chromosome-level CNV scores. Linear mixed-effect models were applied to identify the association between the CS score and CNV score, adjusting for age, sex, race and cancer types as covariates in the R package ‘lmer’. Arm-level gains and losses were defined by log2-transformed copy-number ratios >0.25 and <−0.25, respectively. The associations between the CS score and arm-level gains and losses were calculated by a similar linear model as above.
For SNVs, the total numbers of mutation events in TCGA were collected using function tcgaCompare in R package ‘TCGABiolinks’. The associations between the CS score and mutation load were analyzed by the similar linear model as CNV. The mutation data of PRAD were further analyzed and visualized in R package ‘maftools’ with default parameter settings.
Identifying CS-related immune characteristics at the pan-cancer level
ESTIMATE algorithm was used to evaluate the levels of stromal cells, immune cells and tumor purity (stromal score, immune score and ESTIMATE score) [40], with the gene expression matrix (TPM matrix) as input and default settings. The coefficients between the CS score and the three scores from ESTIMATE tool were calculated by building linear mixed-effect models with cancer type as a covariant in R package ‘lmer’. The absolute abundances of 22 immune cell types in TCGA samples were inferred by CIBERSORT (https://cibersort.stanford.edu/) [42], with gene expression matrix (TPM matrix) and LM22 signature as inputs. Spearman correlations were calculated between the CS score and results from ESTIMATE and CIBERSORT tools and were further visualized by R package ‘corrplot’.
Single-cell data analysis
The count matrix of PRAD single-cell data (GSE141445) was imported into R package ‘Seurat’ (v4.0.4). Low-quality cells were identified and filtered with the following criteria: (1) nFeatures <200 or >5218 and (2) the mitochondrial gene ratio >20%. A total of 33 100 high-quality cells were used for the following analyses. According to the Seurat tutorial, we performed data integration by R package ‘harmony’ and conducted data normalization, cluster finding and visualization. Cell clusters were manually annotated based on reported markers [46]. Luminal cells with the top 5% and bottom 5% CS scores were assigned to the high-CS and low-CS groups, respectively. The DEGs between the high-CS and low-CS groups in luminal cells were identified by function FindMarkers with default parameters. Significant DEGs (adjusted P-value < 0.01 and average fold-change > 1) were selected for pathway enrichment in the Reactome database using the R package ‘ReactomePA’. CellPhoneDB (v1.1.0) was used for cell–cell communication analysis with the count matrix as the input. Significant interaction pairs were chosen with P-value < 0.05.
Count matrices in other single-cell datasets were preprocessed according to the standard pipeline in MAESTRO [45]. The activities of all KEGG pathways in GSE123813 dataset were evaluated by function enrichIt in R package ‘escape’. The top and bottom 10 pathways were selected based on Spearman correlations between the CS score and pathway activities across all malignant cells. To exclude the heterogeneity of individual patients in five single-cell RNA-seq datasets from immunotherapy cohorts, the coefficients of posttreatment CS scores were identified by fitting the linear mixed model with different patients as covariates.
Evaluating the predictive value of the CS score for immunotherapy response
Gene expression data and associated response information of 542 patients with immunotherapy treatment were collected from eight cohorts. Binomial linear models were built between the CS score and response information by the function glm in R. The AUCs for individual cohorts were estimated using R package ‘pROC’. We also applied the TIDE tool (http://tide.dfci.harvard.edu/) [64] to calculate the TIDE score and used the same method to calculate AUCs of TIDE score.
Survival analysis
To identify CS-related survival across 33 TCGA cancer types, Cox proportional hazards regression models of OS and PFS were constructed by setting CS scores and age at diagnosis as time-dependent variables and cancer types, sex as well as race as strata. HR [95% confidence interval (CI)] and P-values were visualized by function ggforest. The survival differences between the two groups were estimated by Kaplan–Meier survival curves. Significant differences were determined using the log-rank test, and P-value < 0.05 was considered as statistically significant. Survival analyses were conducted using the R packages ‘survival’ and ‘survminer’.
Analysis of CS signature-based classifications in PRAD
Two patient clusters were identified in TCGA PRAD patients using the unsupervised consensus clustering algorithm in R package ‘ConsensusClusterPlus’ [93] with 1000 iterations to obtain stable classifications. The optimal clustering number was determined by the relative change in the area under the CDF curve. The relationships among different classifications were displayed by the Sankey plots in R package ‘ggalluvial’.
Construction of CS predictor for PRAD
CS predictor was established based on 5 PRAD cohorts (1159 patients), including TCGA PRAD as the training dataset and another 4 cohorts as validation datasets (PRJCA001124, MSKCC cohort, Setlur et al.’s cohort and GSE70769) [66–69]. Key prognosis-related genes in the CS signature were selected by three machine learning algorithms, including LASSO, RFB and XGBoost. We fit the Cox regression with LASSO regularization and 3-fold cross-validation and selected 10 significant genes. RFB was implemented by functions Boruta and TentativeRoughFix in R package ‘Boruta’, and three genes were selected. XGBoost algorithms calculate the importance of each feature in the construction of the boosted decision trees. Twenty-one significant genes were identified by this method in R package ‘xgboost’. Finally, we obtained three common genes (SPAG5, TACC3 and TROAP) to construct multiple Cox regression models. CS predictor was defined as follows: CS predictor = −0.00358*(expression of SPAG5) − 0.0367* (expression of TACC3) − 0.0697*(expression of TROAP). Samples were then classified into high and low groups according to the median value of CS predictors.
IHC staining
Tissue microarray containing 72 PRAD tumor tissues was purchased from Shanghai Superbiotek Pharmaceutical Technology Co, Ltd (Shanghai, China). All specimens had corresponding clinical information, including age, sex, pathological grade and Gleason score. Paraffin-embedded tissue sections were fully dewaxed in xylene and then rehydrated in a series of ethanol gradients (100% and 95%). After heating for 10 min at 95–98°C in sodium citrate buffer for antigen retrieval, the sections were incubated with primary antibodies at 4°C overnight. Primary antibodies, including anti-PD-L1 (rabbit monoclonal EPR19759, 1:250, ab213524, Abcam), anti-CD45 (rabbit monoclonal EP322Y, 1:250, ab40763, Abcam), anti-p21 (rabbit monoclonal EPR362, 1:100, ab109520, Abcam), anti-TACC3 (rabbit monoclonal EPR7756, 1:100, ab134154, Abcam), anti-SPAG5 (rabbit polyclonal, 1:50, #A07062-2, BOSTER) and anti-TROAP (rabbit polyclonal, 1:100, 13634-1-AP, Proteintech) antibodies, were used. Secondary antibodies were biotinylated labeled anti-rabbit antibodies [Ready-to-use SBC-POD (rabbit IgG), #SA1022, BOSTER]. A professional pathologist evaluated the staining intensities and expression percentages of these proteins on slides. The staining intensity was scored as 0, 1, 2 and 3 for non-expression, low expression, mid-expression and high expression, respectively. The final staining score of a slide was calculated by multiplying the expressed percentage and the intensity score.
Website construction
The TCSER website was developed using R Shiny (https://shiny.rstudio.com). TCSER provides two main functions: senescence estimation and senescence exploration. The first function allows users to calculate CS score of individual samples in uploaded gene expression files and to identify CS-associated cell types and genes across all uploaded samples. The latter function allows users to interactively explore and visualize CS-related immune features and clinical relevance in publicly available data, including TCGA, immunotherapy cohorts and single-cell datasets.
Statistical analysis
The Wilcoxon test was used to compare two groups with non-normally distributed data, and Student’s t-test was performed for normally distributed data. Two-sided Kruskal–Wallis tests were used to compare more than two groups with non-normally distributed data. The Cochran–Mantel–Haenszel test was used for statistical analysis comparing noncategorical values among more than two groups. Correlation coefficients were assessed by Spearman correlations. Statistical significance in survival analysis was determined by the log-rank test. Significant P-values were denoted as follows: ns >0.05, * <0.05, ** <0.01, *** <0.001 and **** <0.0001. The statistical information for the experiments is detailed in the figure legends. All statistical analyses were performed using R (version 4.1.1).
Data availability
All data are incorporated into the article and its online supplementary material. Data are also available on the TCSER website (http://tcser.bmicc.org).
Authors’ contributions
X.W., H.-Z.C. and D.-P.L. conceived and designed the study. X.W., L.M. and X.P. performed data analysis with help from H.W. L.M. participated in the biopsy collection and IHC experiments. X.W. wrote the manuscript with help from L.M., X.P. and H.W. H.-Z.C. and D.-P.L. supervised the study. All authors participated in data discussion and manuscript reviewing and approved the submitted manuscript.
Key Points
CS score could be served as a computational metric of senescence levels in 33 cancer types, 29 normal tissues and ~212 000 single-cell profiles.
The cancer-specific associations of CS with immune features would guide the rational choice of senescence-related therapy and immunotherapy in certain cancer types.
CS score could be an independent prognostic factor in prostate cancer, and three key CS genes have promising clinical applications in prognosis predictions.
Supplementary Material
Author Biographies
Xiaoman Wang is a PhD at the Institute of Basic Medical Sciences, Chinese Academy of Medical Sciences and Peking Union Medical College. Her researches focus on computational methodology and data integration in cancer and aging.
Lifei Ma is a PhD candidate at the Institute of Basic Medical Sciences, Chinese Academy of Medical Sciences and Peking Union Medical College. His researches focus on bioinformatics and molecular biology.
Xiaoya Pei is a PhD candidate at the Institute of Basic Medical Sciences, Chinese Academy of Medical Sciences and Peking Union Medical College. Her researches focus on bioinformatics and molecular biology.
Heping Wang is a PhD candidate at the Institute of Basic Medical Sciences, Chinese Academy of Medical Sciences and Peking Union Medical College. Her researches focus on bioinformatics and molecular biology.
Xiaoqiang Tang is an associate professor at West China Second University Hospital, Sichuan University. His researches focus on aging and aging-related diseases.
Jian-Fei Pei is a research associate at the Institute of Basic Medical Sciences, Chinese Academy of Medical Sciences and Peking Union Medical College. His researches focus on aging and aging-related diseases.
Yang-Nan Ding is a PhD at the Institute of Basic Medical Sciences, Chinese Academy of Medical Sciences and Peking Union Medical College. Her researches focus on aging and aging-related diseases.
Siyao Qu is a PhD candidate at the Institute of Basic Medical Sciences, Chinese Academy of Medical Sciences and Peking Union Medical College. Her researches focus on aging and aging-related diseases.
Zi-Yu Wei is a master candidate at the Institute of Basic Medical Sciences, Chinese Academy of Medical Sciences and Peking Union Medical College. Her researches focus on aging and aging-related diseases.
Hui-Yu Wang is a master candidate at the Institute of Basic Medical Sciences, Chinese Academy of Medical Sciences and Peking Union Medical College. Her researches focus on aging and aging-related diseases.
Xiaoyue Wang is a professor at the Institute of Basic Medical Sciences, Chinese Academy of Medical Sciences and Peking Union Medical College. Her researches focus on cancer genomics and bioinformatics.
Gong-Hong Wei is a professor at School of Basic Medical Sciences, Fudan University. His researches focus on prostate cancer.
De-Pei Liu is a professor at the Institute of Basic Medical Sciences, Chinese Academy of Medical Sciences and Peking Union Medical College. His researches focus on aging and aging-related diseases.
Hou-Zao Chen is a professor at the Institute of Basic Medical Sciences, Chinese Academy of Medical Sciences and Peking Union Medical College. His researches focus on aging and aging-related diseases.
Funding
This work was supported by grants from the National Key Research and Development Project of China (grant numbers 2020YFC2008003 and 2019YFA0801500), the Chinese Academy of Medical Sciences Innovation Fund for Medical Sciences (grant numbers: CIFMS2021-I2M-1-016, 2021-I2M-1-001, 2021-I2M-1-050, and 2019-RCHL-006), and the National Natural Science Foundation of China (grant numbers: 82030017, 92149305 and 91849207).
References
- 1. Siegel RL, Miller KD, Jemal A. Cancer statistics, 2020. CA Cancer J Clin 2020;70:7–30. [DOI] [PubMed] [Google Scholar]
- 2. Mathon NF, Lloyd AC. Cell senescence and cancer. Nat Rev Cancer 2001;1:203–13. [DOI] [PubMed] [Google Scholar]
- 3. Zhang R, Chen HZ, Liu DP. The four layers of aging. Cell Syst 2015;1:180–6. [DOI] [PubMed] [Google Scholar]
- 4. Collado M, Serrano M. Senescence in tumours: evidence from mice and humans. Nat Rev Cancer 2010;10:51–7. [DOI] [PMC free article] [PubMed] [Google Scholar]
- 5. Chen Z, Trotman LC, Shaffer D, et al. Crucial role of p53-dependent cellular senescence in suppression of Pten-deficient tumorigenesis. Nature 2005;436:725–30. [DOI] [PMC free article] [PubMed] [Google Scholar]
- 6. Campisi J. Cellular senescence as a tumor-suppressor mechanism. Trends Cell Biol 2001;11:S27–31. [DOI] [PubMed] [Google Scholar]
- 7. Braig M, Lee S, Loddenkemper C, et al. Oncogene-induced senescence as an initial barrier in lymphoma development. Nature 2005;436:660–5. [DOI] [PubMed] [Google Scholar]
- 8. Partridge AH, Hughes ME, Warner ET, et al. Subtype-dependent relationship between young age at diagnosis and breast cancer survival. J Clin Oncol 2016;34:3308–14. [DOI] [PubMed] [Google Scholar]
- 9. Campisi J. Aging, cellular senescence, and cancer. Annu Rev Physiol 2013;75:685–705. [DOI] [PMC free article] [PubMed] [Google Scholar]
- 10. Berian JR, BensonAB, III, Nelson H. Young age and aggressive treatment in colon cancer. JAMA 2015;314:613–4. [DOI] [PubMed] [Google Scholar]
- 11. Prieto LI, Baker DJ. Cellular senescence and the immune system in cancer. Gerontology 2019;65:505–12. [DOI] [PMC free article] [PubMed] [Google Scholar]
- 12. Krizhanovsky V, Yon M, Dickins RA, et al. Senescence of activated stellate cells limits liver fibrosis. Cell 2008;134:657–67. [DOI] [PMC free article] [PubMed] [Google Scholar]
- 13. Calcinotto A, Kohli J, Zagato E, et al. Cellular senescence: aging, cancer, and injury. Physiol Rev 2019;99:1047–78. [DOI] [PubMed] [Google Scholar]
- 14. Gorgoulis V, Adams PD, Alimonti A, et al. Cellular senescence: defining a path forward. Cell 2019;179:813–27. [DOI] [PubMed] [Google Scholar]
- 15. Hernandez-Segura A, Nehme J, Demaria M. Hallmarks of cellular senescence. Trends Cell Biol 2018;28:436–53. [DOI] [PubMed] [Google Scholar]
- 16. Ou HL, Hoffmann R, Gonzalez-Lopez C, et al. Cellular senescence in cancer: from mechanisms to detection. Mol Oncol 2021;15:2634–71. [DOI] [PMC free article] [PubMed] [Google Scholar]
- 17. Casella G, Munk R, Kim KM, et al. Transcriptome signature of cellular senescence. Nucleic Acids Res 2019;47:7294–305. [DOI] [PMC free article] [PubMed] [Google Scholar]
- 18. Avelar RA, Ortega JG, Tacutu R, et al. A multidimensional systems biology analysis of cellular senescence in aging and disease. Genome Biol 2020;21:91. [DOI] [PMC free article] [PubMed] [Google Scholar]
- 19. Jochems F, Thijssen B, De Conti G, et al. The Cancer SENESCopedia: a delineation of cancer cell senescence. Cell Rep 2021;36(4):109441. [DOI] [PMC free article] [PubMed] [Google Scholar]
- 20. Kang TW, Yevsa T, Woller N, et al. Senescence surveillance of pre-malignant hepatocytes limits liver cancer development. Nature 2011;479:547–51. [DOI] [PubMed] [Google Scholar]
- 21. Biran A, Zada L, Abou Karam P, et al. Quantitative identification of senescent cells in aging and disease. Aging Cell 2017;16:661–71. [DOI] [PMC free article] [PubMed] [Google Scholar]
- 22. Baker DJ, Wijshake T, Tchkonia T, et al. Clearance of p16Ink4a-positive senescent cells delays ageing-associated disorders. Nature 2011;479:232–6. [DOI] [PMC free article] [PubMed] [Google Scholar]
- 23. Wolchok JD, Chiarion-Sileni V, Gonzalez R, et al. Overall survival with combined nivolumab and ipilimumab in advanced melanoma. N Engl J Med 2017;377:1345–56. [DOI] [PMC free article] [PubMed] [Google Scholar]
- 24. Ding YN, Wang HY, Chen HZ, et al. Targeting senescent cells for vascular aging and related diseases. J Mol Cell Cardiol 2021;162:43–52. [DOI] [PubMed] [Google Scholar]
- 25. Cheng LQ, Zhang ZQ, Chen HZ, et al. Epigenetic regulation in cell senescence. J Mol Med (Berl) 2017;95:1257–68. [DOI] [PubMed] [Google Scholar]
- 26. Hanzelmann S, Castelo R, Guinney J. GSVA: gene set variation analysis for microarray and RNA-seq data. BMC Bioinform 2013;14:7. [DOI] [PMC free article] [PubMed] [Google Scholar]
- 27. Perez-Mancera PA, Young AR, Narita M. Inside and out: the activities of senescence in cancer. Nat Rev Cancer 2014;14:547–58. [DOI] [PubMed] [Google Scholar]
- 28. He S, Sharpless NE. Senescence in health and disease. Cell 2017;169:1000–11. [DOI] [PMC free article] [PubMed] [Google Scholar]
- 29. Collado M, Blasco MA, Serrano M. Cellular senescence in cancer and aging. Cell 2007;130:223–33. [DOI] [PubMed] [Google Scholar]
- 30. Medema JP. Escape from senescence boosts tumour growth. Nature 2018;553:37–8. [DOI] [PubMed] [Google Scholar]
- 31. Krtolica A, Campisi J. Integrating epithelial cancer, aging stroma and cellular senescence. Adv Gerontol 2003;11:109–16. [PubMed] [Google Scholar]
- 32. Aunan JR, Cho WC, Soreide K. The biology of aging and cancer: a brief overview of shared and divergent molecular hallmarks. Aging Dis 2017;8:628–42. [DOI] [PMC free article] [PubMed] [Google Scholar]
- 33. Mermel CH, Schumacher SE, Hill B, et al. GISTIC2.0 facilitates sensitive and confident localization of the targets of focal somatic copy-number alteration in human cancers. Genome Biol 2011;12:R41. [DOI] [PMC free article] [PubMed] [Google Scholar]
- 34. Taylor AM, Shih J, Ha G, et al. Genomic and functional approaches to understanding cancer aneuploidy. Cancer Cell 2018;33:676–89.E3. [DOI] [PMC free article] [PubMed] [Google Scholar]
- 35. El Gammal AT, Bruchmann M, Zustin J, et al. Chromosome 8p deletions and 8q gains are associated with tumor progression and poor prognosis in prostate cancer. Clin Cancer Res 2010;16:56–64. [DOI] [PubMed] [Google Scholar]
- 36. Hause RJ, Pritchard CC, Shendure J, et al. Classification and characterization of microsatellite instability across 18 cancer types. Nat Med 2016;22:1342–50. [DOI] [PubMed] [Google Scholar]
- 37. Colaprico A, Silva TC, Olsen C, et al. TCGAbiolinks: an R/Bioconductor package for integrative analysis of TCGA data. Nucleic Acids Res 2016;44:e71. [DOI] [PMC free article] [PubMed] [Google Scholar]
- 38. Voeller HJ, Truica CI, Gelmann EP. Beta-catenin mutations in human prostate cancer. Cancer Res 1998;58:2520–3. [PubMed] [Google Scholar]
- 39. Salmon H, Remark R, Gnjatic S, et al. Host tissue determinants of tumour immunity. Nat Rev Cancer 2019;19:215–27. [DOI] [PMC free article] [PubMed] [Google Scholar]
- 40. Yoshihara K, Shahmoradgoli M, Martinez E, et al. Inferring tumour purity and stromal and immune cell admixture from expression data. Nat Commun 2013;4:2612. [DOI] [PMC free article] [PubMed] [Google Scholar]
- 41. Wang B, Kohli J, Demaria M. Senescent cells in cancer therapy: Friends or foes? Trends Cancer 2020;6:838–57. [DOI] [PubMed] [Google Scholar]
- 42. Newman AM, Liu CL, Green MR, et al. Robust enumeration of cell subsets from tissue expression profiles. Nat Methods 2015;12:453–7. [DOI] [PMC free article] [PubMed] [Google Scholar]
- 43. Rooney MS, Shukla SA, Wu CJ, et al. Molecular and genetic properties of tumors associated with local immune cytolytic activity. Cell 2015;160:48–61. [DOI] [PMC free article] [PubMed] [Google Scholar]
- 44. Lauss M, Donia M, Harbst K, et al. Mutational and putative neoantigen load predict clinical benefit of adoptive T cell therapy in melanoma. Nat Commun 2017;8:1738. [DOI] [PMC free article] [PubMed] [Google Scholar]
- 45. Wang C, Sun D, Huang X, et al. Integrative analyses of single-cell transcriptome and regulome using MAESTRO. Genome Biol 2020;21:198. [DOI] [PMC free article] [PubMed] [Google Scholar]
- 46. Chen S, Zhu G, Yang Y, et al. Single-cell analysis reveals transcriptomic remodellings in distinct cell types that contribute to human prostate cancer progression. Nat Cell Biol 2021;23:87–98. [DOI] [PubMed] [Google Scholar]
- 47. Tuyn J, Jaber-Hijazi F, MacKenzie D, et al. Oncogene-expressing senescent melanocytes up-regulate MHC class II, a candidate melanoma suppressor function. J Invest Dermatol 2017;137:2197–207. [DOI] [PMC free article] [PubMed] [Google Scholar]
- 48. Efremova M, Vento-Tormo M, Teichmann SA, et al. CellPhoneDB: inferring cell-cell communication from combined expression of multi-subunit ligand-receptor complexes. Nat Protoc 2020;15:1484–506. [DOI] [PubMed] [Google Scholar]
- 49. Yuan M, Zhu H, Xu J, et al. Tumor-derived CXCL1 promotes lung cancer growth via recruitment of tumor-associated neutrophils. J Immunol Res 2016;2016:6530410. [DOI] [PMC free article] [PubMed] [Google Scholar]
- 50. Xiu MX, Liu YM, Kuang BH. The oncogenic role of Jagged1/Notch signaling in cancer. Biomed Pharmacother 2020;129:110416. [DOI] [PubMed] [Google Scholar]
- 51. Dhawan P, Richmond A. Role of CXCL1 in tumorigenesis of melanoma. J Leukoc Biol 2002;72:9–18. [PMC free article] [PubMed] [Google Scholar]
- 52. Kotsiou E, Okosun J, Besley C, et al. TNFRSF14 aberrations in follicular lymphoma increase clinically significant allogeneic T-cell responses. Blood 2016;128:72–81. [DOI] [PMC free article] [PubMed] [Google Scholar]
- 53. Carter SL, Cibulskis K, Helman E, et al. Absolute quantification of somatic DNA alterations in human cancer. Nat Biotechnol 2012;30:413–21. [DOI] [PMC free article] [PubMed] [Google Scholar]
- 54. Klein-Hessling S, Muhammad K, Klein M, et al. NFATc1 controls the cytotoxicity of CD8(+) T cells. Nat Commun 2017;8:511. [DOI] [PMC free article] [PubMed] [Google Scholar]
- 55. Frazzi R. BIRC3 and BIRC5: multi-faceted inhibitors in cancer. Cell Biosci 2021;11:8. [DOI] [PMC free article] [PubMed] [Google Scholar]
- 56. Du B, Liu M, Li C, et al. The potential role of TNFAIP3 in malignant transformation of gastric carcinoma. Pathol Res Pract 2019;215:152471. [DOI] [PubMed] [Google Scholar]
- 57. Wang X, Chai Z, Li Y, et al. Identification of potential biomarkers for anti-PD-1 therapy in melanoma by weighted correlation network analysis. Genes (Basel) 2020;11(4):435. [DOI] [PMC free article] [PubMed] [Google Scholar]
- 58. Qi X, Qi C, Wu T, et al. CSF1R and HCST: novel candidate biomarkers predicting the response to immunotherapy in non-small cell lung cancer. Technol Cancer Res Treat 2020;19:1533033820970663. [DOI] [PMC free article] [PubMed] [Google Scholar]
- 59. Mariathasan S, Turley SJ, Nickles D, et al. TGFbeta attenuates tumour response to PD-L1 blockade by contributing to exclusion of T cells. Nature 2018;554:544–8. [DOI] [PMC free article] [PubMed] [Google Scholar]
- 60. Kim ST, Cristescu R, Bass AJ, et al. Comprehensive molecular characterization of clinical responses to PD-1 inhibition in metastatic gastric cancer. Nat Med 2018;24:1449–58. [DOI] [PubMed] [Google Scholar]
- 61. Auslander N, Zhang G, Lee JS, et al. Publisher correction: robust prediction of response to immune checkpoint blockade therapy in metastatic melanoma. Nat Med 2018;24:1942. [DOI] [PMC free article] [PubMed] [Google Scholar]
- 62. Zhao J, Chen AX, Gartrell RD, et al. Immune and genomic correlates of response to anti-PD-1 immunotherapy in glioblastoma. Nat Med 2019;25:462–9. [DOI] [PMC free article] [PubMed] [Google Scholar]
- 63. Miao D, Margolis CA, Gao W, et al. Genomic correlates of response to immune checkpoint therapies in clear cell renal cell carcinoma. Science 2018;359:801–6. [DOI] [PMC free article] [PubMed] [Google Scholar]
- 64. Jiang P, Gu S, Pan D, et al. Signatures of T cell dysfunction and exclusion predict cancer immunotherapy response. Nat Med 2018;24:1550–8. [DOI] [PMC free article] [PubMed] [Google Scholar]
- 65. Pages F, Galon J, Dieu-Nosjean MC, et al. Immune infiltration in human tumors: a prognostic factor that should not be ignored. Oncogene 2010;29:1093–102. [DOI] [PubMed] [Google Scholar]
- 66. Taylor BS, Schultz N, Hieronymus H, et al. Integrative genomic profiling of human prostate cancer. Cancer Cell 2010;18:11–22. [DOI] [PMC free article] [PubMed] [Google Scholar]
- 67. Setlur SR, Royce TE, Sboner A, et al. Integrative microarray analysis of pathways dysregulated in metastatic prostate cancer. Cancer Res 2007;67:10296–303. [DOI] [PubMed] [Google Scholar]
- 68. Ross-Adams H, Lamb AD, Dunning MJ, et al. Integration of copy number and transcriptomics provides risk stratification in prostate cancer: a discovery and validation cohort study. EBioMedicine 2015;2:1133–44. [DOI] [PMC free article] [PubMed] [Google Scholar]
- 69. Li J, Xu C, Lee HJ, et al. A genomic and epigenomic atlas of prostate cancer in Asian populations. Nature 2020;580:93–9. [DOI] [PubMed] [Google Scholar]
- 70. Burton DGA, Stolzing A. Cellular senescence: immunosurveillance and future immunotherapy. Ageing Res Rev 2018;43:17–25. [DOI] [PubMed] [Google Scholar]
- 71. Ponnappan S, Ponnappan U. Aging and immune function: molecular mechanisms to interventions. Antioxid Redox Signal 2011;14:1551–85. [DOI] [PMC free article] [PubMed] [Google Scholar]
- 72. Hurez V, Daniel BJ, Sun L, et al. Mitigating age-related immune dysfunction heightens the efficacy of tumor immunotherapy in aged mice. Cancer Res 2012;72:2089–99. [DOI] [PMC free article] [PubMed] [Google Scholar]
- 73. Zhang H, Li S, Yang X, et al. miR-539 inhibits prostate cancer progression by directly targeting SPAG5. J Exp Clin Cancer Res 2016;35:60. [DOI] [PMC free article] [PubMed] [Google Scholar]
- 74. Qie Y, Wang L, Du E, et al. TACC3 promotes prostate cancer cell proliferation and restrains primary cilium formation. Exp Cell Res 2020;390:111952. [DOI] [PubMed] [Google Scholar]
- 75. Ye J, Chu C, Chen M, et al. TROAP regulates prostate cancer progression via the WNT3/survivin signalling pathways. Oncol Rep 2019;41:1169–79. [DOI] [PubMed] [Google Scholar]
- 76. McGranahan N, Favero F, Bruin EC, et al. Clonal status of actionable driver events and the timing of mutational processes in cancer evolution. Sci Transl Med 2015;7:283ra254. [DOI] [PMC free article] [PubMed] [Google Scholar]
- 77. Davoli T, Uno H, Wooten EC, et al. Tumor aneuploidy correlates with markers of immune evasion and with reduced response to immunotherapy. Science 2017;355(6322):eaaf8399. [DOI] [PMC free article] [PubMed] [Google Scholar]
- 78. Van Allen EM, Miao D, Schilling B, et al. Genomic correlates of response to CTLA-4 blockade in metastatic melanoma. Science 2015;350:207–11. [DOI] [PMC free article] [PubMed] [Google Scholar]
- 79. Chan TA, Yarchoan M, Jaffee E, et al. Development of tumor mutation burden as an immunotherapy biomarker: utility for the oncology clinic. Ann Oncol 2019;30:44–56. [DOI] [PMC free article] [PubMed] [Google Scholar]
- 80. Chan TA, Wolchok JD, Snyder A. Genetic basis for clinical response to CTLA-4 blockade in melanoma. N Engl J Med 2015;373:1984. [DOI] [PubMed] [Google Scholar]
- 81. Li PH, Zhang R, Cheng LQ, et al. Metabolic regulation of immune cells in proinflammatory microenvironments and diseases during ageing. Ageing Res Rev 2020;64:101165. [DOI] [PubMed] [Google Scholar]
- 82. Ruscetti M, JPT M, Mezzadra R, et al. Senescence-induced vascular remodeling creates therapeutic vulnerabilities in pancreas cancer. Cell 2020;181:424, e421–41. [DOI] [PMC free article] [PubMed] [Google Scholar]
- 83. Zhang Y, Ma Y, Huang Y, et al. Benchmarking algorithms for pathway activity transformation of single-cell RNA-seq data. Comput Struct Biotechnol J 2020;18:2953–61. [DOI] [PMC free article] [PubMed] [Google Scholar]
- 84. Sun D, Wang J, Han Y, et al. TISCH: a comprehensive web resource enabling interactive single-cell transcriptome visualization of tumor microenvironment. Nucleic Acids Res 2021;49:D1420–30. [DOI] [PMC free article] [PubMed] [Google Scholar]
- 85. Prakadan SM, Alvarez-Breckenridge CA, Markson SC, et al. Genomic and transcriptomic correlates of immunotherapy response within the tumor microenvironment of leptomeningeal metastases. Nat Commun 2021;12(1):5955. [DOI] [PMC free article] [PubMed] [Google Scholar]
- 85. Chatsirisupachai K, Palmer D, Ferreira S, et al. A human tissue-specific transcriptomic analysis reveals a complex relationship between aging, cancer, and cellular senescence. Aging Cell 2019;18:e13041. [DOI] [PMC free article] [PubMed] [Google Scholar]
- 86. Tubbs A, Nussenzweig A. Endogenous DNA damage as a source of genomic instability in cancer. Cell 2017;168:644–56. [DOI] [PMC free article] [PubMed] [Google Scholar]
- 87. McCabe N, Turner NC, Lord CJ, et al. Deficiency in the repair of DNA damage by homologous recombination and sensitivity to poly(ADP-ribose) polymerase inhibition. Cancer Res 2006;66:8109–15. [DOI] [PubMed] [Google Scholar]
- 88. Frey MK, Pothuri B. Homologous recombination deficiency (HRD) testing in ovarian cancer clinical practice: a review of the literature. Gynecol Oncol Res Pract 2017;4:4. [DOI] [PMC free article] [PubMed] [Google Scholar]
- 89. Kohli J, Wang B, Brandenburg SM, et al. Algorithmic assessment of cellular senescence in experimental and clinical specimens. Nat Protoc 2021;16:2471–98. [DOI] [PMC free article] [PubMed] [Google Scholar]
- 90. Coppe JP, Desprez PY, Krtolica A, et al. The senescence-associated secretory phenotype: the dark side of tumor suppression. Annu Rev Pathol 2010;5:99–118. [DOI] [PMC free article] [PubMed] [Google Scholar]
- 91. Yuan J, Hu Z, Mahal BA, et al. Integrated analysis of genetic ancestry and genomic alterations across cancers. Cancer Cell 2018;34:549, e549–60. [DOI] [PMC free article] [PubMed] [Google Scholar]
- 92. Wilkerson MD, Hayes DN. ConsensusClusterPlus: a class discovery tool with confidence assessments and item tracking. Bioinformatics 2010;26:1572–3. [DOI] [PMC free article] [PubMed] [Google Scholar]
Associated Data
This section collects any data citations, data availability statements, or supplementary materials included in this article.
Supplementary Materials
Data Availability Statement
All data are incorporated into the article and its online supplementary material. Data are also available on the TCSER website (http://tcser.bmicc.org).