

Abstract
Ribonucleic acid (RNA)-seq data contain not only host transcriptomes but also nonhost information that comprises transcripts from active microbiota in the host cells. Therefore, joint and integrative analyses of both host and meta-transcriptome can reveal gene expression of the microbial community in a given sample as well as the correlative and interactive dynamics of the host response to the microbiome. However, there are no convenient tools that can systemically analyze host–microbiota interactions through simultaneously quantifying the host and meta-transcriptome in the same sample at the tissue and the single-cell level. This poses a challenge for interested researchers with limited expertise in bioinformatics. Here, we developed a software pipeline that can comprehensively and synergistically analyze and correlate the host and meta-transcriptome in a single sample using bulk and single-cell RNA-seq data. This pipeline, named meta-transcriptome detector (MTD), can extensively identify and quantify microbiome, including viruses, bacteria, protozoa, fungi, plasmids and vectors, in the host cells and correlate the microbiome with the host transcriptome. MTD is easy to install and run, involving only a few lines of simple commands. It offers researchers with unique genomics insights into host responses to microorganisms.
Keywords: software, RNA-seq, meta-transcriptomics, microbiota, host–microbiota interaction
Introduction
A variety of microorganisms have been recognized to contribute to the development of human diseases, including cancer, autoimmune diseases and psychological disorders. For example, Helicobacter pylori can cause stomach cancer [1], human papillomavirus infection can lead to uterine cervix cancer [2] and human immunodeficiency virus (HIV)-1 infection [3] can lead to HIV-associated neurocognitive disorders [4]. In addition, the Epstein–Barr virus was found to contribute to 1.5% of total human cancers of various types worldwide [5]. Therefore, systemic and comprehensive investigation of microorganisms in tissues for their contribution to disease development is critical, particularly, the pathogenic mechanisms of opportunistic infections need to be fully dissected [6]. Thus, it is necessary to address the differential abundance of distinct cell populations as it may contribute to the heterogeneous tropism in infections. Hence, it is important to analyze microbiome diversity, abundance, their interaction with host cells and impact on infected cells at both bulk tissue and single-cell level.
The transcriptome from a host tissue may contain messenger RNAs (mRNAs) from microorganisms that have not been fully investigated. Several tools have been developed to detect the microbiomes in the ribonucleic acid (RNA)-seq data, such as Kraken2 [7], VIRTUS [8], SAMSA2 [9], MetaTrans [10] and IDseq [11]. Kraken2 uses a k-mer-based alignment-free approach for taxonomic classification with a good balance between speed, accuracy and hardware requirements. VIRTUS is intended for more accurate virus analysis in RNA-seq data but only targets a limited amount of viruses in human. SAMSA2 is a pipeline that uses DIAMOND [12], a Basic Local Alignment Search Tool (BLAST)-like aligner that can perform protein annotation from meta-transcriptomic data, which is fast but at the cost of alignment sensitivity. MetaTrans has low hardware requirements and is accessible through a personal computer. But like SAMSA2, it has a low classification rate for the organisms made of the protein. IDseq is a cloud-based tool with a nicely designed graphical user interface that lowers the threshold for the meta-transcriptome analysis.
Although some of these tools are accessible through a personal computer [10] or webpage [11] with low hardware requirements, there is no convenient tool that can jointly analyze host and microbiome transcriptomes in the same set of data within a single workflow of analyses. This poses a challenge to researchers, especially those without bioinformatics expertise, who are interested in examining microbiome in host tissues and its relation to the endogenous expression of host genes at the both bulk tissue and single-cell level. To facilitate such effort of joint analyses of host transcriptome with its microbiome, we developed a user-friendly pipeline, meta-transcriptome detector (MTD) for comprehensive and integrative investigation of microbiome from bulk and single-cell RNA-seq data.
Results
Pipeline design
MTD has two sub-pipelines to detect and quantify microbiomes by analyzing bulk and single-cell RNA-seq data, respectively (Figure 1). MTD is written in the R (version 4.1.2) and Bash (version 4.2) languages and is executed in GNU/Linux system with Conda environments. Users can easily install and run MTD using only one command line and without requiring root privileges. The outputs (graphs, tables, count matrixes, etc.) are automatically generated and stored in the designated directory/folder defined by the user. The user manual for detailed instruction of installation and usage is available on the webpage https://github.com/FEI38750/MTD. Here, we describe the two sub-pipelines separately.
Figure 1.

An overview of MTD. (A) A workflow for bulk mRNA-seq analysis. (B) A workflow for single-cell mRNA-seq analysis. White boxes represent the reads in FASTQ format and the count matrix. Blue boxes show the bioinformatics software used. Green boxes are the additional tools for data processing. The white boxes with curved edges show the reference genome and databases. In the single-cell mRNA-seq workflow (B), the left side exemplifies the host reads process protocols, and the right side in yellow shadow shows the MTD automatic pipeline to calculate the count matrix for the microbiome reads and the correlation test between the microbiome and host genes.
Workflow for processing bulk RNA-seq data
First, RNA-seq raw reads in the FASTQ file are trimmed and filtered by fastp (version 0.20.1) [13] with polyA/T trimming, and reads <40 bp (with the option –trim_poly × –length_required 40) are discarded. Then, processed reads are classified based on the host genome by Kraken2 (version 2.1.1) [7] with default parameters. Finally, the host and nonhost reads are organized separately in FASTQ format.
Host transcriptome analysis
By default, the host species supported by MTD are Homo sapiens (reference genome assembly: GRCh38), Mus musculus (reference genome assembly: GRCm39) and Macaca mulatta (reference genome assembly: Mmul_10). However, users can add other host species by one command line as shown in the user’s manual. The host reads are aligned against the reference host genome by HISAT2 (version 2.2.1, set as default alignment program) [14] or Magic-BLAST (version 1.5.0) [15] with their default parameters written in a SAM file. Quantification of reads for host gene expression is done by feature Counts (version 2.0.1) [16]. Next, the count data are analyzed by the DESeq2 package (version 1.34.0) [17] in Bioconductor to obtain the differentially expressed genes (DEGs). The gene annotation is done through the biomaRt R package (version 2.50.2) [18, 19] in Bioconductor. The data visualization and a count matrix are automatically generated through R programs. The data visualization includes the heatmap, Venn diagram, PCA, barplot and volcano plot. The count matrix contains the Ensembl gene ID, gene symbol, chromosome name, gene position, functional descriptions and DEG results for each pairwise group comparison, raw, normalized and transformed reads counts. This count matrix is saved in CSV format and is ready for downstream analyses, such as pathway enrichment and customized data visualization. In addition, users can provide additional metadata information of the samples for more complex experimental designs and analyses. The multivariate association between host gene expression and covariates (e.g. batch, age and sex) will be further determined by MaAsLin2 [20]. Then, the extensive pathway enrichment analyses for the host gene are performed by the ClusterProfiler R package (version 4.2.2) [21, 22]. GSEA [23, 24] enrichment results of GO [25] and KEGG [26] with various visualizations will automatically be generated and saved.
Microbiome transcriptome analysis
MTD supports a broad spectrum of microbiome species and vectors, including viruses, bacteria, protozoa, fungi, plasmids and vectors. At the time of writing, MTD supports viruses of 16 275 species from Virus-Host DB [27]. It covers viruses stored in NCBI RefSeq and GenBank whose accession numbers are listed in EBI Genomes, including the genome of SARS-CoV-2 (taxid:2697049). Some viruses that are not contained in Virus-Host DB, such as simian immunodeficiency virus (SIVmac239) (GenBank accession number M33262), are also supported by MTD. The rest of the microbiome are from the NCBI RefSeq database [28], which includes 63 237 species of bacteria, 13 970 fungi, 1337 archaea, 573 protozoa and 5855 plasmids. In addition, vector contamination can be screened using the NCBI UniVec Database. Users can update the microbiome databases in MTD by one command line as shown in the user manual. The nonhost reads are further classified by Kraken2 based on microbiome references with the default parameters, followed by a decontamination step that removes the microorganism under the genera reported as reagent and laboratory contaminants [29]. Users can customize the blacklist of contaminants based on their experimental environments. Then, the abundance of the microbiome in the species level is calculated by Bracken (version 2.6.0) [30].
Next, the count data are used for analysis of the differentially expressed species. MTD offers DESeq2 [17], ANCOM-BC [31] and MaAsLin2 [20] to provide the user multiple options for differential abundance analysis of the microbiome and to ensure robust biological interpretations. A potential pitfall in current microbiome analysis is that observed microbial abundance is an unknown fraction of a unit volume of the ecosystem (e.g. gut tissue), and this sampling fraction varies from sample to sample [31]. It may introduce bias and lead to erroneous conclusions in differential abundance analysis [31]. With the advantage of the design of joint analysis, MTD uses the host mRNA library size to normalize sampling fraction variation. MTD adjusts the abundance of microbiome species based on the host transcriptome library size of a tissue sample. This normalization step is conducted through a formula, such as, design ~ group + transcriptome_size, where transcriptome_size is defined by the formula: log2 (of a transcriptome size) – mean (of all log2-transformed transcriptome sizes in a sample), and group is the group code (e.g. A or B) of a sample. As a result, the importance of the microbial species in a sample is adjusted for the overall representation of a host transcriptome when comparing the former between two groups of samples. Meanwhile, the nonhost reads (including both unclassified and classified reads by Kraken2 using the reference databases) are imported into the Humann3 (version 3.0) [32] for profiling microbial metabolic pathways and molecular functions. The ChocoPhlAn [33] and full UniRef90 [34] are used as reference databases for nucleotide and protein, respectively. Then the profiling results are annotated to commonly used functional terms to facilitate the downstream analyses.
Next, the heatmaps of DEGs, Venn diagrams, PCA, bar plots and volcano plots are generated for the microbial species, molecules and metabolic pathways based on the differential abundance analysis results. Additionally, kraken-biom (version 1.0.1) [35] is used to format the data for diversity analyses and phylogenetic tree plotting. The phyloseq R package (version 1.38.0) [36] in Bioconductor and vegan R package (version 2.5-7) [37] are used to analyze the diversities, including alpha diversity (Shannon, Simpson) and beta diversity (Bray-Curtis). Then, box plots are shown to visualize the t-test comparison results between groups, including alpha diversities of classified reads and the abundances of unclassified reads. PCoA graphing and analysis of similarities are based on Bray-Curtis distance. The relative abundance of a microbial species in the total microbiome is shown as bar plots at the Phylum level. The heatmap of total microbiome abundance is plotted using data normalized by Deseq2. Next, the phylogenetic trees are plotted through modified Graphlan [38], which is a tool for generating informative and integrative circular graphs representing phylogenetic and taxonomic trees. However, the original program requires a specific data format as input and is not compatible with the output from Kraken2 and Bracken software. Therefore, we wrote a converter program and integrated it into the pipeline to bridge the taxonomic classification software Kraken2/Bracken and graph-making software, GraPhlAn. This allows us to transform the output of Kraken2 and Bracken to match the data structure requirements of GraPhlAn. Furthermore, the default settings of colors have been optimized by modifying the source code of GraPhlAn. In addition to .biom format, data are also saved in .mpa and .krona formats to facilitate downstream visualizations.
Most importantly, in the final steps of the pipeline, MTD examines the association between the microbiome and the host’s characteristics, such as gene expression and pathways. Pathway enrichment for each sample is performed by the single sample Gene Set Enrichment Analysis (ssGSEA 2.0) program [23, 39, 40] with a MSigDB C2 database that contains 6290 curated gene sets. ssGSEA 2.0 is modified for parallel computing in high-performance computing (HPC) environment, which is described in the supplementary document. Next, the effects from covariates among groups are adjusted through the removeBatchEffect function in the limma R package (version 3.50.0) [41] in Bioconductor. The association analyses are then conducted through Halla (version 0.8.18) [42], which is set to compute hierarchical clustering of Spearman pairwise correlation. Figure 2 illustrates the MTD automatic pipeline for the bulk RNA-seq raw data.
Figure 2.
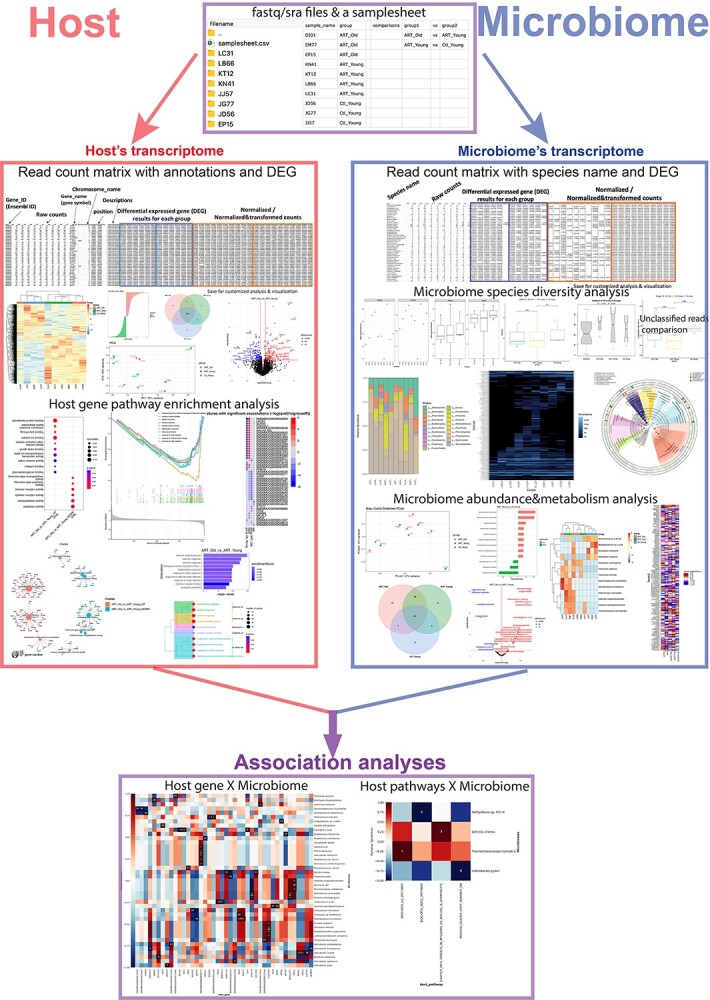
The automatic pipeline of MTD for analysis of the bulk RNA-seq raw data. Analysis results are automatically saved into the folder assigned by the user. Examples of analysis outputs for the transcriptome of host and microbiome are demonstrated separately on the left and right sides. The shared procedures are shown in the purple boxes, which include the input files (upper box) and the association analyses (bottom box). In addition to the graphs, all the detailed information is included in the data sheets and stored in the corresponding output folder. To use the MTD, the user needs to place the FASTQ files in a folder with a sample sheet in CSV format that describes the sample names, groups and comparisons and then performs the analysis with one command line. For example, with the command line ‘bash MTD.sh -i ~/inputpath/samplesheet.csv -o ~/outputpath -h 9544 -t 20’, the user provides the place of the sample sheet with the raw data after the flag ‘-i’, and the location to save the results (after flag ‘-o’), the host taxonomic ID is after ‘-h’, and the threads of CPU after ‘-t’.
Workflow for processing single-cell RNA-seq data
MTD supports automatic generation of the count matrix of the microbiome by using raw data in the FASTQ format and count matrix of host genes from two commonly used single-cell RNA-seq platforms, 10x Genomics and Drop-seq. The user may start with a count matrix of host genes (H5, Matrix or .dge.txt format) or follow the 10x Cell Ranger or Drop-seq pipeline if starting with the raw data. The cell barcodes are identified from the count matrix of host genes, and then the UMI and cell barcodes are extracted and added to read names by using the UMI tools (version 1.1.1) [43]. The reads are then trimmed and filtered by fastp and filtered for the host reads by Kraken2. The nonhost reads are further classified by Kraken2 with the comprehensive microbiome databases, followed by a decontamination step. The steps from trimming to decontamination use the same settings as mentioned in the previous section. Next, the taxonomic labels of the reads are extracted and aligned with the corresponding cell barcodes through a step written in the AWK program language. Finally, UMI tools are used to generate a count matrix (tab-separated) through a converter written in R. Figure 3 exemplifies a count matrix automatically generated by MTD for the microbiome in each cell. Subsequently, MTD combines the count matrices of the host genes and microbiome to perform the correlation analysis automatically. An example of the correlation analysis result is shown in Figure 7A and B.
Figure 3.

An example of the count matrix that is automatically generated by MTD for the single-cell microbiome analysis. For illustration, the figure shows part of the large count matrix. The name and taxonomy ID of the microbiome is shown in the first column and highlighted in the green box. The read counts are highlighted in the blue box. The first row shows the cell barcodes.
Figure 7.

Coexpression of microbiome and host genes in host cells. (A) Visualization of the highest correlation on the UMAP plot. The cells expressed GRIA2 are represented by red dots, and the cells infected with P. vivax are shown as green dots. The cells containing both are represented by the overlapping of the two colors (yellow). (B) A list of the top 20 correlations between host genes and microorganisms, and the highest pair is highlighted in red. (C) The results of pathway enrichment of the genes that were highly associated with P. vivax, which were defined by r > 0.2 and P < 0.05. The top three results of each GO categories are highlighted. UMAP plots were drawn by the Seurat R package. The pathway enrichment was performed through g:GOSt in g:Profiler (version: e104_eg51_p15_3922dba, organism: M. musculus).
At the single-cell level, the Spearman correlations between microbial organisms and host genes are tested by using the top 3000 most highly variable features, including the normalized data of both host and microbiome. Because correlation analysis step is highly time-consuming for a large data matrix, parallelizing computing using the doParallel R package (version 1.0.16) is applied to speed up the computation. The other analysis methods through Seurat R package (version 4.1.0) and homemade programs are described in the supplementary document. The diagram of the MTD pipeline for single-cell RNA-seq is demonstrated in Figure 1B.
Testing and validation
Bulk RNA-seq analysis: transcriptome of descending colon of rhesus macaques
Through MTD, the transcripts of both the microbiome and the host were analyzed simultaneously using the same bulk RNA-seq raw data. Figure 4 is a heatmap showing the abundance of all the microbiome species in the samples from the descending colon. Supplementary Figure 1, available online at https://academic.oup.com/bib, presents the taxonomic and phylogenetic trees of microorganisms detected in the descending colon samples from rhesus macaques. Because MTD generated comprehensive visualization outputs, some of the results are shown in the supplementary figures. Supplementary Figures 2–6, available online at https://academic.oup.com/bib, present the results of the microbiome and host gene analyses, respectively. Here, we demonstrate the results of association analyses of the microbiome to the host genes or pathways in the descending colon.
Figure 4.

Heatmap of the microbiome species identified in descending colon samples of rhesus macaques. The higher abundance of microbiome reads is shown in a light blue color, and the lower abundance is shown in a darker color. Data were normalized using the Deseq2 and plotted by the phyloseq R packages, which was wrapped in MTD.
The correlations between the microbiome and host gene are illustrated in Figure 5A. For example, Debaryomyces hansenii showed a significant positive correlation with host gene UBE2I and IL27RA. The expression of the host gene C1QTNF8 was positively correlated with a group of microbes, including Yarrowia lipolytica, Aspergillus chevalieri, Roseburia hominis and Anaerostipes hadrus.
Figure 5.

Analyses of association between the microbiome and host genes or pathways in the descending colon of the rhesus macaque. The figure shows the correlation between the RNA expression level of microbiome species and host gene (A), or pathways (B). The x-axis is labeled with the names of the host genes or pathways, and the y-axis lists the names of microbiome species. Positive correlation coefficients are shown in red, and negative correlation coefficients are shown in blue. The significant results are marked by white dots and ranked by numbers. The results from the same cluster can be found in a box with the same number. The association was examined by pairwise Spearman correlation test. The tabulates of all comparison results and dot plots were saved in the corresponding output folder.
The correlations between the microbiome and host pathways are shown in Figure 5B. For example, the pathway that controls the amplification of the 8q24 chromosome region (HEIDENBLAD_AMPLICON_8Q24_UP) was upregulated with the mRNA expression of Saccharomyces eubayanus. The complex I biogenesis signaling pathway (REACTOME_COMPLEX_I_BIOGENESIS) was negatively correlated with the expression of Helicobacter cinaedi.
Single-cell RNA-seq analysis
Microglia cells of SIV-infected rhesus macaques
We next applied MTD to single-cell RNA-seq data from microglia cells isolated from SIV-infected rhesus macaques [44]. Because the analysis results from the authors identified SIV transcripts in the single cells, it is an ideal dataset for validation of the capacity of MTD to process single-cell RNA-seq data.
First, count matrices of the microbiome were generated by MTD. Then, they were integrated with the host transcriptome for downstream analysis with the Seurat R package. The results showed that the major cell type in the sample was microglia, with a small portion of endothelial cells (Figure 6A). Further, a cluster of microglia cells was highly infected with SIV (Figure 6B). For this cluster, the top 20 markers ranked by fold change are displayed in Figure 6C, starting with PDE4A and SENP3. The cell subpopulation with these markers implicated a higher SIV tropism.
Figure 6.

Detection of SIV in microglia cells from rhesus macaques. (A) Cell types in different colors on the UMAP plot. Cell type identity was assigned based on the homemade program described in supplementary document. (B) SIV reads detected by MTD. The blue dots on the UMAP plot indicate the SIV-infected cells with the normalized reads quantity. (C) Markers of the cell cluster that harbor SIV. Analyses of the count matrix followed by visualization were performed through Seurat. FindMarkers function with MAST methodology was used for computing the log2fold changes for each gene/feature between clusters and their corresponding adjusted P-values.
Overall, the results validate the capability of MTD for detecting specific microorganism species from single-cell RNA-seq data.
Brain cells from mice
We also applied MTD on the single-cell RNA-seq data of brain cells isolated from mice [45] and demonstrated the correlation analyses between the microbiome and host genes or pathways at the single-cell level.
We found that Plasmodium vivax and the host gene GRIA2 had the highest correlation coefficient (Figure 7A). As shown in Figure 7B, GRIA2 was highly expressed in the P. vivax-infected cells. We further identified all the host genes that highly correlated with P. vivax (Figure 7C) and then performed pathway enrichment analysis. The results underscored the positive association of P. vivax with the function of the plasma membrane region of infected cells, such as cell junction and transmembrane transporter activity (Figure 7D). This result supports the cytoadherence phenomenon of P. vivax reported in previous research [46–48]. Although P. vivax primarily infects red blood cells, its cytoadherence on other cell types has been reported, such as in endothelial cells [46, 47]. Moreover, recent findings suggest that it has the ability to adhere to all Chinese hamster ovary cells [47]. Our results bring insights into the interaction between P. vivax and host cells, as it showed that P. vivax interacts with host cells that are incrementally expressing genes of the cellular membrane. Future research can study the causal effect of these molecules during infection, such as whether they contribute to pathogen adherence or if the infection leads to their increased expression.
Conclusion
MTD is a powerful and convenient host and meta-transcriptome integrative analysis pipeline for both bulk and single-cell RNA-seq data. With the use of this software, the activated microbiome (including the virome) can be detected, the cell-type harboring can then be identified and the correlation between the host gene expression and microbial prevalence can be directly analyzed. Thus, we introduce a powerful tool to improve our understanding of host–pathogen interactions, explicitly, how the microbiome contributes to the host’s health and disease and what genes and pathways of the host are important to a particular infection caused by a microbial species, which may shed light on the prevention and treatment of common human diseases from a metagenomics perspective.
Discussion
MTD has several unique advantages compared to current tools in detecting meta-transcriptome. The program can simultaneously and comprehensively profile microbiome and the host transcriptome in both bulk and single-cell RNA-seq data. MTD takes into account the host transcriptome library size while modeling microbiome reads in differential abundance analysis. Therefore, it overcomes drawbacks in current tools that analyze the meta-transcriptome only [8–11]. As a normal procedure, these tools [8–11] remove or ignore host transcriptome at the beginning of analyses and therefore would not consider the effects of host transcriptome library size in the downstream analyses. In addition, compared to the current tools [8–10] that are missing the decontamination step, MTD can eliminate the potential noises from the contaminant microbes, including the common contaminant microbes in the laboratory environment [29]. Users can also modify the list of contaminant microbes to better suit their specific requirements. MTD warrants easy usability as well as data safety. The software installation, updating and analyses can be achieved by single lines of command. It obviates the need of using other cloud-based applications.
Currently, it is common to perform the polyA tail enrichment during the library preparation for mRNA sequencing. Thus, meta-transcriptomics analyses as implemented with MTD could avoid contamination from viruses in most cases because virus RNA only acquires polyA tail when it is transcribed in the host cell. However, users need to be cautious about the possibilities of single-strand RNA viruses and other preparation methods that contain the polyA tail. Nevertheless, it is challenging to detect and remove other contaminated microbes. There are tools to identify the potential contaminant by simply calculating the correlation of nucleic acid abundance between microbes and the host [49]. However, these methods may not be sensitive if the samples have similar abundance, heterogeneous contaminant patterns or cross-contamination.
In the era of single-cell genomics, the presence of the microbiome in the cell populations and their associations with cell functions need to be better analyzed and further understood. With MTD, researchers are now able to acquire genomics insights into the pathogenesis of microorganisms identified. Furthermore, annotating the sample’s geographic information with each microorganism would offer us a map of pathogens, which could predict an epidemic. Thus, MTD could also become a critical element for monitoring the spread of the microbiome and its pathogenesis in the future.
Limitations and future perspectives
The microbiome taxonomic classification in MTD is based on an alignment-free method. Compared to alignment-based method such as STAR [50], it has the advantage of a lower hardware requirement and a higher speed [51] but may have reduced accuracy for lowly expressed genes and small RNAs [52]. Nevertheless, for protein-coding genes (mRNAs), quantification results are similar between alignment-free and alignment-based methods [52]. As our input data are from mRNA sequencing, the quantification analysis performance would not be affected on this aspect. In the future, we plan to improve the accuracy for counting the lowly expressed RNAs by separating microbial classification step from reads alignment step. For example, we may at the beginning use an alignment-free method to quickly screen and identify the microbes present in a sample as the ‘target’ microbiome, then build the reference indexes for those identified microbes only through an alignment-based tool for accurate counting. This approach may significantly reduce the computing requirement of the alignment-based method for the microbiome application.
Despite using the alignment-free method, hardware requirement for MTD is still higher than the mainstream personal computers, making it more practical to run only on HPC. As HPC usage and cloud-based computing (e.g. AWS from Amazon) is becoming the mainstream in big data analysis [53–56], the limitation of computing resource in using MTD is expected to be soon alleviated or resolved in the near future for most users.
We have not tested our pipeline on a larger sample size yet and its performance on large-scale datasets remains unclear. Users should take caution when running samples with large sizes (e.g. >50) as it may take longer time to finish. As one of our future developments, efficient algorithms for handling larger sample sizes will be developed. For example, batch running with each batch size of 5–10 samples may be used to time-consuming steps, followed by combining outputs for running less time-consuming steps.
Data availability
MTD software can be accessed through GitHub at https://github.com/FEI38750/MTD
Key Points
TD enables simultaneous analyses of the microbiome and the host cell transcriptome in bulk and single-cell RNA-seq data.
The correlation between the microbiome and the host transcriptome can be automatically analyzed.
MTD has an extensive microbiome detection capacity, including viruses, bacteria, protozoa, fungi, plasmids and vectors.
Installation and use MTD is as easy as one command line without the requirement of administrator/root privilege.
Decontamination function is enabled to eliminate the common contaminant microbes in the laboratory environment.
Supplementary Material
Acknowledgements
The authors thank Sandra Smith and Brian Kopecki at the Department of Information Technology of Texas Biomedical Research Institute for maintaining HPC and installing the third-party programs asked. We are grateful to any contributors in our respectable open-source community and for their virtue in sharing the questions and answers.
Author Biographies
Dr Fei Wu was a graduate student researcher at the Texas Biomedical Research Institute and has just received his PhD degree from the Tulane Center for Aging, Tulane University. His research focuses on aging-related host–pathogen interactions.
Dr Yao-Zhong Liu is an associate professor at the Department of Biostatistics and Data Science of Tulane University School of Public Health and Tropical Medicine. His research is focused on bioinformatics and biostatistics analyses of next-generation sequencing genomics data, such as RNA-seq and metagenomics data.
Dr Binhua ‘Julie’ Ling is an associate professor at the Host-Pathogen Interaction Program, Texas Biomedical Research Institute; and previously, was an associate professor at the Tulane University School of Medicine. Her research interest is in gut microbiota and HIV/SIV pathogenesis, viral tissue reservoirs and cure research.
Funding
This work was supported by the National Institutes of Health (Award Numbers R01 MH116844, R01 NS104016, and P51OD011104 and P51OD011133). The funders had no role in study design, data collection and analysis, preparation of the manuscript or decision for publication.
References
- 1. Wroblewski LE, PeekRM, Jr, Wilson KT. Helicobacter pylori and gastric cancer: factors that modulate disease risk. Clin Microbiol Rev 2010;23(4):713–39. [DOI] [PMC free article] [PubMed] [Google Scholar]
- 2. Muñoz N, Castellsagué X, de González AB, et al. Chapter 1: HPV in the etiology of human cancer. Vaccine 2006;24:S1–10. [DOI] [PubMed] [Google Scholar]
- 3. Sharp PM, Hahn BH. Origins of HIV and the AIDS pandemic. Cold Spring Harb Perspect Med 2011;1(1):a006841–1. [DOI] [PMC free article] [PubMed] [Google Scholar]
- 4. Cohen RA, Seider TR, Navia B. HIV effects on age-associated neurocognitive dysfunction: premature cognitive aging or neurodegenerative disease? Alzheimer's Res Ther 2015;7(1):37. [DOI] [PMC free article] [PubMed] [Google Scholar]
- 5. Farrell PJ. Epstein–Barr virus and cancer. Ann Rev Pathol Mechan Dis 2019;14(1):29–53. [DOI] [PubMed] [Google Scholar]
- 6. Zhang Y, Thompson KN, Branck T, et al. Metatranscriptomics for the human microbiome and microbial community functional profiling. Ann Rev Biomed Data Sci 2021;4(1):279–311. [DOI] [PubMed] [Google Scholar]
- 7. Wood DE, Lu J, Langmead B. Improved metagenomic analysis with Kraken 2. Genome Biol 2019;20(1):257. [DOI] [PMC free article] [PubMed] [Google Scholar]
- 8. Yasumizu Y, Hara A, Sakaguchi S, et al. VIRTUS: a pipeline for comprehensive virus analysis from conventional RNA-seq data. Bioinformatics 2020;37(10):1465–7. [DOI] [PMC free article] [PubMed] [Google Scholar]
- 9. Westreich ST, Treiber ML, Mills DA, et al. SAMSA2: a standalone metatranscriptome analysis pipeline. BMC Bioinform 2018;19(1):175. [DOI] [PMC free article] [PubMed] [Google Scholar]
- 10. Martinez X, Pozuelo M, Pascal V, et al. MetaTrans: an open-source pipeline for metatranscriptomics. Sci Rep 2016;6:26447. [DOI] [PMC free article] [PubMed] [Google Scholar]
- 11. Kalantar KL, Carvalho T, de Bourcy CFA, et al. IDseq-an open source cloud-based pipeline and analysis service for metagenomic pathogen detection and monitoring. Gigascience 2020;9(10):giaa111. [DOI] [PMC free article] [PubMed] [Google Scholar]
- 12. Buchfink B, Xie C, Huson DH. Fast and sensitive protein alignment using DIAMOND. Nat Methods 2015;12(1):59–60. [DOI] [PubMed] [Google Scholar]
- 13. Chen S, Zhou Y, Chen Y, et al. Fastp: an ultra-fast all-in-one FASTQ preprocessor. Bioinformatics 2018;34(17):i884–90. [DOI] [PMC free article] [PubMed] [Google Scholar]
- 14. Kim D, Paggi JM, Park C, et al. Graph-based genome alignment and genotyping with HISAT2 and HISAT-genotype. Nat Biotechnol 2019;37(8):907–15. [DOI] [PMC free article] [PubMed] [Google Scholar]
- 15. Boratyn GM, Thierry-Mieg J, Thierry-Mieg D, et al. Magic-BLAST, an accurate RNA-seq aligner for long and short reads. BMC Bioinformat 2019;20(1):405. [DOI] [PMC free article] [PubMed] [Google Scholar]
- 16. Liao Y, Smyth GK, Shi W. featureCounts: an efficient general purpose program for assigning sequence reads to genomic features. Bioinformatics 2013;30(7):923–30. [DOI] [PubMed] [Google Scholar]
- 17. Love MI, Huber W, Anders S. Moderated estimation of fold change and dispersion for RNA-seq data with DESeq2. Genome Biol 2014;15(12):550. [DOI] [PMC free article] [PubMed] [Google Scholar]
- 18. Durinck S, Moreau Y, Kasprzyk A, et al. BioMart and Bioconductor: a powerful link between biological databases and microarray data analysis. Bioinformatics 2005;21(16):3439–40. [DOI] [PubMed] [Google Scholar]
- 19. Durinck S, Spellman PT, Birney E, et al. Mapping identifiers for the integration of genomic datasets with the R/Bioconductor package biomaRt. Nat Protoc 2009;4(8):1184–91. [DOI] [PMC free article] [PubMed] [Google Scholar]
- 20. Mallick H, Rahnavard A, McIver LJ, et al. Multivariable association discovery in population-scale meta-omics studies. PLoS Comput Biol 2021;17(11):e1009442. [DOI] [PMC free article] [PubMed] [Google Scholar]
- 21. Wu T, Hu E, Xu S, et al. clusterProfiler 4.0: a universal enrichment tool for interpreting omics data. Innovation (N Y) 2021;2(3):100141. [DOI] [PMC free article] [PubMed] [Google Scholar]
- 22. Yu G, Wang LG, Han Y, et al. clusterProfiler: an R package for comparing biological themes among gene clusters. Omics 2012;16(5):284–7. [DOI] [PMC free article] [PubMed] [Google Scholar]
- 23. Subramanian A, Tamayo P, Mootha VK, et al. Gene set enrichment analysis: a knowledge-based approach for interpreting genome-wide expression profiles. Proc Natl Acad Sci 2005;102(43):15545–50. [DOI] [PMC free article] [PubMed] [Google Scholar]
- 24. Mootha VK, Lindgren CM, Eriksson KF, et al. PGC-1α-responsive genes involved in oxidative phosphorylation are coordinately downregulated in human diabetes. Nat Genet 2003;34(3):267–73. [DOI] [PubMed] [Google Scholar]
- 25.Ashburner et al. Gene ontology: tool for the unification of biology. Nat Genet. 2000;25(1):25–9 [DOI] [PMC free article] [PubMed] [Google Scholar]
- 26. Kanehisa M, Goto S. The Gene Ontology resource: enriching a GOld mine. Nucleic Acid Res 2021;49(D1):D325–D334. [DOI] [PMC free article] [PubMed] [Google Scholar]
- 27. Mihara T, Nishimura Y, Shimizu Y, et al. Linking virus genomes with host taxonomy. Viruses 2016;8(3):66. [DOI] [PMC free article] [PubMed] [Google Scholar]
- 28. Pruitt KD, Tatusova T, Maglott DR. NCBI reference sequence (RefSeq): a curated non-redundant sequence database of genomes, transcripts and proteins. Nucleic Acid Res 2005;33(Database issue):D501–4. [DOI] [PMC free article] [PubMed] [Google Scholar]
- 29. Salter SJ, Cox MJ, Turek EM, et al. Reagent and laboratory contamination can critically impact sequence-based microbiome analyses. BMC Biol 2014;12(1):87. [DOI] [PMC free article] [PubMed] [Google Scholar]
- 30. Lu J, Breitwieser FP, Thielen P, et al. Bracken: estimating species abundance in metagenomics data. PeerJ Comput Sci 2017;3:e104. [Google Scholar]
- 31. Lin H, Peddada SD. Analysis of compositions of microbiomes with bias correction. Nat Commun 2020;11(1):3514. [DOI] [PMC free article] [PubMed] [Google Scholar]
- 32. Beghini F, McIver LJ, Blanco-Míguez A, et al. Integrating taxonomic, functional, and strain-level profiling of diverse microbial communities with bioBakery 3. Elife 2021;10:e65088. [DOI] [PMC free article] [PubMed] [Google Scholar]
- 33. Franzosa EA, McIver LJ, Rahnavard G, et al. Species-level functional profiling of metagenomes and metatranscriptomes. Nat Methods 2018;15(11):962–8. [DOI] [PMC free article] [PubMed] [Google Scholar]
- 34. Suzek BE, Wang Y, Huang H, et al. UniRef clusters: a comprehensive and scalable alternative for improving sequence similarity searches. Bioinformatics 2014;31(6):926–32. [DOI] [PMC free article] [PubMed] [Google Scholar]
- 35. Dabdoub S, et al. Kraken-biom. GitHub 2016. [Google Scholar]
- 36. McMurdie PJ, Holmes S. phyloseq: an R package for reproducible interactive analysis and graphics of microbiome census data. PLoS One 2013;8(4):e61217. [DOI] [PMC free article] [PubMed] [Google Scholar]
- 37. Oksanen J, Blanchet, FG Friendly, M, et al. vegan: Community Ecology Package. 2020;2:5–7. https://CRAN.R-project.org/package=vegan [Google Scholar]
- 38. Asnicar F, Weingart G, Tickle TL, et al. Compact graphical representation of phylogenetic data and metadata with GraPhlAn. PeerJ, 2015;3, e1029–e1029. doi: 10.7717/peerj.1029 [DOI] [PMC free article] [PubMed] [Google Scholar]
- 39. Barbie DA, Tamayo P, Boehm JS, et al. Systematic RNA interference reveals that oncogenic KRAS-driven cancers require TBK1. Nature 2009;462(7269):108–12. [DOI] [PMC free article] [PubMed] [Google Scholar]
- 40. Krug K, Mertins P, Zhang B, et al. A curated resource for phosphosite-specific signature analysis. Mol Cell Proteomics 2019;18(3):576–93. [DOI] [PMC free article] [PubMed] [Google Scholar]
- 41. Ritchie ME, Phipson B, Wu D, et al. limma powers differential expression analyses for RNA-sequencing and microarray studies. Nucleic Acids Res 2015;43(7):e47–7. [DOI] [PMC free article] [PubMed] [Google Scholar]
- 42. Rahnavard G, et al. High-Sensitivity Pattern Discovery in Iarge Multi’Omic Datasets. 2021.
- 43. Smith T, Heger A, Sudbery I. UMI-tools: modeling sequencing errors in unique molecular identifiers to improve quantification accuracy. Genome Res 2017;27(3):491–9. [DOI] [PMC free article] [PubMed] [Google Scholar]
- 44. Niu M, Morsey B, Lamberty BG, et al. Methamphetamine increases the proportion of SIV-infected microglia/macrophages, alters metabolic pathways, and elevates cell death pathways: a single-cell analysis. Viruses 2020;12(11):1297. [DOI] [PMC free article] [PubMed] [Google Scholar]
- 45. Ogrodnik M, Evans SA, Fielder E, et al. Whole-body senescent cell clearance alleviates age-related brain inflammation and cognitive impairment in mice. Aging Cell 2021;20(2):e13296. [DOI] [PMC free article] [PubMed] [Google Scholar]
- 46. de las salas B, Segura C, Pabón A, et al. Adherence to human lung microvascular endothelial cells (HMVEC-L) of Plasmodium vivax isolates from Colombia. Malar J 2013;12(1):347. [DOI] [PMC free article] [PubMed] [Google Scholar]
- 47. Salazar Alvarez LC, Vera Lizcano O, da Silva Barros DKA, et al. Plasmodium vivax gametocytes adherence to bone marrow endothelial cells. Front Cell Infect Microbiol 2021;11:614985. [DOI] [PMC free article] [PubMed] [Google Scholar]
- 48. Totino PR, Lopes SC. Insights into the cytoadherence phenomenon of Plasmodium vivax: the putative role of phosphatidylserine. Front Immunol 2017;8:1148. [DOI] [PMC free article] [PubMed] [Google Scholar]
- 49. Davis NM, Proctor DM, Holmes SP, et al. Simple statistical identification and removal of contaminant sequences in marker-gene and metagenomics data. Microbiome 2018;6(1):226. [DOI] [PMC free article] [PubMed] [Google Scholar]
- 50. Dobin A, Davis CA, Schlesinger F, et al. STAR: ultrafast universal RNA-seq aligner. Bioinformatics 2012;29(1):15–21. [DOI] [PMC free article] [PubMed] [Google Scholar]
- 51. Zielezinski A, Vinga S, Almeida J, et al. Alignment-free sequence comparison: benefits, applications, and tools. Genome Biol 2017;18(1):186. [DOI] [PMC free article] [PubMed] [Google Scholar]
- 52. Wu DC, Yao J, Ho KS, et al. Limitations of alignment-free tools in total RNA-seq quantification. BMC Genom 2018;19(1):510. [DOI] [PMC free article] [PubMed] [Google Scholar]
- 53. LLP MI. High-performance computing (HPC) market - growth, trends, forecasts (2020–2025). ReportLinker 2021. [Google Scholar]
- 54. Analysis M. High performance computing (HPC) market by component (solutions (servers, storage, networking devices, and software) and services), deployment type, organization size, server prices band, application area, and region—global forecast to 2025. MarketsandMarkets Analysis 2021. [Google Scholar]
- 55. Panda DK, Subramoni H, Chu CH, et al. The MVAPICH project: transforming research into high-performance MPI library for HPC community. J Comput Sci 2021;52:101208. [Google Scholar]
- 56. Langmead B, Nellore A. Cloud computing for genomic data analysis and collaboration. Nat Rev Genet 2018;19(4):208–19. [DOI] [PMC free article] [PubMed] [Google Scholar]
Associated Data
This section collects any data citations, data availability statements, or supplementary materials included in this article.
Supplementary Materials
Data Availability Statement
MTD software can be accessed through GitHub at https://github.com/FEI38750/MTD
Key Points
TD enables simultaneous analyses of the microbiome and the host cell transcriptome in bulk and single-cell RNA-seq data.
The correlation between the microbiome and the host transcriptome can be automatically analyzed.
MTD has an extensive microbiome detection capacity, including viruses, bacteria, protozoa, fungi, plasmids and vectors.
Installation and use MTD is as easy as one command line without the requirement of administrator/root privilege.
Decontamination function is enabled to eliminate the common contaminant microbes in the laboratory environment.