

Abstract
Filtration methods for alcoholic fermented beverages often use filter aids such as diatomaceous earth (DE), which may contain elevated amounts of the heavy metals arsenic (As), lead (Pb), and cadmium (Cd). Here, we evaluated factors affecting transfer of these heavy metals from DE to beer and wine. A laboratory-scale filtration system was used to process unfiltered ale, lager, red wine, and white wine with three types of food-grade DE. Filtrate and DE were analyzed for heavy metals using ICP-MS, in addition to analysis using LC-ICP-MS for As speciation. Use of 2 g/L DE containing 5.4 mg/kg soluble inorganic As (iAs) for filtering beer and wine resulted in significant (p < 0.05) increases of 11.2–13.7 μg/L iAs in the filtered beverage. There was a significant (p < 0.05) effect of DE quantity used in filtration on transfer of iAs in all beverage types, while no alterations were observed for Pb and Cd levels. Methods to wash DE using water, citric acid, or EDTA all significantly (p < 0.05) reduced iAs concentrations, while only EDTA significantly reduced Pb levels. Cd concentrations were not affected by any wash method. These data indicate that specific steps can be taken to limit heavy metal transfer from DE filter aids to beer and wine.
Keywords: Beer, wine, heavy metals, inorganic arsenic, cadmium, lead, filter aids, diatomaceous earth
INTRODUCTION
Chronic dietary exposure to elevated amounts of the heavy metals arsenic (As), lead (Pb), and cadmium (Cd) poses a risk to public health,1–4 and these elements have consistently been found to be present in various foods.5 Toxicity of As is dependent on its chemical state, with inorganic As (iAs) exhibiting greater toxicity than organic forms. Thus, it is important to use analytical techniques to determine the specific forms of As in food and beverages. The U.S. Food and Drug Administration (FDA) has acted to mitigate the risk from dietary exposure to heavy metals in beverages though various measures, such as limiting Pb concentrations in bottled drinking water to 5 μg/L and by seeking to establish an action level of 10 μg/kg (≈10 μg/L) iAs in apple juice.6, 7 In Canada, a maximum limit (ML) of 100 μg/L for total As has been set for fruit juice, fruit nectar, and ready-to-drink beverages, although Health Canada has proposed that the ML for apple juice products be reduced to 15 μg/L.8 Recent analyses have revealed varying levels of iAs in apple juice, and other reports have indicated that fermented beverages such as beer and wine may contain elevated concentrations of iAs, Pb, and Cd.9–16 Although sources of heavy metal contamination are still unclear, preliminary evidence suggests that use of filter aids may be one such potential source.9, 17–19
Diatomaceous earth (DE) is one of the most commonly used filter aids for processing some fermented alcoholic beverages, employed to increase clarity and extend shelf-life.20, 21 According to U.S. Pharmacopeia (USP) standards, DE must not contain soluble As and Pb concentrations above 10 mg/kg to receive the food grade designation.22 This As limit is approximately 1,000X greater than the FDA proposed action level for iAs in apple juice and 2,000X greater than the Pb limit for bottled drinking water, raising concerns that filter aids may potentially introduce heavy metals into beverages during processing. In fact, a pilot study reported that As can transfer from DE to beer, which may explain the elevated levels of As in some German beers.9 Since filter aids such as DE are widely used in industry for processing of fermented alcoholic beverages,20, 21, 23 it is important from a public health perspective to evaluate factors affecting transfer of As, Pb, and Cd from filter aids to these commonly consumed products.
Previous experiments found that use of food-grade filter aids for processing apple and grape juices can indeed alter the final concentrations of iAs, Pb, and Cd in these fruit juices.24 Still, it is not clear whether these results readily translate to fermented alcoholic beverages, which can have substantial differences in their physical and chemical properties.20 This study builds on previous work to identify factors affecting transfer of heavy metals from three types of food-grade DE filter aids to two styles of beer (ale and lager) and two types of wine (red and white). Factors affecting transfer of heavy metals from filter aids to beer and wine, such as chemical properties of the beverage (i.e., pH) and the type and amount of filter aid, were also evaluated. The impact of washing filter aid as a remediation method to reduce heavy metal concentrations in this material was tested. Finally, a limited survey of commercial beer and wines for total As, Pb, and Cd was conducted to compare amounts of heavy metals transferred to beverages in the experimental study to levels found in commercial products.
MATERIALS AND METHODS
Chemicals.
Optima ultra trace-metal grade nitric acid and hydrochloric acid, electronic grade 2-propanol, Optima-grade methanol, and sodium hydroxide were purchased from Thermo Fisher Scientific (Waltham, MA). Reagent water for experiments was obtained from a Milli-Q system (Millipore-Sigma, Burlington, MA). Trace CERT As, Pb, and Cd standards, As(III)/As(V) standards, along with citric acid, ethylenediaminetetraacetic acid (EDTA), Trace Metals – Diatomaceous Earth reference material, and ammonium phosphate dibasic (>99.99% trace metals basis) were purchased from Sigma-Aldrich (St. Louis, MO). Iridium (Ir) standard was from Inorganic Ventures (Blacksburg, VA). Calibration tuning mix and pulse/analog solutions were purchased from Agilent Technologies (Santa Clara, CA). Trace metal quality plastic tubes were purchased from SCP Sciences (Champlain, NY). Trace Elements in Natural Water standard reference material (SRM 1640a) was obtained from the National Institute of Standards and Technology (NIST; Gaithersburg, MD). The food-grade DE filter aids (DE-1, DE-2, and DE-3) obtained from EP Minerals (Reno, NV) were selected to incorporate the different types of products used for beverage clarity endpoint needs.
Test and commercial beverages.
For filtration experiments, single batches of standard lager and ale-style beers were brewed at the Fermentation Sciences Lab located in the Department of Food Science at the University of Wisconsin-Madison and were not filtered after fermentation. Single lots of red and white wine were produced at a commercial winery without filtration. Commercially available beer (n = 20) and wine (n = 20) products from domestic and international sources were obtained for analysis of total As, Cd, and Pb content.
Test beverage pH and solids measurement.
Total suspended solids of the test beverages were measured by calculating the amount of dried solids retained on Whatman No. 4 filter paper after filtration. Measurement of pH was performed using a calibrated S20 SevenEasy pH meter with InLab Routine Pro pH electrode (Mettler Toledo, Columbus, OH).
DE heavy metal content.
Analyses for soluble heavy metal concentrations in DE were adapted from a previously reported method.25 In brief, a 0.25 g sample was sonicated in 50 mL of aqueous HNO3:HCl (5:0.5; v:v) for 20 min and then centrifuged at 1,300 g at 4 °C before collecting the supernatant. Extraction efficiency of Pb and Cd was assessed using Trace Metals – Diatomaceous Earth reference material.
Laboratory-scale filtration.
To estimate heavy metal transfer from filter aids to beverages occurring during filtration, benchtop laboratory-scale experiments were performed using a leaf filter filtration system as previously reported.24 Briefly, a Masterflex L/S digital pump drive with two standard pump heads (Cole-Parmer Instrument Company, Vernon Hills, IL) was connected in line to Posiseal filter housing (Gusmer Enterprises, Mountainside, NJ). The filtration system was equipped with a filter element with a cross-sectional area of 5.13 cm2. After the filter housing was back flushed with water, a precoat was established on the filter element by recirculating 1 g DE filter aid in 600 mL water. Afterward, DE was mixed in directly with the test beverage (bodyfeed DE) at 1, 2, 3, or 5 g/L. Beverage slurry, comprised of ale, lager, white wine, or red wine, was then immediately pumped through the filter at a rate of 60 mL/min. Bodyfeed DE amounts were chosen based on industry practices that establish the amount of filter aid from the suspended solids content of the unfiltered beverage.24 Although bodyfeed DE quantity depends on the desired clarity of the final product, typical rates used in industry for wine are reported to be 0.2–2 g/L.26 Slurry was stirred continuously using a Thermolyne Nuova magnetic stirring plate (Thermo Fisher Scientific). Beverage sample filtrate (50 mL) was directly collected from the filter outlet at 1, 4, and 8 min for timecourse experiments, or filtrate was pooled over 8 min for experiments assessing the effect of filter aid quantity on heavy metal transfer to beverages. Experimental time of 8 min was used to keep system backpressure within its pressure rating specifications.
Effect of pH on heavy metal transfer.
Filtration experiments were conducted that tested the effect of beer and wine with different pH values on heavy metal transfer from DE-1 filter aid. Unfiltered test beverages were pH-adjusted from 3.0–5.0 using 1 M hydrochloric acid (HCl) or sodium hydroxide (NaOH), and filtration was performed as described above for the timecourse experiments. The pH ranges used in the experiments bracketed the ranges typically observed in wine and beer.20, 27
Heavy metal transfer during precoat slurry mixing.
A filter precoat slurry of DE-1:test beverage (10:90; w:w) was continuously stirred using a magnetic stirrer. Beer and wine samples were collected at 1 min, 1 h, and 2 h. Samples were filtered through Whatman No. 4 filter paper before analysis of the liquid fraction for total As, Pb, and Cd content.
Washing of filter aid.
In order to test potential methods to decrease heavy metal content of filter aids, 10:90 (w:w) slurries of DE-1 and either water, 0.1% citric acid solution (w:w; pH = 2.7), or 0.1% EDTA solution (w:w; pH = 8.0) were mixed for 1 min. After mixing, DE was collected by filtering slurry through a Whatman No. 4 filter and then dried before analysis for total As, Pb, and Cd.
Sample preparation.
Beverages were prepared for elemental analysis by 10X sample dilution with aqueous HNO3:HCl (5:0.5; v:v) followed by centrifugation for 15 min using an Eppendorf 5810R centrifuge (1,300 g, 4°C; Eppendorf North America. Hauppauge, NY).
ICP-MS/MS analysis.
Samples were analyzed for total As, Cd, and Pb content using an Agilent 8800 inductively coupled plasma-tandem mass spectrometer (ICP-MS/MS) according to methods from previous reports.10, 28 ICP-MS/MS was set in MS/MS mode with research grade oxygen (99.999%) from Airgas (Radnor, PA) as the reaction gas (0.4 mL/min) and argon as the carrier gas (0.95 L/min) and makeup gas (0.20 L/min). To avoid spectral interferences, detection of As was in the form of 75As16O+ at 91 m/z. Cd was detected as isotopes 111Cd and 114Cd, and Pb as isotopes 206Pb, 207Pb, and 208Pb. Due to potential enhancement of As signal from the presence of carbon, 13C was measured to monitor any differences in carbon content between samples. Internal standard solution was mixed in line with the sample stream using a mixing tee before entering the nebulizer (sample tubing 1.02 mm inner diameter; internal standard tubing 0.25 mm inner diameter). ICP-MS Internal Standard Mix (Agilent Technologies) was prepared in aqueous HNO3:HCl:2-propanol (5:0.5:20; v:v:v), with internal standards for As, Pb, Cd set as germanium (Ge), bismuth (Bi), and indium (In), respectively. Internal standard mix contained 2-propanol and a final concentration of 5 mg/L iridium (Ir) as modifier to enhance As signal.29, 30 To determine method recovery and precision, independent replicates of unfiltered wine and beer samples (n = 3) were spiked with 5 μg/L or 25 μg/L As, Pb, and Cd standard and then analyzed by ICP-MS/MS. Quality control measures included validating each analytical sequence using NIST Trace Elements in Natural Water reference material and by analyzing a calibration verification standard of As, Cd, and Pb every 10 samples. Method detection and quantitation limits were estimated by analyzing blank samples over 5 nonconsecutive days and calculating 3X and 10X the standard deviation (σ) of the analyte responses for detection (LOD) and quantitation limits (LOQ), respectively. Arsenic speciation was performed using an Agilent 1260 liquid chromatography system connected in line with the ICP-MS/MS, as adapted from a published method.10 Separation of As species was achieved using an isocratic elution on a Hamilton PRP-X100 4.1×250 mm anion exchange column (Reno, NV) with mobile phase as 10 mM ammonium phosphate dibasic (pH = 8.25) with 3% methanol.
Data processing and statistical analysis.
Data processing was conducted using MassHunter Workstation software version 4.2 (Agilent Technologies) with results exported as Excel worksheets (Microsoft Office, Microsoft Co., Redmond, WA). All filtration trials/conditions were repeated three times, and data are presented as mean ± standard deviation. Statistical analysis was performed using JMP 11 (SAS Institute, Cary, NC). One-way ANOVA was used followed by Tukey-Kramer pairwise mean comparisons to determine significant differences (p < 0.05) between treatments. Recovery of heavy metals in spiked samples and DE extraction efficiency was calculated as measured value/theoretical value*100%, and % coefficient of variation (CV) was calculated as standard deviation/mean*100%.
RESULTS
DE heavy metal content.
Table 1 shows the soluble iAs, Pb, and Cd content of the three DE samples as analyzed by ICP-MS/MS and the physical characteristics of each DE product. Representative samples of DE were analyzed using LC-ICP-MS/MS and were found to contain all As in the form of As(V). However, we report this as iAs since interconversion of As(V) and As(III) can occur during sample preparation.10 Extraction efficiencies of Pb and Cd by DE reference material were determined to be 112 ± 3% for Pb and 108 ± 3% for Cd. However, there was no available certified value for As in the DE reference material to evaluate its extraction efficiency. DE-1 contained the highest level of soluble iAs (5.4 ± 0.1 mg/kg). Cd and Pb concentrations in all DE types were in the ppb range, with DE-1 containing Cd concentrations under the method LOD. Although all DE types were of the same median particle size, DE-2 was twice as permeable than the other samples.
Table 1.
Diatomaceous earth (DE) filter aid heavy metal content and physical characteristics.a
| Sample Code | iAs (mg/kg) | Cd (mg/kg) | Pb (mg/kg) | Median Particle Size (μm)b | Permeability (Darcy)b |
|---|---|---|---|---|---|
| DE-1 | 5.4 ± 0.1 | ND | 0.1 ± 0.01 | 20.9 | 0.25 |
| DE-2 | 2.6 ± 0.2 | 0.02 ± 0.001 | 0.2 ± 0.02 | 20.9 | 0.5 |
| DE-3 | 2.1 ± 0.1 | 0.03 ± 0.001 | 0.1 ± 0.003 | 20.9 | 0.25 |
Values are displayed as average ± SD (n = 3). Cadmium is reported for isotope 111. Lead is the summation of isotopes 206, 207, and 208. ND, not detectable.
Values obtained from supplier.
ICP-MS/MS method precision, accuracy and detection limits.
All analytes exhibited highly linear responses (R2 > 0.9999; Table S1). Recovery of total As in beer matrix ranged from 90–101%, 94–97% for Cd, and 96–97% for Pb. Recovery in wine ranged from 96–103% for total As, 89–93% for Cd, and 87–91% for Pb. Precision as determined by % CV for all sample types was ≤ 5%. 3σ LOD was estimated to be 0.01, 0.002, and 0.02 μg/L for total As, Pb, and Cd, respectively, while 10σ LOQ was estimated to be 0.04, 0.01, and 0.05 μg/L for total As, Pb, and Cd, respectively.
Filtration timecourse experiments.
Figure 1 shows iAs transfer to unfiltered test beverages over time using three different types of DE filter aids, while Table 2 shows the pH and percent total suspended solids of the four test beverages. Overall, iAs concentrations increased in almost all beverages immediately after filtration, with test beverages filtered using DE-1 and DE-3 showing significant (p < 0.05) increases starting at the 1 min time point that persisted over the 8 min filtration time. The largest increases in beer iAs concentrations were from use of DE-1 for filtration, which resulted in a 4.5-fold increase in iAs concentration for lager and a 3.9-fold increase for ale at the final timepoint (p < 0.05; compared to unfiltered control sample). However, there was no increase in iAs concentrations with lager filtered using DE-2. Both red and white wine test beverages had significant (p < 0.05) increases in iAs concentrations after filtration using all DE types at every timepoint. Similar to beer, the largest iAs concentration increases were in wine filtered using DE-1, where iAs concentrations increased 7.9-fold for red and 3.7-fold for white at the final 8 min timepoint compared to the unfiltered sample. Cd and Pb concentrations did not change significantly as a function of filtration time (data not shown).
Figure 1.
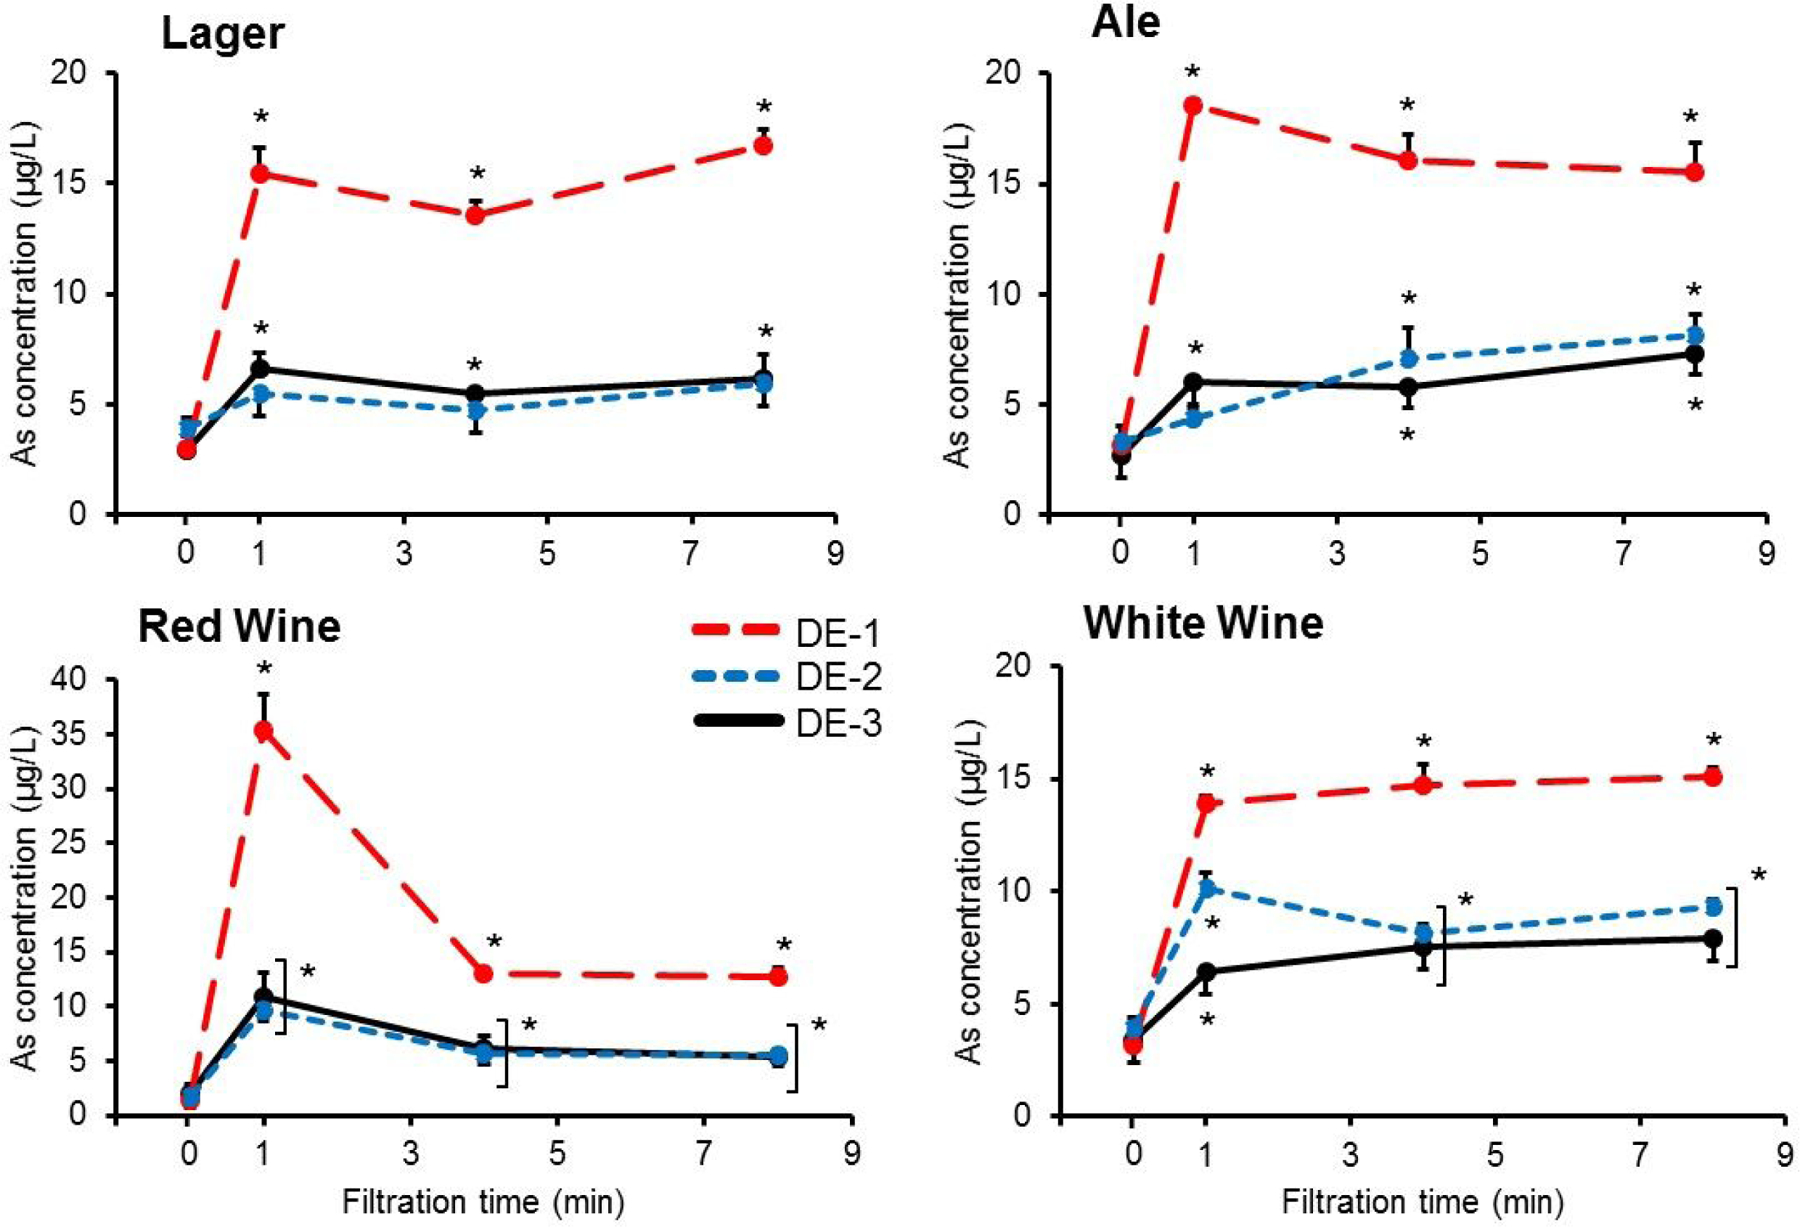
Inorganic arsenic (iAs) transfer to test beverages during laboratory-scale filtration using diatomaceous earth (DE) filter aid. Chemical and physical characterization of the three types of DE are shown in Table 1. Unfiltered beverage slurry (ale, lager, white wine, or red wine) containing 2 g/L bodyfeed DE was introduced into the filter system and sample filtrate was directly collected at 1, 4, and 8 min. Values are shown as mean ± SD (n = 3). *p<0.05 compared to 0 min (unfiltered beverage) within DE type.
Table 2.
Unfiltered test beverage pH and suspended solids content.
| Unfiltered Test Beverage | pH | % Total Suspended Solids |
|---|---|---|
| Lager | 4.9 | 0.19 |
| Ale | 5.0 | 0.38 |
| White wine | 2.9 | 0.05 |
| Red wine | 3.7 | 0.02 |
Effect of DE bodyfeed amount on beverage heavy metal concentrations.
Figure 2 shows the relationship between amount of DE bodyfeed and iAs concentrations in filtered test beverages. Overall, one-way ANOVA showed a significant (p < 0.05) effect of amount of bodyfeed DE (0, 1, 3, and 5 g/L) and iAs concentrations in filtrate of every test beverage, regardless of DE type. Post-hoc mean comparisons of data revealed an overall dose-response relationship between DE amount and beer iAs concentrations. However, lager filtered with DE-2 showed no significant increase in iAs concentrations within the range of filter aid used (1–5 g/L). In contrast to iAs, Cd and Pb concentrations in filtered beverages were not affected by the amount of DE used in filtration (data not shown).
Figure 2.
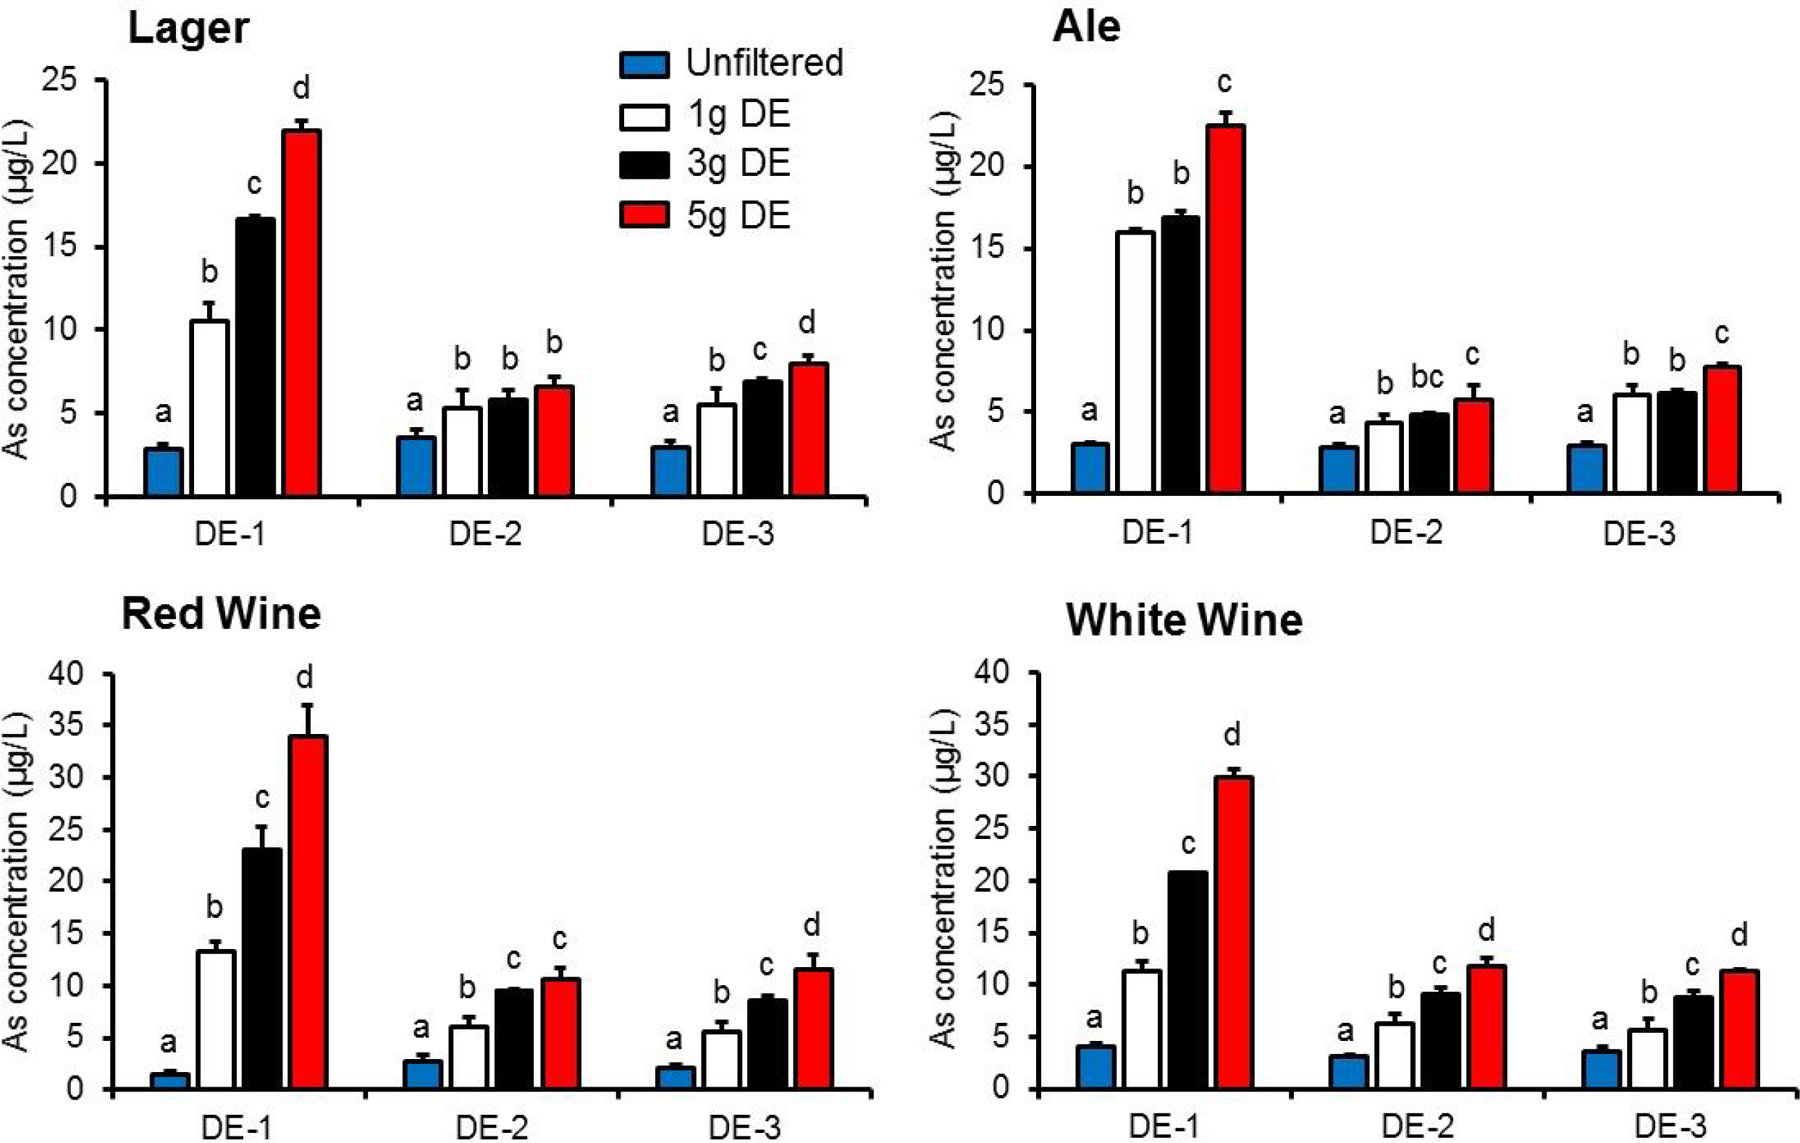
Effect of amount of diatomaceous earth (DE) filter aid on inorganic arsenic (iAs) transfer to test beverages during laboratory-scale filtration. Chemical and physical characterization of the three types of DE are shown in Table 1. Unfiltered beverage slurry (ale, lager, white wine, or red wine) containing 1, 3, or 5 g/L bodyfeed DE was introduced into the filter system and sample filtrate was collected over 8 min. Values are shown as mean ± SD (n = 3). Different letters indicate statistically significant difference (p<0.05) within DE type.
Effect of pH on heavy metal transfer.
Figure 3 shows the effect of test beverage pH on iAs transfer from DE-1. At the 1 min timepoint, acidifying lager (native pH 4.9) resulted in significant (p < 0.05) increases in iAs concentrations of 30 ± 5% at pH 4.0 and 32 ± 13% at pH 3.0. In contrast, altering the pH of the ale from pH 5.0 to either 4.0 or 3.0 did not affect iAs transfer at the 1 min timepoint. Adjusting red wine pH from 3.7 to 4.0 and 5.0 resulted in iAs transfer decrease of 19 ± 5% and 56 ± 7%, respectively, at the 1 min timepoint. However, there was no significant difference in iAs transfer at timepoints 4 and 8 min. Interestingly, iAs transfer significantly (p < 0.05) increased 23 ± 6% at the 1 min when white wine pH was adjusted to 5.0, although there was a subsequent significant decrease of 9.5 ± 4% at the final 8 min timepoint.
Figure 3.
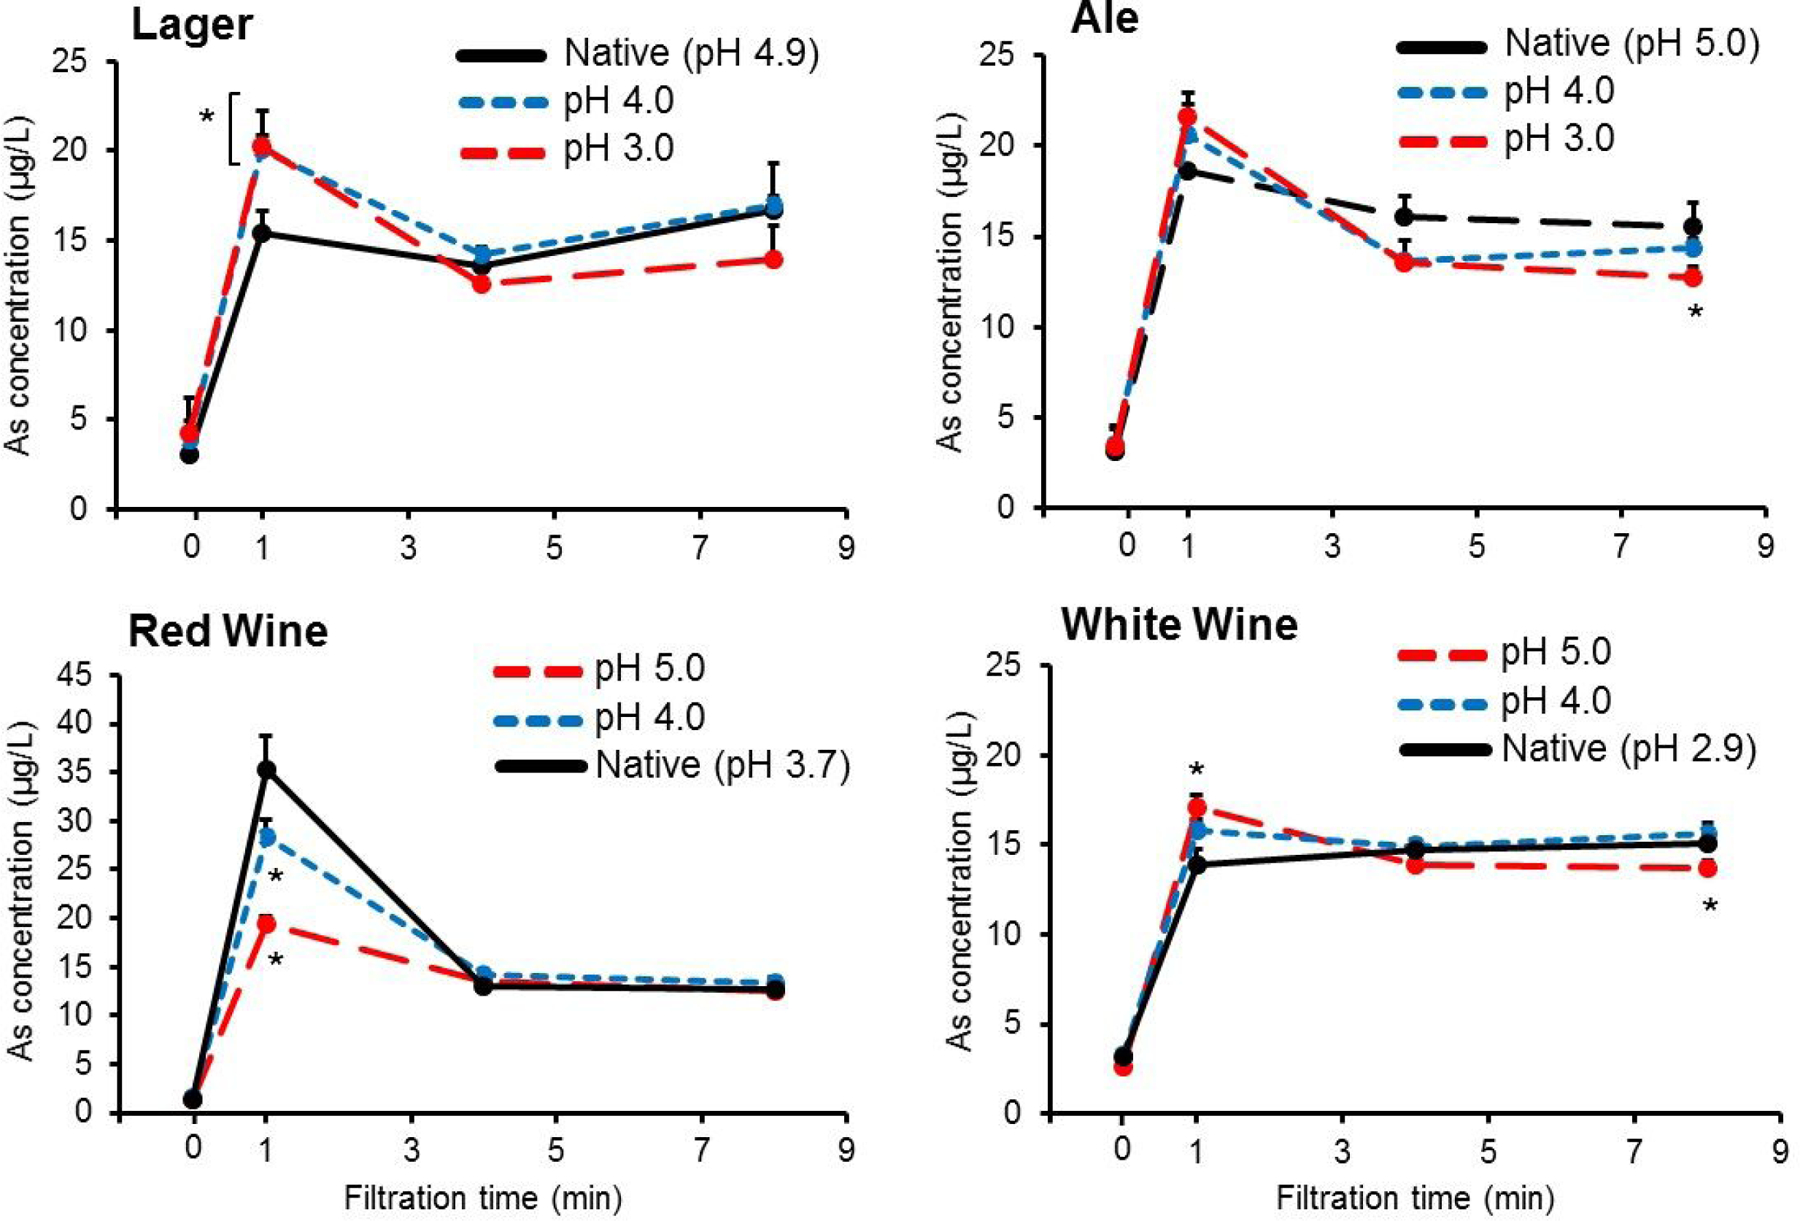
Effect of beverage pH on inorganic arsenic (iAs) transfer to test beverages during laboratory-scale filtration using diatomaceous earth (DE) filter aid. DE-1 was used across experiments. Chemical and physical characterization of DE-1 is shown in Table 1. Unfiltered beverage slurry (ale, lager, white wine, or red wine) containing 2 g/L bodyfeed DE-1 was introduced into the filter system and sample filtrate was directly collected at 1, 4, and 8 min timepoints. Beverage pH was adjusted using either 1 M NaOH or HCl. Values are shown as mean ± SD (n = 3). *p<0.05 compared to native beverage pH timepoint.
Transfer of metals in filter precoat beverage slurry.
Table 3 shows increases in iAs and Pb levels in wine and beer after mixing beverages for 1 min, 60 min, and 120 min with DE-1 (DE:beverage, 10:90) in the form of a filter precoat beverage slurry. Concentrations of iAs in beer increased by approximately 200-fold after 120 min of mixing in both lager and ale-style beer. Pairwise mean comparisons of data showed a subsequent significant (p < 0.05) increase in iAs concentrations in beer (i.e., lager and ale) when the beer/DE slurry was mixed for 1 min vs. 60 min. Concentrations of iAs increased by approximately 430-fold in red wine and 210-fold in white wine after 120 min of mixing. Pb concentrations in lager and ale increased significantly (p < 0.05) by approximately 2-fold after 120 min of mixing. In the case of wine, Pb concentrations increased significantly (p < 0.05) by approximately 9-fold in red and 14-fold in white after 120 min of mixing. No significant differences in Cd concentrations were observed. Mass balance calculations indicated that approximately 90% iAs from DE transferred to wine after mixing for 2 h, while 70% transferred to beer. Calculations for Pb transfer from DE were estimated to be 90% for wine and 105% for beer after 2 h.
Table 3.
Transfer of arsenic (As) and lead (Pb) to test beverages occurring during mixing of test beverage with diatomaceous earth (DE) filter aid.a
| Mixing Time (min) | ||||||||
|---|---|---|---|---|---|---|---|---|
| Test Beverage | 0 | 1 | 60 | 120 | 0 | 1 | 60 | 120 |
| As (μg/L) | Pb (μg/L) | |||||||
| Lager | 2.8 ± 0.1 a | 380 ± 20 b | 528 ± 18 c | 559 ± 15 c | 1.1 ± 0.1 a | 2.8 ± 0.2 b | 1.8 ± 1.0 ab | 2.8 ± 0.8 b |
| Ale | 2.9 ± 0.2 a | 375 ± 15 b | 524 ± 17 c | 548 ± 17 c | 1.4 ± 0.0 a | 1.8 ± 0.1 ab | 1.9 ± 0.2 ab | 2.4 ± 0.4 b |
| Red Wine | 1.5 ± 0.1 a | 592 ± 35 b | 627 ± 6 b | 631 ± 25 b | 2.3 ± 0.1 a | 6.1 ± 0.9 b | 10.5 ± 1.1 c | 11.1 ± 0.6 c |
| White Wine | 3.0 ± 0.0 a | 643 ± 17 b | 652 ± 29 b | 644 ± 20. b | 4.8 ± 0.0 a | 10.2 ± 0.7 b | 17.3 ± 1.1 c | 18.8 ± 1.3 c |
A 10% w/w slurry of DE-1 and test beverage (ale, lager, white wine, or red wine) was continuously mixed and liquid fraction was sampled at 1 min, 60 min, and 120 min. Values are shown as mean ± SD (n = 3). Different letters within a row within analyte indicate a significant difference between mixing time (p<0.05).
Pre-washing of filter aid.
Figure 4 shows the effect of 1 min washing treatments on iAs and Pb concentrations in DE-1. Interestingly, a water wash alone significantly (p < 0.05) decreased the iAs concentration in DE-1 by 61 ± 3%, while treatment with citric acid solution (pH = 2.7) and EDTA solution (pH = 8.0) resulted in reductions of 94 ± 1% and 87 ± 3%, respectively. Only EDTA wash resulted in a significant reduction in Pb concentrations (50 ± 6%; p < 0.05) in the DE-1 filter aid. No significant effect of washing was observed on Cd concentrations in this filter aid.
Figure 4.
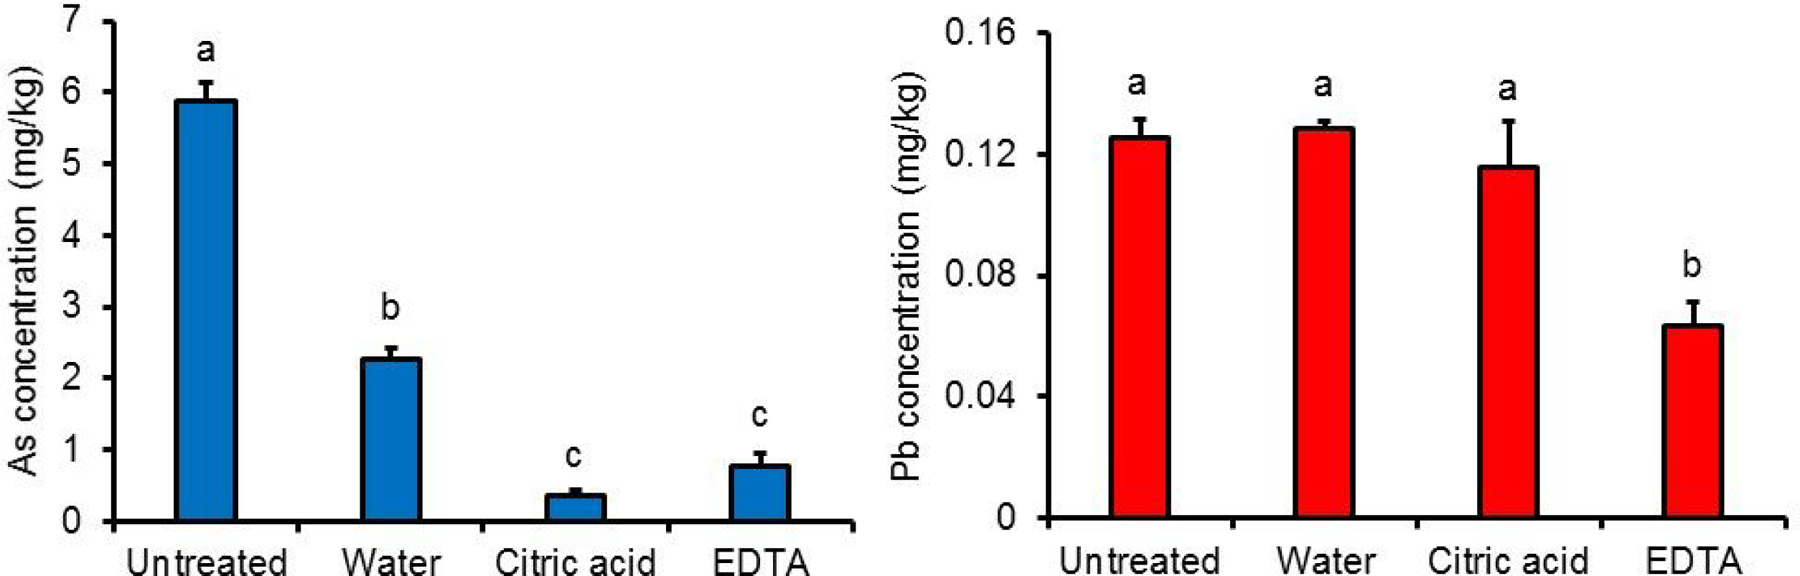
Effect of washing treatments on inorganic arsenic (iAs) and Lead (Pb) concentrations in diatomaceous earth (DE-1) filter aid. Values are shown as mean ± SD (n = 3). Different letters indicate statistically significant difference (p<0.05).
Heavy metal analysis of commercial beer and wine.
Table 4 and Table 5 display total As, Pb and Cd concentrations in commercial beer and wine products. Levels of total As in beer ranged from 0.50 μg/L (B-12) to 5.5 μg/L (B-13), with an overall mean of 2.3 ± 1.5 μg/L. The majority of samples contained no quantifiable Cd and Pb. Concentrations of total As in wine ranged from 1.8 μg/L (W-12) to 18.0 μg/L (W-4), with an overall mean of 5.5 ± 3.6 μg/L. Overall mean Pb levels in wine was 8.8 ± 6.6 μg/L. Levels of Pb ranged from a low of 0.3 μg/L (W-18) to 23.4 μg/L (W-14). Cd concentrations in wine were low, with all but two samples containing less than 0.5 μg/L. There was no significant effect of wine type or country of origin on heavy metal concentrations, though this may be due to the limited sample size of this survey.
Table 4.
Analysis of total arsenic (As), lead (Pb), and cadmium (Cd) in samples of commercial lager and ale-style beer.a
| Beer Style | Country of Origin | Sample Code | pH | Total As (μg/L) | Cd (μg/L) | Pb (μg/L) |
|---|---|---|---|---|---|---|
| Lager | Barbados | B-3 | 4.2 | 3.4 ± 0.07 | 0.14 ± 0.002 | 2.9 ± 0.06 |
| Lager | Germany | B-4 | 4.3 | 1.9 ± 0.33 | ND | 0.90 ± 0.17 |
| Lager | Holland | B-5 | 4.4 | 2.1 ± 0.08 | ND | ND |
| Lager | USA | B-12 | 4.2 | 0.50 ± 0.03 | ND | ND |
| Lager | Germany | B-13 | 4.3 | 5.5 ± 0.13 | ND | trace |
| Lager | Czech Republic | B-14 | 4.4 | 2.9 ± 0.10 | ND | ND |
| Lager | USA | B-15 | 4.3 | 1.3 ± 0.07 | ND | trace |
| Lager | Ireland | B-16 | 4.6 | 1.1 ± 0.05 | ND | trace |
| Lager | Jamaica | B-18 | 4.1 | 1.7 ± 0.07 | ND | trace |
| Lager | USA | B-19 | 4.5 | 4.7 ± 0.02 | ND | trace |
| Ale | USA | B-1 | 4.9 | 4.5 ± 0.04 | trace | ND |
| Ale | USA | B-2 | 4.1 | 0.76 ± 0.06 | ND | ND |
| Ale | Scotland | B-6 | 4.1 | 3.8 ± 0.08 | trace | trace |
| Ale | Scotland | B-7 | 4.1 | 0.96 ± 0.07 | ND | trace |
| Ale | United Kingdom | B-8 | 4.1 | 0.61 ± 0.03 | ND | trace |
| Ale | Belgium | B-9 | 4.2 | 3.7 ± 0.07 | ND | trace |
| Ale | Australia | B-10 | 4.4 | 2.1 ± 0.04 | ND | ND |
| Ale | USA | B-11 | 4.4 | 0.78 ± 0.03 | ND | ND |
| Ale | USA | B-17 | 4.3 | 1.3 ± 0.03 | ND | trace |
| Ale | USA | B-20 | 4.6 | 2.2 ± 0.07 | ND | trace |
Values are shown as mean ± SD (n = 3). Cd is reported for isotope 111. Pb is the summation of isotopes 206, 207, and 208. Trace is defined as concentrations above the LOD but above the LOQ. Abbreviations: ND, not detectable.
Table 5.
Analysis of total arsenic (As), lead (Pb), and cadmium (Cd) in sample of commercial red and white wine.a
| Wine Type | Country of Origin | Sample Code | pH | Total As (μg/L) | Cd (μg/L) | Pb (μg/L) |
|---|---|---|---|---|---|---|
| Red | USA | W-2 | 3.7 | 4.1 ± 0.5 | 0.12 ± 0.004 | 1.9 ± 0.1 |
| Red | USA | W-6 | 3.4 | 5.4 ± 0.6 | 0.74 ± 0.02 | 2.5 ± 0.1 |
| Red | Argentina | W-8 | 3.7 | 6.9 ± 0.2 | 0.14 ± 0.01 | 8.1 ± 0.1 |
| Red | Spain | W-9 | 3.5 | 3.2 ± 0.1 | trace | 7.2 ± 0.9 |
| Red | Italy | W-10 | 3.6 | 2.6 ± 0.3 | 0.12 ± 0.01 | 5.0 ± 0.1 |
| Red | South Africa | W-12 | 3.5 | 1.8 ± 0.1 | 0.13 ± 0.01 | 21.0 ± 0.5 |
| Red | USA | W-13 | 3.7 | 7.7 ± 0.7 | 0.26 ± 0.02 | 4.4 ± 0.2 |
| Red | USA | W-15 | 3.7 | 6.0 ± 0.5 | 0.21 ± 0.01 | 8.3 ± 0.3 |
| Red | USA | W-16 | 3.7 | 4.2 ± 0.5 | 0.28 ± 0.03 | 8.7 ± 0.4 |
| Red | Australia | W-18 | 3.5 | 2.6 ± 0.4 | 0.24 ± 0.01 | 0.30 ± 0.05 |
| Red | Germany | W-19 | 3.2 | 3.5 ± 0.2 | 0.27 ± 0.03 | 19.8 ± 0.8 |
| White | Argentina | W-1 | 3.0 | 6.9 ± 0.6 | 0.22 ± 0.01 | 7.3 ± 0.3 |
| White | South Africa | W-3 | 3.4 | 4.9 ± 0.4 | 0.15 ± 0.01 | 12.2 ± 0.6 |
| White | USA | W-4 | 3.6 | 18.0 ± 0.1 | 1.1 ± 0.02 | 14.6 ± 0.2 |
| White | USA | W-5 | 2.9 | 5.0 ± 0.5 | 0.17 ± 0.01 | 11.8 ± 0.6 |
| White | USA | W-7 | 3.1 | 3.9 ± 0.5 | 0.16 ± 0.01 | 1.4 ± 0.04 |
| White | USA | W-11 | 3.3 | 11.1 ± 1.1 | 0.36 ± 0.01 | 5.3 ± 0.2 |
| White | France | W-14 | 3.3 | 5.1 ± 0.4 | 0.48 ± 0.03 | 23.4 ± 0.4 |
| White | USA | W-17 | 3.0 | 3.3 ± 0.5 | 0.27 ± 0.002 | 3.0 ± 0.8 |
| White | Italy | W-20 | 3.5 | 3.8 ± 0.1 | 0.17 ± 0.01 | 9.8 ± 0.7 |
Values are shown as mean ± SD (n = 3). Cd is reported for isotope 111. Pb is the summation of isotopes 206, 207, and 208. Trace is defined as concentrations above the LOD but above the LOQ.
DISCUSSION
Due to the health effects of chronic dietary consumption of heavy metals, knowledge of potential contamination routes in the food supply continues to be of interest to government regulatory bodies such as the FDA.31 While the heavy metal content of alcoholic beverages has been previously studied,12–17 there is a general lack of information on processing steps that contribute to heavy metals in these types of products.17, 32 As such, detailed information on the mechanisms by which these toxic metals enter the food supply is needed to establish intervention measures to reduce the introduction of heavy metals into foods and beverages during manufacture.
The present experiments were done in response to results of other studies that found DE can contribute to elevated heavy metal levels in filtered beverages, such as beer and fruit juices.9, 24 Our data support these findings and demonstrate that filtration time and amount of DE filter aid affect iAs transfer to alcoholic beverages. The timecourse data generally showed an initial increase in iAs concentrations at the initial 1 min timepoint followed by a decrease or a plateau that persisted over the filtration time. These two general phases in the timecourse experiment may be reflective of heavy metals leaching first from the initial precoat that is established on the mesh support before filtration begins and then continues from the bodyfeed filter aid that is incorporated directly into the beverage. Data from our experiments adjusting DE amount (Figure 2) further support the notion of beverage iAs concentrations being a function of filter aid bodyfeed. In fact, analysis of the data indicates significant differences in iAs concentrations that relate to amount of DE used (1–5 g/L). These results correspond to other reports showing that quantity of DE used in filtration affects the amount of iAs transferred to simulated juices.24
Although the present analysis only directly considered changes in total As with filtration, analysis of the DE filter aid showed that As transferred from DE was the As(V) species. Therefore, the As transferred to wine and beer during filtration is in the form of iAs. It is not surprising that Cd and Pb concentrations in wine and beer were not a function of amount of DE used in filtration, since levels of these metals in DE were more than an order of magnitude lower than iAs (Table 1). Quantitative assessment indicates that the filtrate heavy metal values would theoretically increase by 1–2 μg/L, assuming all metals were transferred from DE. Together, these experiments indicate that elemental composition of the precoat and bodyfeed filter aid can be important contributors to heavy metal content of beverage filtrate.
It is interesting to note that although the initial concentration of heavy metals in the DE was somewhat predictive of transfer to the beverage, this was not always consistent across all beverages. For example, use of DE-2 for lager filtration did not significantly increase iAs concentration at any timepoint within the timecourse experiment. Though there was no difference in particle size between the three types of DE, the permeability of DE-2 was two times higher than the other filter aids, suggesting that permeability may be an important factor to be taken into consideration when estimating iAs transfer. However, it difficult to make such a claim about permeability with the limited types of DE filter aid used in this study.
Our data from the DE/beverage slurry filter precoat experiments (Table 3) indicate that iAs from DE solubilizes quickly, with a high percentage of this heavy metal being solubilized within only 1 min of mixing. This reflects previous literature on iAs dissolution, which reports increased solubility in the pH range of the test beverages (pH < 5).33 Pb from DE was also found to transfer to beverages during this experiment. Although Pb in the filtered beverage was still at low levels (2–4 μg/L), these data support a previous study that showed filter aid containing Pb can transfer to the filtered juices.24 The 10% slurry has a relatively higher amount of DE compared to the other experiments, but this is reflective of levels used by industry in a mixtank for fermented alcoholic beverages.20
Adjusting the pH of wine and beer overall only modestly affected heavy metal transfer from filter aids. Red wine filtration was most impacted by pH adjustment, with iAs concentrations decreasing by approximately 50% at the 1 min timepoint when pH was adjusted from 3.7 (native pH) to 5.0. Wang et al. reported a limited effect of simulated juice pH on iAs transfer from filter aids, but this may be reflective of the narrow pH range used in the experiments (pH 3–4).24 Research suggests that pH-sensitive phenolic compounds from grape interact with iAs species, which may explain, in part, the difference in iAs transfer to red wine, which can contain higher concentrations of these compounds compared to white wine.34–36 Still, these changes in iAs transfer with pH were only markedly different at 1 min, indicating that there may be an equilibration process occurring that moderates these differences at the later time points.
Remediation methods to reduce heavy metal content of DE by washing with water, citric acid solution, or EDTA solution significantly reduced iAs concentrations, with citric acid and EDTA being the most effective wash treatments (Figure 4). Use of these treatments were selected based on previous work indicating that EDTA and citric acid have the ability to chelate and solubilize heavy metals, possibly due to the presence of their carboxylic acid functional groups chelating cations.37–40 Further, Van et al. reported that organic acids are able to solubilize As(III) and As (V) in As-containing Fe oxides by chelating Fe3+ counter-ions.41 Still, simply washing DE with water alone significantly reduced iAs concentrations. The washing treatment data indicate that a large fraction of the iAs in DE is highly soluble and thus can be removed from this filter aid by even a relatively short washing step. These results correspond to other literature suggesting that iAs can even be soluble in food systems, for example, where iAs in rice has been shown to leach into cooking water when enough excess liquid is used.42,43 Pb concentrations in DE were not as greatly affected by wash treatments, though it is important to note that original Pb concentrations in DE were in the ppb range.
Analyses of beer and wine market samples indicated a large range of heavy metal concentrations in these types of beverages. These data were used to determine how the concentrations of heavy metals found in commercial beer and wine products compare to levels found in the experimentally filtered test beverages. However, the nature of the processing steps used in production of the commercial samples, including the type and quantity of filter aids, are not known.
All commercial beer samples contained total As concentrations below the proposed 10 μg/kg iAs (≈10 μg/L) action limit for apple juice. This suggests if DE were used as a filter aid for the selected market samples, it would likely have heavy metal content comparable to DE-2 or DE-3. However, as noted, selection of DE/filter aid for processing is dependent on multiple factors, including the required processing throughput and desired characteristics of the final product. The total As levels measured in commercial beer were slightly lower than an 2013 FDA analysis of 65 styles of beer that reported a range of approximately 1–26 μg/L iAs with a mean of 5.8 μg/L iAs.16 Although heavy metal levels in surveyed beer and wine samples have a large range of values, the results are consistent with other research indicating that differences in packaging, processing, and elemental composition of soils where raw input products are grown can all affect heavy metal concentrations in the final product.11, 16, 28, 32 Though the majority of wine samples in our analysis were under the proposed 10 μg/L iAs apple juice limit, two samples contained total As above this threshold (W-4, 18.0 μg/L; W-14, 11.1 μg/L). These data are comparable to a 2016 analysis by Monnot et al. conducted on red and white wines that found a mean of 6.1 μg/L iAs in red (n = 46) and 9.5 μg/L iAs in white wines (n = 48).12 Wine samples analyzed by Monnot et al. ranged from a low approximately 1 μg/L to a high of μg/L ppb iAs, demonstrating a wide range of As concentrations present in wine. Our wine sample analysis for Pb showed concentrations ranging from under 1 μg/L to approximately 23 μg/L, slightly lower than results from an analysis of 472 domestic and international wines reporting a mean of approximately 30 μg/L Pb (ranging from under 1 μg/L to 75 μg/L Pb).18 Regardless of these values, permissible levels of heavy metal concentration in beer and wine in the U.S. have not been determined at this time. Still, metal limits have been suggested by other entities, such as the International Organization of Vine and Wine.44
Although laboratory-scale experiments such as the present work have been shown to correlate to industrial-scale production,24 the ultimate extension of this study would be to replicate these experiments on a larger scale to confirm the results. Additional research should also include the influence of temperature changes during processing on specific As species. This is important to consider since high heat levels have potential to convert less toxic organic As species into the more toxic inorganic form.45
The current study provides data showing that there are various factors that affect transfer of heavy metals from filter aids to alcoholic beverages. These factors should be considered in designing beverage filtration measures to mitigate heavy metal contamination. Specifically, heavy metal concentrations of DE filter aid and the quantity used affect final concentrations of iAs in the filtered beverage. However, selection of filter aid varieties with lower concentrations of DE, or pre-washing the filter aids appear to have a significant effect on mitigating heavy metal concentrations in the final product.
Supplementary Material
ACKNOWLEDGEMENTS
The authors would like to thank Nicholas Smith and the Fermentation Sciences Lab at the University of Wisconsin-Madison for their assistance brewing the ale and lager-style beer used in the filtration experiments. In addition, we would like to thank EP Minerals and Imerys for providing knowledge about commercial use of filter aids and for guidance on setup of bench filtration system. This article has been reviewed in accordance with the Tax and Trade Bureau’s peer and administrative review policies and approved for publication. The statements made in this report do not represent the official position of the Tax and Trade Bureau and do not constitute a recommendation or endorsement of the findings.
ABBREVIATIONS USED:
- DE
Diatomaceous earth
- ICP-MS
inductively coupled plasma-mass spectrometry
- EDTA
ethylenediaminetetraacetic acid
- LOD
limit of detection
- LOQ
limit of quantitation
Footnotes
Supporting Information Available: Table S1. ICP-MS calibration curve data.
REFERENCES
- 1.Hettick BE; Cañas-Carrell JE; French AD; Klein DM, Arsenic: A review of the element’s toxicity, plant interactions, and potential methods of remediation. J. Agric. Food Chem 2015, 63, 7097–7107. [DOI] [PubMed] [Google Scholar]
- 2.Satarug S; Vesey DA; Gobe GC, Current health risk assessment practice for dietary cadmium: Data from different countries. Food Chem. Toxicol 2017, 106, 430–445. [DOI] [PubMed] [Google Scholar]
- 3.Mitra P; Sharma S; Purohit P; Sharma P, Clinical and molecular aspects of lead toxicity: An update. Crit. Rev. Clin. Lab. Sci 2017, 54, 506–528. [DOI] [PubMed] [Google Scholar]
- 4.Lewchalermvong K; Rangkadilok N; Nookabkaew S; Suriyo T; Satayavivad J, Arsenic speciation and accumulation in selected organs after oral administration of rice extracts in Wistar rats. J. Agric. Food Chem 2018, 66, 3199–3209. [DOI] [PubMed] [Google Scholar]
- 5.U.S. Food and Drug Administration, Total diet study elements results summary statistics: Market baskets 2006 through 2013. https://www.fda.gov/downloads/food…totaldietstudy/ucm184301.pdf (8 August 2018).
- 6.Posnick LM; Kim H, Bottled water regulation and the FDA. Food Safety Magazine 2002. [Google Scholar]
- 7.U.S. Food and Drug Administration, Arsenic in apple juice: Action level draft guidance for industry. 2013.
- 8.Health Canada, Health Canada’s Proposal to Update the Maximum Levels for Arsenic in Apple Juice and Water in Sealed Containers in the List of Contaminants and Other Adulterating Substances in Foods. https://www.canada.ca/content/dam/hc-sc/migration/hc-sc/fn-an/alt_formats/pdf/consult/nop-avp-c-2017-1/nop-avp-c-2017-1-eng.pdf (21 December 2018). [Google Scholar]
- 9.Coelhan M, Release of arsenic from kieselguhr used as filtration aid in the food industry. In One Century of the Discovery of Arsenicosis in Latin America (1914–2014), Litter MI; Nicolli HB; Meichtry M; Quici N; Bundschuh J; Bhattacharya P; Naidu R, Eds. Taylor & Francis Group: London, 2014; pp 474–475. [Google Scholar]
- 10.Gray PJ; Tanabe CK; Ebeler SE; Nelson J, A fast and fit-for-purpose arsenic speciation method for wine and rice. J. Anal. At. Spectrom 2017, 32, 1031–1034. [Google Scholar]
- 11.Tanabe CK; Hopfer H; Ebeler SE; Nelson J; Conklin SD; Kubachka KM; Wilson RA, Matrix extension and multilaboratory validation of arsenic speciation method EAM §4.10 to include wine. J. Agric. Food. Chem 2017, 65, 4193–4199. [DOI] [PubMed] [Google Scholar]
- 12.Monnot AD; Tvermoes BE; Gerads R; Gürleyük H; Paustenbach DJ, Risks associated with arsenic exposure resulting from the consumption of California wines sold in the United States. Food Chem. 2016, 211, 107–113. [DOI] [PubMed] [Google Scholar]
- 13.Wilson D, Arsenic content in American wine. J. Environ. Health 2015, 78, 16–22. [PubMed] [Google Scholar]
- 14.Mena C; Cabrera C; Lorenzo M; Lopez M, Cadmium levels in wine, beer and other alcoholic beverages: Possible sources of contamination. Sci. Total Environ 1996, 181, 201–208. [DOI] [PubMed] [Google Scholar]
- 15.Donadini G; Spalla S; Beone G, Arsenic, cadmium and lead in beers from the Italian market. J. Inst. Brew 2008, 114, 283–288. [Google Scholar]
- 16.U.S. Food and Drug Administration, Analytical results from inorganic arsenic in rice and rice products sampling September 2013. https://www.fda.gov/downloads/food/foodborneillnesscontaminants/metals/ucm352467.pdf (24 September 2018).
- 17.Passaghe P; Bertoli S; Tubaro F; Buiatti S, Monitoring of some selected heavy metals throughout the brewing process of craft beers by inductively coupled plasma mass spectrometry. Eur. Food Res. Technol 2015, 241, 199–215. [Google Scholar]
- 18.Towle KM; Garnick LC; Monnot AD, A human health risk assessment of lead (Pb) ingestion among adult wine consumers. Int. J. Food Contam 2017, 4, 7. [Google Scholar]
- 19.Stockley CS; Smith LH; Tiller KG; Gulson BL; Osborn CDA; Lee TH, Lead in wine: A case study on two varieties at two wineries in South Australia. Austral. J. Grape Wine Res 2003, 9, 47–55. [Google Scholar]
- 20.Lea AG; Piggott JR, Fermented beverage production. Springer Science & Business Media: Berlin, 2012. [Google Scholar]
- 21.Waterhouse AL; Sacks GL; Jeffery DW, Understanding wine chemistry. Wiley: Chichester, 2016. [Google Scholar]
- 22.Committee on Codex Specifications, Diatomaceous earth. In Food Chemicals Codex, 10th ed.; U.S. Pharmacopeial Convention, 2016; 410. [Google Scholar]
- 23.Reed R, Centenary review article beer filtration. J. Inst. Brew 1986, 92, 413–419. [Google Scholar]
- 24.Wang Z; Jackson LS; Jablonski JE, Factors affecting the levels of heavy metals in juices processed with filter aids. J. Food Prot 2017, 80, 892–902. [DOI] [PubMed] [Google Scholar]
- 25.Marın A; Lopez-Gonzalvez A; Barbas C, Development and validation of extraction methods for determination of zinc and arsenic speciation in soils using focused ultrasound: Application to heavy metal study in mud and soils. Anal. Chim. Acta 2001, 442, 305–318. [Google Scholar]
- 26.Ribéreau-Gayon P; Glories Y; Maujean A; Dubourdieu D, Handbook of Enology: The chemistry of wine stabilization and treatment. 2 ed.; John Wiley, Chichester: 2006; Vol. 2. [Google Scholar]
- 27.Fontoin H; Saucier C; Teissedre P-L; Glories Y, Effect of pH, ethanol and acidity on astringency and bitterness of grape seed tannin oligomers in model wine solution. Food Qual. Prefer 2008, 19, 286–291. [Google Scholar]
- 28.Hopfer H; Nelson J; Mitchell AE; Heymann H; Ebeler SE, Profiling the trace metal composition of wine as a function of storage temperature and packaging type. J. Anal. At. Spectrom 2013, 28, 1288–1291. [Google Scholar]
- 29.Uggerud HT; Lund W, Modifier effects from palladium and iridium in the determination of arsenic and antimony using electrothermal vaporisation inductively coupled plasma mass spectrometry. Spectrochim. Acta Part B At Spectrosc 1999, 54, 1625–1636. [Google Scholar]
- 30.Larsen EH; Stürup S, Carbon-enhanced inductively coupled plasma mass spectrometric detection of arsenic and selenium and its application to arsenic speciation. Journal of Analytical Atomic Spectrometry 1994, 9, 1099–1105. [Google Scholar]
- 31.U.S. Food and Drug Administration, Metals. https://www.fda.gov/Food/FoodborneIllnessContaminants/Metals/default.htm (11 November 2018).
- 32.Hopfer H; Nelson J; Collins TS; Heymann H; Ebeler SE, The combined impact of vineyard origin and processing winery on the elemental profile of red wines. Food Chem. 2015, 172, 486–496. [DOI] [PubMed] [Google Scholar]
- 33.Moldovan BJ; Hendry MJ, Characterizing and quantifying controls on arsenic solubility over a pH range of 1− 11 in a uranium mill-scale experiment. Environ. Sci. Technol 2005, 39, 4913–4920. [DOI] [PubMed] [Google Scholar]
- 34.Clemente M; Devesa V; Vélez D, In vitro reduction of arsenic bioavailability using dietary strategies. J. Agric. Food Chem 2017, 65, 3956–3964. [DOI] [PubMed] [Google Scholar]
- 35.Redan BW; Albaugh GP; Charron CS; Novotny JA; Ferruzzi MG, Adaptation in Caco-2 human intestinal cell differentiation and phenolic transport with chronic exposure to blackberry (Rubus sp.) extract. J. Agric. Food Chem 2017, 65, 2694–2701. [DOI] [PubMed] [Google Scholar]
- 36.Qin X; Yuan D; Wang Q; Hu Z; Wu Y; Cai J; Huang Q; Li S; Liu G, Maillard-reacted whey protein isolates enhances thermal stability of anthocyanins over a wide pH range. J. Agric. Food Chem 2018, 66, 9556–9564. [DOI] [PubMed] [Google Scholar]
- 37.Sun B; Zhao F; Lombi E; McGrath S, Leaching of heavy metals from contaminated soils using EDTA. Environ. Pollut 2001, 113, 111–120. [DOI] [PubMed] [Google Scholar]
- 38.Wasay S; Barrington S; Tokunaga S, Remediation of soils polluted by heavy metals using salts of organic acids and chelating agents. Environ. Technol 1998, 19, 369–379. [Google Scholar]
- 39.Garrabrants AC; Kosson DS, Use of a chelating agent to determine the metal availability for leaching from soils and wastes. Waste Manag. 2000, 20, 155–165. [Google Scholar]
- 40.Deng S; Bai R; Chen JP, Aminated polyacrylonitrile fibers for lead and copper removal. Langmuir 2003, 19, 5058–5064. [Google Scholar]
- 41.Van TN; Osanai Y; Nguyen HD; Kurosawa K, Arsenic speciation and extraction and the significance of biodegradable acid on arsenic removal: An approach for remediation of arsenic-contaminated Soil. Int. J. Environ. Res. Public Health 2017, 14, 990. [DOI] [PMC free article] [PubMed] [Google Scholar]
- 42.Gray PJ; Conklin SD; Todorov TI; Kasko SM, Cooking rice in excess water reduces both arsenic and enriched vitamins in the cooked grain. Food Addit. Contam. Part A 2016, 33, 78–85. [DOI] [PubMed] [Google Scholar]
- 43.Cheyns K; Waegeneers N; Van de Wiele T; Ruttens A, Arsenic release from foodstuffs upon food preparation. J. Agric. Food Chem 2017, 65, 2443–2453. [DOI] [PubMed] [Google Scholar]
- 44.International Organization of Vine and Wine, OIV Code Sheet. www.oiv.int/public/medias/3741/e-code-annex-maximum-acceptable-limits.pdf (7 December 2018).
- 45.Liao W; Wang G; Li K; Zhao W, Change of arsenic speciation in shellfish after cooking and gastrointestinal digestion. J. Agric. Food Chem 2018, 66, 7805–7814. [DOI] [PubMed] [Google Scholar]
Associated Data
This section collects any data citations, data availability statements, or supplementary materials included in this article.