

Abstract
The sodium-iodide symporter (NIS) mediates uptake of iodide into the thyroid. Inhibition of NIS function by xenobiotics has been demonstrated to suppress circulating thyroid hormones and perturb related physiological functions. Until recently, few environmental chemicals had been screened for NIS inhibition activity. We previously screened over 1000 chemicals from the ToxCast Phase II (ph1v2 and ph2) libraries using an in vitro radioactive iodide uptake (RAIU) with the hNIS-HEK293T cell line to identify NIS inhibitors. Here, we broaden the chemical space by expanding screening to include the ToxCast e1k library (804 unique chemicals) with initial screening for RAIU at 1×10⁻⁴ M. Then 209 chemicals demonstrating >20% RAIU inhibition were further tested in multiple-concentration, parallel RAIU and cell viability assays. This identified 55 chemicals as active, noncytotoxic RAIU inhibitors. Further cytotoxicity-adjusted potency scoring (with NaClO4 having a reference score of 200) revealed 5 chemicals with moderate to strong RAIU inhibition (scored >100). These data were combined with our previous PhII screening data to produce binary hit-calls for ~1,800 unique chemicals (PhII+e1k) with and without cytotoxicity filtering. Results were analyzed with a ToxPrint chemotype-enrichment workflow to identify substructural features significantly enriched in the NIS inhibition hit-call space. We assessed the applicability of enriched PhII chemotypes to prospectively predict NIS inhibition in the e1k dataset. Chemotype enrichments derived for the combined ~1,800 dataset also identified additional enriched features, as well as chemotypes affiliated with cytotoxicity. These enriched chemotypes provide important new information that can support future data interpretation, structure-activity relationship, chemical use, and regulation.
Keywords: sodium-iodide symporter, thyroid, endocrine disruptor, high-throughput in vitro screening assay, ToxPrint, chemotype
1. Introduction
Environmental chemicals have been shown to perturb thyroid homeostasis through multiple mechanisms of action (MOA)(Brucker-Davis 1998; Capen and Martin 1989; Crofton 2008; Ghassabian and Trasande 2018). The multiplicity of possible pathways adversely affecting thyroid function has made screening chemicals for thyroid disruption challenging. Very few thyroid screening assays were initially included in the U.S. Environmental Protection Agency’s (U.S.EPA) ToxCast and affiliated multi-Agency Tox21 programs (Collins et al. 2008; Dix et al. 2006). The assays that were included mostly consisted of receptor binding and transactivation assays (Noyes et al. 2019). For this reason, research efforts within U.S. EPA have focused on identifying, prioritizing, and developing new in vitro screening assays that are aligned to putative MOAs and can be used to screen large chemical libraries for potential thyroid-disrupting activities (Buckalew et al. 2020; Hornung et al. 2018; Noyes et al. 2019; Olker et al. 2018; Olker et al. 2019; Paul Friedman et al. 2016; Wang et al. 2019; Wang et al. 2018).
The sodium-iodide symporter (NIS) is a transmembrane protein responsible for active uptake of iodide into the thyroid gland for thyroid hormone synthesis (Carrasco 1993). Previous research efforts initially focused on the interference of NIS-mediated iodide uptake by inorganic anions such as ClO4−, PF6−, BF4−, SCN−, NO3−, and Br−-, which were shown to be competitive inhibitors of iodide transport through the NIS (Darrouzet et al. 2014). Until recently, few organic xenobiotics had been tested for NIS inhibition, and given their widespread prevalence, identification of environmental chemicals as potential NIS inhibitors is critical. Previously, our laboratory initiated an effort to identify NIS inhibitors with an in vitro screening assay allowing for thousands of chemicals to be rapidly investigated (Hallinger et al. 2017; Wang et al. 2019; Wang et al. 2018). This in vitro radioactive-iodide uptake (RAIU) assay has since been employed to screen nearly 1000 ToxCast PhII chemicals(Richard et al. 2016; Wang et al. 2019; Wang et al. 2018). Subsequently, we confirmed activity of 29 high-ranking chemicals from the initial screen in a supplemental Fischer rat thyroid follicular cell line (FRTL-5) NIS inhibitor screening assay to provide a rat/human comparison (Buckalew et al. 2020). The previously tested library of ~1000 ToxCast PhII chemicals featured diverse structures spanning pesticides, herbicides, industrial and pharmaceutical compounds (Richard et al. 2016). To explore possible structure-activity associations, we applied a novel structure-activity profiling method that utilized a chemotype enrichment workflow (CTEW) based on a publicly available set of ToxPrint chemical features (https://toxprint.org/; Yang et al., 2015). Using this approach, we were able to identify over 20 distinct chemotypes (CTs), representing more than 60% of the active chemicals, that were enriched for the NIS inhibition activity in both the cytotoxicity unfiltered and filtered activity sets.
Goals of the present study were twofold: to expand the environmental chemical space of interest for NIS inhibition, and to further validate the utility of CTEW approach to extract structure-activity signals associated with NIS inhibition. Our previously developed in vitro RAIU assays, featuring the hNIS-HEK293T-EPA and FRTL-5 cell lines, were used to screen and prioritize ~804 chemicals from the ToxCast e1k library for potential NIS inhibitors. The ToxCast e1k chemicals expanded the NIS inhibitor screening space to include known endocrine-active chemicals such as estrogen and androgen receptor binding ligands as well as a broad range of industrial use and pharmacologically active chemicals. With the newly acquired NIS inhibition experimental data, we compared and reported changes in enriched CTs due to significant expansion of the chemical library from 1000 (PhII) to ~1800 (PhII+e1k) chemicals. ToxPrints were used to profile the e1k dataset to anticipate new areas of chemistry not previously included in the PhII screening and to determine potential applicability of the originally previously derived, enriched CTs. These CTs were then applied to predict NIS inhibition activity of the e1k chemicals. Finally, we reapplied the CTEW to the entire combined PhII+e1k library and compare the resulting enriched CTs to those derived previously, both for the cytotoxicity unfiltered and filtered activity datasets.
The results from this study conclude the screening of the current ToxCast library and represent the largest source of in vitro environmental chemical screening data for NIS inhibitors. The assay has been validated by multiple means and, when applied with parallel cytotoxicity filtering, has successfully identified chemicals exhibiting both weak and strong NIS inhibition. The sequential screening of portions of the ToxCast library has enabled us to monitor changes to the patterns of enriched CTs as a function of test set size, structure diversity, and cytotoxicity filtering. Significant and stable CT enrichment signals in identified NIS inhibition actives offer independent support for the validity of the NIS inhibition assay and provide a tool for structure-based screening and prioritization of new chemicals for NIS activity based on the publicly available, chemically intuitive ToxPrints. Furthermore, we demonstrate how these CT signals can be mined to provide in silico avenues for further exploration of the structural and biological basis of NIS activity in relation to other ToxCast assays associated with thyroid function.
2. Materials and methods
2.1. Chemical preparation
The ToxCast e1k chemicals were obtained from the U.S. EPA’s ToxCast Chemical Contractor (Evotec, Branford, CT), managed through U.S. EPA’s National Center for Computational Toxicology (currently the Center for Computational Toxicology and Exposure). The test library contained 809 samples (representing 804 unique chemicals), with 5 internal quality chemicals run in duplicate. Chemicals were solubilized in dimethyl sulfoxide (DMSO) (≤ 2×10⁻² M, Table S1) and supplied in fourteen 96-well plates. Stock chemical plates were visually inspected under an inverted microscope to confirm solubility in each well (Table S1). All control chemicals, including sodium perchlorate (NaClO4), sodium nitrate (NaNO3), sodium thiocyanate (NaSCN), 2,4-dichlorophenoxyacetic acid (2,4-D), and 2,3-dichloro-1,4-napthoquinone (DCNQ) (Sigma Aldrich, St. Louis, MO), were initially solubilized in DMSO (EMD Millipore Corp., Darmstadt, Germany) at 2×10⁻² M. Documentation for all chemicals in the ToxCast inventory supplied for testing was subject to manual quality curation review prior to substance registration in U.S. EPA’s DSSTox structure database (Richard et al., 2016), and were assigned DSSTox chemical identifiers (DTXSIDs, chemical names, CAS numbers) and mapped to chemical structures (DTXCIDs), wherever possible. These chemical identifiers and the associated maximum concentrations are provided in Table S1.
2.2. High-throughput human NIS inhibition screening
The ToxCast e1k chemicals were tested in the high-throughput RAIU screening assay as previously described (Wang et al., 2018, 2019). Briefly, the hNIS-HEK293T-EPA cells were incubated at 37°C/5% CO2 in 96-well plates and then exposed to 125I with test chemical for 2 h. Intracellular 125I was measured as counts per minute (CPM) with a MicroBeta2 microplate scintillation counter (Perkin Elmer, Waltham, MA). Median CPM for the DMSO vehicle control wells was used as the maximum RAIU reference to normalize CPMs from each plate as percent activity of control. A total of 809 blinded chemical samples were first tested by the RAIU assay at a single concentration of 1×10⁻⁴ M (some exceptions owing to solubility, see Table S1). Then, 214 samples that produced median RAIU inhibition greater than 20% were further tested in six serially diluted concentrations (1×10⁻⁹ - 1×10⁻⁴ M) to obtain dose response curves. CellTiter-Glo (Promega, Madison, MI) cell viability assays (measuring intracellular ATP) were conducted in parallel to identify chemicals that may have caused a decrease in RAIU due to confounding cytotoxicity. Results of the cell viability assay, measured as relative light units, were also normalized as percent activity of DMSO (vehicle control) as with the RAIU assay. All assays were conducted with 3 bioreplicates. To assess the performance of RAIU and cell viability assays, multiple control chemicals were included on each assay plate; NaNO3 (RAIU EC80 control), NaSCN (RAIU EC20 control), and 2,4-D (RAIU negative control) at 1×10⁻⁴ M, and NaClO4 (RAIU positive control) and DCNQ (cell viability positive control) at six concentrations (1×10⁻⁹ - 1×10⁻⁴ M).
2.3. Secondary testing by the FRTL-5 assay
A secondary Fischer rat thyroid follicular cell (FRTL-5) RAIU assay and cell viability assay were used to confirm highly ranked chemicals based on the human NIS high-throughput screening results. This assay also used a 2 h chemical exposure time and shared similar screening procedures as the human NIS assay. The detailed protocol was previously described (Buckalew et al. 2020).
2.4. Screening data analysis
NIS inhibition assay results were analyzed as previously described (Wang et al. 2018). All chemicals that produced ≤ 20% median RAIU inhibition in the initial single-concentration screening were considered inactive for NIS inhibition in this assay. For the rest of the compounds tested further in multiple-concentration, an activity threshold was determined based on 3 times the median absolute deviation (3bMAD, b = 1.4826), calculated using the responses of the two lowest concentrations across all test chemicals (i.e., responses at 1×10⁻⁹ and 1×10⁻⁸ M). In this study, the activity thresholds (3bMAD) in the multiple-concentration screening were 18.86% for cell viability and 17.84% for RAIU. For consistency with the single-concentration screening, the significant threshold of RAIU in multiple-concentration screening was set at 20% instead of the 3bMAD value (17.84%). Chemicals that produced median RAIU inhibition (at any given concentration) > 20% in the multiple-concentration testing were categorized as Hit1 actives in the following analyses. A cytotoxicity filter was applied to Hit1 actives to rule out RAIU false positives caused by cytotoxicity, producing the Hit2 actives. Hit2 actives were designated as chemicals that produced non-cytotoxic RAIU inhibition (cell viability inhibition ≤18.86%) at one or more test concentrations. Potency reporting (AC50, absEC50, cytotox-point) and toxicity-adjusted chemical potency ranking are described in SI.
2.5. ToxPrint Chemotype Enrichment Analysis
Enrichment analyses were performed using results for e1k chemicals from the current study combined with results from our previous screening of the ToxCast Phase II:ph2 and ph1v2 chemical sets (Wang et al. 2018). For simplicity, we will henceforth refer to the earlier Phase II:ph1_v2, ph2 results as “PhII”, the new PhaseII:e1k results as “e1k”, and the full, combined dataset as “PhII+e1k”. Detailed ToxCast chemical inventory description is provided in SI. A list of 1771 unique chemicals (Table S2) was generated for the combined PhII+e1k set by merging results for replicate test samples (as internal quality controls) and removing substances that could not be assigned a discrete structure (e.g., mixtures). For replicated samples, the hit-calls were assigned as positive if at least one of the replicates was positive.
The ToxPrint chemotype enrichment analysis workflow (CTEW), described previously (Wang et al., 2019), was used to generate results for the Hit1 and Hit2 sets of NIS inhibitor screening results for three inventories: 1) the previously tested PhII inventory (1028 unique structures); 2) the newly tested e1k inventory (743 unique structures); and 3) the combined PhII+e1k inventory (1771 unique structures). The ToxPrint chemotype (CT) set (https://toxprint.org/), developed by Altamira (Altamira, Columbus, OH USA) and Molecular Networks (Molecular Networks, Erlangen, GmbH) under contract from the U.S. Food and Drug Administration, consists of 729 sub-structural features (i.e., chemotypes) that are designed to capture a broad diversity of chemical atom, bond, chain, and scaffold types, as well as to represent chemical patterns and properties especially relevant to various toxicity and safety assessment concerns (Yang et al. 2015). CTEW calculation details are provided in SI.
3. Results and Discussion
3.1. hNIS single- and multiple-concentration assay
The performance of the assay was monitored using several quality control (QC) metrics including CV of DMSO, Z’ scores(Zhang et al. 1999), and AC50 of positive controls (NaClO4 for RAIU, DCNQ for cell viability) calculated based on reference/control chemical responses on each 96-well assay plate. These QC metrics were summarized across the single and multiple-concentration hNIS RAIU screening assays (Table S3) and displayed excellent assay reproducibility and robustness. For example, the plate-wise Z’ scores for the RAIU assay were consistently above 0.59 and averaged 0.78 and 0.84 in single- and multiple-concentration screening, respectively. The AC50s and small standard deviations (≤ 0.17 logM) for sodium perchlorate, as well as the responses of additional controls, including DMSO, NaSCN, NaNO3, and 2,4-D, further demonstrate the high degree of accuracy and low variability across the assays (Table S4). In addition, 5 chemicals –triclosan, mancozeb, azoxystrobin, perfluorooctanesulfonic acid (PFOS), and bisphenol A (BPA) – were internally replicated in the test library to evaluate intra-assay reproducibility and demonstrated good consistency between different samples (Fig. S1).
The e1k chemical library (809 samples, 804 unique compounds) was first tested in the RAIU assay at a single concentration of 1×10⁻⁴ M. A subset of 214 samples (26.5%) inhibited ≥20% RAIU and were further subjected to multiple-concentration testing (Fig. S2). Subsequently, 146 samples produced significant RAIU inhibition, and 57 of these samples (55 unique chemicals) produced non-cytotoxic RAIU inhibition at one or more concentrations. The quantitative chemical ranking approach was applied to these chemicals, producing ranking scores ranging from −74.3 to 168.6 (Fig. 1A) relative to the ranking score (200) of positive control, NaClO4. Most of the positive chemicals produced relatively weak RAIU inhibition as only five chemicals displayed ranking scores >100. The dose-responses for the top 16 ranked chemicals, including the NaClO4, reference control and duplicates of PFAS, are shown in Fig.1B; additional dose-response curves for other test compounds are provided in SI File 1. A summary of all results, including potencies and ranking scores, are included in Table S1.
Figure 1.
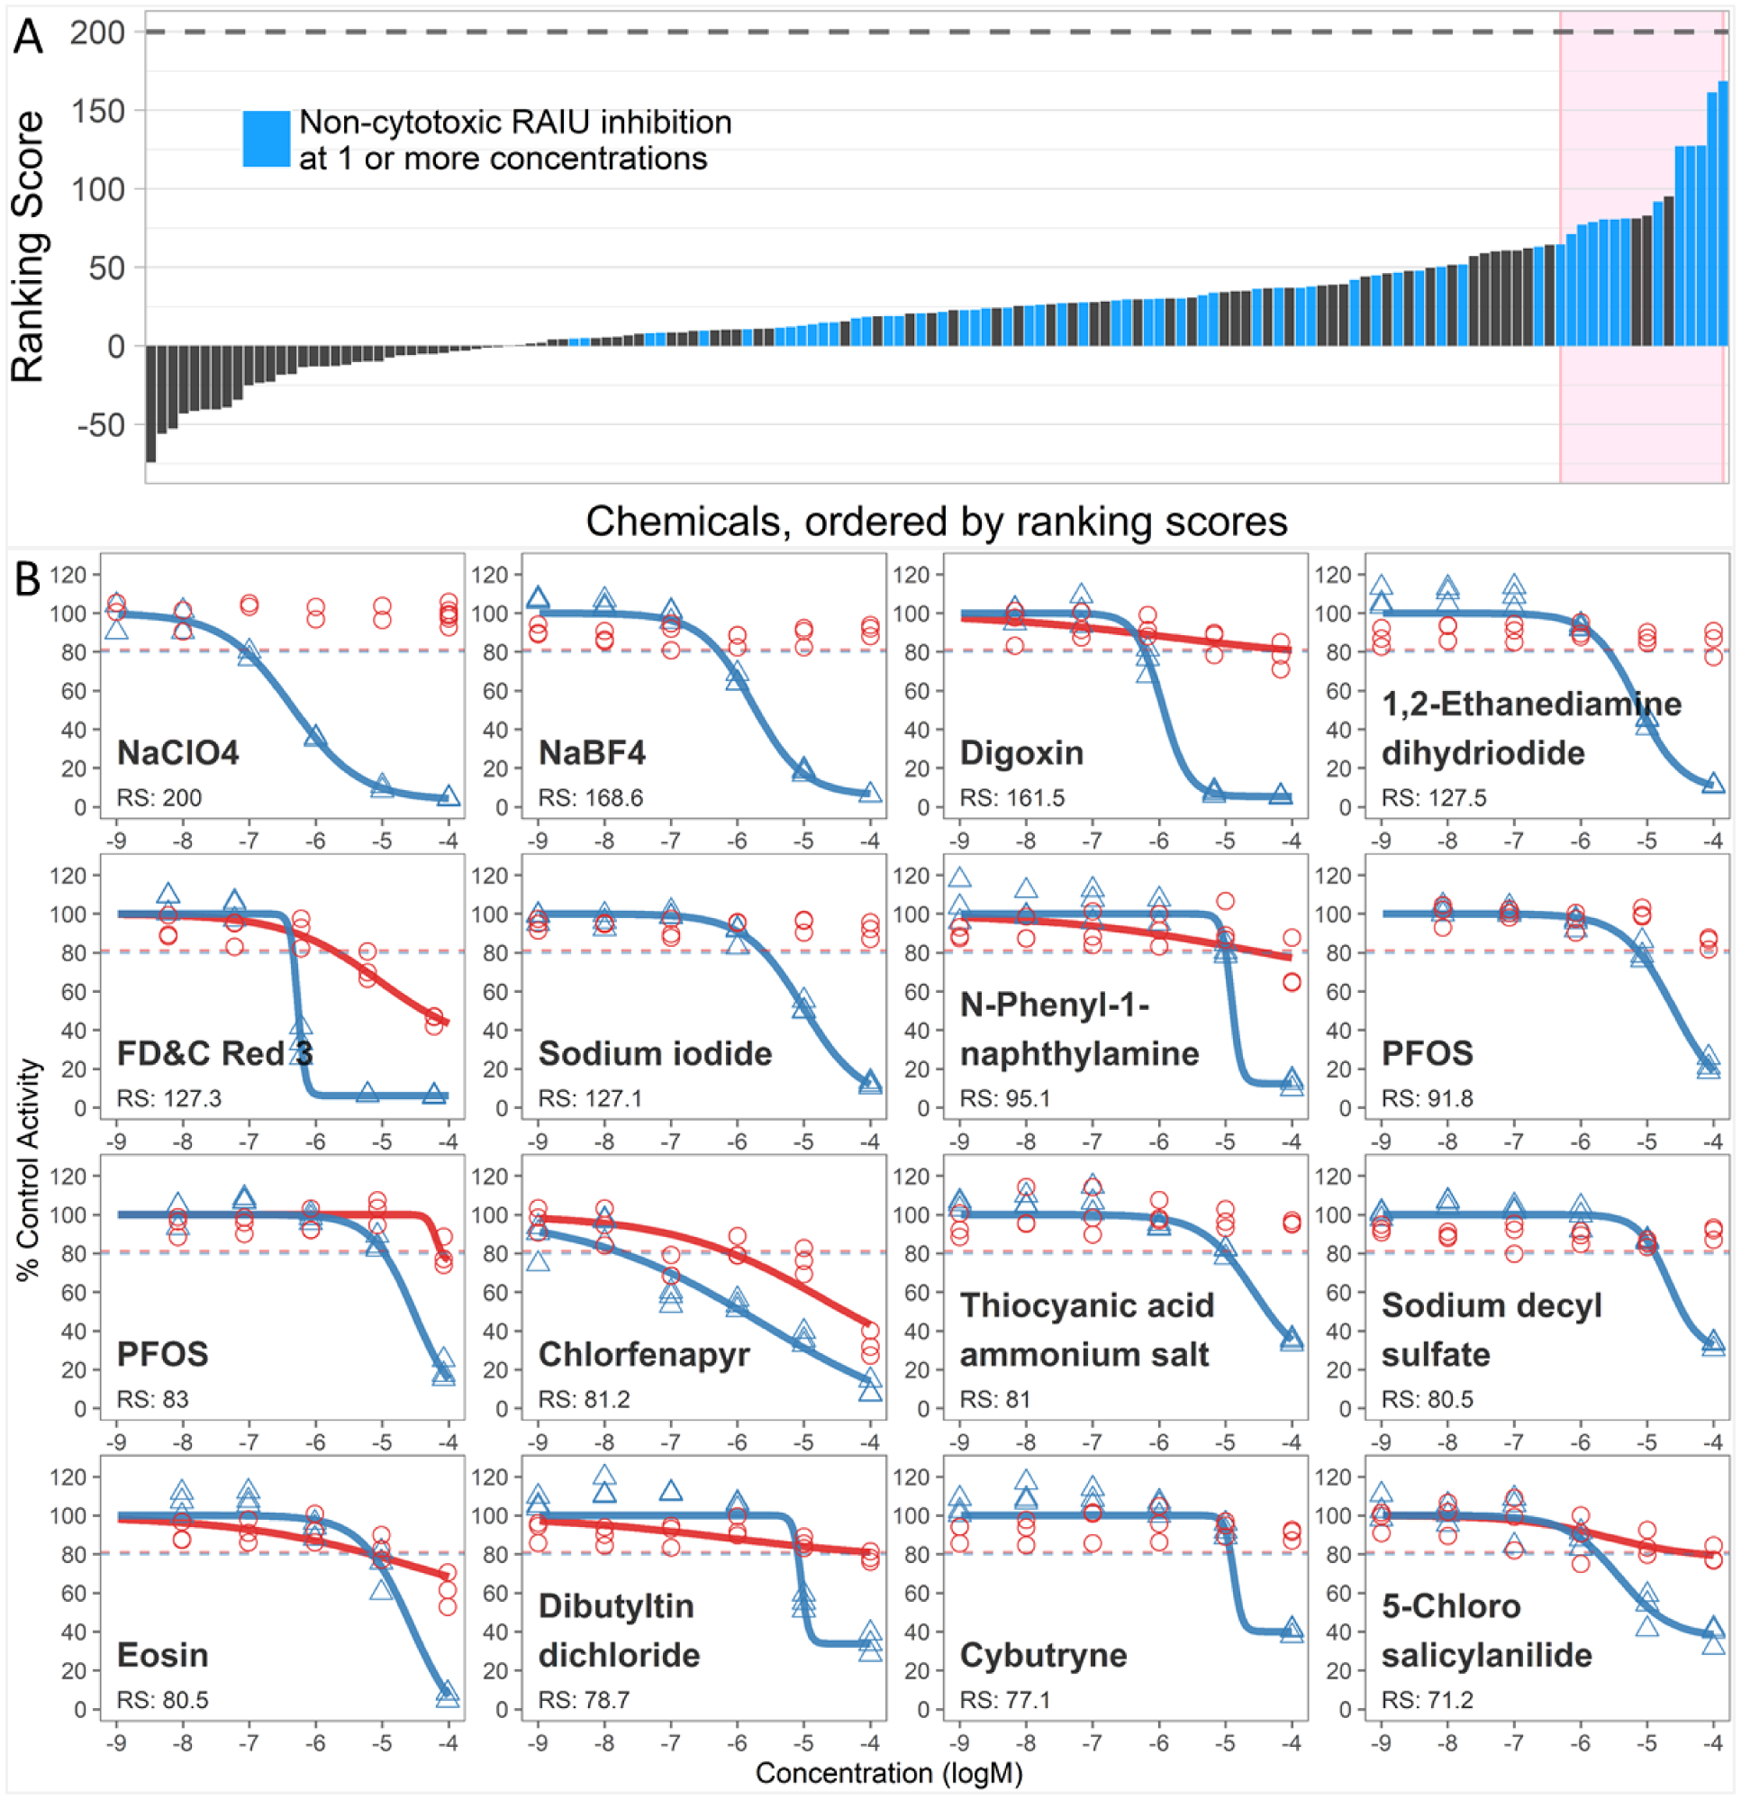
(A). Ranking scores for the 146 chemical samples that produced significant RAIU inhibition in multiple-concentration screening. The 57 chemical samples that produced significant RAIU inhibition without any significant cytotoxicity at one or more concentrations are shown in blue. The 15 top-ranked samples are highlighted in the pink rectangle. (B). Dose-response curves for reference chemical, NaClO4, and top-ranked 15 chemical samples. Individual data points for chemical concentrations represent results from three independent biological replicates. Dose-response curves were fit only when significant inhibition occurred. Red circles and line represent cell viability; blue triangles and line represent RAIU. PFOS was tested in duplicate samples and both graphs are shown here to demonstrate assay replication. RS: ranking score.
3.2. Secondary FRTL-5 assay
The top 10 ranked samples (include 2 PFOS samples) were further evaluated by secondary testing in the FRTL-5 based assay. Since five of these chemicals overlapped with our previously reported FRTL-5 study (Buckalew et al. 2020), results for the remaining 4 untested chemicals are shown in Fig. S3.
For 1,2-Ethanediamine dihydroiodide, FD&C Red 3, and N-Phenyl-1-naphthylamine, the FRTL-5 cell line produced similar dose responses, with a slightly higher level of iodide uptake inhibition than the hNIS-HEK293T-EPA cell line. The inhibition activity by 1,2-Ethanediamine dihydroiodide was expected, as this compound contains free I−. FD&C red 3 is known to promote thyroid tumor (Jennings et al. 1990) and was active in both NIS inhibition assays. However, since the FD&C red 3 molecule contains iodine, the observed inhibition activity could be due to iodine contamination in the sample and warrant further study. An oxidation product of chlorfenapyr (CL 303268) acts as a mitochondria uncoupler (N’Guessan et al. 2007; U.S.EPA 2003), which may explain the atypical dose-response in the hNIS cell line similar to our previous findings for other mitochondria disruptors such as rotenone (Wang et al. 2018). However, when tested using the FRTL-5 based RAIU, chlorfenapyr showed a quite different dose-response and higher absEC50 than observed for the hNIS cell line. This finding was consistent with NIS RAIU screening results observed for other mitochondria inhibitors in our previous FRTL-5 study (Buckalew et al. 2020).
3.3. Chemical landscape of PhII vs. e1k
The currently studied e1k library was compared to the previously studied PhII library based on both chemical usage categories and differential distribution of ToxPrint features. A general overview of the chemical categories within the Hit2 subsets of the PhII and e1k libraries, respectively, are represented in Fig. 2, with chemical counts in each inventory and their respective Hit2 subsets, within each category, listed in Table S5. Figure 2 provides a visual comparison of density of usage types within the PhII versus the e1k Hit2 inventories, highlighting the fact that a chemical may often, and by design, appear on multiple usage lists. Table S5 (Cols. 2,3) compares total counts of PhII chemicals versus e1k chemicals within each usage category. The ratio of the two totals (Col. 4), adjusted by the different sizes of the inventories (i.e., 1028 versus 743), indicates that the e1k inventory contains a higher proportion of Pesticidal Inerts, FDA_GRAS chemicals (Generally Regarded as Safe, https://www.fda.gov/food/food-ingredients-packaging/generally-recognized-safe-gras), and chemicals to be evaluated for endocrine disruption (e.g., under the U.S. EPA’s EDSP21 program, https://www.epa.gov/chemical-research/endocrine-disruption-screening-program-21st-century-edsp21), than the previously tested PhII inventory. In addition, e1k contains a lower proportion of Pesticides, Pharmaceuticals, and known toxicants in U.S. EPA’s Integrated Risk Information System inventory (IRIS, https://www.epa.gov/iris), and U.S. EPA’s ToxRef animal toxicity database (Watford et al. 2019) (https://cfpub.epa.gov/si/si_public_record_Report.cfm?Lab=NCCT&dirEntryId=227139). These observations reflect the selection drivers for the PhII and e1k inventories designed to increase chemical diversity and coverage (Richard et al., 2016), and they foreshadow quantitative chemical feature profile differences between the two inventories.
Figure 2.
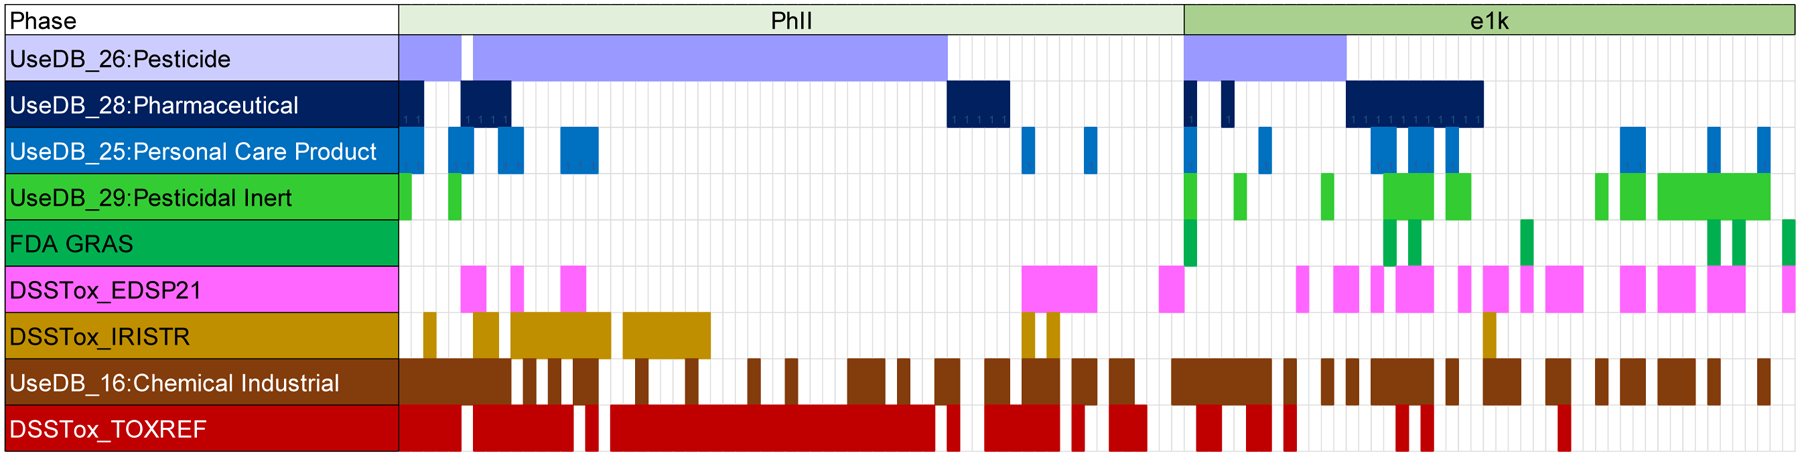
Incidence of Hit2 chemicals (each column) across 9 inventory lists in PhII compared to e1k, where individual chemicals can be assigned to multiple lists. See Table S2 for chemical-list assignments: UseDB lists extracted from U.S. EPA’s CPDat database (https://www.epa.gov/chemical-research/chemical-and-products-database-cpdat); FDA GRAS: Generally Recognized as Safe chemicals (https://www.fda.gov/food/food-ingredients-packaging/generally-recognized-safe-gras); DSSTox lists (EDSP21, IRISTR and TOXREF) for the EDSP21 program (https://www.epa.gov/endocrine-disruption/endocrine-disruptor-screening-program-edsp-21st-century), U.S. EPA’s Integrated Risk Information System (https://www.epa.gov/iris), and U.S. EPA’s ToxRef animal toxicity database (https://cfpub.epa.gov/si/si_public_record_Report.cfm?Lab=NCCT&dirEntryId=227139).
The remaining columns (5–8) in Table S5 indicate the corresponding usage list chemical counts in the smaller NIS inhibition activity, Hit2 subspaces of the PhII and e1k inventories. Here we see a slightly different picture. The ratios of e1k-Hit2 counts versus PhII-Hit2 counts in each usage list, adjusted by the different sizes of the Hit2 totals in the two inventories (49 versus 63), largely parallel the adjusted ratios of the total numbers of PhII and e1k chemicals for pesticides, personal care products, industrial, and known toxicants (IRIS and TOXREF). However, the e1k Hit2 space contains a significantly larger proportion of Pharmaceutical, Pesticidal Inert, FDA_GRAS and EDSP21 chemicals than the PhII Hit2 space, even when totals are adjusted for differences in the sizes in the two Hit2 inventories. Again, these differences are likely to be reflected in chemical feature profiles and CT enrichments in the Hit2 space when e1k chemicals are included. Finally, the last column in Table S5 indicates the total percentage of Hit2 actives (combining PhII+e1k Hit2 sets) in each of the usage lists above the baseline percentage of PhII+e1k totals in each usage list. Overall, we see a higher concentration of pesticides (139%), personal care products (133%), and known toxicants (IRIS-126% and TOXREF-120%) in the NIS inhibition Hit2 actives than in the overall PhII+e1k inventory, and a significantly smaller percentage of FDA_GRAS chemicals in the Hit2 set relative to the total inventory (37%).
Figure S4 compares the feature profiles of the e1k versus the PhII inventory for a subset of ToxPrint features found to be enriched in one or more of the NIS Hit1 or Hit2 active spaces of PhII or PhII+e1k. There are several ToxPrints in the e1k inventory that contribute a similar number of chemicals as the PhII inventory to the total (e.g., bond_C#N_nitrile), expanding the coverage of that local chemical space to possibly increase the chances of detecting a structure-activity signal. We also see several examples of enriched ToxPrints that are highly represented in the PhII inventory and poorly represented in the e1k inventory, including several alkyl halide features; hence, these features will predict few NIS actives in the e1k set.
3.4. Predicting e1k actives using previously enriched PhII chemotypes
Previously, we reported sets of statistically enriched chemotypes for the Hit1 (without cytotoxicity filtering) and Hit2 (with cytotoxicity filtering) NIS actives in the PhII dataset. Having expanded the NIS test set to include a broad diversity of new e1k chemicals, it was of interest to initially determine how well those PhII-enriched CTs would prospectively predict the newly identified Hit1 and Hit2 NIS actives in the e1k dataset. Subsequently, we rederived the enriched CTs for the full PhII+e1k Hit1 and Hit2 datasets and compared the results to those obtained previously. CT enrichment results for the combined PhII+e1k inventory Hit1 dataset is provided in Table S6; corresponding results for the Hit2 dataset are provided in Table 2 below. The full ToxPrint fingerprint table for the PhII_e1k set of 1771 total structures is provided in Table S7. PhII CT enrichment results were previously published in Wang et al., 2019.
Table 2.
List of 23 enriched ToxPrint chemotypes for the NIS Hit2 dataset with enrichment statistics and affiliated ToxCast assay counts
| ToxPrint IDa (PhII+e1k Hit2) | Chemotype Labelb | CT-Totc | TPd | FPe | FNf | TNg | Odds Ratioh | P-Valuei | (-log10) pvalj | # enriched assaysk |
|---|---|---|---|---|---|---|---|---|---|---|
| Txp-184 | bond:CX_halide_aromatic-X_ether_aromatic_(Ph-O-Ph)_generic | 14 | 6 | 8 | 106 | 1651 | 11.68 | 1.1E-04 | 3.96 | 109 |
| Txp-169 | bond:CX_halide_alkyl-X_trihalo_(1_1_1-) | 96 | 16 | 80 | 96 | 1579 | 3.29 | 2.1E-04 | 3.68 | 47 |
| Txp-142 | bond:CX_halide_alkenyl-X_generic | 40 | 9 | 31 | 103 | 1628 | 4.59 | 6.1E-04 | 3.21 | 91 |
| Txp-183 | bond:CX_halide_aromatic-X_ether_aromatic_(Ph-O-Ph) | 40 | 9 | 31 | 103 | 1628 | 4.59 | 6.1E-04 | 3.21 | 160 |
| Txp-117 | bond:COC_ether_aromatic | 41 | 9 | 32 | 103 | 1627 | 4.44 | 7.4E-04 | 3.13 | 48 |
| Txp-239 | bond:P=O_phosphate_thioate | 14 | 5 | 9 | 107 | 1650 | 8.57 | 1.2E-03 | 2.93 | 86 |
| Txp-423 | chain:alkaneBranch_t-butyl_C4 | 71 | 12 | 59 | 100 | 1600 | 3.25 | 1.2E-03 | 2.92 | 38 |
| Txp-260 | bond:P~S_generic | 36 | 8 | 28 | 104 | 1631 | 4.48 | 1.4E-03 | 2.87 | 53 |
| Txp-139 | bond:CX_halide_alkenyl-X_acyclic_generic | 16 | 5 | 11 | 107 | 1648 | 7.00 | 2.3E-03 | 2.64 | 41 |
| Txp-134 | bond:CS_sulfide_dialkyl | 32 | 7 | 25 | 105 | 1634 | 4.36 | 3.0E-03 | 2.52 | 20 |
| Txp-433 | chain:alkaneCyclic_propyl_C3 | 25 | 6 | 19 | 106 | 1640 | 4.89 | 3.7E-03 | 2.43 | 38 |
| Txp-13 | bond:C#N_nitrile_generic | 52 | 9 | 43 | 103 | 1616 | 3.28 | 4.3E-03 | 2.37 | 15 |
| Txp-137 | bond:CX_halide_alkenyl-Cl_dichloro_(1_1-) | 7 | 3 | 4 | 109 | 1655 | 11.39 | 7.1E-03 | 2.15 | 52 |
| Txp-161 | bond:CX_halide_alkyl-X_dihalo_(1_3) | 39 | 7 | 32 | 105 | 1627 | 3.39 | 9.5E-03 | 2.02 | 123 |
| Txp-140 | bond:CX_halide_alkenyl-X_dihalo_(1_1-) | 8 | 3 | 5 | 109 | 1654 | 9.10 | 1.1E-02 | 1.96 | 55 |
| Txp-146 | bond:CX_halide_alkyl-Cl_trichloro_(1_1_1-) | 15 | 4 | 11 | 108 | 1648 | 5.55 | 1.2E-02 | 1.92 | 62 |
| Txp-155 | bond:CX_halide_alkyl-X_benzyl_alkane | 41 | 7 | 34 | 105 | 1625 | 3.19 | 1.3E-02 | 1.90 | 56 |
| Txp-6 | atom:element_metal_transistion_metal | 10 | 3 | 7 | 109 | 1652 | 6.50 | 2.1E-02 | 1.67 | 165 |
| Txp-153 | bond:CX_halide_alkyl-X_aromatic_alkane | 6 | 3 | 3 | 109 | 1656 | 15.19 | 4.3E-03 | 2.37 | 18 |
| Txp-154 | bond:CX_halide_alkyl-X_aromatic_generic | 6 | 3 | 3 | 109 | 1656 | 15.19 | 4.3E-03 | 2.37 | 18 |
| Txp-557 | group:ligand_path_4_bidentate_ethylenediamine | 10 | 3 | 7 | 109 | 1652 | 6.50 | 2.1E-02 | 1.67 | 12 |
| Txp-170 | bond:CX_halide_alkyl-X_trihalo_(1_1_2-) | 29 | 5 | 24 | 107 | 1635 | 3.18 | 3.2E-02 | 1.49 | 48 |
| Txp-166 | bond:CX_halide_alkyl-X_secondary | 13 | 3 | 10 | 109 | 1649 | 4.54 | 4.4E-02 | 1.35 | 33 |
ToxPrint ID associated with the publicly available ToxPrints, https://toxprint.org/.
ToxPrint chemotype name associated with the publicly available ToxPrints, https://toxprint.org/.
Total number of chemicals in the dataset containing the indicated ToxPrint chemotype (CT).
Number of true positive chemicals (TP), i.e. NIS Hit2 assay actives, that contain the CT feature.
Number of false positive chemicals (FP), i.e. NIS Hit2 assay inactives, that contain the CT feature.
Number of false negative chemicals (FN), i.e. NIS Hit2 assay actives, that do not contain the CT feature.
Number of true negative chemicals (TN), i.e. NIS Hit2 assay inactives, that do not contain the CT feature.
Odds ratio computed as (TP × TN) / (FN × FP), using a threshold ≥ 3.
Fisher’s exact p-value, using a significance threshold of ≤ 0.05.
Ranked p-values computed as -log(p-value).
Number of ToxCast assays out of a total of 500 unique assay IDs containing enriched CTs that are enriched for the indicated ToxPrint CT.
Figure 3 presents a series of paired pie charts illustrating results for the Hit1 (left side of figure) and Hit2 (right side of figure) datasets for the following: enriched CTs derived from the PhII datasets used to predict the NIS actives in the PhII datasets (top series of figures); enriched CTs derived from the PhII datasets used to predict the NIS actives in the e1k datasets (middle series of figures); and enriched CTs derived from the PhII+e1k datasets used to predict the NIS actives in the PhII+e1k datasets (bottom series of figures). The concept of enrichment is conveyed in each of the 6 pairs of plots by the increased proportion of actives in the enriched CT subspace relative to full test set (orange wedges on the right panel for Hit1, light green wedges on the left panel for Hit2). Overall, both the smallest (1:2.2 for Hit1) and largest (1:13 for Hit2) CT enrichments are seen for the PhII results in the top panel. This pair of results implied a significant amplification of structure-activity signal in the cytotoxicity-filtered Hit2 actives relative to the Hit1 results, which provided independent support for cytotoxicity filtering step. Not surprisingly, we see a degradation of overall CT-enrichment performance using the PhII-derived CT enrichments to predict NIS actives within the e1k Hit1 and Hit2 datasets, although some predictivity remains. This result was largely anticipated from the differences in CT feature profiles seen in Figure S4 for the e1k versus the PhII chemical inventories, indicating that the PhII-enriched CTs would likely have limited predictivity for some features poorly represented in the e1k dataset. The bottom set of pie charts shows the improved performance of the newly derived set of CT enrichments for the combined PhII+e1k dataset when applied to predicting PhII+e1k Hit1 and Hit2 NIS actives. Although the overall predictivity of the enriched CTs in the PhII+e1k Hit2 NIS active space is less than what was observed for the original PhII Hit2 dataset, the level of enrichment is still significant (1:9.3), particularly considering that the addition of the e1k library expanded the size and chemical diversity of the test set. These results provide a high-level summary view of the CT enrichments predicting Hit1 and Hit2 NIS actives. However, questions such as the following require a more detailed survey of the CT-enrichment results: which enriched CTs from the original PhII study were also enriched in the PhII+e1k NIS actives, which PhII-enriched CTs were no longer enriched in the PhII+e1k NIS actives, and what newly enriched CTs arose from the e1k expansion of the test set?
Figure 3.
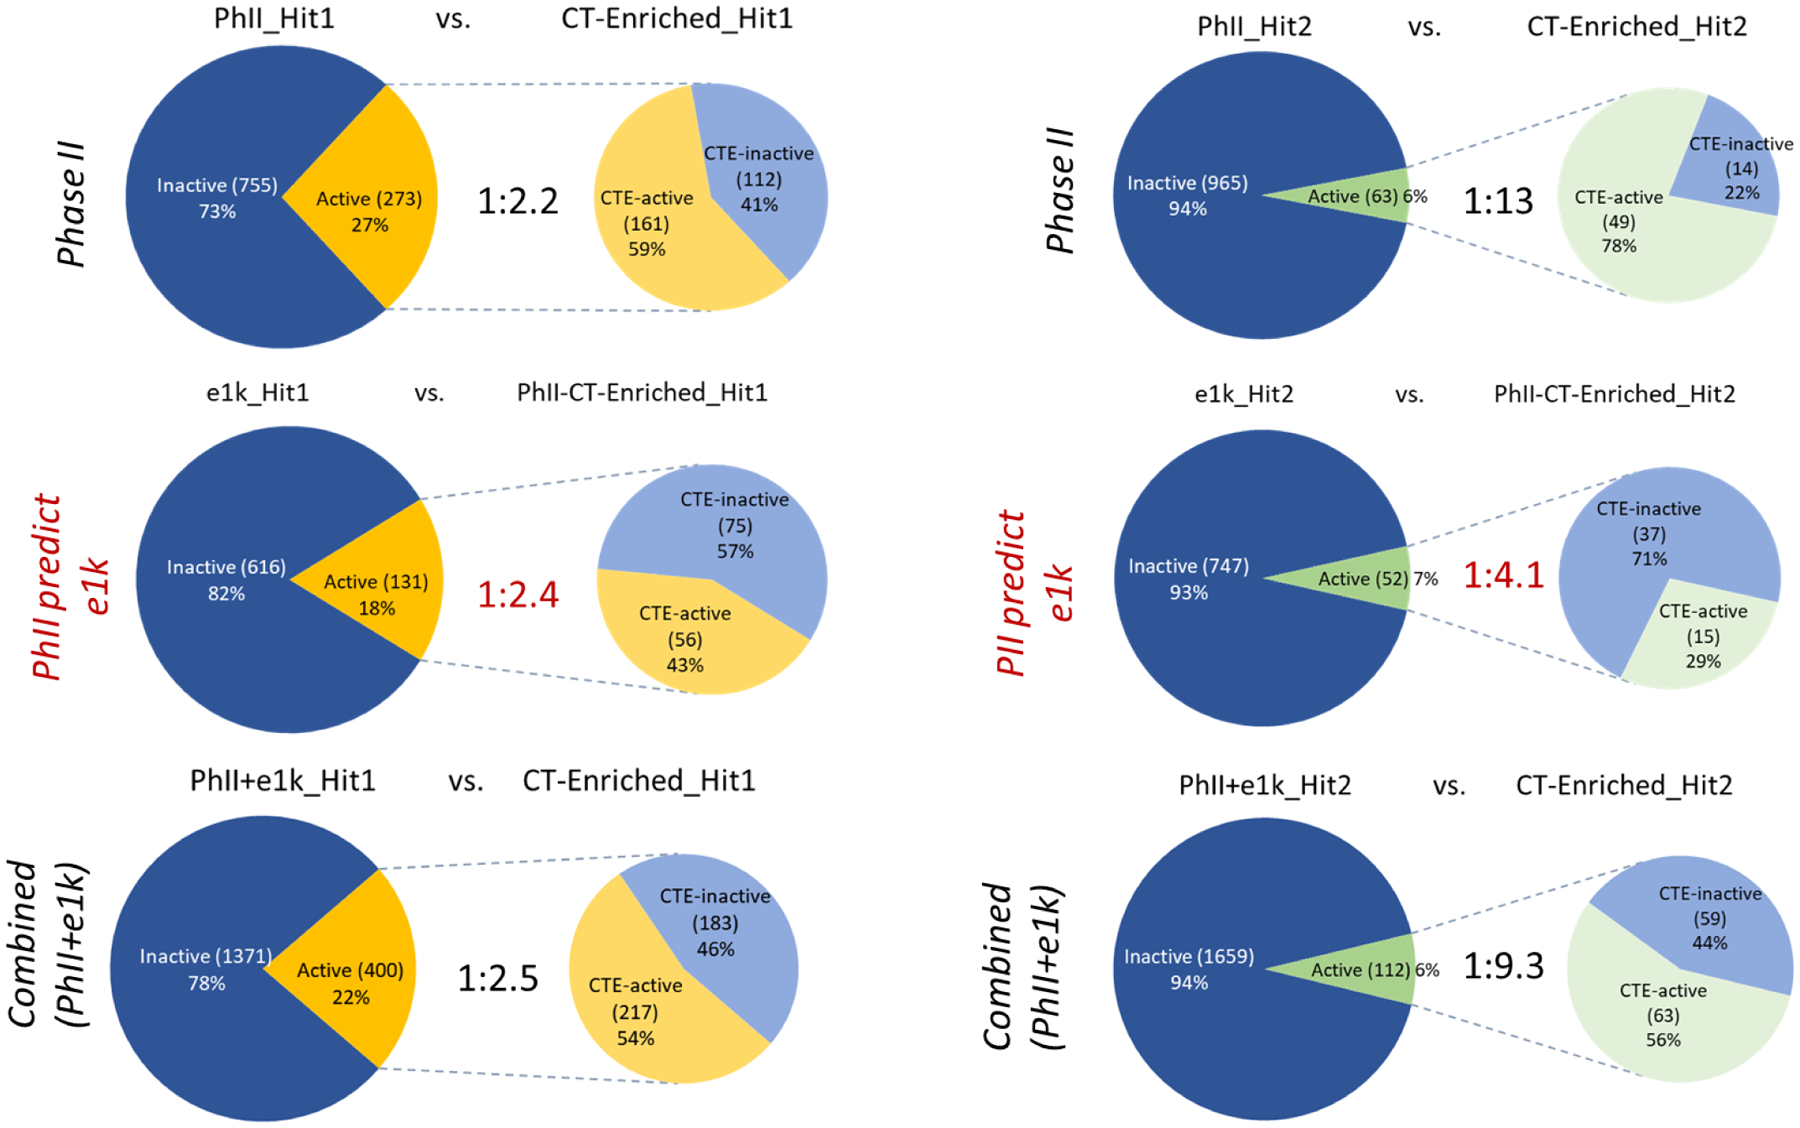
Paired pie charts illustrating chemotype (CT) enrichment in the active hit-call subspace for each test inventory, with Hit1 results shown in the left side of the figure (orange active subsections) and Hit2 results in the right side of the figure (light green active subsections): top row of charts report previously published PhII CT enrichment results (Wang et al., 2019); the middle row of charts used PhII-enriched CTs to predict activity in the corresponding e1k test sets (Hit1 and Hit2); the bottom row of charts show predictions resulting from enriched CTs derived for the combined PhII+e1k datasets. The ratios shown in the center of each paired pie chart indicates the degree of CT enrichment in the active hit-call space, ranging from a low of 1:2.2 (27%−59%, PhII_Hit1) to a high of 1:13 (6%−78%, PhII_Hit2).
3.5. Comparison of enriched chemotypes in PhII versus PhII+e1k
Figure 4 presents a comparison of the enriched CTs for the PhII Hit1 dataset versus the enriched CTs for the expanded PhII+e1k dataset; Figure S5 presents the same comparison for the corresponding Hit2 datasets. Several features of Figure 4 are noteworthy: 1) the total number of enriched CTs increased significantly, from 30 to 40 in going from the PhII Hit1 dataset to the expanded PhII+e1k Hit1 dataset; 2) the majority of the enriched CTs in the PhII Hit1 dataset, i.e., 25/30, not only persisted as enriched in the larger PhII+e1k dataset, but most of these CTs increased in statistical significance, with relatively few (5/30, top middle section of Figure 4) dropping out; and 3) 10 newly enriched CTs were detected in the PhII+e1k dataset (bottom right of Figure 4). Most of these observations are the result of the increased size and local CT coverage of the PhII+e1k dataset relative to PhII, with a corresponding increase in the number of NIS Hit1 actives (400 vs. 273). Each of these factors could make detection of structure-activity signals more likely within local CT regions of chemical space; however, this would not necessarily be the case unless there are predictive structure-activity relationship (SAR) signals to be found in the assay results. The increased significance of the 25 persistently enriched CTs, represented in 54% of the Hit1 actives (see Figure 4, bottom left charts) makes a strong case for truly predictive SAR signals in the dataset. The Hit2 results in Figure S5 largely mirror the trends in the Hit1 results in Figure 4, with some differences. Reflecting the smaller proportion of NIS Hit2 actives overall within the PhII and PhII+e1k datasets (63 and 112, respectively), the number of enriched CTs, 25 in each case, is correspondingly smaller in the Hit2 datasets. Once again, however, the majority of the enriched CTs identified in the PhII Hit2 dataset persisted into the PhII+e1k Hit2 dataset and, in most cases, also increased in statistical significance, with relatively few (5) newly enriched CTs identified. These results provide strong evidence of consistently predictive SAR signals within the NIS Hit2 dataset.
Figure 4.
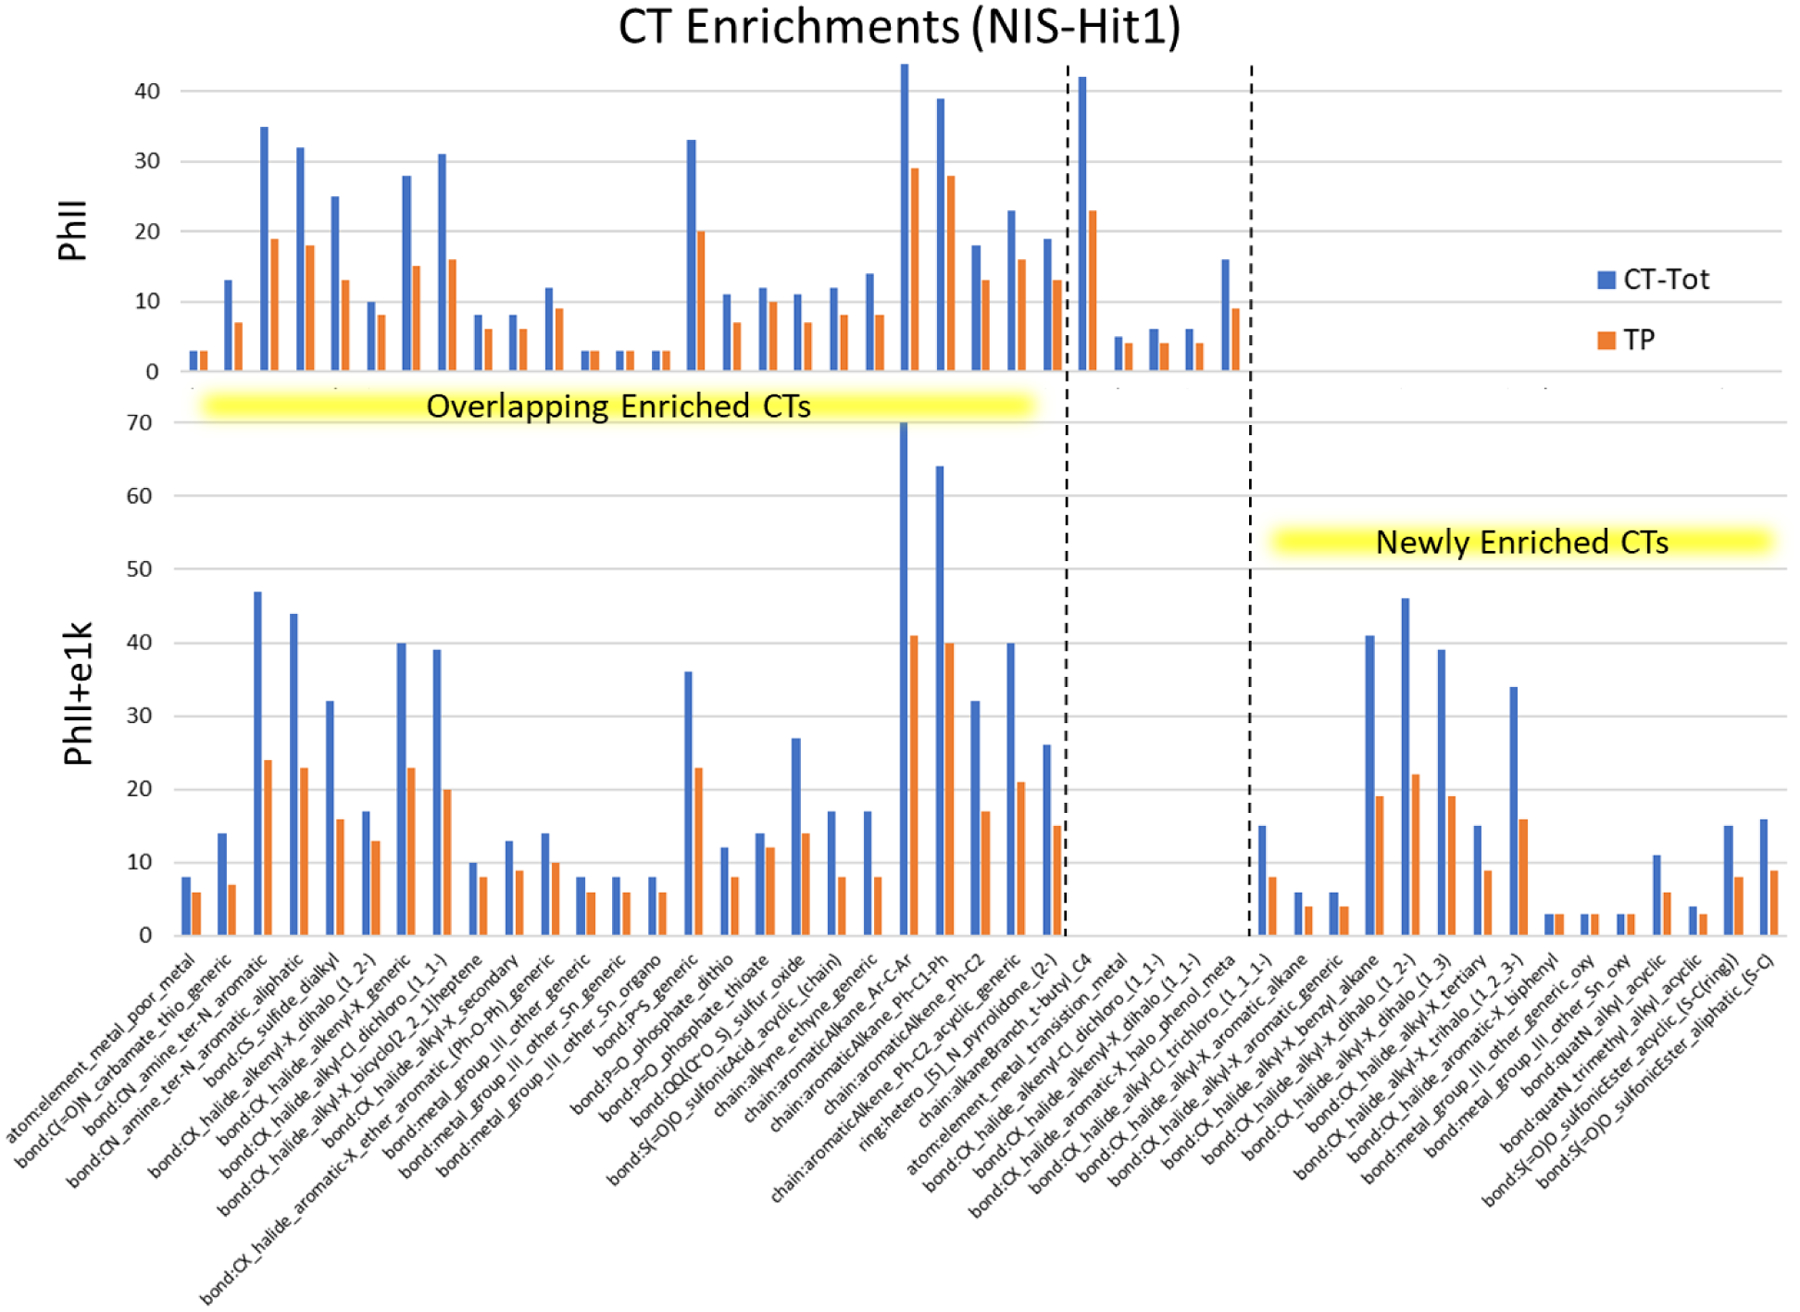
Comparison of enriched chemotype profiles for PhII Hit1 vs. PhII+e1k Hit1, where CT-Tot (blue bars) represents the total number of chemicals in each respective chemical test set that contained the ToxPrint CT listed, and TP (True Positive, orange bars) is the number of chemicals designated as Hit1 actives. The ToxPrints on the X-axis are ordered from left to right by p-value significance within the 3 subgroups: Overlapping enriched CTs, PhII-only enriched CTs, and Newly enriched (PhII+e1k-only CTs).
3.6. Comparison of Hit1 and Hit2 enriched CTs and role of cytotoxicity
Having examined the changes in overall Hit1 and Hit2 enriched CT profiles as the dataset expanded from PhII to PhII+e1k, we now compare the enriched CT profiles for Hit1 and Hit2 datasets. As the difference between the Hit2 and Hit1 dataset was the incorporation of a cytotoxicity filter (based on a cell viability assay conducted in parallel with our RAIU NIS screening) for determining positives, we hypothesized that enriched chemotypes that were only present in the Hit1 but not in Hit2 groups likely represented chemical signals related to cytotoxicity. To independently test this hypothesis, additional CT enrichment analyses were performed using the results from a suite of cytotoxicity “burst” assays in the ToxCast database (Judson et al. 2016). These cytotoxicity-specific CTs were then compared to the Hit1 and Hit2 enriched CTs.
Figure 5 presents a comparison of the enriched CT profiles for Hit1 and Hit2 activity datasets associated with the PhII+e1k inventory. The figure is divided into three sections to highlight enriched CTs shared between the Hit1 and Hit2 activity datasets (far left), enriched CTs that only appear in association with the Hit2 dataset (middle section), and enriched CTs only associated with the Hit1 dataset (right section). Height of the bars in this figure represent the Fisher’s Exact p-value significance (-log10) of each ToxPrint within the respective dataset, and enriched CTs within each subsection are sorted (high to low) by this p-value first for the Hit1 results, and secondly for the Hit2 results. We observe that nearly half of the enriched CTs associated with the cytotoxicity-filtered Hit2 dataset also appear in the Hit1 dataset, highlighting consistency and insensitivity to cytotoxicity in this portion of the CT structure-activity signal. In contrast, the last section of the plot, to the right, shows a significant number of Hit1-only enriched CTs, i.e., 33 chemotypes eliminated in the Hit2 set because of within-assay cytotoxicity filtering of the NIS RAIU screening results. Finally, superimposed on the plot are a set of 19 independently determined CTs (constant-height blue bars) found to be enriched in a series of ToxCast assays identified with cytotoxicity (Judson et al. 2016). All but one of these ToxCast cytotoxicity associated CTs fall in the Hit1-only portion of the plot, and the single exception is a weakly enriched Hit2-CT (atom:element_metal_transistion_metal, TP=3, CT-Tot=10). These findings provide independent CT enrichment support for the NIS cytotoxicity filtering step used in this study in relation to structure-activity signals seen across a variety of cytotoxicity-associated ToxCast assays.
Figure 5.
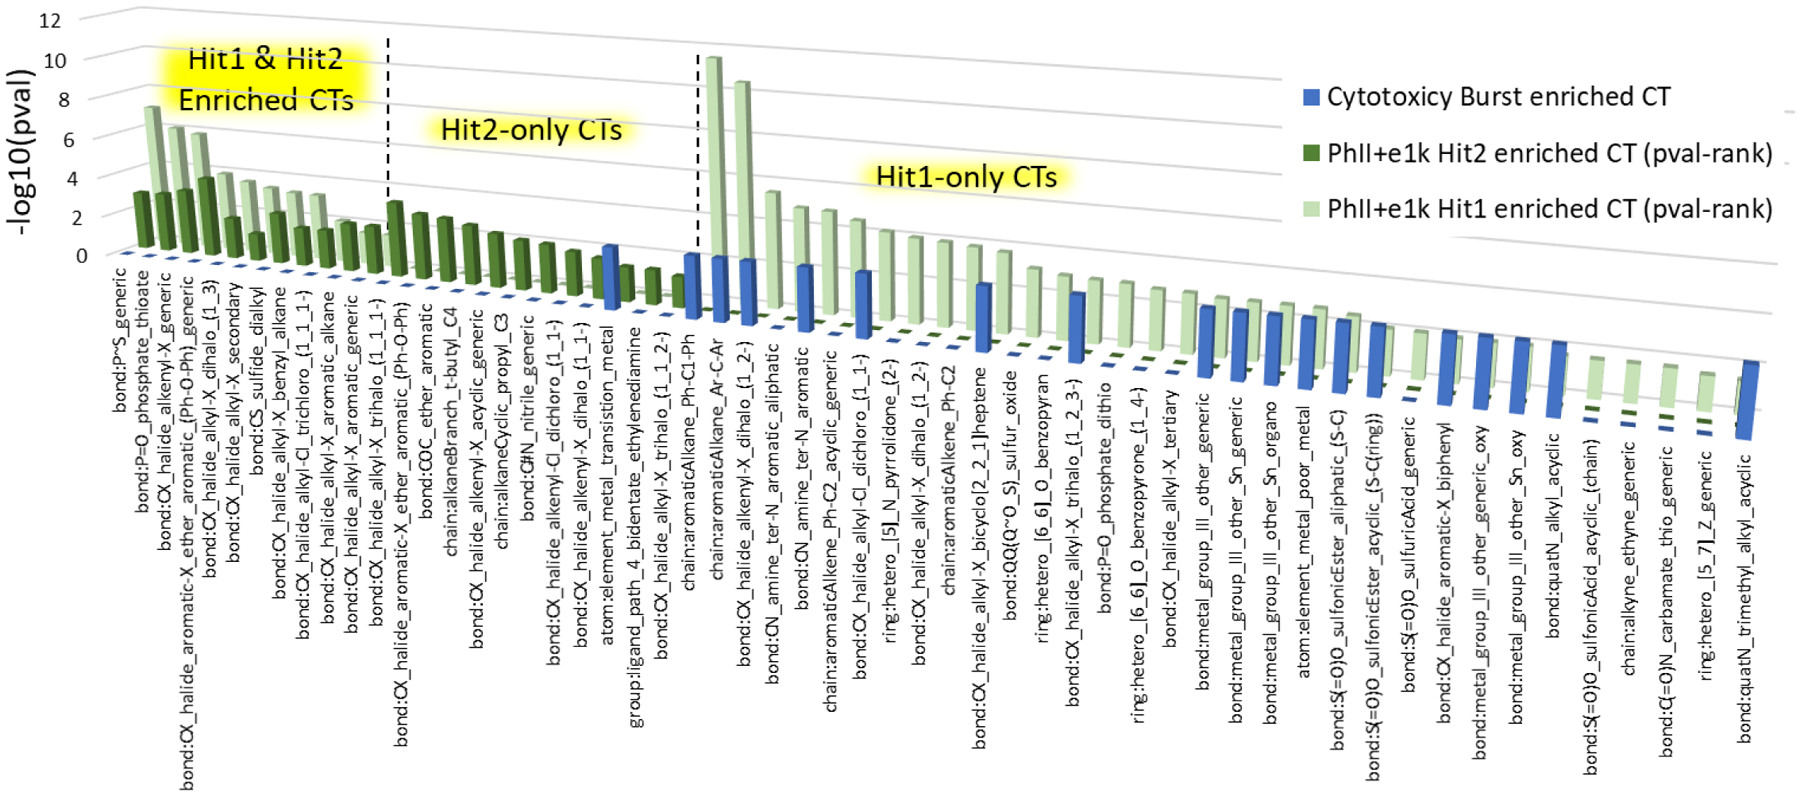
Comparison of enriched CTs for the combined PhII+e1k_Hit1 and PhII+e1k_Hit2 datasets, with overlapping Hit1 and Hit2 CTs shown in the far left of the plot (11 total), Hit2-only CTs in the center section (12 total), and Hit1-only CTs in the right section (33 total); the height of the green bars are proportional to -log(10) of the p-value significance (i.e., the taller the bar, the more significant the CT enrichment). The constant height blue bars indicate CTs found to be independently enriched in a set of ToxCast cytotoxicity assays previously used in calculation of a ToxCast cytotoxicity “burst” filter (Judson et al. 2016).
3.7. PhII+e1k enriched CTs and associated chemicals for NIS Hit2 dataset
The above CT profiling comparisons and overviews were intended to highlight global trends and consistencies within the Hit1 and Hit2 enrichment results for both the PhII and PhII+e1k datasets. Here, we provide an example that further explores the CT enrichment results and structure-activity patterns at the chemical level. Table 2 provides a listing of the 23 enriched CTs for the final Hit2 dataset, with their associated enrichment statistics (the corresponding results for the Hit1 PhII+e1k dataset are in Table S6). The last column lists the total number of ToxCast assays (out of nearly 500 unique assays with enrichments) also found to be enriched for the same ToxPrint CT. This number provides a gross indicator of specificity or promiscuity of the particular CT-assay association. Results in Table 2 indicate that the majority of enriched CTs in the PhII+e1k NIS Hit2 dataset are of the “bond:CX_halide_…” type (14/23), indicating a requirement for a halide atom (i.e., Cl, Br, I) to be bonded to the indicated scaffold, ranging from a biphenyl ether (Txp_183, 184) to a variety of alkyl, alkenyl, aromatic and alkyl-aromatic substructures (TxP_153, 154).
As an example of further exploration of activity patterns within a particular enriched CT subset of chemicals, we focused on the enriched CT, Txp_184 (bond:CX_halide_aromatic-X_ether_aromatic_(Ph-O-Ph)_generic). Table 3 provides a listing of the 14 chemicals containing the enriched CT Txp_184 with Hit1 and Hit2 activity status indicated. It is worthy of note that two of the actives (3,5,3’-Triiodothyronine and Tiratricol) and one of the inactives (Tetrac) in this enriched NIS activity space have documented indication of thyroid-related activity (Horn et al. 2013). Though due to the iodide content in their molecular structure, activities found for 3,5,3’-Triiodothyronine and Tiratricol warrant further investigation to rule out interference by iodide originated from either chemical contamination or metabolism. Figure 6 provides images of these 14 chemical structures, with the Txp_184 substructural feature highlighted. The reasons for the inactivity of the four inactives, particularly that of Tetrac, are currently unknown, but could warrant follow-up investigations.
Table 3.
List of 14 PhII+e1k substances containing the enriched Txp_184 chemotype (bond:CX_halide_aromatic-X_ether_aromatic_(Ph-O-Ph)_generic), with corresponding Hit1 and Hit2 activities and chemical use indicated.
| DTXSID | Substance Name | CAS RN | Hit1-active | Hit2-active | Usage |
|---|---|---|---|---|---|
| DTXSID5035957 | Cyfluthrin | 68359-37-5 | 1 | 1 | pyrethroid insecticide |
| DTXSID5032498 | Triclosan | 3380-34-5 | 1 | 1 | antibacterial, antifungal |
| DTXSID8023216 | 3,5,3’-Triiodothyronine | 6893-02-3 | 1 | 1 | thyroid hormone |
| DTXSID7024160 | Lactofen | 77501-63-4 | 1 | 1 | herbicide |
| DTXSID7024241 | Oxyfluorfen | 42874-03-3 | 1 | 1 | herbicide |
| DTXSID7021233 | FD&C Red 3 | 16423-68-0 | 1 | 1 | dye, inactive drug ingredient |
| DTXSID7020970 | Nitrofen | 1836-75-5 | 1 | herbicide | |
| DTXSID2045232 | Tiratricol | 51-24-1 | 1 | byproduct of T3 metabolism, thyroid hormone analogue | |
| DTXSID0032605 | (+−)-Diclofop-methyl | 51338-27-3 | 1 | herbicide | |
| DTXSID1034503 | Cyhalofop-butyl | 122008-85-9 | 1 | herbicide | |
| DTXSID5048186 | Tetrac | 67-30-1 | drug, competes with thyroid hormone (T4) for iodothyronine receptor | ||
| DTXSID7024112 | Fomesafen | 72178-02-0 | herbicide | ||
| DTXSID0020022 | Acifluorfen | 50594-66-6 | herbicide | ||
| DTXSID1041978 | Flufenoxuron | 101463-69-8 | insecticide |
Figure 6.
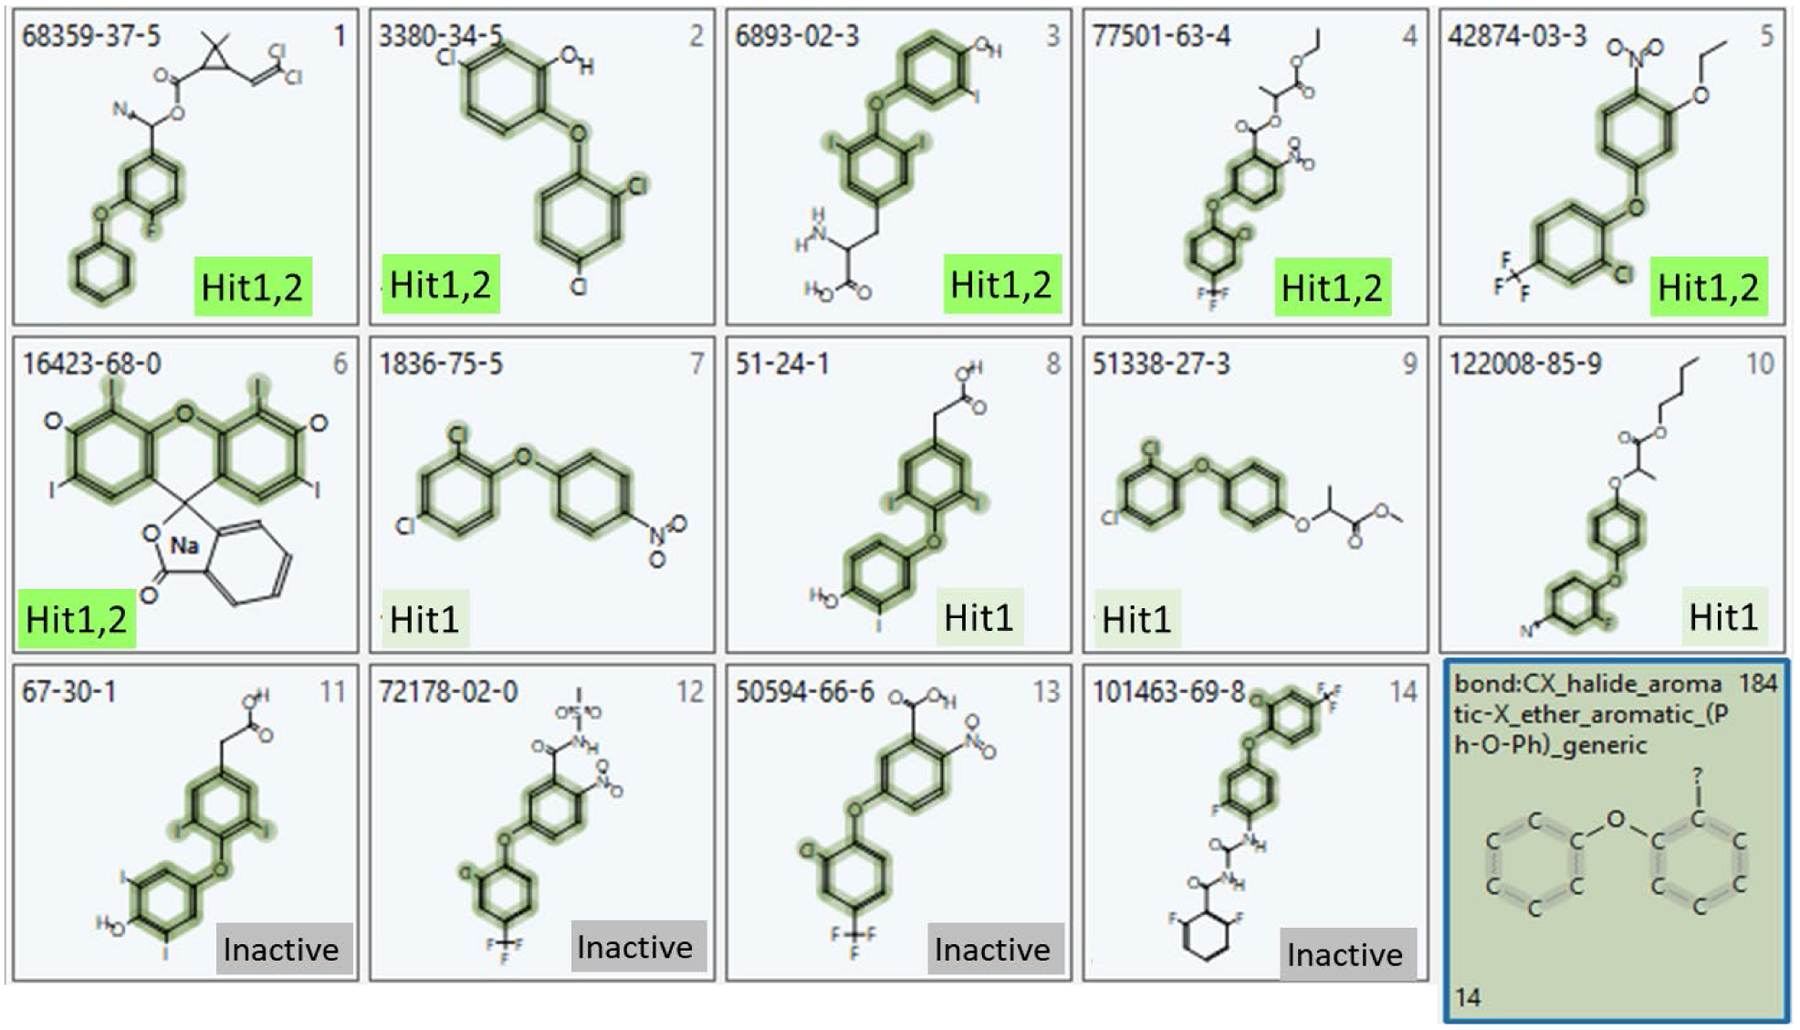
Images of the 14 PhII+e1k structures containing ToxPrint chemotype (Txp_184), bond:CX_halide_aromatic-X_ether_aromatic_(Ph-O-Ph)_generic, labeled by CAS RN and with NIS Hit1 and Hit2 activity status indicated; images were generated using the publicly available Chemotyper, available at https://chemotyper.org/.
The last column entry for Txp_184 in Table 2 indicates that this CT was also found to be significantly enriched (applying the same CTEW and statistical thresholds as this study) in 109 ToxCast/Tox21 assays. These results offer an opportunity to explore possible biological associations of the NIS assay to other ToxCast/Tox21 assays, through the common CT-enrichments, within the local CT subspace. The full list of ToxCast/Tox21 assay enrichments for Txp_184 is provided in Table S8, ordered by statistical significance (Odds ratio and P-value). Among the top 18 assays were 5 Tox21 assay endpoints associated with the TSHR (thyroid stimulating hormone receptor) whose active spaces were also significantly enriched for Txp_184 (Table 4). The significance of these findings is further supported by the relatively low overall hit rates, less than 5%, for each of the 5 assays. Whereas the two “TSHR_wt” (wild type) assays are primarily designed to provide a background control, the Agonist and Antagonist endpoints are potentially more informative of shared structure-activity signal within the Txp_184 CT subspace. This is particularly true of the “TSHR_Antagonist_ratio” assay endpoint given the hit rate (4.4%), which is indicative of assay sensitivity exceeding the mean of ToxCast assays overall. The chemotype-based connection between the NIS and TSHR assay results can help generate hypotheses for potential mechanistic overlap, including the contribution of intracellular signaling to the measure of receptor response.
Table 4.
List of Tox21 assay endpoints whose active space was enriched for ToxPrint chemotype Txp_184, with corresponding chemotype enrichment statistics and overall assay hit rate percentage listed.
| ToxPrint ID | Assay endpoint namea | CT-Totb | TP | FP | FN | TN | Odds Ratio | P-Value | Total Chemsc | Hit Rated |
|---|---|---|---|---|---|---|---|---|---|---|
| Txp-184 | TOX21_TSHR_wt_HTRF_ch1 | 32 | 4 | 28 | 7 | 7506 | 153.18 | 8.6E-08 | 7545 | 0.1% |
| Txp-184 | TOX21_TSHR_Antagonist_ratio | 32 | 9 | 23 | 321 | 7192 | 8.77 | 6.0E-06 | 7545 | 4.4% |
| Txp-184 | TOX21_TSHR_HTRF_Antagonist_ch1 | 32 | 9 | 23 | 333 | 7180 | 8.44 | 8.1E-06 | 7545 | 4.5% |
| Txp-184 | TOX21_TSHR_Agonist_ch2 | 32 | 3 | 29 | 10 | 7503 | 77.62 | 1.9E-05 | 7545 | 0.2% |
| Txp-184 | TOX21_TSHR_wt_ch2 | 32 | 3 | 29 | 10 | 7503 | 77.62 | 1.9E-05 | 7545 | 0.2% |
Details and results of each assay endpoint can be found on the U.S. EPA CompTox Chemical Dashboard by appending the assay name to the end of the Dashboard search URL, as in: https://comptox.epa.gov/dashboard/assay_endpoints?search=TOX21_TSHR_wt_HTRF_ch1.
See legend for Table 2 for definitions of statistics columns 3–9.
Total number of chemicals screened in the assay.
Hit rate percentage is the percentage of assay positives relative to the total number of chemicals screened (Total Chems).
4. Conclusion
This study screened a total of 804 unique ToxCast e1k substances for RAIU inhibition and identified 55 chemicals that actively inhibited RAIU without cytotoxicity. Most of the active chemicals had weak RAIU inhibition, but five chemicals demonstrated moderate to very active inhibition and scored within a factor of 2 of the sodium perchlorate in the cytotoxicity-adjusted potency ranking. A subset of 4 top-ranked chemicals were confirmed using the supplemental FRTL-5 based RAIU assay. With a standardized protocol, RAIU assays performed with expected high reproducibility and reliability, generating comparable data for the e1k library, which completes the screening of ToxCast library for NIS inhibition.
We previously applied a chemotype enrichment workflow to explore structure-activity associations within the NIS PhII Hit1 and Hit2 datasets. Expanded NIS screening of the e1k library provided us with a unique opportunity to examine the prospective predictivity of the PhII results on the e1k library, as well to monitor changes in the CT enrichment profile with the addition of the e1k chemicals. Given the differences seen in the usage list representations and chemical feature profiles of the e1k versus the PhII chemical space, we anticipated that CT enrichments for the expanded PhII+e1k NIS datasets would also be impacted. Despite this, a majority of enriched Hit1 and Hit2 chemotypes identified previously remained enriched after the library expansion from PhII to PhII+e1k. This constitutes independent validation of their significance and potential screening utility. In addition, CTs specifically associated with cytotoxicity activity, both in this study and in cytotoxicity assays independently run in ToxCast/Tox21, were identified that could help explain differences in Hit1 and Hit2 results, as well as further support the validity of the parallel cell viability assay as an integral part of the screening protocol. Finally, we provided an example to illustrate how the CT enrichment results lend themselves to further exploring structure-activity and assay-to-assay associations within a local enriched CT subspace. The NIS Hit1 and Hit2 results generated for the PhII and subsequent e1k inventories, which are summarized in this study, provide modelers with validated assay information pertaining to inhibition of a key biochemical step required for normal thyroid function for a structurally (and presumably, mechanistically) diverse chemical library. It is precisely this chemical diversity, however, that presents challenges to traditional structure-activity approaches that would attempt to generate a global prediction model, i.e. an SAR model that could be broadly used to screen new or existing chemicals for NIS activity. The CT enrichment approach, in contrast, attempts to find stable, structure-activity signals that are amplified within local chemical regions over-represented in the active space. These signals, in turn, can be chemically rationalized and compared to other assay enrichment signals within the same CT region of chemical space to generate hypotheses and build weight-of-evidence arguments for testing prioritization or hazard concern. In practice, this means elevating a level of concern for untested chemicals containing one or more of the indicated enriched CTs and examining the data within the local CT region. This data mining approach, utilizing the publicly available ToxPrints and standard statistical thresholds, is chemically intuitive and easy to apply, visualize and rationalize, unlike many modern computational SAR models, lending itself to use by regulators and non-chemists.
The NIS assay results and CT enrichment results presented herein for the combined PhII+e1k library of approximately 1800 chemicals, spanning many chemicals of biological interest and environmental concern, provide a valuable resource for future research investigations, as well as chart a useful path forward for improving understanding of the local structure-activity determinants and mechanisms potentially impacting thyroid function.
Supplementary Material
Table 1.
Results for the top 15 ranked chemical samples that demonstrated significant RAIU inhibition in multiple-concentration screening (as shown in Fig.1B)
| Chemical | CAS NO. | Max Conc(M)a | AC50 (logM) | absEC50 (logM) | Cytotox pointb | Ranking Scorec | Non-cytotoxic RAIU inhibition at 1 or more concentrationsd | |
|---|---|---|---|---|---|---|---|---|
| 1 | NaBF4 | 13755-29-8 | 1.00E-04 | −5.77 | −5.72 | NA | 168.62 | Yes |
| 2 | Digoxin | 20830-75-5 | 6.75E-05 | −5.95 | −5.93 | −4.07 | 161.46 | Yes |
| 3 | 1,2-Ethanediamine dihydroiodide | 5700-49-2 | 1.00E-04 | −5.15 | −5.09 | NA | 127.52 | Yes |
| 4 | FD&C Red 3 | 16423-68-0 | 6.00E-05 | −6.27 | −6.26 | −5.74 | 127.26 | Yes |
| 5 | Sodium iodide | 7681-82-5 | 1.00E-04 | −5.01 | −4.98 | NA | 127.09 | Yes |
| 6 | N-Phenyl-1-naphthylamine | 90-30-2 | 1.00E-04 | −4.91 | −4.89 | −4.62 | 95.09 | No |
| 7 | PFOSe | 1763-23-1 | 8.40E-05 | −4.60 | −4.59 | NA | 91.77 | Yes |
| 8 | PFOSe | 1763-23-1 | 8.40E-05 | −4.52 | −4.53 | −4.12 | 82.96 | No |
| 9 | Chlorfenapyr | 122453-73-0 | 1.00E-04 | −5.65 | −5.93 | −6.16 | 81.15 | No |
| 10 | Thiocyanic acid, ammonium salt | 1762-95-4 | 1.00E-04 | −4.57 | −4.37 | NA | 81.02 | Yes |
| 11 | Sodium decyl sulfate | 142-87-0 | 1.00E-04 | −4.67 | −4.47 | NA | 80.54 | Yes |
| 12 | Eosin | 17372-87-1 | 9.65E-05 | −4.56 | −4.66 | −5.30 | 80.51 | Yes |
| 13 | Dibutyltin dichloride | 683-18-1 | 1.00E-04 | −5.04 | −4.98 | −4.06 | 78.73 | Yes |
| 14 | Cybutryne | 28159-98-0 | 1.00E-04 | −4.88 | −4.78 | NA | 77.09 | Yes |
| 15 | 5-Chlorosalicylanilide | 4638-48-6 | 1.00E-04 | −5.43 | −4.90 | −4.48 | 71.18 | Yes |
Results for all test chemicals are in Table S1.
Max Conc: the maximum permissible concentration tested in single-concentration screening. The Max Conc was obtained by 200X dilution of the supplied stock chemicals (concentrations ≤ 2×10⁻² M). Serial dilution of samples for multiple-concentration assay started with the Max Conc. NA: not available, as no absEC50 for RAIU was observed.
Cytotox-point: the log concentration where significant reduction in cell viability was observed. NA: non-applicable, as no significant cytotoxicity was observed.
Ranking score normalized to NaClO4 (maximum ranking score of 200).
Non-cytotoxic RAIU inhibition at 1 or more concentrations: Indicates chemicals that have significant RAIU inhibition without significant cytotoxicity at one or more concentrations tested in multiple-concentration screening.
PFOS was tested as duplicate sample and both graphs are shown here to demonstrate assay replication.
Acknowledgements
This research was funded by the Office of Research and Development, U.S. EPA, Washington, DC. The authors thank U.S. EPA scientists Jennifer Olker for reviewing the early draft, Christopher Grulke and Antony Williams for computational chemistry expertise and support, Chihae Yang and colleagues at Molecular Networks-Altamira (MN-AM) for inspirational development of the ToxPrints and Chemotyper used in this study.
Abbreviations
- AOP
adverse outcome pathway
- 3bMAD
three times the baseline median absolute deviation
- CV
coefficient of variation
- CPM
counts per minute
- CT
chemotype
- CTEW
chemotype enrichment workflow
- DCNQ
2,3-dichloro-1,4-napthoquinone
- DMEM
Dulbecco’s Modified Eagle Medium
- DMSO
dimethyl sulfoxide
- 2,4-D
2,4-dichlorophenoxyacetic acid
- EDSP21
Endocrine Disruptor Screening Program in the 21st century
- FDA-GRAS
U.S. Food & Drug Administration’s Generally Regarded as Safe program
- HEK
human embryonic kidney
- HTS
high-throughput screening
- NIS
sodium iodide symporter
- PFOS
perfluorooctanesulfonic acid
- PFOA
perfluorooctanoic acid
- 3IRIS
Integrated Risk Information System
- RAIU
radioactive iodide uptake
- RLU
relative light unit)
- SD
standard deviation
- T3
triiodothyronine
- ToxCast
Toxicity Forecaster
- T4
thyroxine
- TH
thyroid hormone
- TAA
toxicity-adjusted area
Footnotes
Conflict of Interest Statement
The authors declare no conflict of interest.
Publisher's Disclaimer: Disclaimer
The views expressed in this paper are those of the authors and do not necessarily reflect the views or policies of the U.S. Environmental Protection Agency.
Supporting Information
SI. Tables. xlsx, SI Methods and Figures.docx, SI. File 1 Dose-response curves.pdf.
References
- Brucker-Davis F (1998) Effects of Environmental Synthetic Chemicals on Thyroid Function. Thyroid : official journal of the American Thyroid Association 8(9):827–856 doi: 10.1089/thy.1998.8.827 [DOI] [PubMed] [Google Scholar]
- Buckalew AR, Wang J, Murr AS, et al. (2020) Evaluation of potential sodium-iodide symporter (NIS) inhibitors using a secondary Fischer rat thyroid follicular cell (FRTL-5) radioactive iodide uptake (RAIU) assay. Archives of Toxicology 94(3):873–885 doi: 10.1007/s00204-020-02664-y [DOI] [PMC free article] [PubMed] [Google Scholar]
- Capen CC, Martin SL (1989) The Effects of Xenobiotics on the Structure and Function of Thyroid Follicular and C-Cells. Toxicologic Pathology 17(2):266–293 doi: 10.1177/019262338901700205 [DOI] [PubMed] [Google Scholar]
- Carrasco N (1993) Iodide transport in the thyroid gland. Biochimica et Biophysica Acta (BBA) - Reviews on Biomembranes 1154(1):65–82 doi: 10.1016/0304-4157(93)90017-I [DOI] [PubMed] [Google Scholar]
- Collins FS, Gray GM, Bucher JR (2008) Transforming Environmental Health Protection. Science 319(5865):906–907 doi: 10.1126/science.1154619 [DOI] [PMC free article] [PubMed] [Google Scholar]
- Crofton KM (2008) Thyroid disrupting chemicals: mechanisms and mixtures. International Journal of Andrology 31(2):209–223 doi: 10.1111/j.1365-2605.2007.00857.x [DOI] [PubMed] [Google Scholar]
- Darrouzet E, Lindenthal S, Marcellin D, Pellequer JL, Pourcher T (2014) The sodium/iodide symporter: state of the art of its molecular characterization. Biochimica et biophysica acta 1838(1 Pt B):244–53 doi: 10.1016/j.bbamem.2013.08.013 [DOI] [PubMed] [Google Scholar]
- Dix DJ, Houck KA, Martin MT, Richard AM, Setzer RW, Kavlock RJ (2006) The ToxCast Program for Prioritizing Toxicity Testing of Environmental Chemicals. Toxicological Sciences 95(1):5–12 doi: 10.1093/toxsci/kfl103 [DOI] [PubMed] [Google Scholar]
- Ghassabian A, Trasande L (2018) Disruption in Thyroid Signaling Pathway: A Mechanism for the Effect of Endocrine-Disrupting Chemicals on Child Neurodevelopment. Frontiers in Endocrinology 9(204) doi: 10.3389/fendo.2018.00204 [DOI] [PMC free article] [PubMed] [Google Scholar]
- Hallinger DR, Murr AS, Buckalew AR, Simmons SO, Stoker TE, Laws SC (2017) Development of a screening approach to detect thyroid disrupting chemicals that inhibit the human sodium iodide symporter (NIS). Toxicology in Vitro 40:66–78 doi: 10.1016/j.tiv.2016.12.006 [DOI] [PubMed] [Google Scholar]
- Horn S, Kersseboom S, Mayerl S, et al. (2013) Tetrac Can Replace Thyroid Hormone During Brain Development in Mouse Mutants Deficient in the Thyroid Hormone Transporter Mct8. Endocrinology 154(2):968–979 doi: 10.1210/en.2012-1628 [DOI] [PubMed] [Google Scholar]
- Hornung MW, Korte JJ, Olker JH, et al. (2018) Screening the ToxCast Phase 1 Chemical Library for Inhibition of Deiodinase Type 1 Activity. Toxicological Sciences 162(2):570–581 doi: 10.1093/toxsci/kfx279 [DOI] [PMC free article] [PubMed] [Google Scholar]
- Jennings AS, Schwartz SL, Balter NJ, Gardner D, Witorsch RJ (1990) Effects of oral erythrosine (2′,4′,5′,7′-tetraiodofluorescein) on the pituitary-thyroid axis in rats. Toxicology and Applied Pharmacology 103(3):549–556 doi: 10.1016/0041-008X(90)90327-Q [DOI] [PubMed] [Google Scholar]
- Judson R, Houck K, Martin M, et al. (2016) Editor’s Highlight: Analysis of the Effects of Cell Stress and Cytotoxicity on In Vitro Assay Activity Across a Diverse Chemical and Assay Space. Toxicological Sciences 152(2):323–339 doi: 10.1093/toxsci/kfw092 [DOI] [PMC free article] [PubMed] [Google Scholar]
- N’Guessan R, Boko P, Odjo A, Akogbéto M, Yates A, Rowland M (2007) Chlorfenapyr: A pyrrole insecticide for the control of pyrethroid or DDT resistant Anopheles gambiae (Diptera: Culicidae) mosquitoes. Acta Tropica 102(1):69–78 doi: 10.1016/j.actatropica.2007.03.003 [DOI] [PubMed] [Google Scholar]
- Noyes PD, Friedman KP, Browne P, et al. (2019) Evaluating Chemicals for Thyroid Disruption: Opportunities and Challenges with in Vitro Testing and Adverse Outcome Pathway Approaches. Environmental Health Perspectives 127(9):095001 doi: 10.1289/EHP5297 [DOI] [PMC free article] [PubMed] [Google Scholar]
- Olker JH, Haselman JT, Kosian PA, et al. (2018) Evaluating Iodide Recycling Inhibition as a Novel Molecular Initiating Event for Thyroid Axis Disruption in Amphibians. Toxicological Sciences 166(2):318–331 doi: 10.1093/toxsci/kfy203 [DOI] [PMC free article] [PubMed] [Google Scholar]
- Olker JH, Korte JJ, Denny JS, et al. (2019) Screening the ToxCast Phase 1, Phase 2, and e1k Chemical Libraries for Inhibitors of Iodothyronine Deiodinases. Toxicological Sciences 168(2):430–442 doi: 10.1093/toxsci/kfy302 [DOI] [PMC free article] [PubMed] [Google Scholar]
- Paul Friedman K, Watt ED, Hornung MW, et al. (2016) Tiered High-Throughput Screening Approach to Identify Thyroperoxidase Inhibitors Within the ToxCast Phase I and II Chemical Libraries. Toxicological Sciences 151(1):160–180 doi: 10.1093/toxsci/kfw034 [DOI] [PMC free article] [PubMed] [Google Scholar]
- Richard AM, Judson RS, Houck KA, et al. (2016) ToxCast Chemical Landscape: Paving the Road to 21st Century Toxicology. Chemical Research in Toxicology 29(8):1225–1251 doi: 10.1021/acs.chemrestox.6b00135 [DOI] [PubMed] [Google Scholar]
- U.S.EPA (2003) Chlorfenapyr; Notice of Filing a Pesticide Petition to Establish a Tolerance for a Certain Pesticide Chemical in or on Food. In: Federal Register. https://www.federalregister.gov/d/03-17900 [Google Scholar]
- Wang J, Hallinger DR, Murr AS, et al. (2019) High-throughput screening and chemotype-enrichment analysis of ToxCast phase II chemicals evaluated for human sodium-iodide symporter (NIS) inhibition. Environment International 126:377–386 doi: 10.1016/j.envint.2019.02.024 [DOI] [PMC free article] [PubMed] [Google Scholar]
- Wang J, Hallinger DR, Murr AS, et al. (2018) High-Throughput Screening and Quantitative Chemical Ranking for Sodium-Iodide Symporter Inhibitors in ToxCast Phase I Chemical Library. Environmental Science & Technology 52(9):5417–5426 doi: 10.1021/acs.est.7b06145 [DOI] [PMC free article] [PubMed] [Google Scholar]
- Watford S, Ly Pham L, Wignall J, Shin R, Martin MT, Friedman KP (2019) ToxRefDB version 2.0: Improved utility for predictive and retrospective toxicology analyses. Reproductive Toxicology 89:145–158 doi: 10.1016/j.reprotox.2019.07.012 [DOI] [PMC free article] [PubMed] [Google Scholar]
- Yang C, Tarkhov A, Marusczyk J, et al. (2015) New Publicly Available Chemical Query Language, CSRML, To Support Chemotype Representations for Application to Data Mining and Modeling. Journal of Chemical Information and Modeling 55(3):510–528 doi: 10.1021/ci500667v [DOI] [PubMed] [Google Scholar]
- Zhang J-H, Chung TDY, Oldenburg KR (1999) A Simple Statistical Parameter for Use in Evaluation and Validation of High Throughput Screening Assays. Journal of biomolecular screening 4(2):67–73 doi: 10.1177/108705719900400206 [DOI] [PubMed] [Google Scholar]
Associated Data
This section collects any data citations, data availability statements, or supplementary materials included in this article.