

Abstract
Objectives:
The National Quality Forum (NQF) recently endorsed the first clinical performance measures for contraceptive care. We present data demonstrating that the measures meet the NQF’s criterion “importance to measure and report.”
Study design:
We summarized national contraceptive care initiatives, epidemiologic data documenting the reproductive health burden and the scientific literature examining the association between contraceptive use and unintended pregnancy. In addition, we analyzed contraceptive use data from the National Survey of Family Growth (2013–2015) and the Pregnancy Risk Assessment Monitoring System (2012–2013).
Results:
Five Federal agencies lead national initiatives, and two Institute of Medicine reports highlight the centrality of reproductive health outcomes for the health of women and infants. Two literature reviews demonstrate that the type of contraception used is associated with risk of unintended pregnancy. Fifty-three percent of adolescents (15–19 years) and 40% of adult women (20–44 years) at risk of unintended pregnancy are not using a most or moderately effective contraceptive method; in the postpartum period, one third of adolescents (≤19 years) and 44% of adult women (≥20 years) are not using these methods.
Conclusions:
The new contraceptive care measures meet the NQF criterion for “importance to measure and report.” The measures are based on evidence that contraceptive use is associated with reproductive health outcomes, and there is a substantial performance gap in the use of most and moderately effective methods.
Implications:
Using the new contraceptive care measures may motivate providers to increase access to contraceptive care, thereby improving health outcomes.
Keywords: Contraceptive care, Healthcare quality, Performance measures, National Quality Forum, Office of Population Affairs
1. Introduction
Clinical performance measures provide information needed to drive improvement in healthcare quality, facilitate informed consumer choices, influence payment strategies and improve health outcomes [1–3]. In recent years, the healthcare field has paid increased attention to performance measurement as part of an effort to improve healthcare quality and strengthen value-based payment. Yet, the lack of clinical performance measures for contraceptive care limited the ability of the family planning field to advance in this way.
A first step toward addressing this gap in performance measurement for contraceptive care occurred in the fall of 2016, when the National Quality Forum (NQF) endorsed the first clinical performance measures for contraceptive care (Table 1). The primary measures estimate that the percentage of women at risk of unintended pregnancy provided a most (female sterilization, intrauterine device/system, implant) or moderately (injectable, pill, patch, ring, diaphragm) effective method of contraception, with a goal of achieving higher levels of provision of these methods, which is consistent with research showing that many women consider the effectiveness a very important factor in their choice of contraception [4–7]. Submeasures focus on the percentage of women who are provided long-acting reversible methods of contraception (LARC, i.e., intrauterine devices and implants), which are intended to be used as a measure of access to LARC [8]: low levels of provision (e.g., less than 2%) may indicate limited access to LARC. These measures address two populations of women: all women at risk of unintended pregnancy (i.e., those who have ever had sex, are fecund and neither pregnant nor seeking pregnancy) and women in the postpartum period. The postpartum measures assess provision of contraception in the 3 days and 60 days after delivery. For postpartum contraception provision, the 3-day period reflects US Centers for Disease Control and Prevention (CDC) and American College of Obstetricians and Gynecologists (ACOG) recommendations that the immediate postpartum insertion (i.e., at delivery, while the woman is in the hospital) is a safe time to provide contraception; the 60-day period reflects ACOG recommendations that women should receive contraceptive care by the 6-week postpartum visit [9–11].
Table 1.
Contraceptive care measures endorsed by the NQF in 2016
| NQF 2902: The percentage of women who had a live birth provided a: |
|
| NQF 2903: The percentage of women at risk of unintended pregnancy** that is provided a most or moderately effective contraceptive method (intermediate outcome measure)* |
| NQF 2904: The percentage of women at risk of unintended pregnancy** that is provided a LARC method (access measure) |
| Detailed specifications for the measures, along with guidance on how to interpret and use them appropriately, are available in an online appendix at: [insert]. They can also be found at: https://www.hhs.gov/opa/performance-measures/index.html |
The most effective contraceptive methods include contraceptive sterilization (tubal sterilization and vasectomy) and LARC (i.e., intrauterine devices and implants). Less than 1 in 100 women using these methods will get pregnant during the first year of typical use. Moderately effective contraceptive methods include injectables, pills, patch, ring and diaphragm. Approximately 6 to 12 per 100 women using these methods will get pregnant during the first year of typical use.
Women are considered at risk for unintended pregnancy if they have ever had sex, are fecund and are neither pregnant nor seeking pregnancy.
Before being endorsed by NQF, measures must meet rigorous evaluation criteria, including importance to measure and report, scientific acceptability, feasibility and usability in addition to showing that they do not duplicate other measures [12]. This paper presents data demonstrating that the NQF contraceptive care measures meet the first criterion, that is, importance to measure and report. This is defined by NQF as “the extent to which the measure focus is evidence-based and important to making significant gains in healthcare quality where there is variation in or overall less-than-optimal performance.” Data demonstrating how the measures meet the other criteria are presented elsewhere [13].
2. Study design
There are three components to the “importance to measure and report” criterion [12,14]. The first is that the measure has been identified as a priority by the US Department of Health and Human Services (USDHHS) and/or the health topic has high impact, for example, affects large numbers of patients, is a leading cause of morbidity/mortality, has high resource use, severity of illness and/or has severe patient/societal consequences of poor quality.1 The second is that the measure is evidence-based, that is, that measured outcome leads to a desired health outcome. The third component is that there is a performance gap, that is, demonstration of opportunity for improvement.
To document that the measures address a national health priority, we (a) identified recent Federal and Institute of Medicine (IOM) initiatives related to contraceptive care; and (b) summarized data documenting the health burden of adolescent and unintended pregnancy and closely spaced births.
To document the evidence that contraceptive care is associated with health outcomes, we developed a logic model that shows how the structure and process of contraceptive care can influence the long-term outcomes of interest, that is, adolescent and unintended pregnancy and closely spaced births. We then reviewed the scientific literature that examined the evidence for the pathways in the logic model. The NQF application was based on the association between contraceptive method use and reproductive health outcomes.
To document the presence of a performance gap, we analyzed data from two national surveys that include questions about contraceptive care. Although the NQF measures are designed for use with claims data aggregated at various reporting levels (e.g., health clinic, health plan, public health region), the use of population-based data can demonstrate gaps in performance for contraceptive care across the country as a whole.
The first analysis used the National Survey of Family Growth (NSFG), 2013–2015 (n=5699 females), to examine contraceptive use patterns among women who were at risk of unintended pregnancy (i.e., had ever had sex, were fecund and were neither pregnant nor seeking pregnancy; n=4205). The NSFG is conducted by CDC’s National Center for Health Statistics (NCHS). It is a nationally representative survey of women and men ages 15–44 years that collects information on family life, marriage and divorce, pregnancy, infertility, use of contraception and related topics [15].
The second analysis used the Pregnancy Risk Assessment Monitoring System (PRAMS), 2012–2013, to document contraceptive use among postpartum women. PRAMS data are collected 2 to 6 months after delivery and, may, overestimate actual contraceptive use at 60 days postdelivery; furthermore, they do not estimate rates at 3 days postpartum. Jurisdictions were included if they met the response rate threshold of 65% (n=68,911).2 The analytic sample (n=63,964) excluded respondents who were currently pregnant (n=434), trying to get pregnant (n=2074) and those with missing responses on current contraception (yes/ no) (n=1427) or no specified method (n=1012). PRAMS is a surveillance project of CDC and state health departments, which collects state-specific, population-based data on maternal attitudes and experiences before, during and shortly after pregnancy, and covers about 83% of all US births [16].
Both analyses measured current method use, with priority given to the most effective method women reported according to the hierarchy established by Trussell [17]. The results were stratified by sociodemographic characteristics (age, race/ethnicity, marital status, income, insurance status, parity and education) to identify potential disparities that may have implications for quality improvement. Statistical differences between sociodemographic subgroups were identified using univariate regression analysis (pb.05).
3. Results
3.1. Priority
Five national agencies lead initiatives to address the prevention of adolescent and unintended pregnancy and/or reduction of short interpregnancy intervals (Table 2). These initiatives were located in the USDHHS and included Healthy People 2020, the National Prevention Strategy, the Center for Medicaid and CHIP Services’ (CMCS) Maternal and Infant Health Initiative, CDC’s Teen Pregnancy Winnable Battle and 6/18 Initiatives and the Maternal and Child Health Bureau’s Infant Mortality Collaborative Improvement and Innovation Network [18–25]. In addition, two recent reports published by IOM Committees highlighted the prevention of teen and unintended pregnancy: one included unintended pregnancy as a “core metric” for all health systems to monitor, and the second included contraceptive care as an essential health service important for women’s health.
Table 2.
Recent national initiatives that demonstrate the importance of contraceptive access
| Initiative | Description |
|---|---|
| Healthy People 2020, USDHHS [24] |
Healthy People 2020 include 15 objectives focused on unintended pregnancy and use of contraception: |
| |
| National Prevention Strategy, USDHHS (2011) [25] | The United States National Prevention Strategy notes that “planning and having a healthy pregnancy is vital to the health of women, infants, and families and is especially important in preventing teen pregnancy and childbearing, which will help raise educational attainment, increase employment opportunities, and enhance financial stability”. |
| CMCS Maternal and Infant Health Initiative, USDHHS [18] | Nearly two out of every three adult women enrolled in Medicaid are in their reproductive years, and Medicaid currently finances about 45% of all births in the United States. |
| Recognizing this, the CMCS has developed the Maternal and Infant Health initiative to improve the quality of maternity care, birth outcomes and how care is delivered to women. CMCS will collect and report data on the new contraceptive care measures to help states track the use of most and moderately effective methods of contraception and drive changes in care practices and delivery. | |
| CDC’s Teen pregnancy winnable battle and the 6/18 initiative, USDHHS [19,20] | In 2010, CDC included adolescent pregnancy prevention as one of six “winnable battles,” which are health issues that are of high national concern, carry a significant health burden, affect many people and incurred considerable costs and for which known effective strategies exist that can be employed to help lessen the burden. |
| A related national effort, called the 6/18 initiative, included the prevention of unintended pregnancy; in this initiative, CDC partnered with health care purchasers, payers and providers to increase the coverage, access, utilization and quality of proven interventions and align the evidence-based preventive practices with emerging value-based payment and delivery models. | |
| Maternal and Child Health Bureau’s Infant Mortality Collaborative Improvement & Innovation Network (CoIIN), USDHHS [23] | The Maternal and Child Health Bureau included the prevention of adolescent/unintended pregnancy and improved birth spacing in its Infant Mortality CoIIN as one component of a strategy to reduce rates of infant mortality by promoting excellent health for women before, after and in between pregnancies. |
| IOM (2015) Vital Signs: Core Metrics for Health and Health Care Progress [22] | In 2015, the IOM recognized the importance of unintended pregnancy when it was included as one of 15 core measures that constitute the most vital signs for the nation’s health and health care. |
| The IOM noted that “unintended pregnancy presents a significant challenge for both individual and community health…. it is the most direct available measure of women’s ability to choose the number and timing of their pregnancies. As such, it is a measure that aggregates a variety of social, behavioral, cultural and health factors, particularly the availability and use of both knowledge and tools for family planning.” | |
| The committee further noted that “contraceptive use was a related priority measure for unintended pregnancy.” | |
| IOM (2011). Clinical Preventive Services for Women: Closing the Gaps [21] | The IOM included contraceptive services as one of the essential clinical preventive services that are important to women’s health and well-being, which should be included in the development of comprehensive guidelines. |
These initiatives are grounded in epidemiologic data documenting the health, economic and social burden of unintended pregnancy. Of the 310 million people in the United States, 62 million (20%) are women of reproductive age, 15–44 years [26], of which 38 million are in need of contraceptive services because they are at risk for unintended pregnancy [27]. Yet, historically many women at risk for unintended pregnancy have not used contraception, have used a less effective method, or used methods inconsistently [28,29]. Consistent with these patterns of contraceptive use, almost half (45%) of the nearly 7 million pregnancies each year in the United States are unintended [30], and nearly two thirds of all pregnancies are spaced more closely than the recommended 18-month interval [31]. Each year, about 600,000 adolescents aged 15–19 years become pregnant, and in 2015, almost 230,000 adolescents gave birth [32,33].
The consequences of closely spaced births and unintended and adolescent pregnancy are wide ranging and include a higher rate of preterm and/or low birth weight infants [34–38]. In addition, women who give birth the first time as adolescents have been found to attain lower levels of education and income; their children may also attain lower levels of educational and experience higher rates of negative health outcomes such as poorer health, adolescent pregnancy (for female children of adolescent mothers) and incarceration for male children [37,39]. Taxpayers also pay a high price. Forty-eight percent of births in the US are publicly funded, the direct medical cost of publicly funded births was estimated at US$21 billion per year [40], and the cost of adolescent pregnancy alone has been estimated at US$9.4 billion in 2010 [41]. Conversely, numerous studies have documented the cost-effectiveness of contraception, with up to US$5 saved for every US$1 invested [42–45].
3.2. Evidence of association with health outcomes
Fig. 1 shows the pathway by which improving the structure and process of contraceptive care can lead to the intermediate outcomes of increased contraceptive provision and use, which in turn lead to longer term health outcomes, that is, reduced rates of teen and unintended pregnancy and closely spaced births. Since clinical performance measures assess both system and clinician behavior, the measures document contraceptive access at the health system level and what contraceptive methods were provided by the healthcare worker so that the client could subsequently use those methods. Provision of LARC methods is considered one measure of access, which is a function of both the structure and process of care (e.g., the methods must be available when needed and affordable to the client).
Fig. 1.
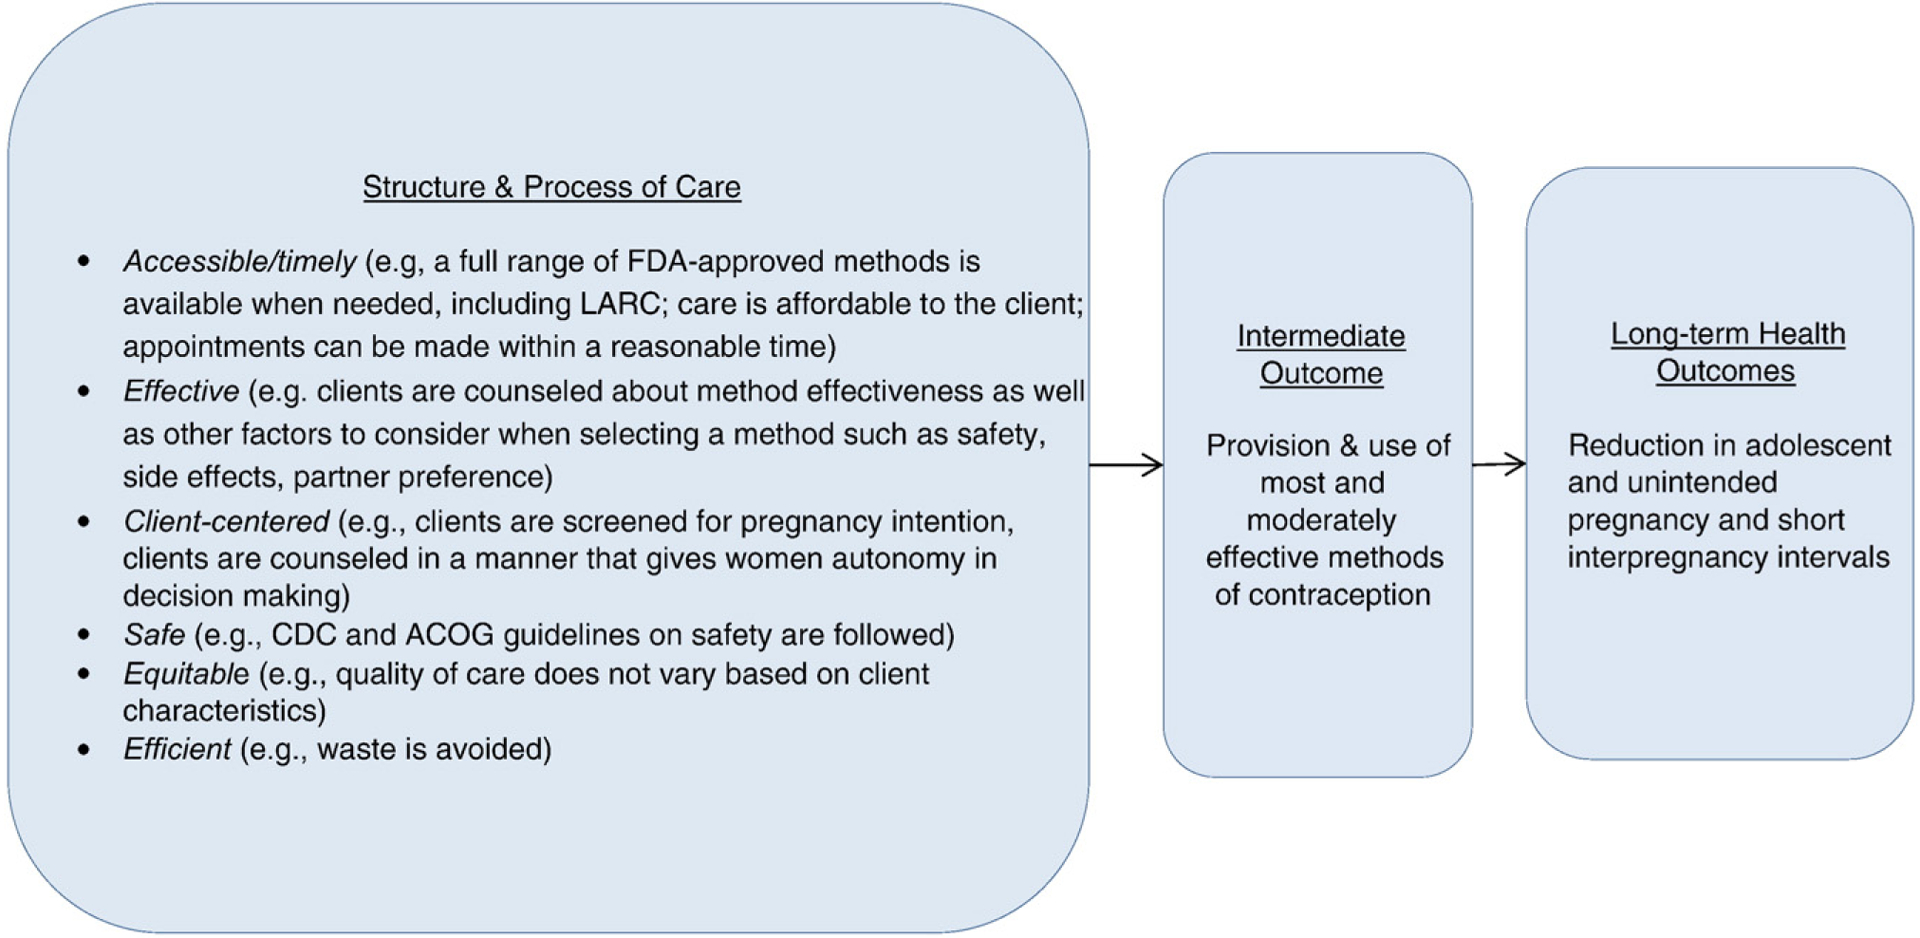
A logic model illustrating relationships between the structure and process of care with intermediate and long-term outcomes.
Clinical guidelines from key professional medical associations and Federal agencies inform the structure and process of quality contraceptive care. ACOG [11,46], the American Academy of Pediatrics [47], CDC and the US Office of Population Affairs (OPA) [48] encourage providers to counsel clients about method effectiveness and other important method characteristics (such as menstrual changes, how the method is used, partner preference) [4–7]. To ensure women’s autonomy in decision-making about the contraceptive method that is best for her, CDC-OPA recommendations describe how to counsel clients in a client-centered, noncoercive manner [48]. The guidelines also provide information about the safety of methods when used by women with different medical conditions and characteristics and how providers should address a select group of common, yet sometimes complex, issues regarding initiation and use of specific contraceptive methods [10,49].
A large body of evidence shows that the type of contraceptive method used by a woman is associated with risk of teen and unintended pregnancy and interbirth intervals. Systematic reviews compiled evidence from nearly 500 publications, including several randomized controlled trials [50,51]. Key findings indicate that the most effective methods (LARC and sterilization) have a failure rate that is less than 1% per year under typical use; the moderately effective methods (shot, pill, patch, ring or diaphragm) have a typical failure rate of 6–12% per year; the least effective methods have a typical failure rate of 18–28%; and using no method at all has a failure rate of 85% [50].
Results from two recent intervention studies provided additional evidence that addressing characteristics of the structure and processes of care (e.g., contraceptive counseling, removing cost barriers, provider training) increases utilization of the most effective contraceptive methods and reduces unintended pregnancy risk. The first was a prospective cohort study in which participants were counseled about the relative effectiveness of different contraceptive methods and provided their choice of reversible contraception at no cost; 75% of participants chose a LARC method, and at follow-up, the contraceptive failure rate among participants using pills, patch or ring was 4.6 per 100 participant–years compared with 0.3 among participants using LARC [52]. The second study was a cluster-randomized trial in which 20 clinics were randomly assigned to receive training on LARC provision and 20 to standard care, with usual costs for contraception maintained; more women in the intervention group selected a LARC during the clinic visit compared to the control group (28% vs. 17%); and at the 12 month follow up, there was a lower pregnancy rate in the intervention group (7.9 vs. 15.4 per 100 person– years) [53].
3.3. Performance gap
The NSFG analysis showed that overall, 47.3% of adolescents (15–19 years) and 59.2% of adult women (20–44 years) at risk of unintended pregnancy used a most or moderately effective method (Table 3). Most or moderately effective method use was lower among adolescents compared to adult women (47.3% vs. 59.2%), Hispanic, non-Hispanic Black and non-Hispanic women of other races compared to non-Hispanic White women (56.4%, 51.2%, 48.1% vs. 62.7%, respectively), never married compared to married women (51.8% vs. 63.4%) and women with no children compared to women with 2 and 3+ children (49.6% vs. 65.5% and 73.8%, respectively). There were no significant differences in use of most and moderately effective methods by income or educational level. No subgroup of women had rates of LARC use that were exceptionally low, that is, defined by OPA as less than 2% (Table 3).
Table 3.
Percentage of women 15–44 years of age at risk of unintended pregnancy* that reported use of a most or moderately effective or LARC method of contraception, NSFG, 2013–2015
| Frequency | Weighted frequency | Most or moderately effective method use | p value | LARC use | p value | |
|---|---|---|---|---|---|---|
| Age | ||||||
| 15–19 | 384 | 3,572,324 | 47.3 (40.7, 53.9) | 0.001 | 7.8 (4.4, 13.3) | 0.08 |
| 20–44 | 3821 | 42,965,123 | 59.3 (57.2, 61.3) | Ref | 12.3 (10.8, 13.9) | Ref |
| Race/Ethnicity | ||||||
| Hispanic | 996 | 9,379,086 | 56.4 (53.5, 59.3) | 0.01 | 14.1 (11.3, 17.3) | 0.16 |
| Non-Hispanic (NH) White | 1963 | 26,047,219 | 62.7 (59.6, 65.7) | Ref | 11.7 (9.7, 14.1) | Ref |
| NH Black | 833 | 6,319,613 | 51.2 (46.6, 55.8) | <0.001 | 10.5 (7.9, 13.9) | 0.52 |
| NH Other | 413 | 4,791,529 | 48.1 (41.6, 54.7) | <0.001 | 10.5 (7.3, 15.0) | 0.57 |
| Marital status | ||||||
| Married | 1375 | 19,195,729 | 63.4 (59.4, 67.1) | Ref | 12.6 (10.0, 15.7) | Ref |
| Widowed/Divorced/Separated | 614 | 5,920,112 | 65.9 (61.3, 70.1) | 0.41 | 10.1 (7.1, 14.1) | 0.25 |
| Never married | 2216 | 21,421,606 | 51.8 (48.8, 54.8) | <0.001 | 11.8 (9.9, 14.2) | 0.69 |
| Federal poverty level | ||||||
| < 100% | 1410 | 12,783,399 | 55.7 (52.4, 58.8) | 0.26 | 12.1 (9.7, 15.1) | 0.30 |
| 100–299% | 1553 | 17,101,053 | 59.8 (56.4, 63.1) | 0.79 | 13.4 (11.0, 16.2) | 0.14 |
| 300–399% | 408 | 5,087,980 | 59.1 (52.7, 65.3) | 0.96 | 10.4 (7.5, 14.3) | 0.93 |
| ≥ 400% | 834 | 11,565,015 | 58.9 (54.0, 63.8) | Ref | 10.2 (7.5, 13.8) | Ref |
| Parity | ||||||
| 0 | 1530 | 17,432,878 | 49.6 (45.6, 53.5) | Ref | 6.6 (4.9, 8.9) | Ref |
| 1 | 826 | 8,279,120 | 49.1 (44.0, 54.1) | 0.88 | 19.2 (15.0, 24.2) | <0.001 |
| 2 | 962 | 10,958,912 | 65.5 (61.8, 69.0) | <0.001 | 16.3 (13.4, 19.8) | <0.001 |
| 3+ | 887 | 9,866,538 | 73.8 (68.3, 78.6) | <0.001 | 10.4 (8.1, 13.2) | 0.01 |
| Insurance coverage | ||||||
| Continuous | 3054 | 35,162,850 | 60.6 (57.9, 63.3) | Ref | 11.8 (9.9, 14.1) | Ref |
| Gaps in coverage | 560 | 5,553,876 | 51.7 (45.4, 57.9) | 0.02 | 11.8 (8.7, 15.9) | 0.99 |
| No coverage | 581 | 5,737,582 | 51.1 (46.2, 56.1) | 0.004 | 12.8 (9.2, 17.4) | 0.69 |
| Education | ||||||
| Less than high school | 666 | 6,091,303 | 60.0 (55.3, 64.5) | 0.51 | 12.1 (8.2, 17.5) | 0.89 |
| High school or GED | 1109 | 11,180,419 | 57.5 (52.4, 62.4) | 0.76 | 10.5 (7.9, 13.7) | 0.29 |
Women were considered at risk of unintended pregnancy if they had ever had sex, were fecund, and neither pregnant nor seeking pregnancy.
Patterns and levels of utilization differed among women in the postpartum period. The PRAMS analysis showed that overall, 67.5% of adolescents (≤19 years) and 53.2% of adult women (≥20 years) with a recent live birth used a most or moderately effective method (Table 4). Use of most or moderately effective methods was lower among adult compared to adolescent women (53.2% vs. 67.5%), married compared to unmarried (49.6% vs. 61.4%), women with incomes≥400% Federal Poverty Level compared to women with incomes 200– 399%, 100–199% andb100% (47.3% vs. 51.2%, 55.1% and 59.4%, respectively), uninsured compared to insured (51.7% vs. 54.6%), women with no children compared to women with two children (52.7% vs. 58.2%) and women with some college or more education compared to those with less than high school or high school/Test of General Educational Development (GED) (51.8% vs. 54.2% and 60.4%, respectively). Use of most or moderately effective methods was lower among non-Hispanic/other but higher among non-Hispanic Black compared to non-Hispanic White women (40.3%, 60.3% vs. 55.0%). No subgroup of women had rates of LARC use that were exceptionally low.
Table 4.
Percentage of women with a recent live birth that reported use of a most or moderately effective or a LARC method of contraception, PRAMS, 2012–2013*
| Frequency | Weighted frequency | Most or moderately effective method† | p value | LARC use‡ | p value | |
|---|---|---|---|---|---|---|
| Overall | 35,729 | 1,704,197 | 54.1 (53.6, 54.7) | 15.5 (15.0, 15.9) | ||
| Age | ||||||
| ≤ 19 | 4917 | 198,934 | 67.5 (65.2, 69.6) | <0.001 | 26.1 (24.1, 28.2) | <0.001 |
| ≥ 20 | 59,045 | 2,948,440 | 53.2 (52.6, 53.9) | Ref | 14.7 (14.3, 15.2) | Ref |
| Race/Ethnicity | ||||||
| Hispanic | 10,729 | 495,917 | 54.3 (52.8, 55.7) | 0.35 | 18.5 (17.5, 19.6) | <0.001 |
| NH White | 30,029 | 1,900,280 | 55.0 (54.3, 55.8) | Ref | 15.1 (14.6, 15.7) | Ref |
| NH Black | 10,349 | 415,052 | 60.3 (58.6, 62.0) | <0.001 | 15.4 (14.1, 16.6) | 0.75 |
| NH Other | 10,528 | 301,699 | 40.3 (38.7, 42.0) | <0.001 | 12.4 (11.4, 13.4) | <0.001 |
| Marital status | ||||||
| Married | 37,622 | 1,934,714 | 49.6 (48.9, 50.3) | Ref | 13.2 (12.7, 13.7) | Ref |
| Not married¶ | 26,292 | 1,211,206 | 61.4 (60.5, 62.4) | <0.001 | 19.1 (18.3, 19.8) | <0.001 |
| Federal poverty level | ||||||
| < 100% | 23,289 | 1,030,054 | 59.4 (58.3, 60.4) | <0.001 | 18.6 (17.8, 19.4) | <0.001 |
| 100–199% | 12,754 | 594,438 | 55.1 (53.8, 56.5) | <0.001 | 17.2 (16.2, 18.3) | <0.001 |
| 200–399% | 10,227 | 506,730 | 51.2 (49.8, 52.6) | <0.001 | 13.7 (12.8, 14.7) | <0.001 |
| > 400% | 12,518 | 720,290 | 47.3 (46.1, 48.5) | Ref | 11.3 (10.6, 12.1) | Ref |
| Insurance coverage | ||||||
| Yes | 53,084 | 2,597,847 | 54.6 (53.9, 55.2) | Ref | 15.0 (14.5, 15.5) | Ref |
| No | 9049 | 460,748 | 51.7 (50.1, 53.3) | 0.001 | 17.7 (16.5, 19.0) | <0.001 |
| Parity | ||||||
| 0 | 26,239 | 1,264,081 | 52.7 (51.7, 53.6) | Ref | 15.7 (15.0, 16.4) | Ref |
| 1 | 19,846 | 1,024,995 | 53.9 (52.9, 55.0) | 0.08 | 16.6 (15.8, 17.3) | 0.10 |
| 2 | 10,084 | 502,277 | 58.2 (56.7, 59.6) | <0.001 | 14.7 (13.7, 15.7) | 0.10 |
| 3+ | 7523 | 340,898 | 54.6 (52.8, 56.4) | 0.06 | 12.4 (11.3, 13.6) | <0.001 |
| Education | ||||||
| Less than high school | 9116 | 423,058 | 54.2 (52.5, 55.9) | 0.008 | 16.0 (14.9, 17.3) | 0.02 |
| High school or GED | 15,987 | 742,275 | 60.4 (59.2, 61.7) | <0.001 | 17.4 (16.5, 18.3) | <0.001 |
| Some college or more | 37,944 | 1,949,642 | 51.8 (51.1, 52.5) | Ref | 14.6 (14.1, 15.1) | Ref |
Includes the following jurisdictions: Arkansas, Arizona, Colorado, Delaware, Georgia, Hawaii, Iowa, Illinois, Maryland, Massachusetts, Maine, Michigan, Minnesota, Montana, Nebraska, New Hampshire, New Jersey, New Mexico, New York, Ohio, Oklahoma, Oregon, Pennsylvania, Rhode Island, Tennessee, Utah, Vermont, Washington, Wisconsin, Wyoming, and New York City.
Defined as tubal ligation, vasectomy, intrauterine system, implant, shot, pill, patch or ring.
LARC; defined as intrauterine system or implant.
Response options in PRAMS for marital status include “Married,” “Other” and “Unknowns.”
4. Discussion
This paper presents data that demonstrate that new contraceptive care measures are “important to measure and report,” as defined by NQF. Providing contraceptive access as a strategy to prevent adolescent and unintended pregnancy and to improve birth spacing has been a part of seven recent national initiatives. The measures are based on scientific evidence that link use of most and moderately effective methods to reductions in unintended pregnancy and show how improvements in the structure and process of care lead to these intermediate and long-term outcomes. Finally, this paper demonstrates that there is a notable gap in the use of contraception as assessed with the performance measures overall, which is more dramatic in certain subpopulations, demonstrating that these new measures have the potential to drive performance improvement.
Use of the new clinical performance measures in Medicaid, Title X, the federally qualified health center network and private health plans can inform delivery of quality contraceptive services. We expect that their use will encourage more providers to follow national clinical recommendations to screen all clients about their pregnancy intention, counsel women who want to prevent pregnancy about contraception in a client-centered manner and offer a full range of methods on a same-day, onsite basis [48].
It is important to note that concerns have been raised about potential harm if the measures are used inappropriately. In particular, because a history in America of coercive practices with regard to contraception [54,55], there is concern that LARC or other most effective methods might be “promoted” without adequately respecting women’s preferences. To address these concerns, OPA has developed a webpage that provides information about how to calculate and use the measures appropriately, noting that a benchmark has not been set and the level is not expected to reach 100%. The website also explains that the exclusive use of the LARC measures should be on identifying exceptionally low rates of use (e.g., 1–2%) that might indicate barriers to access. The national data in this paper indicate that LARC methods were not exceptionally low among any sociodemographic subgroups, but national findings probably do not translate directly to clinic level or other subnational levels. Conversely, the national data indicate that LARC use was relatively high among some postpartum subpopulations. While multiple factors specific to the postpartum period may influence method use (e.g., heightened motivation to avoid another pregnancy, unmet need that can be addressed once a women is in the healthcare system), the finding of high use in some populations highlights the need to ensure that contraception is offered to all clients in a noncoercive, client-centered manner. To ensure that all providers are able to develop the skills needed to provide client-centered counseling in a noncoercive manner in accordance with CDC-OPA recommendations, OPA supports a national training center that has numerous resources on this topic (www.fpntc.org). OPA is funding the development of a companion patient-reported outcome performance measure for contraceptive care, which can be used to “balance” these measures and to ensure that care is provided in a client-centered manner [56]. Input from key stakeholders (Federal agencies, payers, health care systems and providers) will be sought to help determine an appropriate benchmark for the measure assessing provision of most and moderately effective methods, help monitor that the measures are being used appropriately and contraception is offered in a client-centered manner and guide any measure modifications that may be needed before they are resubmitted to NQF for “maintenance” review.
In summary, through the NQF endorsement of the contraceptive care measures, the field of family planning has joined the broader healthcare field in its ability to use performance measures to drive improvement in healthcare delivery, to inform consumers about healthcare quality so they are better able to make choices and advocate for good healthcare and to influence payment strategies. If used appropriately, the new contraceptive care measures have the potential to expand access to quality contraceptive care and, through that, to improve long-term health outcomes of women and children.
Acknowledgement
The authors gratefully acknowledge the contribution of Gladys Martinez, PhD, from NSFG, NCHS, US CDC, for her assistance in analyzing the NSFG data.
Footnotes
Publisher's Disclaimer: Disclaimer: The findings and conclusions in this report are those of the authors and do not necessarily represent the official position of the Centers for Disease Control and Prevention.
This component was dropped by NQF in 2015 as a criterion for measure endorsement.
Thirty-one jurisdictions were included in the analysis: Arkansas, Arizona, Colorado, Delaware, Georgia, Hawaii, Iowa, Illinois, Maryland, Massachusetts, Maine, Michigan, Minnesota, Montana, Nebraska, New Hampshire, New Jersey, New Mexico, New York, Ohio, Oklahoma, Oregon, Pennsylvania, Rhode Island, Tennessee, Utah, Vermont, Washington, Wisconsin, Wyoming, and New York City.
References
- [1].Institute of Medicine. Crossing the quality chasm: A new health system for the 21st century. Washington, DC: National Academies of Science; 2001. [PubMed] [Google Scholar]
- [2].Berwick D, Nolan T, Whittington J. The triple aim: care, health and cost. Health Aff 2008;27(3):759–69. [DOI] [PubMed] [Google Scholar]
- [3].AHRQ. In: & Services UHaH, editor. National strategy for quality improvement in health care; 2011. [Rockville MD: ]. [Google Scholar]
- [4].Jackson AV, Karasek D, Dehlendorf C, Foster DG. Racial and ethnic differences in women’s preferences for features of contraceptive methods. Contraception 2016;93(5):406–11. [DOI] [PubMed] [Google Scholar]
- [5].Stanwood NL, Bradley KA. Young pregnant women’s knowledge of modern intrauterine devices. Obstet Gynecol 2006;108(6):1417–22. [DOI] [PubMed] [Google Scholar]
- [6].Grady WR, Klepinger DH, Nelson-Wally A. Contraceptive characteristics: the perceptions and priorities of men and women. Fam Plann Perspect 1999;31(4):168–75. [PubMed] [Google Scholar]
- [7].Forrest JD. U.S. women’s perceptions of and attitudes about the IUD. Obstet Gynecol Surv 1996;51(12 Suppl):S30–4. [DOI] [PubMed] [Google Scholar]
- [8].Parks C, Peipert JF. Eliminating health disparities in unintended pregnancy with long-acting reversible contraception (LARC). Obstet Gynecol 2016;214(6):681–8. [DOI] [PMC free article] [PubMed] [Google Scholar]
- [9].ACOG. Guidelines for Perinatal Care. 6th ed. Washington, DC: American College of Obstetricians and Gynecologists; 2007. [Google Scholar]
- [10].Centers for Disease Control and Prevention. US medical eligibility criteria for contraceptive use, 2016. MMWR 2016;65(3): 1–104 [No. RR-4]. [Google Scholar]
- [11].ACOG. Long-acting reversible contraception: Implants and intrauterine devices. Practice bulletin. Washington, DC: American College of Obstetricians and Gynecologists; 2015. p. 1–13. [reaffirmed]. [Google Scholar]
- [12].National Quality Forum. Measure evaluation criteria and guidance for evaluating measures for endorsement. Washington, DC: The National Quality Forum; 2015. [Google Scholar]
- [13].National Quality Forum. Perinatal and reproductive health 2015–2016 final report; 20161–223 [Washington, DC: ]. [Google Scholar]
- [14].National Quality Forum. Measure evaluation criteria and guidance for evaluating measures for endorsement. Washington, DC: National Quality Forum; 2013. [Google Scholar]
- [15].National Center for Health Statistics. The National Survey of Family Growth. Hyattsville, MD: US Centers for Disease Control and Prevention; 2013-2015. [Google Scholar]
- [16].Division of Reproductive Health. The pregnancy risk assessment monitoring system. Atlanta, GA: US Centers for Disease Control and Prevention; 2012-2013. [Google Scholar]
- [17].Trussell J Contraceptive failure in the United States. Contraception 2011;83(5):397–404. [DOI] [PMC free article] [PubMed] [Google Scholar]
- [18].Center for Medicaid and CHIP Services. Maternal and infant health care quality. https://www.medicaid.gov/Medicaid-CHIP-Program-Information/By-Topics/Quality-of-Care/Maternal-and-Infant-Health-Care-Quality.html. Accessed December 30, 2016. [Google Scholar]
- [19].Centers for Disease Control and Prevention. The 6/18 initiative: prevent unintended pregnancy; 2016.
- [20].Centers for Disease Control and Prevention. CDC winnable battles final report. Atlanta, GA: Department of Health and Human Services; 2016. [Google Scholar]
- [21].Institute of Medicine. Clinical preventive Services for Women: Closing the gaps. Washington, DC: The National Academies Press; 2011. [Google Scholar]
- [22].IOM Committee on Core Metrics for Better Health at Lower Cost. In: Blumenthal D, Malphrus E, & McGinnis M, editors. Vital signs: core metrics for health and health care progress. Washington DC: National Academies Press; 2015. [PubMed] [Google Scholar]
- [23].Maternal and Child Health Bureau of the Health Resources and Services Administration. Collaborative Improvement & Innovation Networks (CoIINs): perinatal and infant health. https://mchb.hrsa.gov/maternal-childhealth-initiatives/collaborative-improvement-innovation-networks-coiins. Accessed January 8, 2017.
- [24].US Department of Health and Human Services. Healthy people 2020 objectives: family planning. http://www.healthypeople.gov/2020/topicsobjectives2020/overview.aspx?topicid=13. Accessed October 17, 2013.
- [25].National Prevention Council. National prevention strategy. Washington DC: U.S. Department of Health and Human Services, Office of the Surgeon General; 2011. [Google Scholar]
- [26].US Census Bureau. Age and sex composition in the United States. Washington, DC: US Department of Commerce; 2012. [Google Scholar]
- [27].Frost J, Frohwirth L, Zolna M. Contraceptive needs and services, 2014 update. Washington DC: The Guttmacher Institute; 2016. [Google Scholar]
- [28].Daniels K, Daugherty J, Jones J, Mosher W. Current contraceptive use and variation by selected characteristics among women aged 15–44: United States, 2011–2013. In. Hyattsville, MD: US National Center for Health Statistics; 2015. [PubMed] [Google Scholar]
- [29].Jones R, Tapales A, Lindberg L, Frost J. Using longitudinal data to understand changes in consistent contraceptive use. Perspect Sex Reprod Health 2015;47(3):131–9. [DOI] [PMC free article] [PubMed] [Google Scholar]
- [30].Finer LB, Zolna MR. Declines in unintended pregnancy in the United States, 2008–2011. Med 2016;374(9):843–52. [DOI] [PMC free article] [PubMed] [Google Scholar]
- [31].Copen C, Thomas M, Kirmeyer S. Interpregnancy intervals in the United States: data from the birth certificate and the National Survey of Family Growth. National vital statistics reports. Hyattsville, MD: National Center for Health Statistics; 2015. [PubMed] [Google Scholar]
- [32].Curtin SC, Abma JC, Ventura SJ, Henshaw SK. Pregnancy rates for U.S. women continue to drop. NCHS Data Brief 2013;136:1–8. [PubMed] [Google Scholar]
- [33].Hamilton BE, Mathews TJ. Continued declines in teen births in the United States, 2015. NCHS Data Brief 2016;259:1–8. [PubMed] [Google Scholar]
- [34].Conde-Agudelo A, Rosas-Bermudez A, Kafury-Goeta AC. Birth spacing and risk of adverse perinatal outcomes: a meta-analysis. JAMA 2006;295(15):1809–23. [DOI] [PubMed] [Google Scholar]
- [35].DeFranco EA, Seske LM, Greenberg JM, Muglia LJ. Influence of interpregnancy interval on neonatal morbidity. Obstet Gynecol 2015;212(3):386.e381–9. [DOI] [PubMed] [Google Scholar]
- [36].Gipson JD, Koenig MA, Hindin MJ. The effects of unintended pregnancy on infant, child, and parental health: a review of the literature. Stud Fam Plann 2008;39(1):18–38. [DOI] [PubMed] [Google Scholar]
- [37].Sawhill I, Karpilow Q, Venator J. In: & Families CoCa, editor. The impact of unintended childbearing on future generations. Washington, DC: Brookings Institution; 2014. [Google Scholar]
- [38].Tsui AO, McDonald-Mosley R, Burke AE. Family planning and the burden of unintended pregnancies. Epidemiol Rev 2010;32(1):152–74. [DOI] [PMC free article] [PubMed] [Google Scholar]
- [39].Hoffman S, Maynard R. Kids having kids: economic costs and social consequences of teen pregnancy. 2nd ed. Washington, DC: Urban Institute Press; 2008. [Google Scholar]
- [40].Sonfield A, Kost K. In: & Institute TG, editor. Public costs from unintended pregnancies and the role of public insurance programs in paying for pregnancy and infant care: estimates for 2010. New York, NY: The Guttmacher Institute; 2015. [Google Scholar]
- [41].Hoffman S Counting it up: the public costs of teen childbearing. Washington, DC: The National Campaign to Prevent Teen and Unplanned Pregnancy; 2010. [Google Scholar]
- [42].Foster DG, Biggs MA, Malvin J, Bradsberry M, Darney P, Brindis CD. Cost-savings from the provision of specific contraceptive methods in 2009. Womens Health Issues 2013;23(4):e265–71. [DOI] [PubMed] [Google Scholar]
- [43].Han L, Sheeder J, Teal S. Tocce C Cost-effectiveness of immediate postpartum esonogestrel implant insertion for adolescent mothers Contraception 2012;86:290–325. [Google Scholar]
- [44].Frost J, Finer L, Tapales A. The impact of publicly funded family planning clinic services on unintended pregnancies and government cost savings. J Health Care Poor Underserved 2008;19(3):778–96. [DOI] [PubMed] [Google Scholar]
- [45].Thomas A Three strategies to prevent unintended pregnancy. J Policy Anal Manage 2012;31(2):280–311. [Google Scholar]
- [46].ACOG Committee on Adolescent Health Care. Adolescents and long-acting reversible contraception: implants and intrauterine devices. Committee opinion. Washington, DC: American College of Obstetricians and Gynecologists; 2014. p. 1–7. [reaffirmed]. [Google Scholar]
- [47].Ott MA, Sucato GS, Committee on A. Contraception for adolescents. Pediatrics 2014;134(4):e1257–81. [DOI] [PubMed] [Google Scholar]
- [48].CDC, OPA. Providing quality family planning services: recommendations of the CDC and the U.S. Office of Population Affairs. MMWR Recomm Rep 2014;63(4):1–54. [PubMed] [Google Scholar]
- [49].CDC. U.S. selected practice recommendations for contraceptive use 2016. MMWR 2016;65(4):1–66. [DOI] [PubMed] [Google Scholar]
- [50].Trussell J Contraceptive efficacy. In: Hatcher R, Trussell J, Nelson A, Cates W, & Kowal D, editors. Contraceptive technology. . New York: Ardent Media; 2011. p. 777–861. [Google Scholar]
- [51].Mansour D, Inki P, Gemzell-Danielsson K. Efficacy of contraceptive methods: a review of the literature. Contracept Reprod Health Care 2010;15(Suppl 2):S19–31. [DOI] [PubMed] [Google Scholar]
- [52].Winner B,Peipert J,Zhao Q,Buckel C,Madden T,Allsworth J,et al. Effectiveness of long-acting reversible contraception. Med 2012;366(21):1998–2007. [DOI] [PubMed] [Google Scholar]
- [53].Harper CC, Rocca CH, Thompson KM, Morfesis J, Goodman S, Darney PD, et al. Reductions in pregnancy rates in the USA with long-acting reversible contraception: a cluster randomised trial. Lancet 2015. [DOI] [PubMed] [Google Scholar]
- [54].Dehlendorf C, Bellanca H, Policar M. Performance measures for contraceptive care: what are we actually trying to measure? Contraception 2015;91(6):433–7. [DOI] [PubMed] [Google Scholar]
- [55].Gold J Guarding against coercion while ensuring access: a delicate balance. Guttmacher Policy Rev 2014;17(3):8–14. [Google Scholar]
- [56].Dehlendorf C, Henderson JT, Vittinghoff E, Grumbach K, Levy K, Schmittdiel J, et al. Association of the quality of interpersonal care during family planning counseling with contraceptive use. Obstet Gynecol 2016;215(1):78.e71–9. [DOI] [PubMed] [Google Scholar]