

Abstract
In this work we present a powerful, affordable, and portable biosensor to develop Point of care (POC) SARS-CoV-2 virus detection. It is constructed from a fast, low cost, portable and electronically automatized potentiostat that controls the potential applied to a disposable screen-printed electrochemical platform and the current response. The potentiostat was designed to get the best signal-to-noise ratio, a very simple user interface offering the possibility to be used by any device (computer, mobile phone or tablet), to have a small and portable size, and a cheap manufacturing cost. Furthermore, the device includes as main components, a data acquisition board, a controller board and a hybridization chamber with a final size of 10 × 8 × 4 cm. The device has been tested by detecting specific SARS-CoV-2 virus sequences, reaching a detection limit of 22.1 fM. Results agree well with those obtained using a conventional potentiostat, which validate the device and pave the way to the development of POC biosensors. In this sense, the device has finally applied to directly detect the presence of the virus in nasopharyngeal samples of COVID-19 patients and results confirm its utility for the rapid detection infected samples avoiding any amplification process.
Keywords: Portable, Electronically automatized potentiostat, POC biosensor, SARS-CoV-2
Graphical abstract
1. Introduction
Viral infections are a major cause of disease that produce thousands of deaths each year [1], as well as a large number of annual sick leaves, with the resulting economic costs. A clear example is the coronavirus disease 2019 (COVID-19) that has been caused by SARS-CoV-2 virus [2] and was declared by the World Health Organization (WHO) to be a public health emergency of international concern [3].
Traditional methods for detecting infectious agents as virus are based on two very distinct strategies: first, conventional solid-phase immunoassays combined with enzyme detection (ELISA), and assays based on reverse transcription polymerase chain reaction (RT-PCR). Both methods are highly effective but also have some limitations. RT-PCR displays excellent analytical sensitivity and specificity but is costly, often requires a substantial turnaround time, and, more importantly, is subject to reagent and other material shortages [4]. Therefore, it is not the best methodology for mass application and point of care (POC) test [5]. Rapid antigen tests have been developed to complement this technology, and made available worldwide, allowing cheap, quick, and decentralized SARS-CoV-2 testing. However, the main drawback of these tests is the reduced sensitivity compared with gold standard RT-PCR assays. Therefore, innovations are focusing on providing high-yield devices for rapid, easy to use POC scalable tests. In this sense, recently, some authors have reported new POC test for SARS-CoV-2 detection [6,7] based on different strategies such as RT-PCR POC diagnostic device [4] or POC diagnostic test based on reverse transcriptase loop-mediated isothermal amplification (RT-LAMP) [8]. However, most of them require the incorporation of amplification methods to increase sensitivity. For this reason, there is still great of deal of interest on developing new POC devices that try to achieve the practical advantages of rapid antigen tests, the robust analytical performances of nucleic acid detection systems and low detection limits. Biosensors can meet these specifications, which has caused a boom in the sector. They have emerged as very useful analytical tools that complement PCR, serological and antigen test for the detection of viruses in a rapid an easy way.
Biosensors are based on the direct integration of a selective biorecognition element and a sensitive transducer element. Among biosensors, those using electrochemical transduction due to their low cost, high sensitivity and miniaturization facility meet the requirements for new analytical methodologies. In particular those that incorporate nanostructures, which improves their analytical performance [9]. Hence, electrochemical biosensors are considered useful in clinical diagnosis and POC testing.
POC systems are diagnostic instruments that provide rapid results near to the patient, even when handled by untrained personnel. Some requirements are set for POC diagnostic systems: affordable, sensitive, specific, user friendly, rapid and robust, equipment-free and delivered to users, following the World Health Organization (WHO) assured criterion [10]. According to this standard, POC platforms must deliver quick results for early-stage disease detection to enable rapid intervention and improve patient's quality of life. The provided results must be accurate, reproducible and optimally quantitative, and they must be comparable to those obtained by benchtop analyzers at central laboratories. These systems are suitable in a wide range of applications, such as medical and health care monitoring [11] and environmental measurements [12]. Indeed, glucose monitoring POC devices are the most widespread miniaturized test systems because they are inexpensive, easy to produce, small and easy-to-use [13]. However, few POC system based on DNA electrochemical biosensors can be found yet. These devices are based on detecting and identifying specimens in the analysis of their genetic code. In a simplest approach, they can detect and quantify hybridization between a DNA capture probe immobilized on the electrode surface and the complementary sequence corresponding to the analyte (DNA or RNA) through the electrolysis of the redox indicator. Hence, DNA biosensors are an alternative and reliable solution to clinical diagnosis due to their advantages, such as high sensitivity, low cost, user-friendliness, possibility of miniaturization and robustness [14]. In particular, on detecting pathogens they can achieve superior analytical performance compared to more traditional methods, as they can make measurements in real time or reach very low limits of detection, allowing minimal quantities of the pathogen to be detected. Indeed, different strategies for pathogen detection based on DNA biosensors have been recently developed [[15], [16], [17]]. In particular, to detect the SARS-CoV-2 virus. However, the main drawbacks of these approaches have been a lack of portability and limited application in POC devices.
Concerning POC approaches development, the budget constrains are one of the principal considerations. Conventional potentiostat used in the laboratories are unsuitable for POC applications since they are complex, expensive and tend to be bulky. Although some research groups have described miniaturized potentiostat-based single-chip platforms [18,19] costs are too elevated for POC implementation. Therefore, there is still much to explore in this field. For instance, in the case of DNA biosensor the incorporation of a hybridization chamber is a challenge to develop this kind of portable device.
Based on the considerations described above, one of the main features to design POC DNA electrochemical biosensors is to fabricate small size, lower power consumption, high precision and affordable potentiostat together with a small hybridization chamber.
In this sense, one of the most complex and expensive parts of the system is the controller module, as it requires a hight processing capability and a lot of electronics are involved, so the cheapen step is focused on this part. Among the existent technologies that fits both processing capabilities and cost requirements there is particularly interesting one, the single-board computers (SBCs). These are a credit card sized boards with a high computing power, low power demand, easily programmed using free open-source software, yet being cheap. All this makes SBCs a perfect choice for a tailored solutions and are particularly suited to point-of-care and point-of-need applications, where size, flexibility, cost and portability are important. A specially interesting SBC is the Raspberry Pi model 3B+.
Therefore, to overcome the limitations of existing electrochemical DNA biosensors, in this work we present a disposable DNA electrochemical sensing platform integrated in a small hybridization chamber and coupled to a portable potentiostat designed for micro-power electrochemical sensing applications as a prototype towards the POC SARS-CoV-2 detection. The potentiostat built around a Raspberry Pi 3B + SBC includes a set of filters and analog/digital converters to achieve a low noise level in the system, a main controller board for a fast and accurate sampling process and allows the system to be operated from any device (computer, mobile, or tablet). The prototype device has been validated by detecting the redox signal of an electrochemical indicator (Azure A) accumulated on the biosensing platform after hybridization with the analyte and comparing with those obtained by using a commercial potentiostat.
2. Experimental section
2.1. Chemicals
Tetrachloroauric acid (HAuCl4), Sodium thiosulphate (Na2S2O3), sodium chloride, Azure A, sodium phosphate and all other chemicals used in this work were obtained from Merck. (www.merckgroup.com/es-es). Millipore Milli-Q-System (18.2 MΩ cm) was used for all experiments.
2.1.1. SARS-CoV-2 synthetic DNA sequences
SARS-CoV-2 has been detected by using a specific DNA sequence of the RNA-dependent RNA polymerase (RdRp) gene of the virus. Table 1 summarizes the DNA sequences used in this work. They comprise a thiolated capture probe (a single-stranded sequence complementary to the analyte (RdRp SARS-CoV-2 gene sequence, CoV-2), modified on 5’ extreme with a thiol) and analyte sequences: complementary, interferents (SARS-CoV-1 and Influenza A) and non-complementary sequence to the probe, latest used as control.
Table 1.
DNA sequences used in this work.
| SARS-CoV-2 DNA sequences | Named | |
|---|---|---|
| Probe | 5′-GCATCTCCTGATGAGGTTCCACCTG- thiol | Probe-SH |
| Target | 5′-CAGGTGGAACCTCATCAGGAGATGC | CoV-2 |
| Non-complementary | 5′-ACACTAGCCATCCTTACTGCGCTTCG | CoV-2 NC |
| SARS-CoV-1 | 5′-C CAGGT GGAAC ATCAT CCGGT GATGC-3′ | CoV-1 |
| Influenza A | 5′-TTAGTCATCTGCGGGAATGCAGCATTATCT-3′ | Influenza A |
Stock solutions of thiolated capture probe (Probe-SH) and analyte sequences were prepared in 10 mM phosphate buffer (PB) pH 7.0 and in 10 mM phosphate buffer (pH 7.0) with 0.4 M NaCl, respectively. Aliquots of a few microliters of all stock solutions were stored at −20 °C.
2.1.2. COVID-19 patient samples
RNA from inactivated swab nasopharyngeal samples were obtained from COVID-19 patients and donated by Hospital Ramón y Cajal (Madrid). RNA was extracted using QIAamp Viral RNA Qiagen kit and the total RNA obtained was eluted in water free of RNase. Its concentration was measured using a Nanodrop, then it is storage at – 80 °C. To avoid any cross-contamination between samples and/or during their manipulation by the operator, all the procedure were performed in P2-biosecurity cabinets with spatial and temporal separation between COVID-19 positive and negative samples. Specifically, the positive sample was analyzed by RT-qPCR with a Ct value of 25. Negative sample has a Ct value above the threshold (∼35).
The samples were obtained with the consent of all participants and approved by “Comité de Ética de la Investigación con Medicamentos del Hospital Universitario Ramón y Cajal”. Reference: 127–21.
2.2. Apparatus
A regular Autolab (PGSTAT 30) potentiostat attached to a PC with GPES software was used for Electrochemical experiments control.
Carbon Screen-printed electrodes (CSPEs) and Dropsens connector (supplied by Metrohm), were used for electrochemical measurements, using the developed potentiostat as well as the bench potentiostat (Autolab). CSPEs integrates a carbon working, silver pseudo-reference and carbon counter electrodes.
For hardware development, the ALTIUM DESIGNER v21.0.9 PCB design environment has been used, as well as the RIGOL DS1104Z oscilloscope, the RIGOL DP832 power supply and the JBC NASE-2C soldering station; regarding the software development, the IDEs PyCharm and IntelliJ, from JetBrains, have been used.
2.3. Procedures
2.3.1. POC prototype device design and development
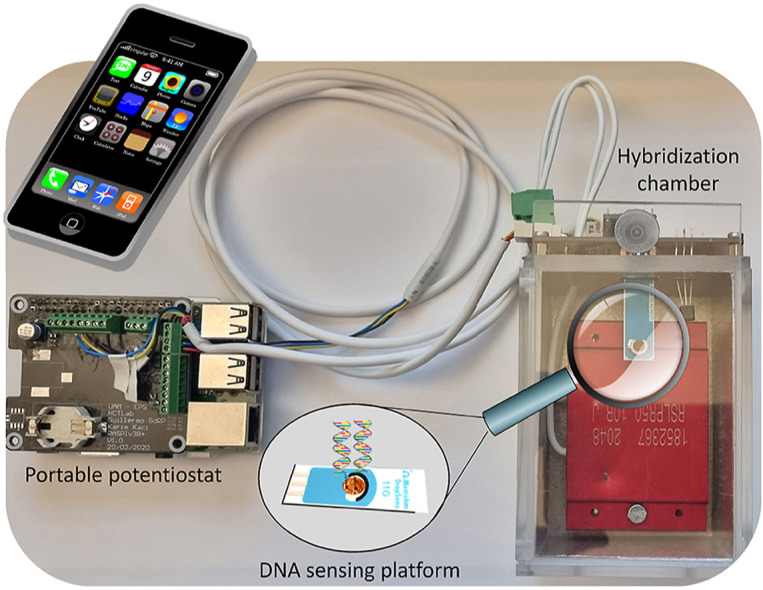
Scheme 1 shows the main components of the POC prototype developed to detect SARS-CoV-2 sequences; the DNA sensing platform coupled to a hybridization chamber and a portable potentiostat.
Scheme 1.

Scheme of the main components of the developed portable DNA biosensing device.
2.3.1.1. DNA biosensing platform development
As can be observed in Scheme 1, the DNA biosensing platform development, briefly, comprises 2 steps: electrode nanostructuration and DNA probe immobilization.
In order to allow the immobilization of the thiol functionalized DNA probe, increase the relative electrode surface area and therefore improve the sensitivity of the final device, CSPE were nanostructured with gold nanotriangles (AuNTs) synthetized by reduction of HAuCl4 with Na2S2O3 as it is described in detail in the Supporting Information (SI). Nanostructuration was carried out by spraying AuNTs stock solution onto the electrode surface (AuNT/CSPE). Then, 10 μL of 10.0 μM of the capture probe (Probe-SH) was deposited on the AuNT/CSPE by drop-casting and was kept for 24 h at room temperature (Probe-SH/AuNTs/CSPE). Afterwards, it was soaked for 30 min in Milli-Q water.
2.3.1.2. SARS-CoV-2 detection
The probe modified electrode was hybridized with 10 μL of 500 fM analyte (complementary or non-complementary SARS-CoV-2 sequences, CoV-2 and CoV–2NC, respectively) for 1 h at 40 °C (CoV-2-Probe-SH/AuNTs/CSPE or CoV–2NC-Probe-SH/AuNTs/CSPE)). Azure A (AA) was used as the electrochemical indicator for hybridization detection. For this purpose, 20 μL of AA (10 mM) were dropped on the electrode surface after hybridization for 30 min. Finally, the electrodes were rinsed with sterile water, placed in 0.1 M PB pH 7.0 and electrochemical signal was recorded in 0.1 M PB pH 7.0 using the developed portable potentiostat (designed to measure at a single potential pulse) and the commercial Autolab potentiostat, used as comparison. Fig. 1 shows the signal response obtained by Differential Pulse Voltammetry (DPV) from −0.8 to 0.0 V with the Autolab and by amperometry at the same potentials with the portable device developed in this work. As can be observed, DPV peak potential (−0.5 V) matches with that of the maximum current recorded with the portable device at different potentials. Hence, the biosensor signal for detecting SARS-CoV-2 with the fabricated potentiostat, consists on the current intensity recorded after applying a potential pulse of −0.5V.
Fig. 1.

DPV (red line) from −0.8 to 0 V and amperometric biosensor response (blue line) applying consecutive pulse potentials from −0.8 to 0 V. (For interpretation of the references to colour in this figure legend, the reader is referred to the Web version of this article.)
For SARS-CoV-2 detection in COVID-19 patients, 5 μL of the obtained RNA sample (see COVID-19 samples section) were deposited on the electrode modified with the capture probe (Probe-SH/AuNTs/CSPE) and were hybridized at 40 °C for 1 h. Then, 20 μL of AA (10 mM) were dropped on the electrode surface. Finally, the electrodes were rinsed with sterile water, placed in 0.1 M PB pH 7.0 and electrochemical signal was recorded in 0.1 M PB pH 7.0 using the developed portable potentiostat as described above. Results are presented as the mean of the peak current measured current after applying a potential pulse of −0.5V ± standard deviation (SD) (n = 3 electrodes).
2.3.1.3. Potentiostat design and development
The developed potentiostat provides a complete device to perform an end-to-end measurement. The design has been carried out both at the hardware and software levels (see Scheme 2 ). Design at the hardware level resulted in three modules, the Main Controller Board, the Data Acquisition Board and the Hybridization Chamber. The Main Controller Board stores all the required software and controls the whole system. The Data Acquisition Board includes all the electronics needed to get and treat the signal (a signal conditioner, analog/digital converters, and a set of filters). Hybridization Chamber is an optional add-on that allows hybridization reaction between the probe immobilized on the nanostructured electrode (Probe-SH/AuNTs/CSPE) and the analyte (specific sequence of SARS-CoV-2). It includes a connector where the biosensor can be attached to the Data Acquisition Board.
Scheme 2.

Hardware and software levels of potentiostat design
On the other hand, as can be observed in Scheme 1SI, the design at software level resulted in five modules, the Communications Module, the Control Module, the Digital Filter Module, the Data Acquisition Module and the User Web Interface Module. The Communications Module manages the data transfer between all the components of the system. The Control Module manages the behaviour of each component of the system, the Digital Filter Module is a digital treatment of the signal. The Data Acquisition Module is the part that gets the signal of the biosensor and treats it, and the User Web Interface Module is the user interface for the operator.
2.3.1.3.1. Hardware modules
2.3.1.3.1.1. Main controller board
The main goal of the Main Controller Board aims to provide a cheap and portable device. Following this precept, the device design is focused on modularity, so the idea is to use as much already commercialized modules as possible, reducing the custom electronic boards and, therefore, the manufacturing price. One of the most complex and expensive modules of the system is the controller module. During the prototyping stage this was a whole computer. To cheapen this module, it was decided to use a commercial development board as a controller. Several development boards were compared to choose the most appropriate one for the project. The principal candidates, due to the size and price, were Arduino YUN, BeagleBone Black and Raspberry Pi model 3B+, while the specifications to be take in account were communication and processing capabilities, as well as the flexibility in the development and maintenance of the software components of the system. Table 1 of SI shows a comparison of the characteristics of the most suitable controller boards. As it can be observed the Raspberry Pi 3B + development board is the most suitable due to its high core speed, communication capabilities and low cost, despite its lack of analog ports. This lack is easily solved with an Analog-to-Digital converter, which will be discussed later. Another advantage of the selected development board is that it has an HDMI and USB ports, so it can be used in standalone mode by just connecting a screen, mouse and keyboard to it (see Fig. 2 ).
Fig. 2.

Raspberry Pi 3B + block diagram.
To use the Raspberry Pi 3B + board, some additional elements are required, a μSD card with at least 4 GB of capacity. In particular, a Samsung EVO 64 GB MicroSDXC Class 10 card was chosen. A 5V μUSB power adapter with a current output of 2.5A was also need. Finally, an Ethernet cable, to use the board through SSH protocol, or a HDMI screen with USB mouse and keyboard are also needed. The total cost of the Controller Board module is 60 euros (see Table 2SI).
2.3.1.3.1.2. Data acquisition board
The Data Acquisition Board integrates all those electronic components that are required for the sensing and physical treatment of the signal that takes part in the chemical reaction. The components are configured by the Controller Board and the captured signal is returned to it. In particular, the components placed on this board are the signal conditioner, an analog to digital and digital to analog converters (ADC and DAC respectively) and a set of other non-configurable components that are needed to maintain a low noise level in the system.
2.3.1.3.1.2.1. Signal conditioner
In this work, a Texas Instruments LMP91000 configurable AFE Potentiostat, specially designed for low-power chemical sensing applications was chosen as the signal conditioner. This product allows such configurations as temperature measurements, 2-lead ground referred galvanic cell or 3-lead amperometric cell, the latest is the one used in this work. Fig. 1SI shows a block diagram of the internal circuit of the signal conditioner.
An I2C communication with the Controller Board (given by the SCL, SDA and MENB ports) is necessary to perform the programming of the chip and getting the measures through the Vout analog port. Also, a reference voltage, given by the Vref port, is necessary to perform a potential sweep on the chemical sample. In addition, a capacitor, ports C1 and C2, is necessary to perform an analog filtering of the signal and obtain an output as cleaner as possible of electrical noise. Finally, the port of the potentiostat is connected to the electrochemical cell (CSPE).
2.3.1.3.1.2.2. Signal Treatment
The chosen controller board lacks analog GPIOs, this means, the Raspberry Pi 3B + development board can handle only digital signals. This issue is solved by using an ADC and DAC converters. The ADC converter is needed to handle the Vout signal of the signal conditioner, which is the voltage proportional to the current handled in the electrochemical cell. The DAC converter is needed to generate the Vref signal, needed by the signal conditioner to generate the reference voltage for the electrochemical cell (CSPE). The signal converters must handle a very weak signals which are also very susceptible to electrical noise. Taking this into account, a Texas Instruments ADS1115 ADC and a Microchip MCP4728 DAC were chosen. Both are integrated circuits that are focused on operate with in a high precision and low noise requirements. Fig. 2SI shows a functional block diagram of both chips.
The main characteristics of the ADS1115 ADC are its 16bit resolution and sigma-delta conversion procedure. The first characteristic is very clear, the more bits the more precision to work with. Regarding the second characteristic, the advantages of the sigma-delta conversion are that the circuitry is most digital, which means that the performance will not drift significantly with time and temperature, this type of converter is inherently monotonic and lineal, also the requirements for external antialiasing filters are minimum. All this offers a very high precision output signal, but the penalty paid is the speed, as the hardware must operate at the over-sampled rate, much larger than the maximum signal bandwidth, thus demands great complexity of the digital circuitry. As an example, a block diagram for a 1-bit sigma-dela converter is showed in Fig. 3SI.
Regarding the MCP478 DAC, its main characteristic is that it implements a high-precision output amplifier, which allows having a precise and stable output voltage.
In order to maintain an optimal signal-to-noise ratio in the system, several analog filtering stages were implemented. The first one is in the power line of the Data Acquisition Board. A set of capacitors allows to have a smooth and clean power signal in all the circuit. The second one is a set of decoupling capacitors, one at the power entry of each integrated circuit of the board, which cleans the power signal of each chip. The third one is a set of operational amplifiers that works in buffer configuration and are placed between the signal conditioner and ADC/DAC integrated circuits. The chosen component for this third stage is a Texas Instruments OPA388 Precision Operational Amplifier. It's an integrated circuit that is designed to work with high precision and ultra-low noise requirements, due to this it integrates electromagnetic and radiofrequency interference filters. Fig. 4SI illustrates a functional block diagram of the OPA388 integrated circuit.
One OA is required between the Vout port of the signal conditioner and the Vin port of the ADC, to get a clean output signal from the LMP91000. Another OA is required between the Vout port of the DAC and the Vref port of the signal conditioner, to provide a clean voltage reference signal. Table 3 of SI reflects all the components and cost of the Data Acquisition Board module.
2.3.1.3.1.3. Hybridization Chamber
The Hybridization Chamber is an add-on device developed to carry out the hybridization event with the analyte. Its main purpose is to maintain a fixed temperature during desired time. The device has its own controller which allows three operation modes. The first one is the Standalone mode, when the chamber is completely disconnected from the Controller and Data Acquisition Boards and allows to have a fixed temperature (40 °C) during a fixed time (1 h). The second one is the Slave mode, when the chamber is connected only to the Controller Board through a serial interface, which allows the operator to set the time and temperature. The third one is the Full mode, when the chamber is connected both to the Controller and Data Acquisition Boards, which allows not only setting the time and temperature but also to perform the signal read from the electrochemical cell, offering to the operator a complete solution in one device. The main electronic element of this equipment is a microcontroller to allow the standalone operation mode and to allow the communication with the Main Controller Board. An Arduino Pro Mini microcontroller was chosen for this task. As it was mentioned before, the Hybridization Chamber owns its dedicated controller, which is a PID (proportional-integral-derivative) controller. It is a control loop mechanism employing feedback that is widely used in applications requiring precise and stable control. A PID controller continuously calculates an error value e(t) as the difference between a desired setpoint and a measured process variable, and applies a correction based on proportional, integral and derivative terms (KP, KI and K0 respectively). The distinguishing feature of the PID controller is the ability to use the three control terms of proportional, integral and derivative influence on the controller output to apply accurate and optimal control. The mathematical model is:
Where the Output is the current applied to the resistor inside the Hybridization Chamber and the e(t) is the calculated error between the desired temperature and the current one, read by the temperature sensor placed inside the Chamber. In addition to the electronic part, a methacrylate box lined with thermal insulation has been designed and manufactured. For the design it has been considered that the chamber should be big enough to work comfortably and small enough to be portable and not require much energy to reach and keep the desired temperature. Fig. 5SI summarizes the detailed block diagram of the developed potentiostat including all the hardware modules described above.
2.3.1.3.2. Software modules
The software implementation of the POC device can be divided in two main modules, the backend and frontend. The Backend is all the software that is required to manage the system but is not directly accessed by the operator. This includes the communication protocols between all components of the device, the internal controls of each chip, the digital filtering and data acquisition algorithms. The Frontend is all the software that allows the operator to manage the system and visualize the results (User Web based Interface).
2.3.1.3.2.1. Communications Module
The Communications Module uses such protocols as I2C, RS232 and TCP (in particular, HTTP and WebSocket) as follows:
-
-
I2C protocol is used to communicate the Controller Board with the Data Acquisition Board, allowing the configuration and operation with the signal conditioner, Analog to Digital Converter and Digital to Analog Converter.
-
-
RS232 protocol is used to communicate the Controller Board with the microcontroller of the Hybridization Chamber, both in slave and full operation modes.
-
-
TCP is the protocol used to transfer data between the operators UI and the potentiostat device. HTTP allow the operator to use a friendly WEB based UI to send commands in order to configure the device. WebSocket is used to display the acquired data in real time on the UI plot part (see Fig. 6SI).
2.3.1.3.2.2. Control module
The software control module is in charge of receiving the operators’ commands through the WEB UI, treat them and configure the corresponding internal registers of the components of the Data Acquisition Board.
-
-
The signal conditioner, LMP91000, needs to configure the Transimpedance Control Register (TIACN - 0 × 10) that allows to set the amplifier gain (RTIA) and the load resistance (RLOAD); the Reference Control Register (REFCN - 0 × 11) that allows to set if the voltage reference (Vref) source is internal or external, the internal zero value as % of Vref, the Bias sign and the Bias value as % of Vref; the Mode Control Register (MODECN - 0 × 12) that allows to enable or disable the FET feature and select the operation mode of the sensor.
-
-
The DAC integrated circuit needs to configure its only register to get the desired output voltage, that will be used as Vref of the signal conditioner.
-
-
The ADC integrated circuit also needs to configure its internal registers in order to properly convert the signal obtained from the signal conditioner, but in this case these configurations are not available to the operator as they are already properly calibrated and set up automatically when the system starts working.
-
-Unlike the signal conditioner, ADC and DAC, the Hybridization Chamber owns its dedicated microcontroller. This allows to manage the device through a serial RS-232 communication using custom commands that will be interpreted by the microcontroller. The commands are:
-
•“a” - Powers on the hybridization chamber maintaining a desired temperature
-
•“s” - Powers off the hybridization chamber
-
•“t” - Displays the current temperature in the chamber
-
•“d” - Displays the desired temperature in the chamber
-
•“sp” - Sets a new desired temperature for the chamber
-
•
2.3.1.3.2.3. Digital Filter Module
In order to have a smoother representation of the signal for the operator, a digital filter has been applied to the samples obtained from the ADC. Specifically, a Savitzky-Golay filter [[20], [21], [22], [23], [24]] is used. It's a digital Finite Impulsive Response filter that can be applied to a set of digital data points for the purpose of increasing the precision of the data without distorting the signal tendency. This is achieved, in a process known as convolution, by fitting successive sub-sets of adjacent data points with a low-degree polynomial by the method of linear least squares. When the data points are equally spaced, an analytical solution to the least-squares equations can be found, in the form of a single set of “convolution coefficients” that can be applied to all data sub-sets, to give estimates of the smoothed signal, (or derivatives of the smoothed signal) at the central point of each sub-set.
The original paper by Savitzky and Golay showed that at each position, the smoothed output value obtained by sampling the fitted polynomial is identical to a fixed linear combination of the local set of input samples. That is, the output samples can be computed by a discrete convolution.
The two main parameters for this filter are the window length (number of samples to work with) and the polynomial order. Both are calibrated and set up in the control module, so the operator does not have access to modify these values.
2.3.1.3.2.4. Data Acquisition Module
This module is in charge of sampling the Vout output signal of the signal conditioner and process it, not only presenting the data on the UI but also storing it in a CSV file, so they can be accessed from third-party applications.
2.3.1.3.2.5. User Web Interface module
This module offers a friendly and intuitive control to the operator, allowing to configure different parameters of the system with a simple click, or use the pre-set configurations. In addition to controlling the system, it allows the visualization of the results obtained in the analysis on a graph. Being a WEB interface (see Fig. 3 ), it allows access to the system from any device that is on the same local network, thus making it a very comfortable to use, since it does not depend on a preset computer or third-party drivers.
Fig. 3.

Web Interface and an example of Data Sample Graph.
3. Results and discussion
In this work we present the design, development, and validation of a portable, low cost and automatized DNA sensing device to detect SARS-CoV-2 sequences based on a disposable nanostructured electrochemical sensing platform coupled to a hybridization chamber and a potentiostat (see Scheme 1). The combination of a sensitive and selective electrochemical sensing platform in conjunction with a portable, simple, and fast potentiostat allow us to develop a new prototype that can achieve the requirements set for POC sensing device.
The design of the potentiostat has been carried out at the hardware and software levels, as is described in detail in procedures of Experimental section and provides a complete device to perform an end-to-end measurement. Moreover, as is described above, the potentiostat controls the potential applied to a disposable Carbon Screen Printed (CSPE) electrode nanostructured with gold nanotriangles (AuNTs) modified with a DNA probe as sensing platform, and to measure the current intensity from the electrolysis of the redox indicator (Azure A) of the hybridization event. The current intensity measured at the potentiostat correspond to the Azure A accumulated on the DNA double layer formed on the electrode surface after analyte recognition by the probe through the hybridization event [25].
As can be observed in Scheme 1, the first step in the biosensor design is the nanostructuration of the CSPE by spraying a solution of AuNTs. This procedure allows a totally and uniform electrode surface coverage (see Fig. 8SI). The second step is the immobilization of the thiolated DNA probe sequence complementary to the analyte (a SARS-CoV-2 characteristic sequence from the RNA-dependent RNA polymerase (RdRp) gene of the virus) by the chemisorption reaction between the thiol group of the DNA probe and the AuNTs deposited on the carbon electrode surface (CSPE/AuNT/Probe-SH). Then, hybridization with the analyte or with a non-complementary sequence (used as control) is carried out in the hybridization chamber at a selected temperature (40 °C). Finally, hybridization detection is based on the redox signal of the electrochemical indicator (Azure A), accumulated on the dsDNA layer formed on the electrode surface after analyte recognition. The potential applied as well as the current intensity measured for the hybridization detection is controlled by the potentiostat. Data is acquired by measuring the current intensity at −0.5V and visualized at the WEB interface developed using any device (computer, mobile phone or tablet).
All the procedures for the final prototype development are described in detail in experimental section and depicted in Scheme 1.
3.1. System testing and validation
The biosensing device developed has been applied to detect a specific DNA sequence from the RdRp gen of SARS-CoV-2 virus. To validate it, results were compared to those obtained using the same procedures but a commercial oven (Memmert UNE 400 Drying oven) and a commercial potentiostat (Autolab (PGSTAT 30) potentiostat). The biosensor response is the maximum current measured at −0.5 V from the oxidation of Azure A accumulated on the dsDNA layer formed at the electrode surface after DNA sequence analyte recognition by hybridization with the probe. At a first step, the biosensor response before and after the hybridization with 3.0 pM of the SARS-CoV-2 sequence and a non-complementary sequence (used as a control) in a conventional oven. The current intensities vs time were recorded with both the developed and the commercial potentiostat (Autolab) and compared. As can be observed in Fig. 4 , the signals (current vs time) obtained before and after hybridization with the target analyte (a sequence from the RdRp gen) with both potentiostats have the same behaviour. This result confirms that the new potentiostat can be applied for the development of electrochemical biosensing devices. Even more, as one can observe, the developed potentiostat provides higher intensities, due to a better signal-to-noise ratio as consequence of the low noise level achieved with the set of filters, low noise and high-resolution analog and digital converters and the use of optimized traces in the implementation.
Fig. 4.

Current-time response (potential pulse of 0.5V) of the AA accumulated on the electrode surface before (Probe-SH/AuNT/CSPE (black line)) and after the hybridization with the complementary (CoV-2/Probe-SH/AuNT/CSPE (blue line)) and non-complementary sequence (CoV–2NC/Probe-SH/AuNT/CSPE (red line)) for an Autolab potentiostat (A) and our portable potentiostat (B). (For interpretation of the references to colour in this figure legend, the reader is referred to the Web version of this article.)
The hybridization chamber is the second main element included in the prototype DNA sensor towards a POC device developed. A miniaturized chamber is required. In this sense, we have developed a 12 × 7 × 7 cm hybridization chamber, which is more than 4 time smaller than a regular laboratory oven. The effectiveness of the developed chamber was tested by using it for hybridization of the probe with the target analyte on the electrode surface at the previously optimized hybridization conditions (1 h 40 °C, as we described in experimental section). The resulting biosensor response was compared to that obtained when hybridization was carried out in a conventional oven. Fig. 5 shows the temperature registered in the developed hybridization chamber (A) as well the biosensor response (presented as % of the signal increase to the analyte compared to the signal obtained for the probe) after hybridization with the complementary sequence using either the developed chamber (orange bar) or the conventional oven (blue bar). As can be observed in the temperature vs time plot (Fig. 5A), the portable hybridization chamber developed keeps constant the desired temperature to achieve the hybridization. The temperature becomes stable after 7 min, and it remains constant between 39 °C and 41 °C for more than 60 min. As a result, the respond of the biosensing prototype developed is quite similar to that obtained with a conventional oven.
Fig. 5.

A) Temperature registered in the hybridization chamber during the hybridization event. B) Comparison of the % signal increase after hybridization with the SARS-CoV-2 sequence (500 fM) at a conventional oven and the portable chamber.
The response of the portable biosensor developed was compared to that obtained with a conventional one (using conventional oven and potentiostat). Fig. 6 shows the normalized biosensor response (presented as % of the signal increase) to the SARS-CoV-2 sequence and to a non-complementary sequence (used as a control) for both systems (n = 20 different electrochemical biosensing platforms). It can be observed that although in both biosensing systems, the response is much higher (more than 30 μA) when the hybridization event takes place with the complementary sequence (CoV-2), a better discrimination between complementary and non-complementary sequences results with the portable system developed, which agree well with the good signal-to-noise ratio of the developed potentiostat (see Fig. 4). This is confirmed by the statistical analysis performed using Student T-test that gives (with a confidence interval of at least 95% or a T-test p-value < 0.05) T-test p-values of 0.02 and 0.04 for the developed device and conventional one, respectively.
Fig. 6.

Biosensor response (represented as % signal increase), for both potentiostats, to the SARS-CoV-2 sequence (CoV-2) and a non-complementary sequence (CoV–2NC), used as a control. Data are presented as mean ± SD (n = 20 different electrochemical biosensing platforms). Statistical analysis was carried out using R software (R Development Core Team, Vienna, Austria). A Student T-test, with a T-test p-value < 0.05 or confidence interval of at least 95%, has been used to consider significant (sig) differences.
Analytical parameters of the portable device were also studied. The portable biosensor shows linear response with the concentration of SARS-CoV-2 sequence (see Fig. 9SI) and fits the equation: Y = 0.0122 [SARS-CoV-2] + 89.21 (R = 0.995). The method has a sensitivity of 0.0122 μAfM−1, obtained from the slope of the plot. The LOD and LOQ were found to be 22.1 and 69.4 fM, respectively, and were calculated using the 3 Sb m−1 and 10 Sb m−1 criteria, where Sb is the standard deviation of the background signal (probe-SH/AuNTs/CSPE) and m is the slope of the calibration curve.
The reproducibility of the method was estimated from the response of 20 electrodes, prepared using the same protocol, to 500 fM analyte sequence. The relative standard deviation (RSD) was calculated to be 7.7%. The repeatability of the biosensor was also evaluated by measuring 5 times the biosensor response. In this case, the RSD was found to be 2.6%. Moreover, the biosensor response is stable at least over a period of one month.
The selectivity of the biosensor to detect specific sequences SARS-CoV-2 in samples containing SARS-CoV-2 sequence (500 fM) in presence of other virus sequences such as Influenza A (H7N9) or SARS-CoV-1virus (at the same concentration (500 fM) was also evaluated. In both cases, the biosensor response is quite similar to those obtained for only SARS-CoV-2 sequence (see Fig. 10SI). This result demonstrates that the developed biosensor can detect a SARS-CoV-2 target sequence even in presence of potential interfering sequences.
Based on the good results obtained, we applied the developed device to directly detect RNA sequences of SARS-CoV-2 in nasopharyngeal samples of COVID-19 patients without using any amplification process (see procedures of experimental section). These samples were provided and previously analyzed at Hospital Ramon y Cajal by RT-qPCR to validate the biosensor. As it is described in Experimental section two different samples were analyzed, a nasopharyngeal sample of an infected patient with a medium viral load (25 Cts) and a sample from a non-infected patient, used as control. Fig. 11SI shows the biosensor signal for the infected (25 cts) and a non-infected sample. As can be observed the biosensor response for the infected is ten times higher than in the case of the non-infected sample, pointing out that the portable biosensor can be employed for rapid detection of SARS-CoV-2 avoiding any amplification process.
4. Conclusions
In this work, we present the design of a portable DNA biosensor for detection of SARS-CoV-2 sequences paving the way to a POC DNA sensing device. It is based on the combination of three components: a disposable DNA sensing electrochemical platform nanostructured with gold nanotriangles to increase its sensitivity, a portable potentiostat and a portable hybridization chamber. We present in detail the design, construction, and validation of all components of the prototype. The system is composed of the following main blocks: a main controller board that manages the whole equipment; a data acquisition board that houses all the required components to perform a fast and low noise data acquisition; and a hybridization chamber that allows to prepare the sample. The main goals of this work were the fabrication of a portable, low cost and easy to use DNA biosensing device with application to the detection of specific DNA sequences such as from SAR-CoV-2 virus. This is accomplished due to the reduced size (10 × 8 × 4 cm), reduced cost and the possibility to use the system through a computer, smartphone or tablet, connected to the same local network or using an internet connection, offering a friendly user interface for the operation. We validated the portable potentiostat and the hybridization chamber prototype by detecting SARS-CoV-2 sequences with a detection limit of 22.2 fM. The results obtained with the new device are comparable or even better to those obtained using a commercial Autolab potentiostat suggesting the possibility of employ the prototype in POC testing. The developed device works well even using real RNA samples of COVID-19 patients avoiding amplification steps confirming the potential application of this portable DNA biosensor in real samples.
Credit author statmet
Rafael del Caño has synthetized gold nanomaterials and has carried out the experiments regarding the DNA sensing platform. Karim has designed and carry out the experiments regarding the portable potentiostat. Mónica Luna have performed the AFM and SEM characterization analysis. Melanie Abreu, Rafael Cantón and Juan Carlos Galán have obtained, classified and analyzed by RT-qPCR the patient samples. Milagros Castellanos and Paula Milán extracted the RNA from patient samples. Alvaro Somoza, Rodolfo Miranda have supervised the experimental results regarding RT-qPCR the patient samples. Guillermo González de Rivera has supervised the experimental results related to potentiostat development and has elaborated the manuscript. Tania García-Mendiolaand Encarnación Lorenzo have supervised the experimental results related to biosensor development and have elaborated the manuscript.
Declaration of competing interest
The authors declare that they have no known competing financial interests or personal relationships that could have appeared to influence the work reported in this paper.
Acknowledgment
This work has been financially supported by the Spanish Ministry of Economy and Competitiveness (PID2020-116728RB-I00, CTQ2015-71955-REDT (ELECTROBIONET)) and Community of Madrid (TRANSNANOAVANSENS, S2018/NMT-4349). Authors also acknowledge REACT EU NANOCOV-CM project. We acknowledge the service from the MiNa Laboratory at IMN, and funding from Community of Madrid (project S2018/NMT-4291 TEC2SPACE), MINECO (project CSIC13-4E-1794) and EU (FEDER, FSE)”. RdC gratefully thanks support from Fundación IMDEA, UAM and Banco Santander (fondo supera 2020, convocatoria CRUE–CSIC–SANTANDER, project with reference 10.01.03.02.41).
Footnotes
Supplementary data to this article can be found online at https://doi.org/10.1016/j.talanta.2022.123542.
Appendix A. Supplementary data
The following is the Supplementary data to this article:
References
- 1.Dye C. After 2015: infectious diseases in a new era of health and development. Philos. Trans. R. Soc. Lond. B Biol. Sci. 2014;369 doi: 10.1098/RSTB.2013.0426. [DOI] [PMC free article] [PubMed] [Google Scholar]
- 2.Wu F., Zhao S., Yu B., Chen Y.M., Wang W., Song Z.G., Hu Y., Tao Z.W., Tian J.H., Pei Y.Y., Yuan M.L., Zhang Y.L., Dai F.H., Liu Y., Wang Q.M., Zheng J.J., Xu L., Holmes E.C., Zhang Y.Z. A new coronavirus associated with human respiratory disease in China. Nature. 2020;579:265–269. doi: 10.1038/S41586-020-2008-3. [DOI] [PMC free article] [PubMed] [Google Scholar]
- 3.Statement on the second meeting of the International Health Regulations (2005) Emergency Committee regarding the outbreak of novel coronavirus (2019-nCoV), (n.d.). https://www.who.int/news/item/30-01-2020-statement-on-the-second-meeting-of-the-international-health-regulations-(2005)-emergency-committee-regarding-the-outbreak-of-novel-coronavirus-(2019-ncov) (accessed January 4, 2022).
- 4.Renzoni A., Perez F., Ngo Nsoga M.T., Yerly S., Boehm E., Gayet-Ageron A., Kaiser L., Schibler M. Analytical evaluation of visby medical RT-PCR portable device for rapid detection of SARS-CoV-2. Diagnostics. 2021:11. doi: 10.3390/DIAGNOSTICS11050813. [DOI] [PMC free article] [PubMed] [Google Scholar]
- 5.Shen M., Zhou Y., Ye J., Abdullah AL-maskri A.A., Kang Y., Zeng S., Cai S. Recent advances and perspectives of nucleic acid detection for coronavirus. J. Pharm. Anal. 2020;10:97–101. doi: 10.1016/J.JPHA.2020.02.010. [DOI] [PMC free article] [PubMed] [Google Scholar]
- 6.Dinnes J., Deeks J.J., Berhane S., Taylor M., Adriano A., Davenport C., Dittrich S., Emperador D., Takwoingi Y., Cunningham J., Beese S., Domen J., Dretzke J., Ferrante di Ruffano L., Harris I.M., Price M.J., Taylor-Phillips S., Hooft L., Leeflang M.M.G., McInnes M.D.F., Spijker R., Van den Bruel A., Arevalo-Rodriguez I., Buitrago D.C., Ciapponi A., Mateos M., Stuyf T., Horn S., Salameh J.P., McGrath T.A., van der Pol C.B., Frank R.A., Prager R., Hare S.S., Dennie C., Jenniskens K., Korevaar D.A., Cohen J.F., van de Wijgert J., Damen J.A.A.G., Wang J., Agarwal R., Baldwin S., Herd C., Kristunas C., Quinn L., Scholefield B. Rapid, point-of-care antigen and molecular-based tests for diagnosis of SARS-CoV-2 infection. Cochrane Database Syst. Rev. 2021;3 doi: 10.1002/14651858.CD013705.PUB2. [DOI] [PMC free article] [PubMed] [Google Scholar]
- 7.Kubina R., Dziedzic A. Molecular and serological tests for COVID-19 a comparative review of SARS-CoV-2 coronavirus laboratory and point-of-care diagnostics. Diagnostics. 2020;10 doi: 10.3390/DIAGNOSTICS10060434. [DOI] [PMC free article] [PubMed] [Google Scholar]
- 8.Rodriguez-Manzano J., Malpartida-Cardenas K., Moser N., Pennisi I., Cavuto M., Miglietta L., Moniri A., Penn R., Satta G., Randell P., Davies F., Bolt F., Barclay W., Holmes A., Georgiou P. Handheld point-of-care system for rapid detection of SARS-CoV-2 extracted RNA in under 20 min. ACS Cent. Sci. 2021;7:307–317. doi: 10.1021/ACSCENTSCI.0C01288. [DOI] [PMC free article] [PubMed] [Google Scholar]
- 9.García T., Casero E., Revenga-Parra M., Martín-Benito J., Pariente F., Vázquez L., Lorenzo E. Architectures based on the use of gold nanoparticles and ruthenium complexes as a new route to improve genosensor sensitivity. Biosens. Bioelectron. 2008;24:184–190. doi: 10.1016/J.BIOS.2008.03.034. [DOI] [PubMed] [Google Scholar]
- 10.John A.S., Price C.P. Existing and emerging technologies for point-of-care testing. Clin. Biochem. Rev. 2014;35:155. /pmc/articles/PMC4204237/ [PMC free article] [PubMed] [Google Scholar]
- 11.Teengam P., Siangproh W., Tuantranont A., Henry C.S., Vilaivan T., Chailapakul O. Electrochemical paper-based peptide nucleic acid biosensor for detecting human papillomavirus. Anal. Chim. Acta. 2017;952:32–40. doi: 10.1016/J.ACA.2016.11.071. [DOI] [PubMed] [Google Scholar]
- 12.Bettazzi F., Voccia D., Martellini T., Cincinelli A., Palchetti I. vol. 2015. AISEM; 2015. Different enzyme-based strategies for the development of disposable electrochemical biosensors: application to environmental pollutant monitoring. (Proc. 2015 18th AISEM Annu. Conf). [DOI] [Google Scholar]
- 13.Yoo E.H., Lee S.Y. Glucose biosensors: an overview of use in clinical practice. Sensors. 2010;10:4558–4576. doi: 10.3390/S100504558. [DOI] [PMC free article] [PubMed] [Google Scholar]
- 14.Turner A.P.F. Biosensors: sense and sensibility. Chem. Soc. Rev. 2013;42:3184–3196. doi: 10.1039/C3CS35528D. [DOI] [PubMed] [Google Scholar]
- 15.Antiochia R. Developments in biosensors for CoV detection and future trends. Biosens. Bioelectron. 2021;173 doi: 10.1016/J.BIOS.2020.112777. [DOI] [PMC free article] [PubMed] [Google Scholar]
- 16.Choi J.R. Development of point-of-care biosensors for COVID-19. Front. Chem. 2020;8 doi: 10.3389/FCHEM.2020.00517. [DOI] [PMC free article] [PubMed] [Google Scholar]
- 17.Wang Q., Wang J., Huang Y., Du Y., Zhang Y., Cui Y., ming Kong D. Development of the DNA-based biosensors for high performance in detection of molecular biomarkers: more rapid, sensitive, and universal. Biosens. Bioelectron. 2022;197 doi: 10.1016/J.BIOS.2021.113739. [DOI] [PMC free article] [PubMed] [Google Scholar]
- 18.Zuo L., Islam S.K., Mahbub I., Quaiyum F. A low-power 1-V potentiostat for glucose sensors. IEEE Trans. Circuits Syst. II Express Briefs. 2015;62:204–208. doi: 10.1109/TCSII.2014.2387691. [DOI] [Google Scholar]
- 19.Colomer-Farrarons J., Miribel-Català P.L. Approach; 2011. A CMOS Self-Powered Front-End Architecture for Subcutaneous Event-Detector Devices: Three-Electrodes Amperometric Biosensor Approach, A C. Self-Powered Front. Archit. Subcutaneous Event-Detector Devices Three-Electrodes Amperometric Biosens; pp. 1–163. [DOI] [Google Scholar]
- 20.Schafer R.W. What is a savitzky-golay filter? IEEE Signal Process. Mag. 2011;28:111–117. doi: 10.1109/MSP.2011.941097. [DOI] [Google Scholar]
- 21.Press W.H., Teukolsky S.A. Savitzky‐Golay smoothing filters. Comput. Phys. 1998;4:669. doi: 10.1063/1.4822961. [DOI] [Google Scholar]
- 22.Krishnan S.R., Seelamantula C.S. On the selection of optimum Savitzky-Golay filters. IEEE Trans. Signal Process. 2013;61:380–391. doi: 10.1109/TSP.2012.2225055. [DOI] [Google Scholar]
- 23.Sadeghi M., Behnia F. 2018. Optimum Window Length of Savitzky-Golay Filters with Arbitrary Order. [DOI] [Google Scholar]
- 24.Sadikoglu F., Kavalcioǧlu C. Filtering continuous glucose monitoring signal using savitzky-golay filter and simple multivariate thresholding. Procedia Comput. Sci. 2016;102:342–350. doi: 10.1016/J.PROCS.2016.09.410. [DOI] [Google Scholar]
- 25.García-Mendiola T., Cerro M.R., López-Moreno J.M., Pariente F., Lorenzo E. Dyes as bifunctional markers of DNA hybridization on surfaces and mutation detection. Bioelectrochemistry. 2016;111:115–122. doi: 10.1016/j.bioelechem.2016.06.003. [DOI] [PubMed] [Google Scholar]
Associated Data
This section collects any data citations, data availability statements, or supplementary materials included in this article.