Abstract
HOXB13, a homeodomain transcription factor, critically regulates androgen receptor (AR) activities and androgen-dependent prostate cancer (PCa) growth. However, its functions in AR-independent contexts remain elusive. Here we report HOXB13 interaction with histone deacetylase HDAC3, which is disrupted by HOXB13 G84E mutation that has been associated with early-onset PCa. Independently of AR, HOXB13 recruits HDAC3 to lipogenic enhancers to catalyze histone deacetylation and suppress lipogenic regulators such as fatty acid synthase (FASN). Analysis of human tissues reveals that the HOXB13 gene is hypermethylated and downregulated in approximately 30% of metastatic castration-resistant PCa. HOXB13 loss or G84E mutation leads to lipid accumulation in PCa cells, thereby promoting cell motility and xenograft tumor metastasis, which is mitigated by pharmaceutical inhibition of FASN. In summary, we present evidence that HOXB13 recruits HDAC3 to suppress de novo lipogenesis and inhibit tumor metastasis and that lipogenic pathway inhibitors may be useful to treat HOXB13-low PCa.
INTRODUCTION
Prostate Cancer (PCa) is marked by increased expression of critical enzymes of the lipogenic pathway, including the fatty acid synthase (FASN). FASN catalyzes all of the reactions of de novo lipogenesis, generating palmitic acid and the sterol regulatory element-binding proteins (SREBPs, also called SREBFs) that bind to the promoters of most enzymes involved in sterol biosynthesis1,2. Androgen receptor (AR), a key driver of PCa, is a major regulator of lipid metabolism, controlling the expression of more than 20 enzymes involved in the synthesis, uptake, and metabolism of lipids3. Accordingly, androgens stimulate lipid accumulation in PCa cells4,5 and reactivation of AR-induced lipid biosynthesis has been reported to drive metastatic castration-resistant prostate cancer (CRPC)6. Accumulation of lipid droplets has been seen in aggressive clinical prostate tumors and metastatic deposits and in circulating prostate tumor cells7. Recently, new molecular regulators of lipoid biosynthesis in PCa, such as PTEN loss, MAPK activation, and nuclear pyruvate dehydrogenase complex8–10, have begun to emerge.
HOXB13 is a member of the homeobox (HOX) family transcription factors that recognize and bind conserved DNA motifs11,12. HOXB13 is expressed mainly in the adult prostate and at a much lower level in the colorectum13,14. Transgenic mice studies have shown that HOXB13 expression is required for epithelial differentiation of the ventral prostate15. Understanding of HOXB13 molecular function in PCa has been primarily limited to its interaction with and regulation of AR. When expressed in benign prostate cells along with FOXA1, HOXB13 facilitates the reprogramming of AR to a PCa-specific cistrome16. In androgen-dependent LNCap cells, HOXB13 has been shown to have multifaceted roles in potentially initiating, tethering, or antagonizing AR binding to chromatin depending on the genomic loci17. In PCa cell lines such as 22Rv1 and LN95 that express ARv7, a CRPC-associated AR variant18, HOXB13 protein co-localizes with ARv7 to co-regulate target genes. HOXB13 co-occupancy with AR on the genome of PCa cells is also enhanced by the depletion of CHD119. It is thus plausible that HOXB13 regulates AR cistrome in both gene- and context-dependent manners. Likewise, the roles of HOXB13 in PCa tumorigenesis have also been an area of great controversy. Some studies have shown that HOXB13 promotes cell growth12,16–18, whereas others demonstrated growth-inhibitory effects20,21. Norris et al. demonstrated that HOXB13 knockdown (KD) abolished androgen-dependent LNCaP cell growth but not that of hormone-deprived cells17. Genome-wide association studies have identified PCa-linked SNPs locate within functional HOXB13 binding sites to disrupt HOXB13 regulation of target genes such as RFX612,22–24. Critically, germline mutation of HOXB13 at G84E has been associated with familial PCa and an early-onset disease25, compared to its wildtype (WT) counterparts. G84E variant locates within the MEIS-binding domain of HOXB13 that mediates its interaction with MEIS proteins, which are putative tumor suppressors frequently silenced in aggressive PCa21. However, G84E mutation does not affect the interaction between HOXB13 and MEIS126, and its potential role in tumorigenesis remain unclear.
Histone deacetylases (HDACs) are enzymes that catalyze the removal of acetyl groups from the lysine residues of histone proteins on nucleosomes, thus mediating transcriptional repression. HDAC3 is a member of class I HDACs, which also include HDAC1 and HDAC2 and serve as the catalytic subunits of various corepressor complexes27. HDAC3 is the catalytic subunit of the NCoR (Nuclear receptor corepressor)/SMRT (Silencing Mediator for Retinoid and Thyroid hormone receptors) complex28. The binding of NCoR and SMRT is, in turn, required to activate the histone deacetylase function of HDAC329–32. Recent studies have revealed a role of HDAC3 in inhibiting de novo lipogenesis and controlling metabolic transcriptional networks in liver cells33,34. Inactivation of HDAC3 in the liver increased the expression of genes that drive lipid biosynthesis and storage, causing hepatomegaly and fatty liver34,35. HDAC3 and NCoR1 co-localize near the regulatory elements of genes involved in lipid metabolism35.
Here, we identify HDAC3 as a key cofactor of HOXB13, and show that they cooperate in remodeling the epigenome and suppressing de novo lipogenesis in both AR-positive and -negative PCa. Mechanistically, the MEIS domain of HOXB13 interacts with HDAC3, and this interaction is disrupted by HOXB13 loss or G84E mutation, leading to expression of lipogenic regulators such as FASN. Consequently, HOXB13 loss results in massive lipid accumulation in PCa cells, thereby increasing cell motility in vitro and tumor metastasis in vivo. Lastly, we identify about 30% of CRPC with low HOXB13 expression, likely due to DNA hypermethylation, which may be targeted by pharmaceutical inhibition of FASN.
RESULTS
HOXB13 WT, but not G84E mutant, inhibits lipogenic programs
To gain insight into the genes and pathways that HOXB13 regulates in PCa cells, we generated stable LNCaP cell lines with control, HOXB13 KD using shRNA targeting its 3’ untranslated regions, and KD rescued by WT HOXB13 or its G84E mutant. RNA sequencing (RNA-seq) identified 276 and 206 genes that were respectively decreased or increased upon HOXB13 KD (Fig. 1a and Extended Data Fig. 1a). Gene Ontology (GO) analyses revealed that HOXB13-repressed genes were involved in the steroid metabolic, lipid biosynthetic, and fatty acid metabolic processes, whereas HOXB13-induced genes were enriched for molecular concepts related to cell division, cell cycle, and DNA replication (Fig. 1b and Extended Data Fig. 1b). As expected, re-introducing WT HOXB13 to HOXB13-KD cells fully rescued gene expression. However, re-expression of HOXB13 G84E failed to suppress approximately one-third of the HOXB13-repressed genes, while its ability to rescue HOXB13-induced genes was largely unaffected. Accordingly, RT-qPCR and western blot (WB) analyses confirmed that HOXB13 KD greatly increased the expression of lipogenic genes, such as FASN and SREBF1/2, and also PSA, the clinical biomarker for PCa. Their expression was again repressed by the re-introduction of WT, but not G84E HOXB13 (Fig. 1c,d). By contrast, HOXB13 KD decreased the expression of key cell cycle regulators36, which were fully rescued by the re-expression of either WT or G84E HOXB13 (Extended Data Fig. 1c). Analyses of additional PCa cell lines including 22Rv1, C4–2B, as well as AR-negative HOXB13-positive PC-3 cells further validated transcriptional repression of lipogenic genes by WT, but not G84E, HOXB13 (Fig. 1e and Extended Data Fig. 1d,e). Moreover, HOXB13 depletion continued to upregulate FASN in LNCaP cells with AR KD (Fig. 1f). These data suggest that HOXB13 mediates transcriptional repression of lipogenic programs independently of AR, while its induction of cell cycle requires active androgen signaling (Extended Data Fig. 1f and Supplementary Fig. 1a–e).
Fig. 1. HOXB13 WT, but not G84E mutant, inhibits lipogenic programs in PCa.
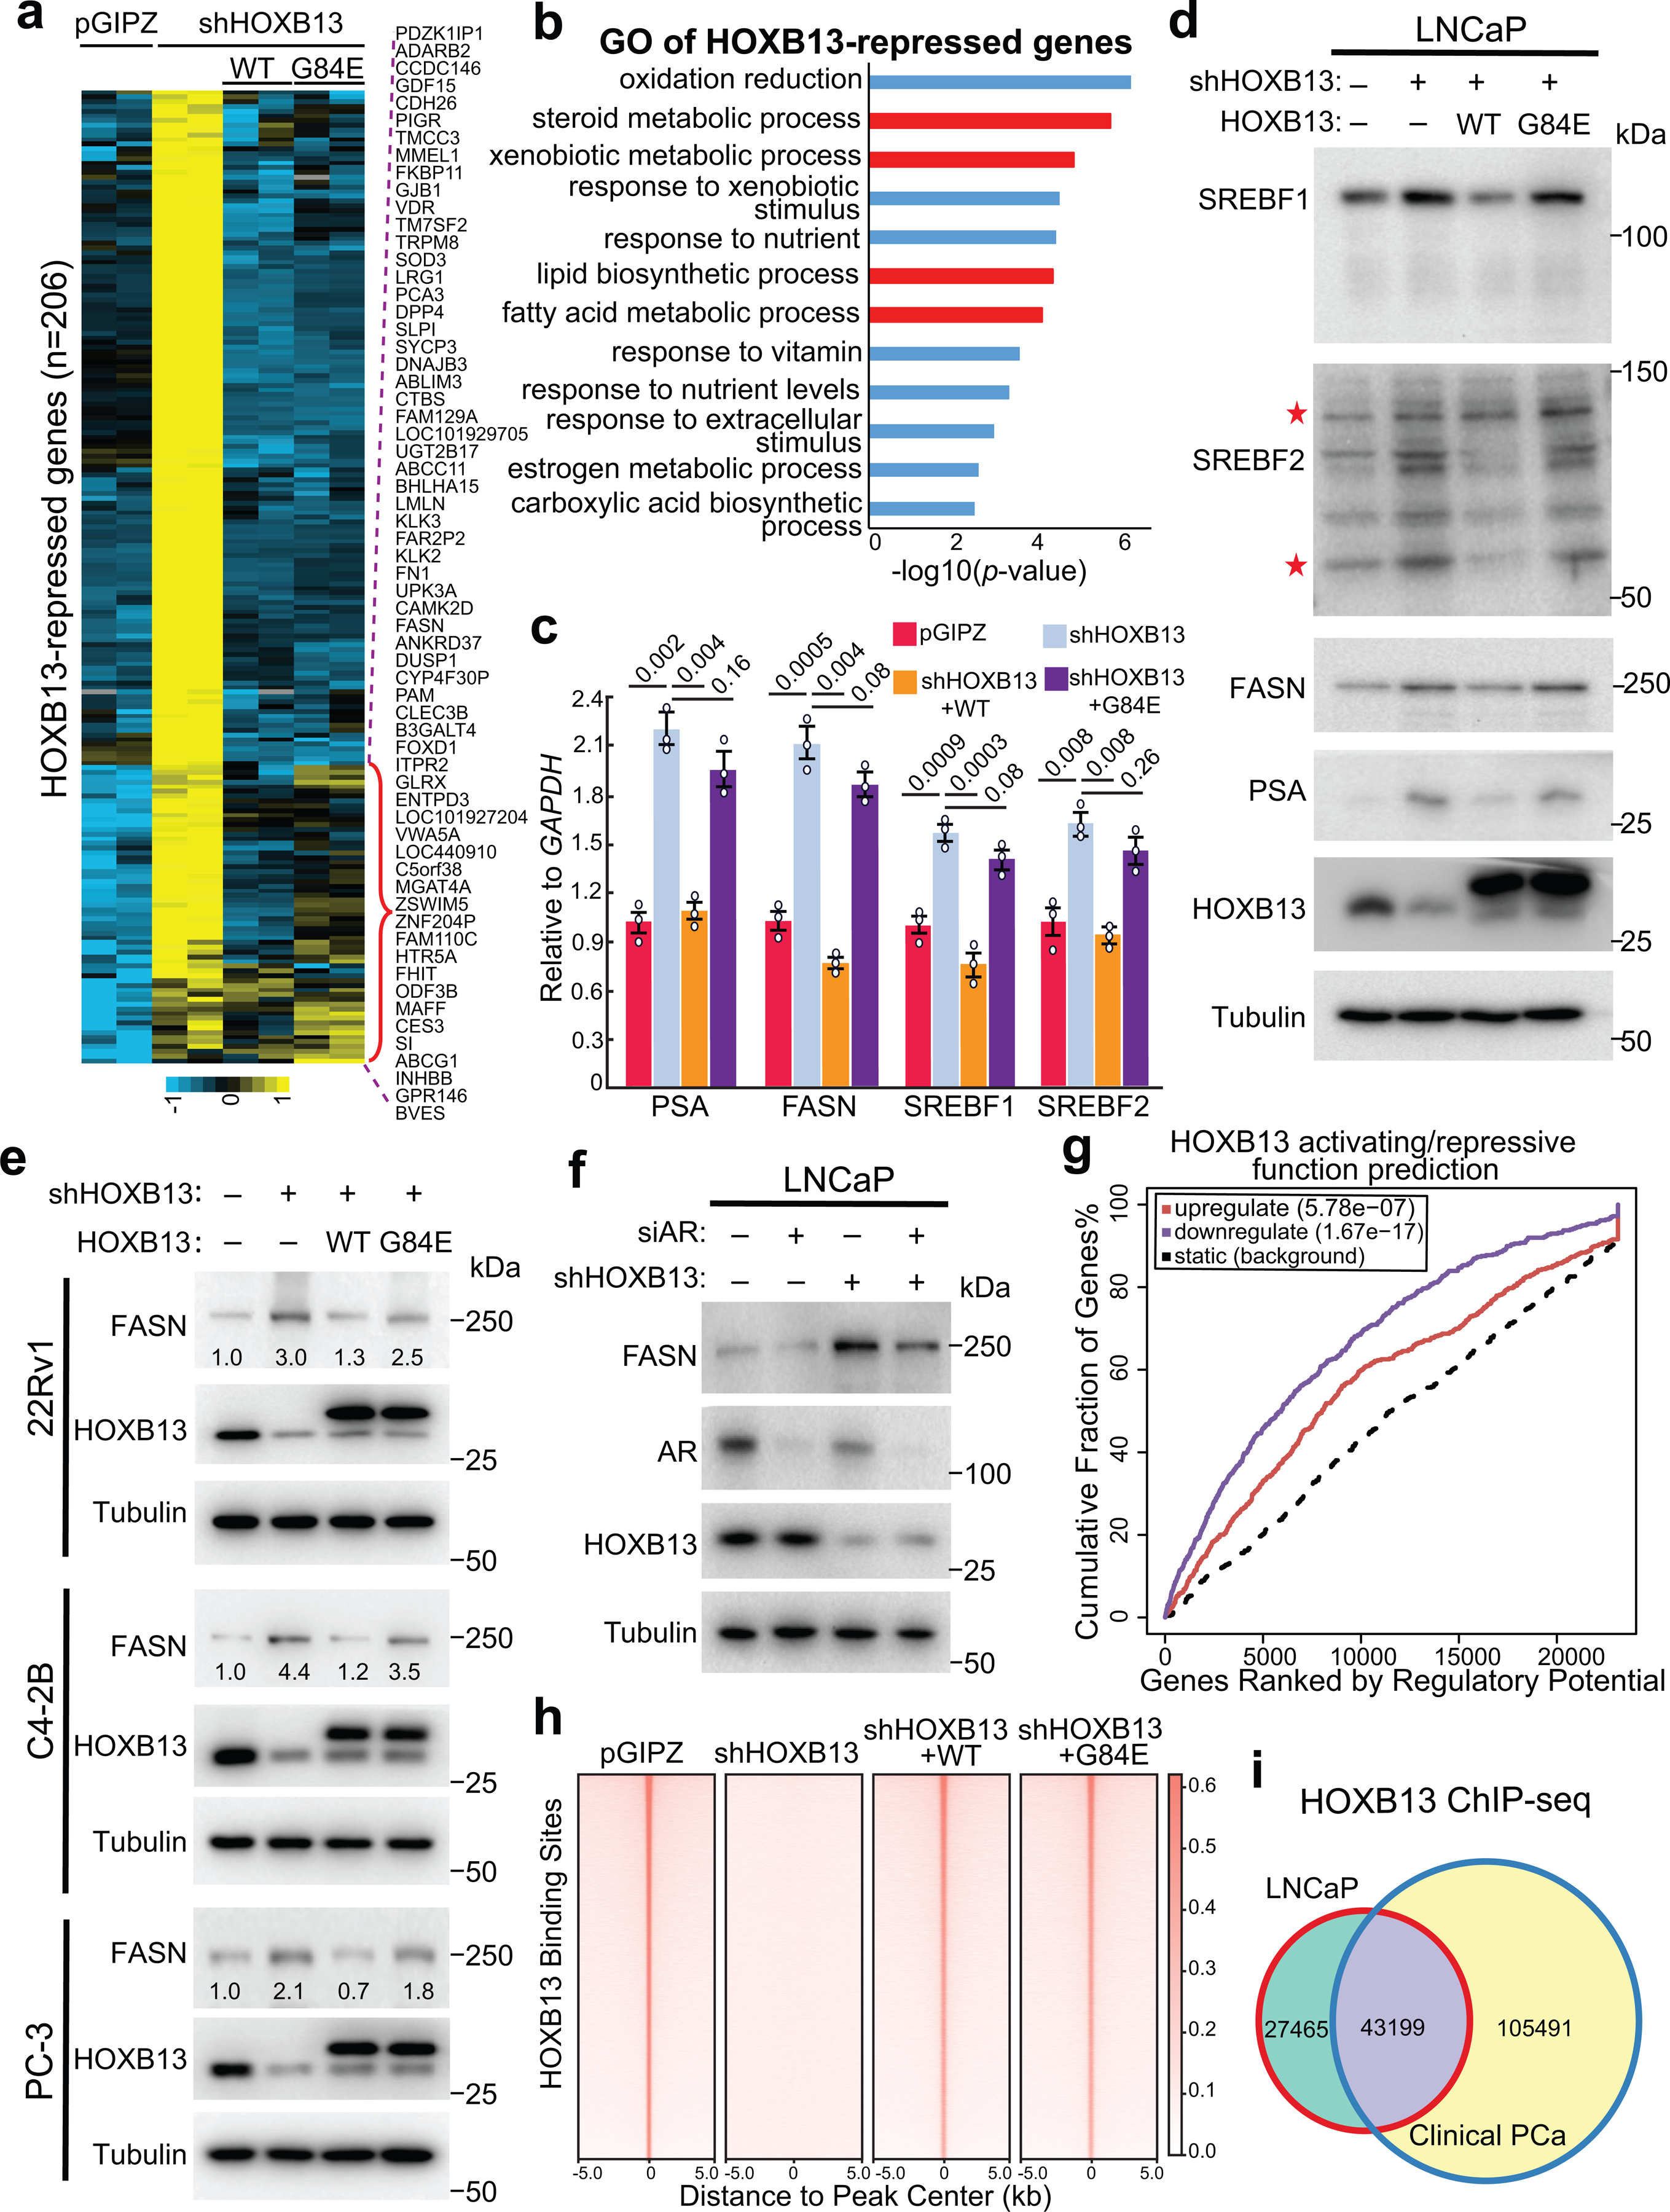
a. Heatmap showing HOXB13-repressed gene expression in PCa cells with HOXB13 KD (shHOXB13) and/or rescue by WT or G84E HOXB13. HOXB13-repressed genes were derived by comparing shHOXB13 with pGIPZ cells using FDR <0.05 and fold-change ≥2.5. The red bracket indicates HOXB13-repressed genes that are rescued by WT, but not G84E, HOXB13. The complete gene lists are included in Supplemental Table 3.
b. GO analysis of HOXB13-repressed genes identified in (a). Top enriched molecular concepts are shown on y-axis, while x-axis indicates enrichment significance. One-sided Fisher’s exact test was performed, and −log10 P values are shown.
c. RT-qPCR validation of key lipogenic gene regulation by HOXB13 in LNCaP cells. Data were normalized to GAPDH and shown as technical replicates from one of three (n = 3) biological replicates. Data shown are mean ±s.e.m. P values by unpaired two-sided t-test.
d. WB of key lipogenic gene regulation by HOXB13 KD and rescue in LNCaP cells. *uncleaved and cleaved forms of SREBF2.
e. WB analysis of FASN regulation by HOXB13 in multiple PCa cell lines with HOXB13 KD and/or WT/G84E rescue.
f. WB analysis of FASN regulation by HOXB13 in LNCaP cells with KD of AR (siAR) and/or HOXB13.
g. HOXB13 ChIP-seq data were integrated with RNA-seq of control and HOXB13-KD LNCaP cells using BETA software to predict activating/repressive functions of HOXB13. Genes are cumulated by rank on the basis of the regulatory potential score from high to low. The dashed line indicates the non-differentially expressed genes as background. The red and purple lines represent the upregulated and downregulated genes, respectively, and their P values were calculated relative to the background group by the Kolmogorov-Smirnov test.
h. Heatmap showing HOXB13 ChIP-seq intensity in HOXB13-KD and rescue LNCaP cells.
i. Venn Diagram comparing HOXB13 cistromes between LNCaP and human PCa tissues.
To determine whether HOXB13 directly controls key lipogenic regulators, we performed HOXB13 ChIP in LNCaP cells (Extended Data Fig. 1g). Integration of ChIP-seq and transcriptomic data using BETA software37 predicted that transcriptional repression is the principal molecular function of HOXB13, much more than its ability in gene activation (Fig. 1g). Further, HOXB13 binding sites were drastically reduced in the HOXB13-KD cells, as expected, and fully rescued by both WT and G84E HOXB13 (Fig. 1h). This pattern of HOXB13 occupancy and rescue at the enhancer elements of lipogenic regulators was confirmed by ChIP-qPCR (Extended Data Fig. 1h,i), suggesting that G84E mutation did not affect the DNA-binding ability of HOXB13. This is consistent with prior reports that HOXB13 interacts with DNA through its HOX DNA binding domain17. Further, comparing HOXB13 binding sites with those identified in clinical specimens38 revealed a notable overlap and validated HOXB13 occupancy at lipogenic enhancers in human PCa tissues (Fig. 1i and Supplementary Fig. 1f). In aggregate, we identified an essential role of HOXB13 in directly suppressing a lipogenic transcriptional program in PCa cells. This function is independent of AR, but is disrupted by HOXB13 G84E mutation.
HOXB13 interacts with HDAC3 protein through its MEIS domain
To identify potential cofactors of HOXB13 in suppressing a lipogenic program, we performed tandem affinity purification followed by mass spectrometry analysis of WT or G84E HOXB13 expressed in LNCaP cells. Interestingly, we found strong interactions of HOXB13 with HDAC1/3 and their corepressors NCoR1/2 and TBL1X, and these interactions were drastically reduced by G84E mutation (Extended Data Fig. 2a). Co-immunoprecipitation (co-IP) of Flag-tagged HDAC1 or HDAC3 in LNCaP cells confirmed interaction with HOXB13, whereas reciprocal co-IP showed that WT HOXB13, but not G84E, strongly enriched HDAC1 and HDAC3 (Fig. 2a,b). As controls, AR interaction with HOXB13 was not mitigated by G84E mutation. Further, AR depletion did not affect the interaction between HOXB13 and HDAC3 and this interaction was also detected in the AR-negative PC-3 cells, suggesting its independence of AR (Fig. 2c,d). Moreover, following ectopic HDAC3 overexpression (OE), NCoR1 co-IP strongly enriched for HOXB13, which is reduced by the deletions of the DAD domain (ΔDAD) and aa1500–1950 (ΔDAD/H) of NCoR1, regions known to mediate its binding to HDAC339–41 (Extended Data Fig. 2b,c). These data suggest that HDAC3 bridges the interaction between HOXB13 and NCoR1, which is required for enzymatic activation of HDAC329–32.
Fig. 2. HOXB13 interacts with HDAC3 protein through its MEIS domain.
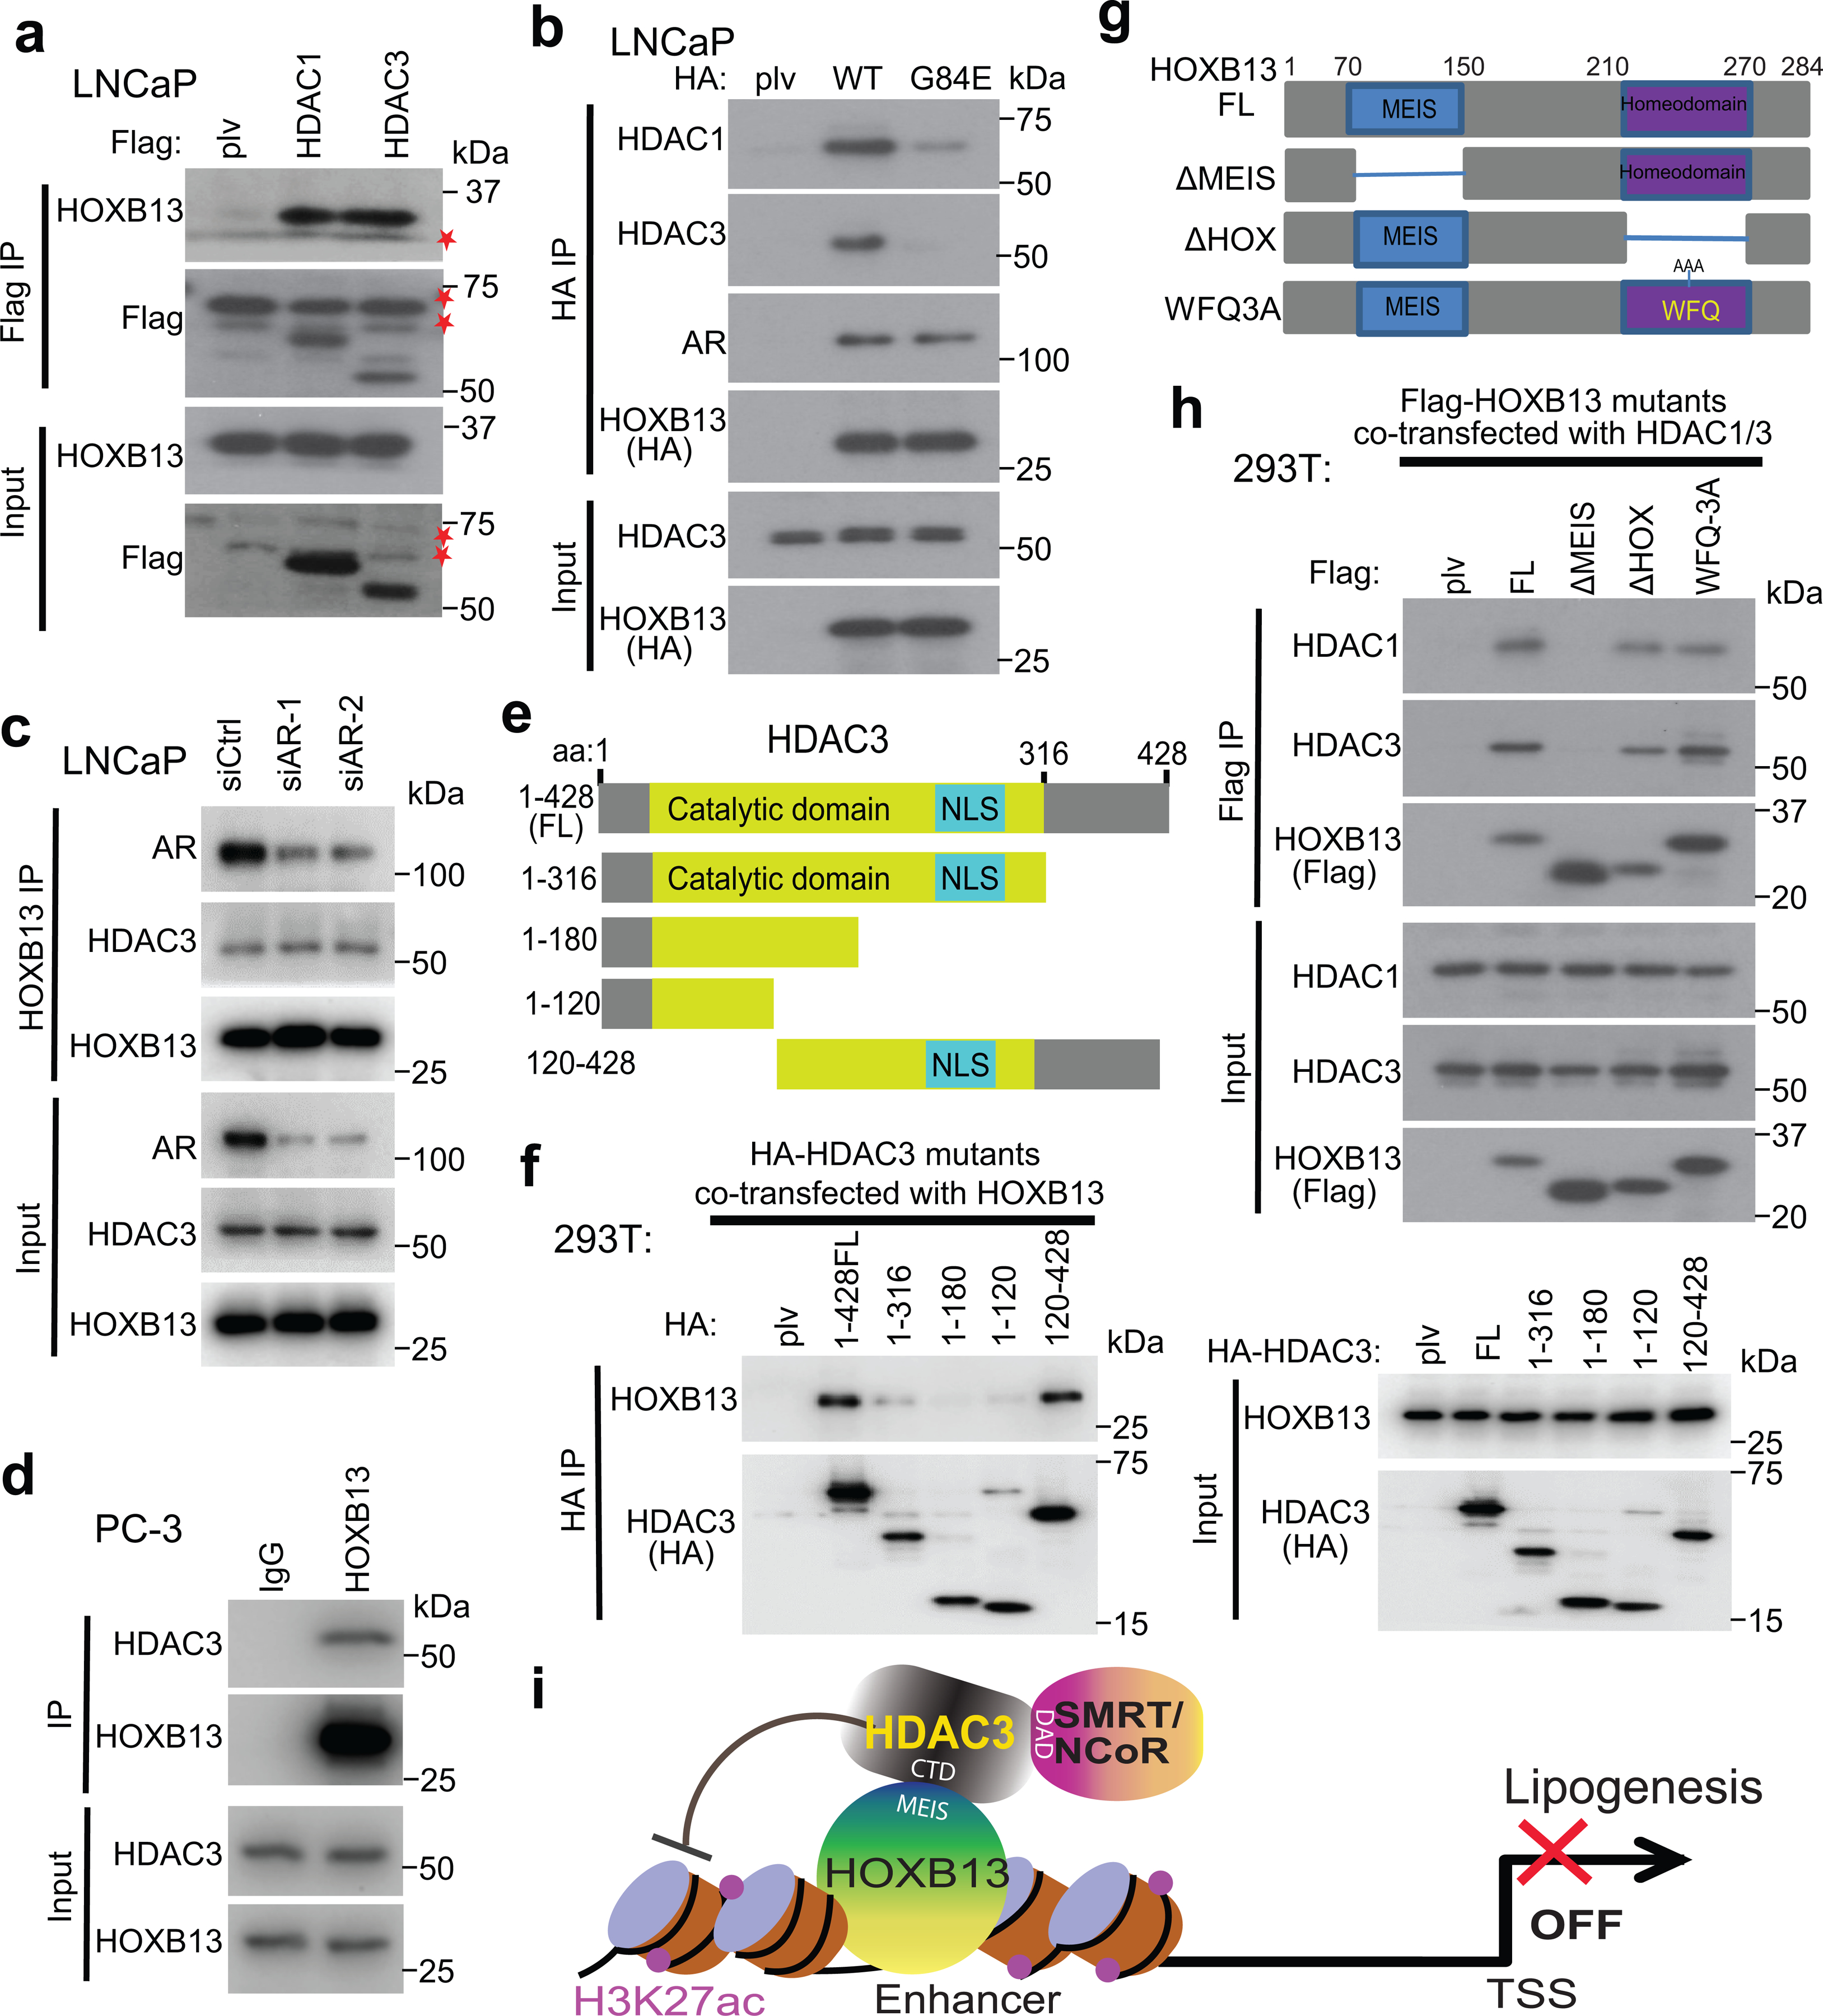
a. Co-IP of HDAC1 and HDAC3 shows interaction with HOXB13. Whole-cell lysates from LNCaP cells stably expressing Flag-tagged HDAC1 or HDAC3 were subjected to co-IP using anti-Flag antibody. The eluted co-IP complex was analyzed by WB, along with input controls. * indicates non-specific bands detected by anti-Flag antibody.
b. Cell lysates from LNCaP stably expressing HA-HOXB13 WT or G84E mutant were subjected to co-IP using an anti-HA antibody and then WB, along with input controls.
c. HOXB13 interaction with HDAC3 is not dependent on AR. Whole-cell lysates from LNCaP with control (siCtrl) or AR knockdown (siAR) were subjected to co-IP using an anti-HOXB13 antibody and then WB, along with input controls.
d. AR-negative PC-3 cells were subjected to co-IP using anti-HOXB13 or IgG control antibodies and then WB, along with input controls.
e-f. Co-IP of HA-HDAC3 FL or deletion constructs (e) transfected into 293T cells with coexpression of HOXB13 (f).
g-h. Co-IP of Flag-HOXB13 FL or deletion constructs (g) transfected into 293T cells with HDAC1 and HDAC3 co-expression (h).
i. A model depicting the interactions between HOXB13 and HDAC3/NCoR complex. CTD: C-terminal domain of HDAC3; MEIS: the MEIS domain of HOXB13; and DAD: the DAD domain of SMRT/NCoR.
To map the domains of HDAC3 that interact with HOXB13, we cloned HDAC3 full-length (FL) and a series of truncation mutants, which was co-transfected with HOXB13 into 293T cells. Co-IP suggested that the C-terminal domain of HDAC3 (aa316–428) is sufficient and necessary for its interaction with HOXB13 (Fig. 2e,f and Extended Data Fig. 2d,e). Conversely, to examine how HOXB13 protein interacts with HDAC3, we generated several HOXB13 deletion mutants, including ΔMEIS (aa70–150) that is unable to bind MEIS proteins and ΔHOX (aa210–270) and WFQ-3A mutation that have impaired DNA-binding ability17 (Extended Data Fig. 2f). Co-IP experiments revealed that the MEIS domain is required for HOXB13 to interact with HDAC3 protein (Fig. 2g,h and Extended Data Fig. 2g,h). Further, despite HOXB13 interacting with both HDAC3 and MEIS1 through its MEIS domain, we found no competition between their interactions (Extended Data Fig. 2i). In summary, our data suggest a model wherein the HOXB13 MEIS domain interacts with the C-terminus of HDAC3, which subsequently recruits NCoR1/SMRT for enzymatic activation, and that this complex is independent of AR and MEIS1 (Fig. 2i).
HOXB13 recruits HDAC3 to catalyze histone deacetylation
ChIP-seq analyses revealed substantial overlap between HOXB13 and HDAC3 cistromes, a majority of which are distinct from HOXB13 and AR co-occupied sites (Fig. 3a and Supplementary Fig. 2a,b). Interestingly, HDAC3 co-occupied HOXB13-binding sites, hereafter defined as HH sites, are enriched for H3K27ac and increased chromatin accessibility (Fig. 3b). This is consistent with previous notion that HDAC3 is targeted to active genes with acetylated histones to reset chromatin by removing acetylation42. Critically, depletion of HOXB13 not only abolished HOXB13 cistrome but also reduced HDAC3 recruitment to the HH sites accompanied by a concordant increase in H3K27ac, while AR binding, on the contrary, was not altered (Fig. 3b and Extended Data Fig. 3a,b). Similar HOXB13-dependent recruitment of HDAC3 and deacetylation of H3K27ac at HH sites was also observed in the AR-negative PC-3 cells (Extended Data Fig. 3c–e). Moreover, analyses of publically available ChIP-seq data confirmed strong H3K27ac at HH sites in clinical PCa specimens38(Fig. 3c). ChIP-qPCR confirmed substantially higher HOXB13 and HDAC3 occupancy, but lower H3K27ac, at the lipogenic enhancers in HOXB13high than HOXB13low tumors of patient-derived xenografts (PDXs) from human metastatic CRPC43 (Extended Data Fig. 3f–h and Supplementary Fig. 2c,d).
Fig. 3. HOXB13 recruits HDAC3 to catalyze histone deacetylation.
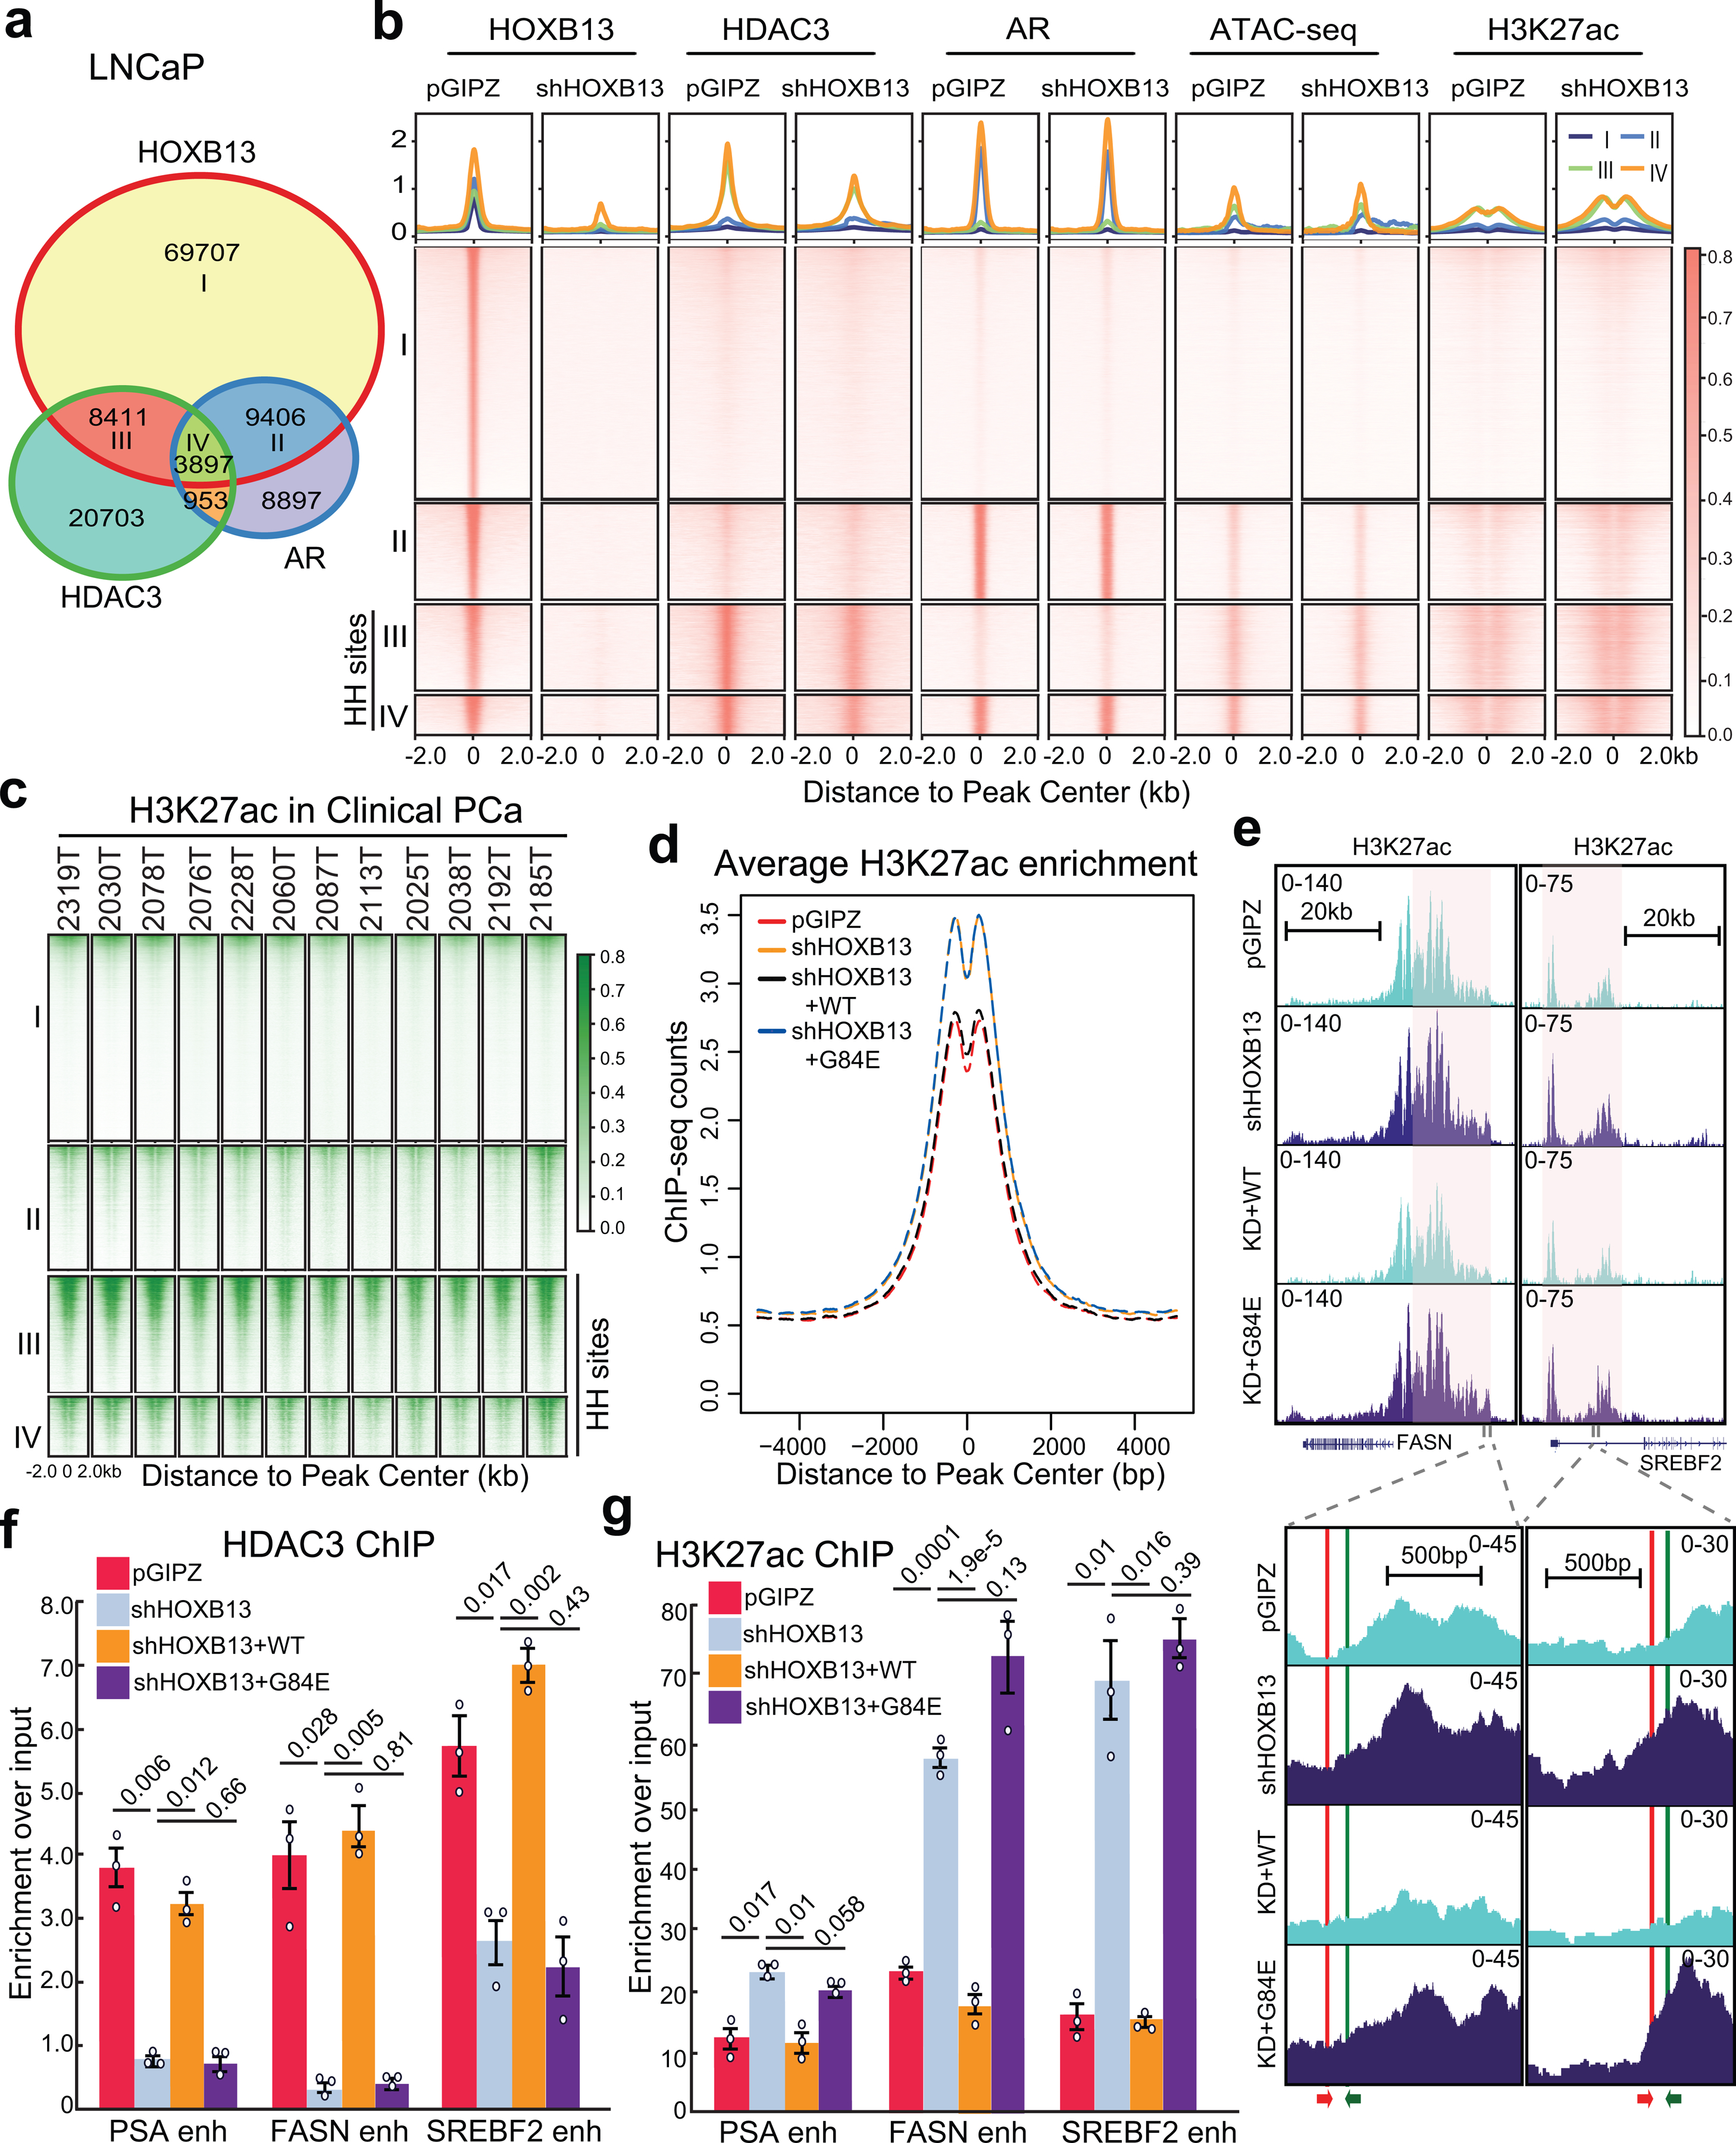
a. Venn diagram showing overlap of HOXB13, AR, and HDAC3 binding sites in LNCaP cells.
b. Heatmap showing signals of HOXB13, HDAC3, AR, and H3K27ac ChIP-seq and ATAC-seq in LNCaP cells with control or HOXB13 KD, centered (± 2 kb) on selected genomic regions defined in a. HH sites: HOXB13/HDAC3 co-occupied sites. The color bar on the right shows the scale of enrichment intensity.
c. Heatmap showing H3K27ac ChIP-seq signal in a set of 12 clinical PCa samples (GSE130408) centered on selected genomic regions as in b.
d. Average H3K27ac signal centered (± 5 kb) on HDAC3 and HOXB13 co-occupied sites (HH sites). H3K27ac ChIP-seq was performed in LNCaP infected with pGIPZ control, shHOXB13 (KD), or KD with co-infection of WT or G84E HOXB13.
e. Genome browser view of H3K27ac ChIP-seq signal around representative lipogenic genes (FASN, chr17:80,036,214–80,056,106 and SREBF2, chr22:42,229,106–42,302,375, hg19). The red and green arrows at the bottom indicate the primers used for the ChIP-qPCR assay.
f-g. HDAC3 (f) and H3K27ac (g) ChIP-qPCR validation of lipogenic gene enhancers (enh) in LNCaP with HOXB13 KD and/or rescue. Primers for FASN and SREBF2 are depicted in e. Data were normalized to 2% of input DNA. Shown are the mean ±s.e.m. of technical replicates from one of three (n = 3) independent experiments. P values were calculated by unpaired two-sided t-test.
To examine how HOXB13 WT and G84E mutants differentially modulate histone deacetylation, we performed H3K27ac ChIP-seq in LNCaP cells with HOXB13 KD and/or rescue by WT or G84E. Bioinformatic analyses revealed markedly increased H3K27ac at HH sites following HOXB13 KD, which was again mitigated by WT re-expression, whereas HOXB13 G84E failed to suppress H3K27ac (Fig. 3d,e). ChIP-qPCR analysis confirmed that HDAC3 recruitment to lipogenic gene enhancers was decreased upon HOXB13 KD, which was rescued by the re-expression of WT, but not G84E, HOXB13 (Fig. 3f). Accordingly, re-expression of WT HOXB13, but not G84E, abolished HOXB13-KD-increased H3K27ac (Fig. 3g). Altogether, our results demonstrated that HOXB13, but not G84E mutant, recruits HDAC3 to lipogenic enhancers to catalyze histone deacetylation of target genes.
HDAC3 is required for HOXB13-mediated suppression of de novo lipogenesis
To examine whether HDAC3, like HOXB13, regulates lipogenic programs in PCa cells, we performed RNA-seq analyses and found that HDAC1/3 KD altered the expression of 683 genes, which overlapped with HOXB13-regulated genes and similarly enriched in lipid metabolic and fatty acid biosynthetic pathways (Fig. 4a,b and Extended Data Fig. 4a,b and Supplementary Fig. 3a). To further determine whether HDAC3 is required for HOXB13-mediated regulation of downstream genes, we compared HOXB13-regulated genes in HDAC3-expressing or -depleted LNCaP cells. We identified 162 and 172 genes that were respectively induced and repressed by HOXB13 OE in the control, HDAC3-expressing, cells (Fig. 4c). Analysis of the same gene set in HDAC3-depleted cells revealed less differential expression by HOXB13 OE, suggesting a dependency on HDAC3. On the contrary, HDAC3 KD increased and decreased a respective set of 386 and 297 genes in control cells, many of which remained sensitive to HDAC3 in HOXB13-OE cells, supporting HDAC3 as a direct regulator of gene expression. In addition, RT-qPCR and WB analyses of LNCaP and PC-3 cells revealed that depletion of either HOXB13 or HDAC3 alone was sufficient to restore lipogenic gene expression, and the depletion of both did not show additional effects, suggesting that both HOXB13 and HDAC3 are required for transcriptional repression of lipogenic genes (Fig. 4d,e and Extended Data Fig. 4c,d). This indicates the necessity of HOXB13 to recruit HDAC3 to the enhancers and of HDAC3 to catalyze histone deacetylation and lipogenic gene repression.
Fig. 4. HDAC3 is required for HOXB13-mediated suppression of de novo lipogenesis.
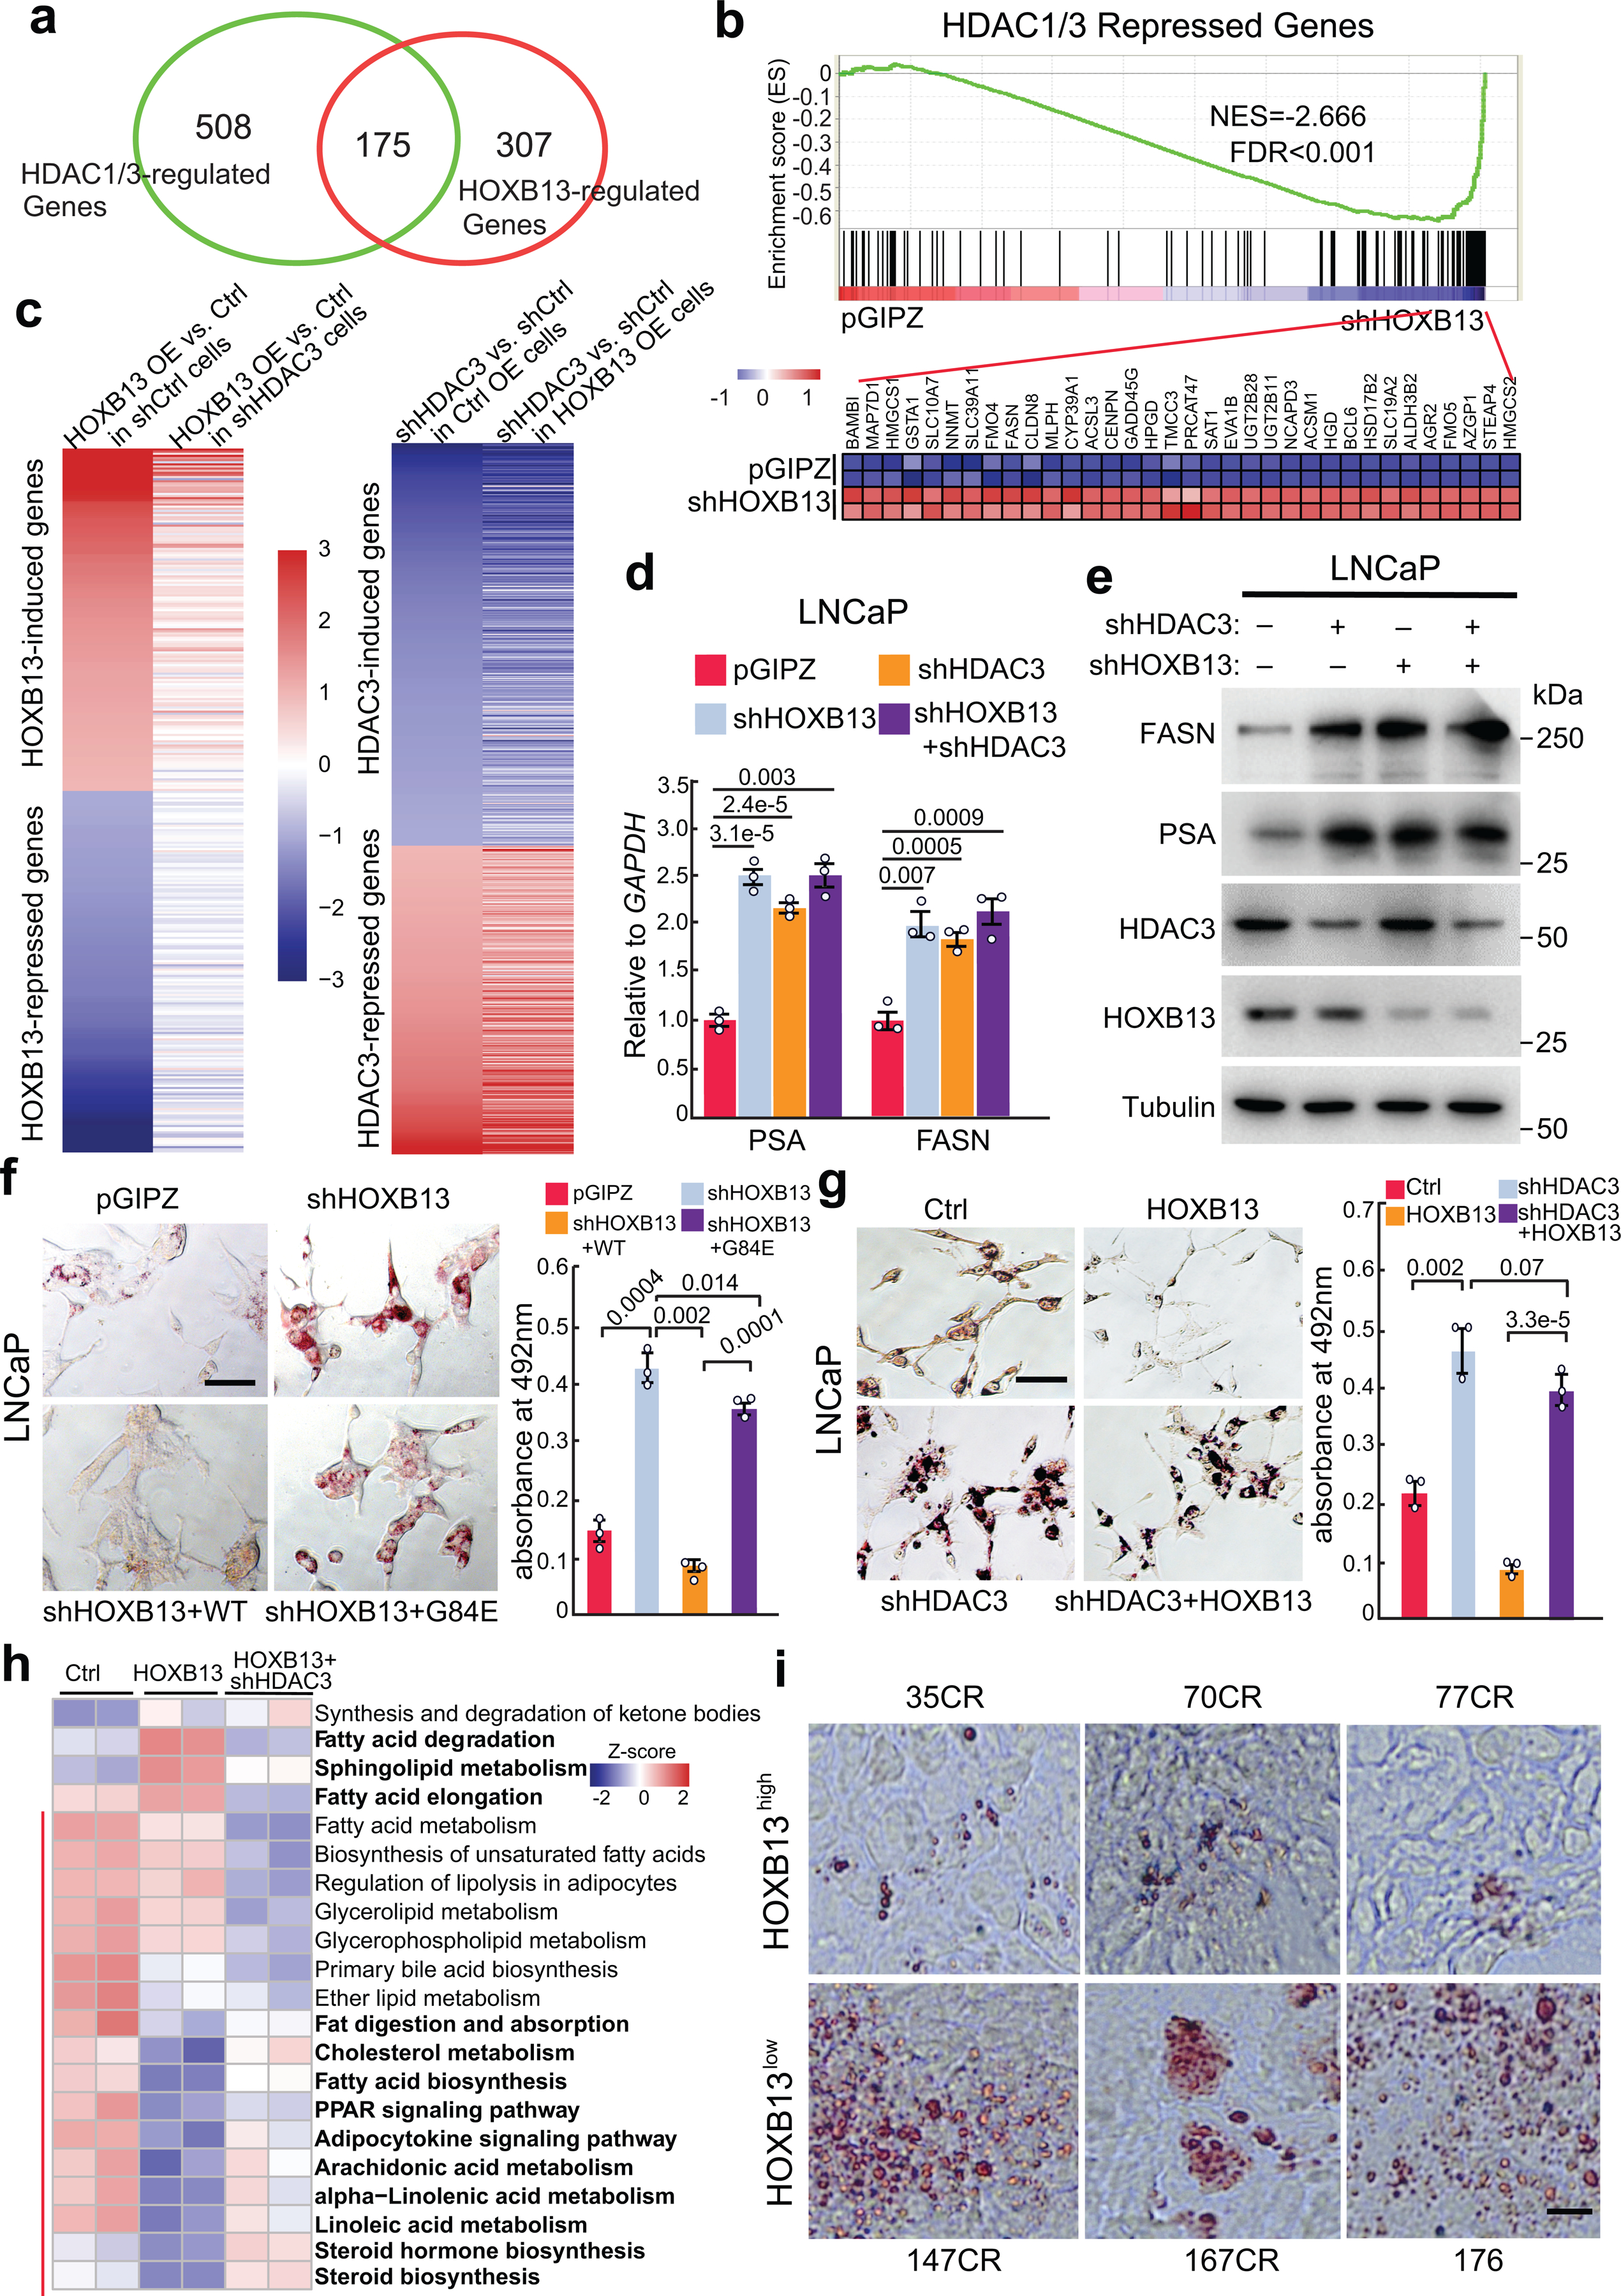
a. HOXB13- and HDAC1/3-regulated genes in LNCaP. Differentially regulated genes were identified by fold-change ≥2 and FDR <0.05.
b. GSEA showing enrichment of HDAC1/3-repressed genes in shHOXB13 LNCaP cells as compared to control pGIPZ. Shown at the bottom are heatmap of leading-edge gene expression in corresponding samples.
c. Heatmaps shown on the left indicate HOXB13 regulation of its induced (top) and repressed (bottom) genes in shCtrl or shHDAC3 LNCaP cells. Heatmap on the right show HDAC3 regulation of its induced (top) and repressed (bottom) genes in LNCaP cells with control or HOXB13 OE.
d-e. RT-qPCR and WB analysis of FASN and PSA expression in LNCaP cells with KD of HOXB13, HDAC3, or both. Data were normalized to GAPDH. Shown are the mean ±s.e.m. of technical replicates from one of three (n = 3) independent experiments. P values were calculated by unpaired two-sided t-test.
f-g. Representative images of Oil Red O staining (left) and quantification (right) of neutral lipids in LNCaP with (f) shHOXB13 and rescue by WT or G84E HOXB13 and (g) with control, HOXB13 OE and/or HDAC3 KD. Scale bar: 30 μm. Quantification data are the mean ±s.d. of technical replicates from one of two (n = 2) independent experiments. P values were calculated by unpaired two-sided t-test.
h. HOXB13 or HDAC3 regulation of KEGG lipid metabolism-related pathways. For each gene set, differentially regulated genes (FDR <0.05, fold >2) by HOXB13 were selected, and the Z-score for each gene was normalized across all 6 samples. Heatmap shows the average Z-score of each gene set (row) in each sample (column). The red bar on the left indicates lipid metabolism pathways that are repressed by HOXB13 OE. Concepts that were rescued by shHDAC3 are shown in bold (right).
i. Representative images of Oil Red O staining of neutral lipids in HOXB13low (bottom) or HOXB13high (top) LuCaP PDXs. Scale bar: 30 μm.
Being consistent with its role in inhibiting lipogenic programs, HOXB13 depletion in LNCaP cells markedly increased lipid synthesis and accumulation, which was abolished by re-expression of WT HOXB13, but not G84E mutant (Fig. 4f and Supplementary Fig. 3b,c). Similar results were also observed in CRPC cell line 22Rv1, the AR-negative PC-3 cells, and isogenic 22Rv1 with allelic HOXB13 WT or G84E expression (Extended Data Fig. 4e–h). These data indicate that HOXB13 suppresses lipid accumulation in a manner that is independent of AR, but is sensitive to G84E mutation. To determine whether this function is mediated by HDAC3, we evaluated the effects of HOXB13 OE on lipid accumulation in control and HDAC3-depleted LNCaP cells (Fig. 4g). Our results demonstrated that HOXB13 OE markedly reduced lipid accumulation in the control cells but had a very limited effect in cells that were depleted of HDAC3. Further, we examined 21 lipid metabolism-related pathways denoted in the Kyoto Encyclopedia of Genes and Genomes (KEGG) database and found that metabolic pathways associated with fatty acid biosynthesis, steroid biosynthesis, and fat digestion and absorption were repressed, while fatty acid degradation and elongation were induced by HOXB13 OE, and these pathways were restored upon concurrent HDAC3 KD (Fig. 4h). Indeed, HOXB13 strongly represses de novo lipogenesis and also slightly inhibits fatty acid uptake (Extended Data Fig. 5 a–f and Supplementary Fig. 4). Lastly, ORO staining of human CRPC PDX tumors confirmed much stronger lipid accumulation in HOXB13low than HOXB13high PCa (Fig. 4i and Extended Data Fig. 5g). Taken together, our data show that HOXB13 and HDAC3 cooperatively suppress de novo lipogenesis and reduce lipid accumulation in PCa cells.
HOXB13 is hypermethylated and down-regulated in CRPC
To evaluate the clinical relevance of HOXB13-loss-induced lipogenesis, we examined HOXB13 expression and observed a decrease of HOXB13 mRNA levels in metastatic CRPC relative to localized PCa (Fig. 5a). To confirm this at protein levels, we performed immunohistochemical (IHC) staining of HOXB13 using tissue microarray (TMA) of clinical PCa tissues (Fig. 5b,c). HOXB13 showed strong and punctuated nuclear staining, being consistent with its role as a transcription factor. More than 95% of primary PCa but only 33% of CRPC tumors showed moderate to intense HOXB13 staining. HOXB13 staining is negative in approximately 30% of CRPC tumors.
Fig. 5. HOXB13 is hypermethylated and down-regulated in CRPC.
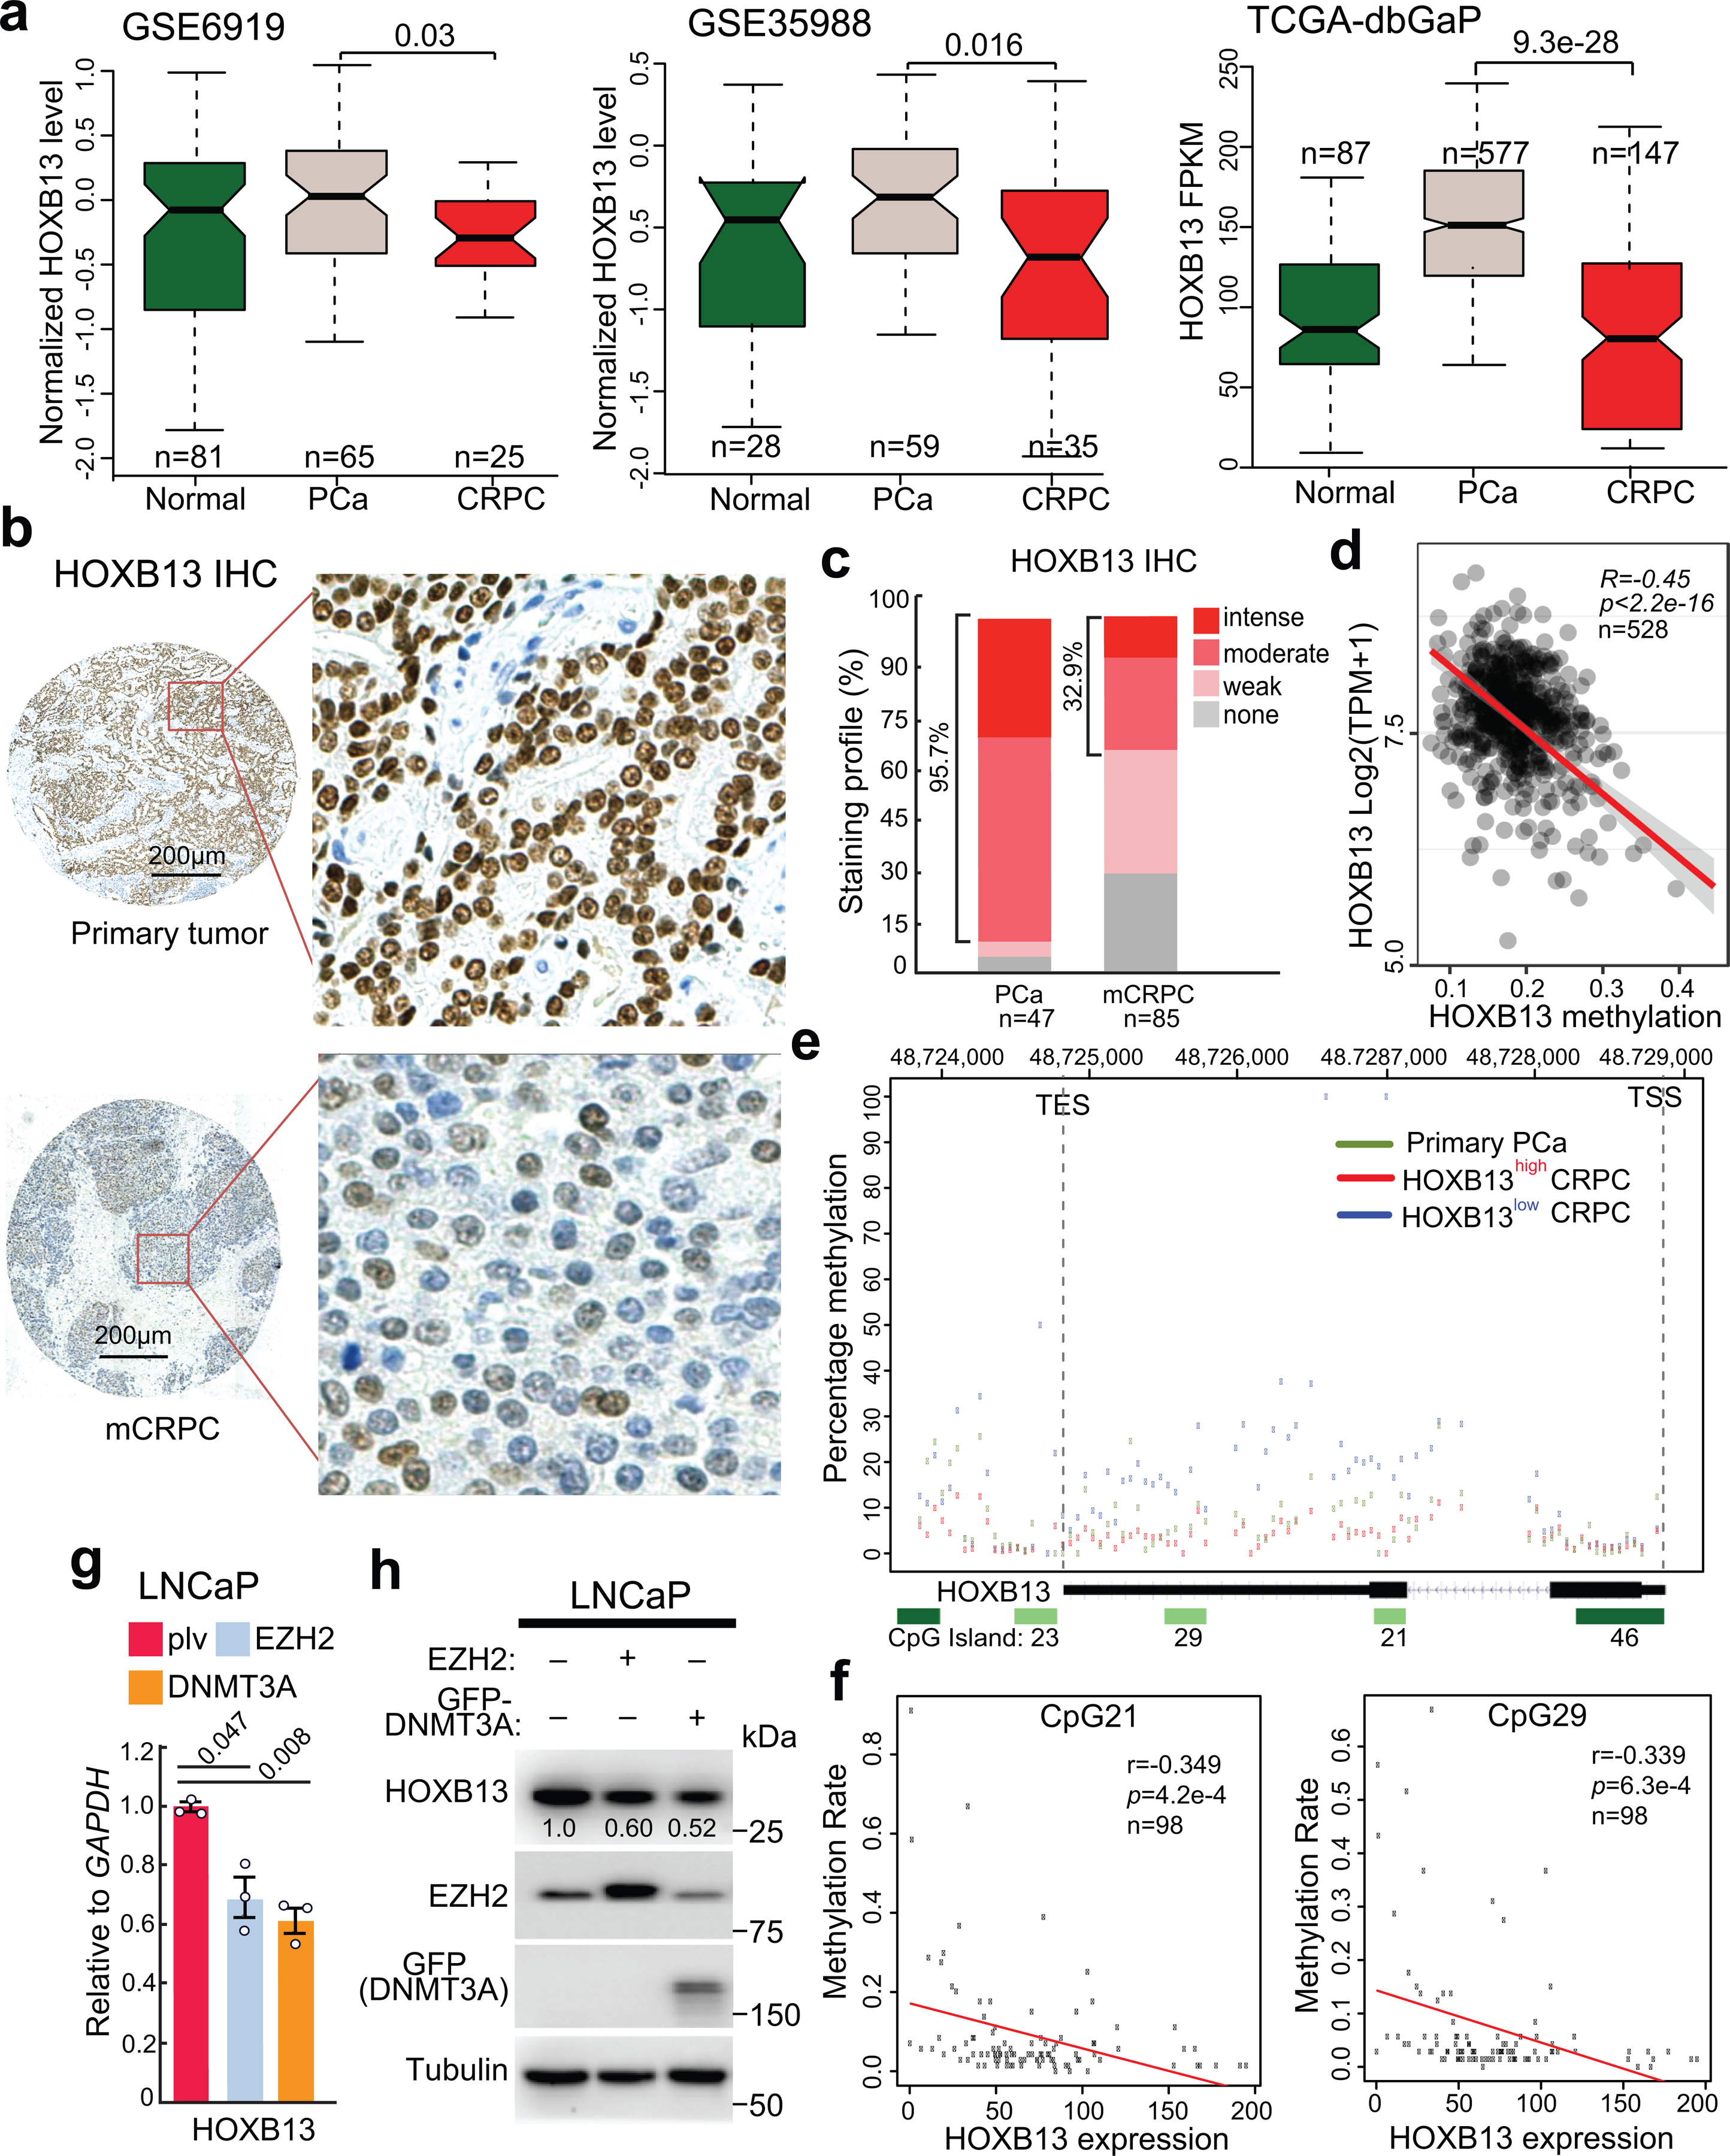
a. HOXB13 expression levels in benign prostate tissues (Normal), primary PCa, and metastatic CRPC in publically available PCa datasets. Data shown (y-axis) are Z-scores of microarray expression values for GSE6919 and GSE35988 and FPKM values for the TCGA-dbGaP dataset, which combines prostate samples from dbGaP datasets with accession#: phs000178(TCGA), phs000443, phs000915, and phs000909. P values between primary and metastatic PCa were calculated using unpaired two-sided t-tests. Boxplots represent the median and bottom and upper quartiles; Whisker edges indicate the minimum and maximum values.
b. Representative images of HOXB13 staining in primary tumors (top panels) and metastatic CRPC (bottom panels) are shown in low- (40×) and high-magnification (200×).
c. Quantification of HOXB13 IHC staining intensities in human PCa and CRPC. y-axis shows the percentage of tumors with none, weak, moderate, and intense IHC staining.
d. Correlation between HOXB13 gene methylation (x-axis) and expression at mRNA level across PCa samples available at TCGA database. The linear regression line (red) with its 95% confidence interval (gray) is shown.
e. Methylation of the HOXB13 gene (chr17:48,724,763–48,728,750. hg38) from the transcription start site (TSS) to transcription termination site (TES) in bottom 18 HOXB13low and top 18 HOXB13high out of all 98 CRPC tumors, relative to five primary PCa. y-axis shows the percentage of methylation.
f. Correlation between methylation rate (0–1) of two CpG islands (named CpG21, CpG29) within the HOXB13 gene, as depicted in Figure 5e, with HOXB13 mRNA levels (FPKM) across all 98 mCRPC samples. Two-sided P values for the T-distribution are shown.
g-h. RT-qPCR and WB analyses of LNCaP cells subjected to EZH2 or GFP-DNMT3A overexpression. Data shown are mean ±s.e.m. of technical replicates from one of three (n = 3) independent experiments and analyzed by unpaired two-sided t-test.
Genome-wide DNA methylation data available at The Cancer Genome Atlas (TCGA) revealed hypomethylation of the HOXB13 gene in prostate tissue relative to 32 other normal tissue types, being consistent with prostate-specific expression of HOXB1313,14 (Extended Data Fig. 6a). HOXB13 methylation was further decreased in primary PCa and negatively correlates with HOXB13 mRNA levels (Extended Data Fig. 6b and Fig. 5d), suggesting methylation as an important mechanism that regulates HOXB13 gene expression. Indeed, HOXB13 gene is hypermethylated in HOXB13-low or -negative PCa cell lines44, such as DU145 and RWPE-1, and PDX models including LuCaP136 and 147 lines (Extended Data Fig. 6c–f). To confirm this directly in clinical PCa specimens, we re-analyzed publicly available, paired whole-genome bisulfite sequencing (WGBS) and whole-transcriptome RNA-seq data from 98 CRPC patients and five primary PCa 45,46. We observed very little HOXB13 gene methylation in primary PCa and CRPC with high HOXB13 expression, which is substantially elevated in HOXB13-low CRPC tumors (Fig. 5e). Focused analyses of two intragenic CpG islands demonstrated negative correlations between methylation and HOXB13 gene expression across CRPC tumors (Fig. 5f). In addition, HOXB13 expression showed no association with the status of TP53, PTEN, and RB1, but is negatively correlated with DNMT3A and EZH2, which respectively promote DNA methylation and histone H3 lysine 27 trimethylation47 (Supplementary Fig. 5). Indeed, ectopic overexpression of DNMT3A and/or EZH2 inhibited HOXB13 transcription and decreased HOXB13 protein levels in LNCaP and PC-3M cells (Fig. 5g,h and Extended Data Fig. 6g,h). Further, using the dCas9-SunTag-DNMT3A system48, we found that targeted methylation at the two intragenic CpG islands drastically reduced HOXB13 expression (Extended Data Fig. 6i). Altogether, our data support that HOXB13 is down-regulated in a substantial subset of CRPC through DNA hypermethylation.
HOXB13 loss promotes cell motility and PCa metastasis
Aberrant lipogenic programs have been shown to induce metastatic PCa progression8–10. As HOXB13 is as an essential AR cofactor that regulates androgen response16, we first examined HOXB13 regulation of PCa cell growth and observed that HOXB13 KD abolished androgen-dependent LNCaP cell growth, which is independent of TP53 and RB1 but the loss of these critical tumor suppressors can rescue HOXB13-KD cell growth (Extended Data Fig. 7a and supplementary Fig. 6). Further, CRPC cell line C4–2B growth is only partially inhibited by HOXB13 KD and the AR-negative PC-3 cell growth is totally independent of HOXB13. We thus chose the latter to study the effects on cell motility and observed that HOXB13 depletion increased C4–2B and PC-3 cell invasion, which was rescued (i.e., repressed) by re-expression of WT, but not G84E, HOXB13 (Fig. 6a,b and Extended Data Fig. 7b,c).
Fig. 6. HOXB13 loss promotes cell motility and PCa metastasis.
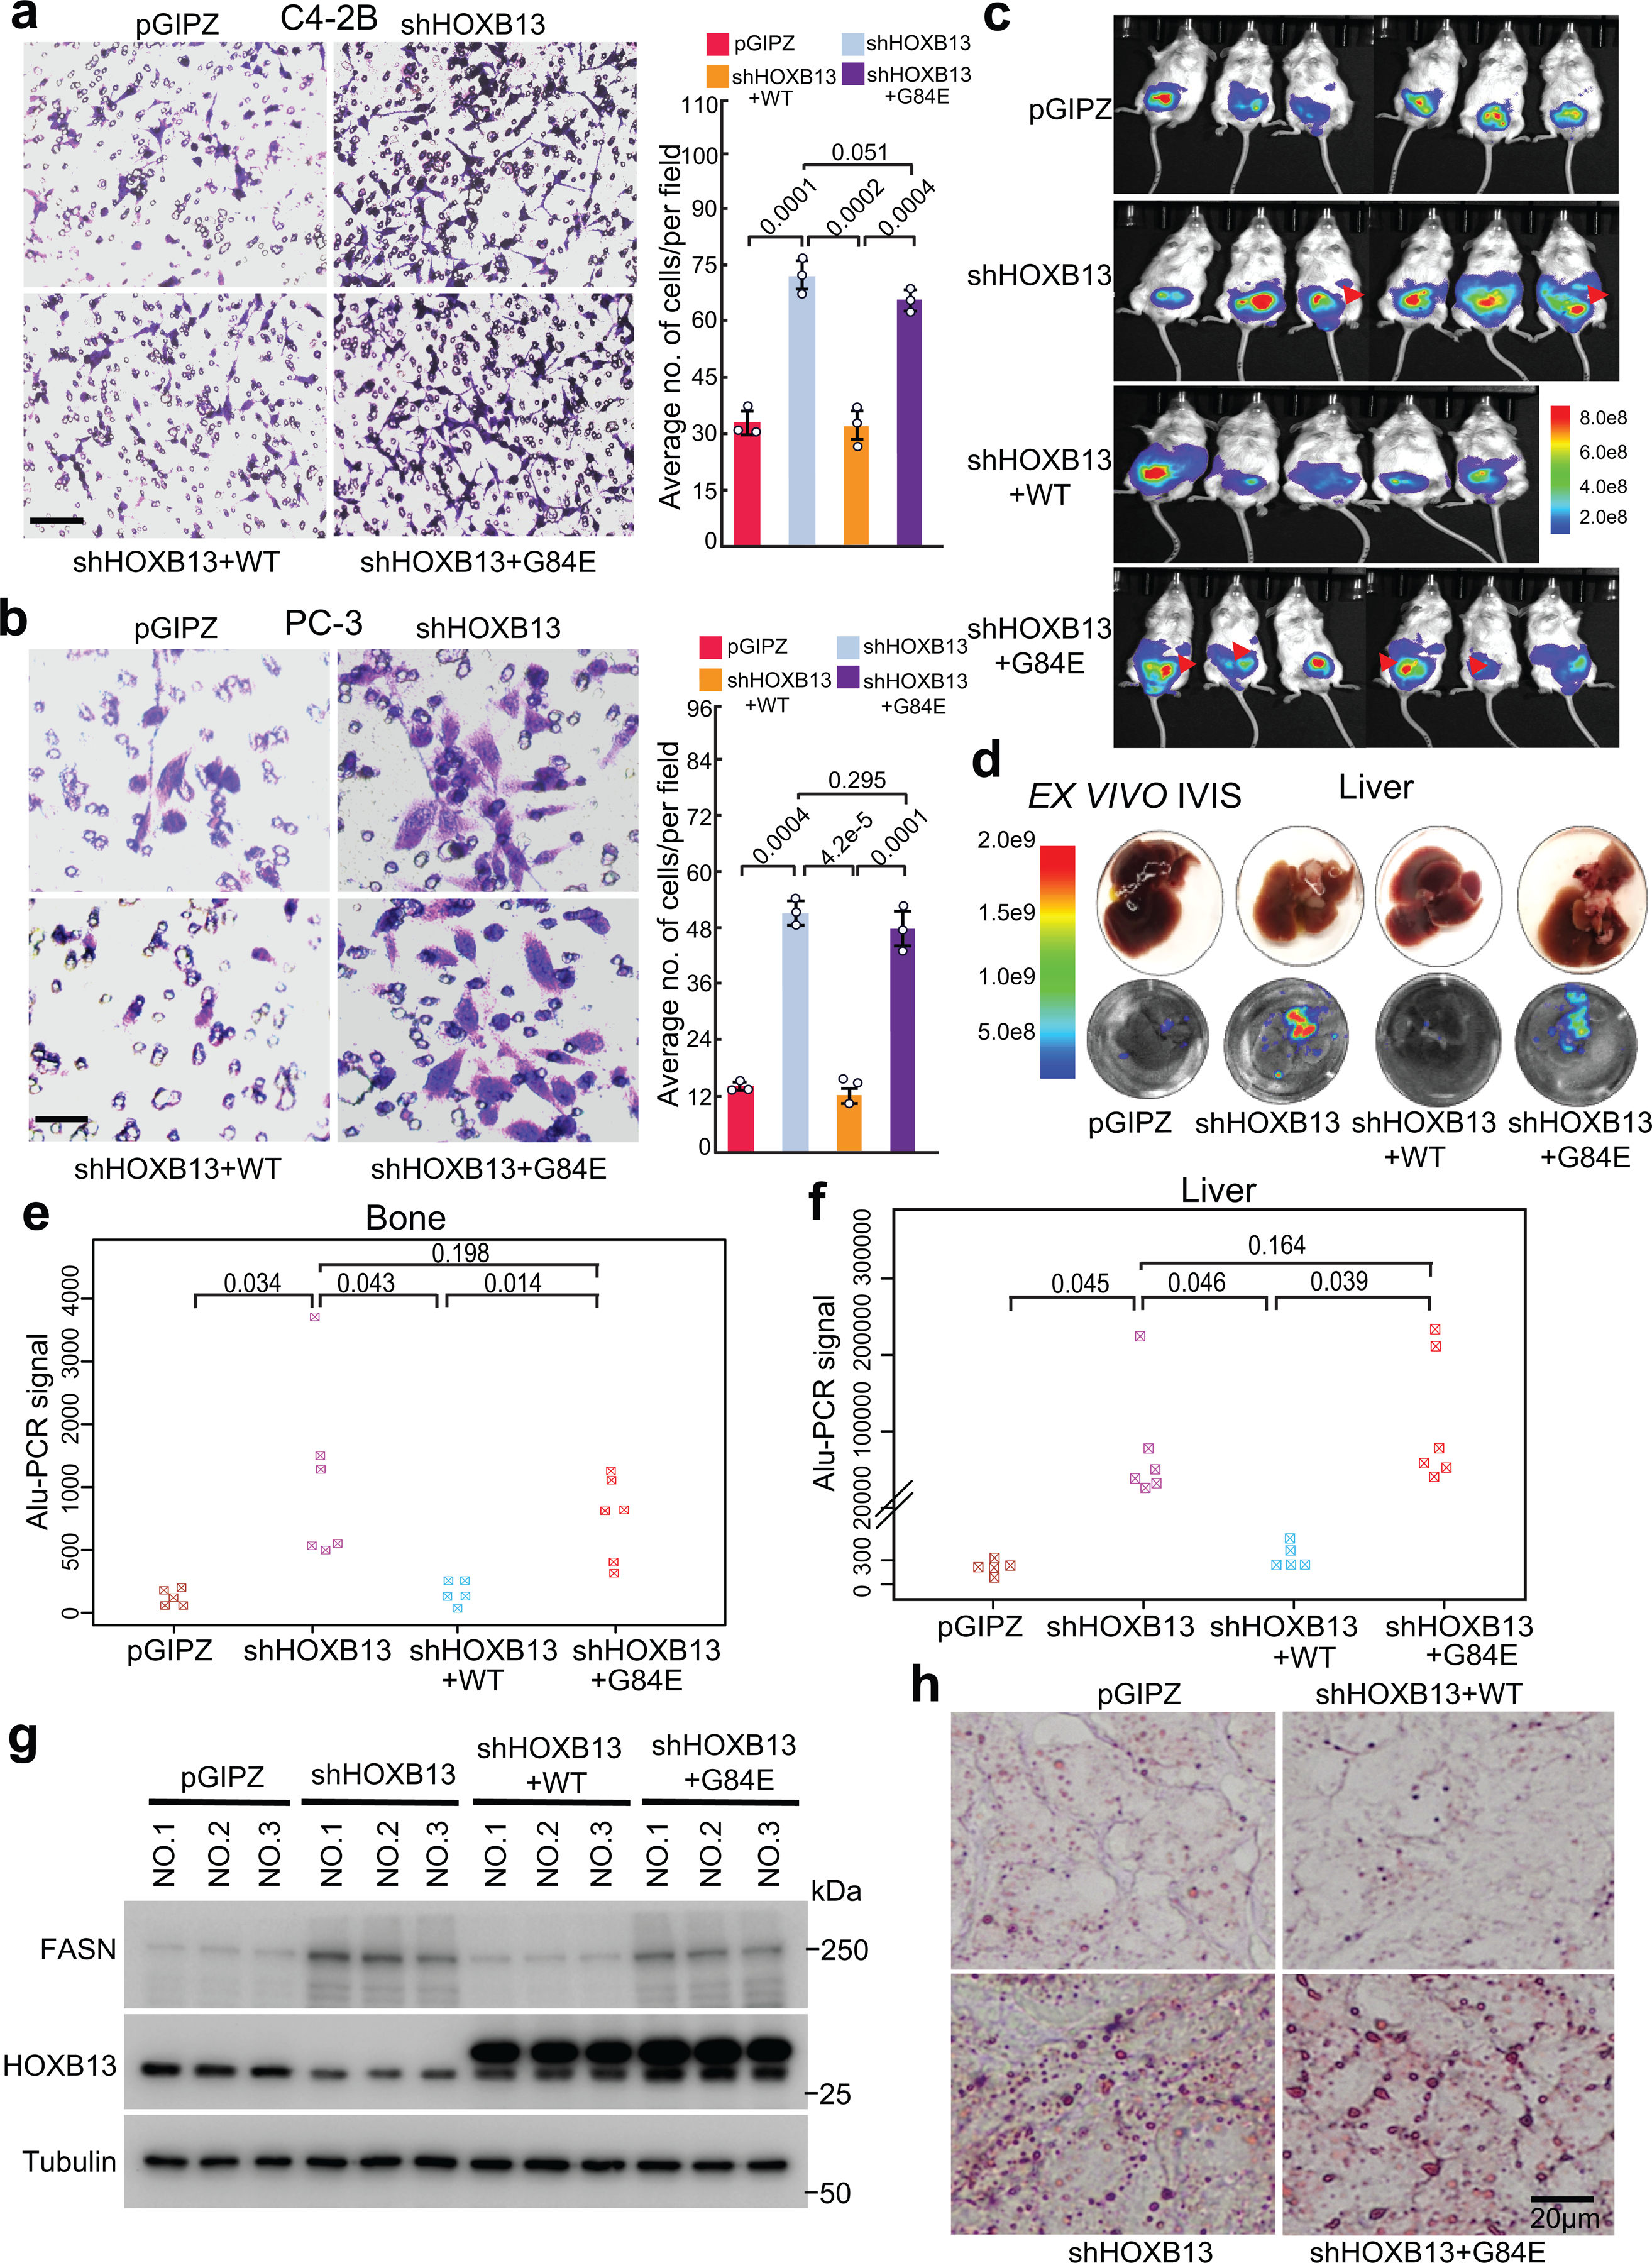
a. Cell invasion assays of C4–2B cells with shHOXB13 and/or rescue by HOXB13 WT or G84E mutant. Representative images are shown (left panels), and the number of invaded cells is quantified (right panel). Scale bar: 50 μm.
b. Cell invasion assays of PC-3 cells with shHOXB13 and/or rescue by HOXB13 WT or G84E mutant. Representative images are shown (left panels), and the number of invaded cells is quantified (right panel). Scale bar: 30 μm.
c. IVIS live mouse imaging of orthotopic PC-3M xenograft tumors at three weeks after intraprostate inoculation. Red arrows indicate local metastasis. Heatmap shows the scale of IVIS signal intensity.
d. ex vivo IVIS imaging of tumor cells metastasized to the liver. At the endpoint, mice were euthanized, livers were collected, and IVIS was performed ex vivo. Data shown are representative ex vivo IVIS images of the liver obtained from one mouse of each experiment group. The heatmap on the left indicates the intensity of the IVIS signal.
e-f. Genomic DNA was isolated from mouse bone (e) and liver (f) (n = 5 mice for pGIPZ and shHOXB13+WT, n = 6 mice for shHOXB13 and shHOXB13+G84E group) and analyzed for metastasized PC-3M xenograft tumor cells by quantifying human Alu sequence by PCR. y-axis shows the human Alu signal detected by qPCR. Unpaired one-sided t-tests were performed between indicated groups.
g. PC-3M xenograft prostate tumors from three mice per group were collected and subjected to WB analysis.
h. Oil Red O staining of lipids in representative PC-3M xenograft prostate tumors. Scale bar: 20 μm. Quantification data in a-b are the mean ±s.d. of three representative fields from one of three (n = 3) independent experiments. P values were calculated by unpaired two-sided t-test.
To examine whether the alteration in cell motility affects tumor metastasis in vivo, luciferase-labeled PC-3M cells49 with HOXB13 de-regulation were inoculated into the anterior prostates of nude SCID mice. In vivo imaging system (IVIS) detected intra-prostatic xenograft tumors in all mice after two weeks of inoculation, which showed comparable initial tumor volumes across groups (Extended Data Fig. 7d). After three weeks of inoculation, IVIS showed regional metastases in 2/6 mice inoculated with HOXB13-KD cells and 4/6 mice with HOXB13 KD and concurrent G84E re-expression, while mice in control and WT-rescued groups did not show a clear sign of metastasis (Fig. 6c). As a control, the growth rates of primary tumors in the prostate were not different across groups (Extended Data Fig. 7e). Ex vivo imaging of endpoint liver tissues for luciferase signals emanated from metastatic cells and PCR detection of human Alu sequences (Alu-qPCR) of liver and bone tissues confirmed that depletion of HOXB13 promoted PC-3M tumor metastasis, which was abolished by the re-expression of WT, but not G84E, HOXB13 (Fig. 6d–f). WB analyses of xenograft prostate tumors validated increased FASN expression in the KD and G84E-rescue groups (Fig. 6g), which also showed greatly increased lipid accumulation (Fig. 6h). Taken together, these results indicate that HOXB13 loss promotes PCa cell migration and invasion in vitro and drives xenograft tumor metastasis in vivo.
Therapeutic targeting of HOXB13-low tumors with a FASN inhibitor
We have identified FASN as a major target of HOXB13. The FASN inhibitor TVB-2640 has been tested in preclinical models50 and is currently in clinically trials. To validate FASN as a potential therapeutic target for CRPC, we examined publically available PCa expression-profiling datasets and observed continuously increased FASN expression from benign prostate to localized PCa to metastatic CRPC (Extended Data Fig. 8a). Further, IHC using TMAs detected FASN protein mainly in the cytoplasm and revealed increased FASN expression in CRPC tumors, relative to primary PCa (Fig. 7a,b). Moreover, analysis of CRPC tumors revealed much stronger FASN staining in HOXB13-low (none or weak staining) tumors and a negative correlation between FASN and HOXB13 staining across CRPC tumors (Fig. 7c). These results confirm FASN up-regulation in CRPC, especially those with low HOXB13, and support FASN as a potential clinically relevant therapeutic target. Although we have observed HOXB13 regulation of lipogenic modulators other than FASN, comparative analyses of benign and cancerous prostate cell lines showed FASN inhibitor TVB-2640 as having the best specificity in inhibiting cancer but not benign cell growth (Supplementary Fig. 7). TVB-2640 also most strongly mitigated HOXB13-loss-induced C4–2B and PC-3M cell invasion without apparent cellular toxicity, while ORO staining showed concordant elimination of lipid accumulation (Extended Data Fig. 8b–e).
Fig. 7. Therapeutic targeting of HOXB13-low tumors with a FASN inhibitor.
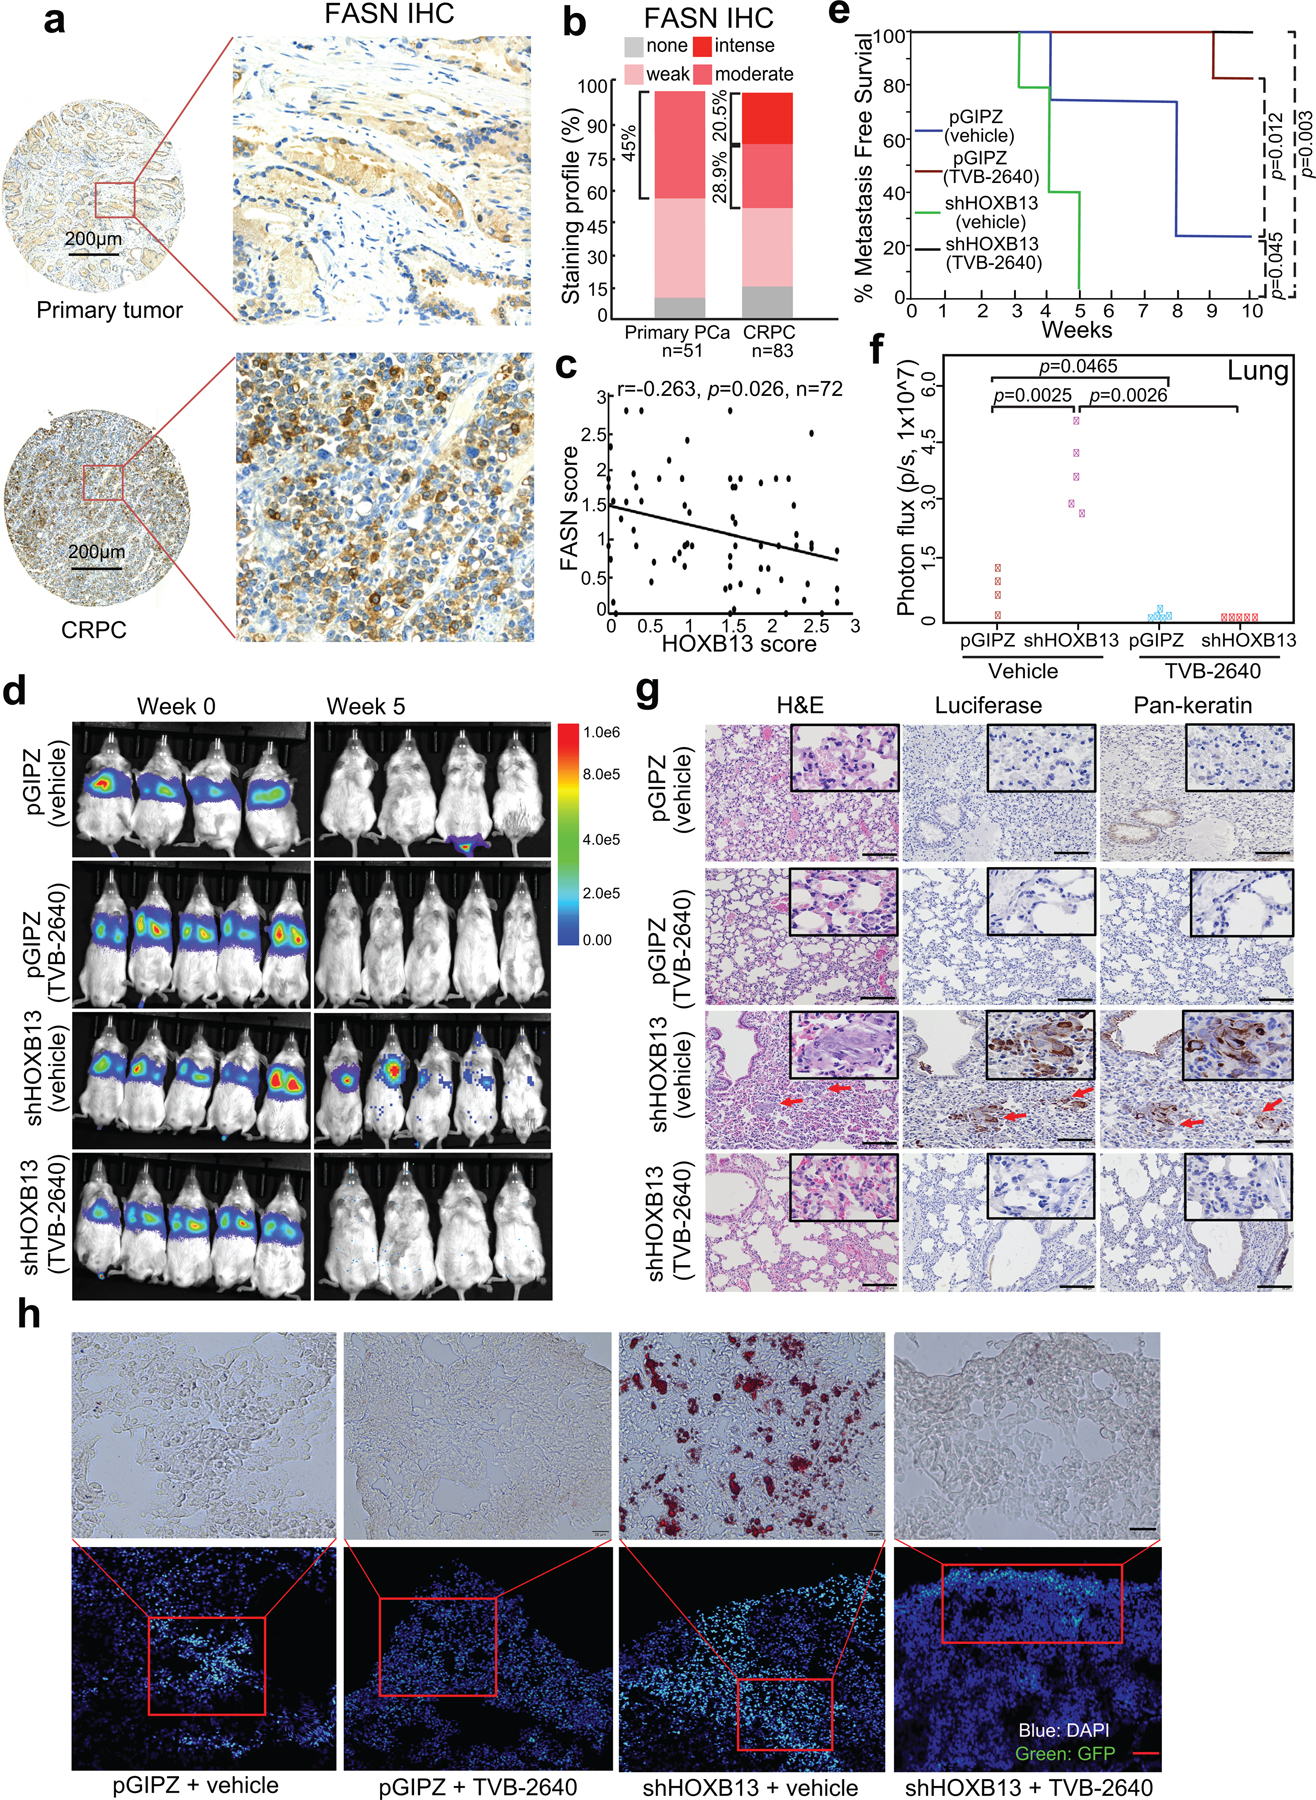
a. IHC staining of FASN in human primary PCa and CRPC. Representative images of FASN staining in primary tumors (top panels) and metastatic CRPC (bottom panels) are shown in low- (40×) and high-magnification (200×).
b. Quantification of FASN staining intensities in human PCa. y-axis shows the percentage of tumors with none, weak, moderate, and intense IHC staining.
c. Pearson correlation between FASN and HOXB13 IHC scores in 72 sites from 25 CRPC patients. A two-sided P value for the T-distribution was shown.
d. IVIS imaging of intravenous PC-3M xenograft tumors at week 0 (left) and 5 (right) after inoculation. Heatmap shows IVIS signal intensity color scale.
e. Kaplan-Meier analyses of metastasis-free survival of pGIPZ and HOXB13 KD mice (n = 4 mice for pGIPZ vehicle group, n = 5 mice for the rest groups) treated with vehicle or TVB-2640. Metastasis was defined as a whole-mouse IVIS signal higher than 1 × 10⁵ photons/s after three weeks of inoculation. P values were determined by a log-rank test.
f. ex vivo IVIS analysis and quantification of PC-3M tumor metastasis to the lung. The number of mice in each group is the same as in e. y-axis shows the normalized luciferase intensity. Indicated P values were shown by an unpaired two-sided t-test.
g. Luciferase and Pan-keratin IHC were used to identify metastasized PC-3M cells in the lungs of the mice. Representative images of H&E, Luciferase, and pan-keratin IHC staining in the indicated groups (3 mice in each group) are shown. Scale bar: 30 μm. Insets are shown at higher magnification. Red arrows indicate metastases in mouse lungs.
h. Tumors in the lung were identified by GFP (Green) by IF (bottom row), and an adjacent section was used for Oil Red O staining (top). The IF images (bottom) have a Scale bar of 30 μm, and the Oil Red O staining images (top) have a Scale bar of 20 μm.
To evaluate the efficacy of TVB-2640 in targeting HOXB13-mediated metastasis in vivo, we first utilized the PC-3M orthotopic mouse model as described in Figure 6 and found that TVB-2640 reduced the growth and metastasis of HOXB13-KD tumors (Extended Data Fig. 9). To further affirm that the ability of TVB-2640 to suppress HOXB13-KD tumor metastasis is not due to its inhibition of primary tumor growth, we next generated intravenous PCa xenograft models by inoculating luciferase-labeled PC-3M cells with control or HOXB13 KD to nude SCID mice through the tail vein (Fig. 7d, week 0). At ten days after PCa cell inoculation, mice with control or KD cells were each randomized to receive treatment with vehicle (30% PEG400) or TVB-2640 (100 mg/kg, once daily) for six weeks by oral gavage. IVIS showed apparent metastasis in HOXB13-KD mice at five weeks post-inoculation, which was fully mitigated by TVB-2640 treatment, while the control mice did not show detectable whole-mice IVIS signal (Fig. 7d, week 5). Under vehicle-treated conditions, mice with HOXB13 KD cells showed significantly (P = 0.045) reduced metastasis-free survival compared to mice inoculated with control cells. Importantly, TVB-2640 treatment significantly prolonged metastasis-free survival of both control (P = 0.012) and HOXB13-KD mice (P = 0.003) (Fig. 7e). Ex vivo IVIS imaging of dissected organs at the endpoint revealed more HOXB13-KD PCa cell metastasis to the lung, liver, hind leg, and rib than the control and the TVB-2640-treated groups (Fig. 7f and Extended Data Fig. 10). IHC staining confirmed human keratin protein expression co-localized with luciferase-positive PC-3M cells in the lungs of mice inoculated with HOXB13-KD cells, further validating metastasis (Fig. 7g). Accordingly, ORO staining showed massive lipid accumulation in metastatic tumor cells in the lungs of the KD mice, but not those of the control or TVB-2640-treated mice (Fig. 7h). In aggregate, our results demonstrated that FASN inhibition might be useful in treating HOXB13-low PCa tumor growth and metastasis by targeting de novo lipogenesis.
DISCUSSION
Previous understanding of HOXB13 function and its interaction with cofactors such as AR and MEIS1 failed to explain the association of germline G84E mutation of HOXB13 with early-onset PCa25, as G84E did not affect HOXB13 interaction with MEIS1, nor AR. Here we report an interaction between HOXB13 and HDAC3-NCoR/SMRT corepressor complex, leading to suppression of PSA and key lipogenic regulators. Critically, this interaction is disrupted by the G84E mutation on HOXB13, resulting in increased PSA expression. We speculate that this may lead to higher PSA in G84E patients compared to WT patients with comparable PCa, accounting for earlier detection by PSA screening. Consistently, previous studies have reported a lack of association of HOXB13 G84E mutation with Gleason score, tumor grade, and metastasis at diagnosis51. Although the difference was not significant, there was a better PCa-specific survival for HOXB13 G84E carriers51, which is in contrast to our findings that G84E failed to suppress lipid metabolism, consequently increasing metastasis of CRPC tumors. We argue that this may be due, at least in part, to earlier PCa diagnosis in G84E carriers, leading to earlier treatment, especially of familial PCa. Future analyses of HOXB13 G84E association with clinical outcomes should control for disease stage, PSA at diagnosis, lipid accumulation, and treatment history.
Although HOXB13 is best known as an AR cofactor, in the present study we have found that HOXB13 suppresses lipogenic genes either independently or antagonistically of AR. We found that HOXB13 interacts with HDAC3 in both AR-positive and AR-negative PCa cells. HOXB13 recruits HDAC3 to suppress lipogenic genes independently of AR. In fact, despite a decrease of AR, a critical activator of de novo lipogenesis3, in HOXB13-KD cells, there is an overall increase of lipogenic genes, supporting a dominating effect of the HOXB13/HDAC3 axis. Further, we noted that some HOXB13-repressed genes can be rescued by G84E, indicating independence of HDAC3, and these genes are enriched for androgen response and fatty acid metabolism, suggesting an antagonist role of HOXB13 on AR activities on these genes. Indeed, a previous study has shown that, although HOXB13 enhances AR signaling at some genes, it inhibits AR binding at other regulatory elements, resulting in the suppression of some AR-induced genes like FASN17. Overall, the vast majority of AR binding events in LNCaP cells is not altered by HOXB13 KD. How HOXB13 regulates AR warrants further investigation.
HOXB13 has been reported to induce androgen-dependent PCa cell growth12,16–18. Here we identify a critical role of HOXB13 in suppressing cell motility and tumor metastasis. Dissecting this role of HOXB13 requires careful control of confounding effects caused by AR-dependent cell growth. Such complex roles of HOXB13 in regulating PCa growth and metastasis should be carefully considered along with anti-androgen treatment histories when evaluating the association of HOXB13 expression with clinical outcomes of PCa patients. Consistent with this function, we found that HOXB13 is hypermethylated and down-regulated in a substantial subset of metastatic CRPC, wherein its target gene FASN is up-regulated, supporting the use of lipid pathway inhibitors. Multiple pharmaceutical inhibitors of FASN have been developed and tested in recent years, including IPI-91191, TVB-3166, and TVB-2640 that is clinically available52. We demonstrate that TVB-2640 inhibits PCa growth and also abolishes HOXB13-loss-induced lipid accumulation, cell invasion, and xenograft tumor metastasis. It will be of great interest for future studies to further examine the efficacy of TVB-2640 in additional preclinical models of PCa, either as a single agent or in combination with AR pathway inhibitors, to pave the way for clinical use of TVB-2640 for PCa patients.
METHODS
Our research complies with all relevant ethical regulations. Mouse handling and experimental procedures were approved by the Institutional Animal Care and Use Committee (IACUC) at Northwestern University in accordance with the US National Institutes of Health Guidelines for the Care and Use of Laboratory Animals and the Animal Welfare Act.
Cell lines, chemical reagents, and antibodies
Prostate cancer cell lines LNCaP, C4–2B, 22Rv1, PC-3, PC-3M, BPH-1, and human embryonic kidney cell line HEK293T cells were obtained from American Type Culture Collection (ATCC) and cultured in either RPMI1640 or Dulbecco’s modified Eagle’s medium (DMEM) with 10% fetal bovine serum (FBS), 1% penicillin and streptomycin. RWPE-1 cells were maintained in Keratinocyte Serum-Free Medium (K-SFM) with 0.05 mg/ml BPE and 5 ng/ml EGF. Cell lines were either newly acquired from ATCC or authenticated within 6 months of growth and cells under culture are frequently tested for potential mycoplasma contamination. Oil Red O (O0625) was purchased from Sigma, TVB-2640 (Catalog No. T15271) was from TargetMol. Fatostatin (hydrobromide, 298197-04-3), TOFA (54857-86-2), Simvastatin (79902-63-9) were purchased from Cayman Chemical. All antibodies used in this study are listed in Supplementary Table 1.
Constructs and Lentivirus
HOXB13, HDAC1, HDAC3, EZH2, and NCOR1 constructs were first cloned into pCR8 Gateway compatible entry vector and then transferred into pLenti-SFB, pLVX, or pLenti6.3/V5 gateway compatible destination vector by LR clonase (Invitrogen). HOXB13 N-terminal and HDAC3 N- and C-terminal truncations were generated by subcloning into the modified pLV-EF1a-IRES-Puro vector (Biosettia). HOXB13 G84E, ΔMEIS, ΔHOX, WFQ-3A and NCOR1 ΔN1/2, ΔN1/2/3, ΔDAD, and ΔDAD/Δ1500–1950aa mutants were generated by Q5® Site-Directed Mutagenesis Kit (NEB, E0554S) with HOXB13 WT or NCOR1 WT as a template. HOXB13, RB1 and TP53 gRNAs were cloned into lentiCRISPR v2 (Addgene, #52961). The gRNAs targeting the 4 CpG islands within the HOXB13 locus were cloned into pLKO5.sgRNA.EFS.tRFP657 and an sgRNA (sgGAL4, Addgene, #100549) that had no cognate target in the human genome was used as a negative control. The shRNAs targeting HDAC1 and HDAC3 were cloned into pLKO.1-TRC lentiviral vector (Addgene, #10878). The primers and oligonucleotides used in this study are listed in Supplementary Table 2, and all the plasmids were verified by sequencing. The dCas9-SunTag (#122151), scFv-sfGFP-DNMT3A1 (#102278), pLKO5.sgRNA.EFS.tRFP657 (#57824) were purchased from Addgene. The pGIPZ lentiviral shRNA targeting of HOXB13 (Clone ID: V3LHS_403019) and control vector were purchased from Open Biosystems. The siRNA#1 targeting AR was from Dharmacon (L-003400-00-0020), and siAR#2 was from Thermo (S1538, GCCCAUUGACUAUUACUUUtt). For the generation of lentivirus, HEK293T cells were transfected with psPAX2 and pMD2G with target gene at ratio 2:1:1. Lentiviruses were harvested at 48 h after transfection and filtered through a 0.45 μm filter. Lentiviruses, supplemented with 8 μg/ml polybrene, were used to infect PCa cells. Infected cells were selected with 2 μg/ml puromycin at 48 h after infection.
Co-IP and chromatin fractionation assay
Co-IP experiments were performed using the standard protocol. Briefly, whole-cell lysates were extracted from transfected 293T cells or infected LNCaP cells or PC-3 cells by IP lysis buffer (50 mM Tris-Cl pH 7.4, 150 mM NaCl, 1 mM EDTA, 1% Triton X-100, Roche protease inhibitor cocktail). An aliquot of the cell lysate was kept as input for western blot analysis. Cell lysates were incubated with the corresponding tag antibody at 4 °C overnight. For endogenous HOXB13 Co-IP in PC-3 and LNCaP cells, the extracted lysates were first pre-cleared with protein G-magnetic beads at 4 °C for 2 h followed by incubation with HOXB13 antibody (2 μg/sample, Santa Cruz, sc-28333) overnight. Dynabeads Protein G (Life Technologies) were added the next day and incubated for 1 h at 4 °C. The beads/protein complex was washed four times with IP lysis buffer and eluted with 30 μl 2× SDS sample buffer, and subjected to western blot analysis using the corresponding antibody.
For chromatin fractionation assay, chromatin was isolated as previously reported with modifications53. Briefly, cells were resuspended in buffer A (10 mM HEPES, pH 7.9, 10 mM KCl, 1.5 mM MgCl2, 0.34 M sucrose, 10% glycerol, 1 mM DTT, 1× Roche protease inhibitor cocktail) and incubated on ice for 10 min. Then, the final concentration of 0.1% Triton X-100 was added to the cell suspension and vortexed for 15 s and spun down at 4 °C for 5 min at 1,000×g. The supernatant was kept as a cytoplasmic fraction. Nuclei pellet was washed once with buffer A, and then resuspended in buffer B (3 mM EDTA, 75 mM NaCl, 0.1% TritonX-100, 1 mM DTT, protease cocktail) for 30 min on ice. Nuclei were spun down for 5 min at 1,000×g at 4 °C, and supernatant was saved as the nuclear fraction. Insoluble chromatin was resuspended in 1× SDS sample buffer.
Mass spectrometry analysis
Mass spectrometry analyses were performed as described previously54. LNCaP cells stably expressing HOXB13 WT-SFB or G84E-SFB were lysed in NETN (100 mM NaCl, 20 mM Tris-Cl, pH 8.0, 1 mM EDTA, and 0.5% (vol/vol) NP-40) buffer containing protease inhibitors for 20 min at 4 °C. Crude lysates were subjected to centrifugation at 21,100×g for 30 min. Supernatants were then incubated with streptavidin-conjugated beads (GE Healthcare) for 4 h at 4 °C. The beads were washed three times with NETN buffer, and bounded proteins were eluted with NETN buffer containing 2 mg/ml biotin (Sigma-Aldrich) for 1 h twice at 4 °C. The eluates were incubated with S-protein beads (EMD Millipore) overnight at 4 °C. The beads were eluted with SDS sample buffer and subjected to SDS-PAGE. Protein bands were excised and subjected to mass spectrometry analysis using Orbitrap Velos Pro™ system. The SEQUEST is used for protein identification and peptide sequencing.
RNA extraction, RT-qPCR, and RNA-Seq
RNA was extracted using the nucleospin RNA kit (Takara) according to the manufacturer’s recommended protocol. 500 ng RNA was reverse transcribed into cDNA using the ReverTra Ace® qPCR RT Master Mix kit (Diagnocine) according to the manufacturer’s recommended protocol. qPCR was performed with 2× Bullseye EvaGreen qPCR MasterMix (MIDSCI) and StepOne Plus (Applied Biosystems). All primers used here are listed in Supplementary Table 2. For RNA-seq, total RNA was isolated as described above. RNA-seq libraries were prepared from 0.5 μg high-quality DNA-free RNA using NEBNext® Ultra RNA Library Prep Kit, according to the manufacturer’s instructions. The libraries passing quality control (equal size distribution between 250–400 bp, no adapter contamination peaks, no degradation peaks) were quantified using the Library Quantification Kit from Illumina (Kapa Biosystems, KK4603). Libraries were pooled to a final concentration of 10 nM and sequenced single-end using the Illumina HiSeq 4000.
ChIP, ChIP-seq, and ATAC-seq
ChIP and ChIP-seq were performed using the previously described protocol with the following modifications53. LNCaP cells with control, HOXB13 KD, HOXB13 KD with WT or G84E rescue were crosslinked with 1% formaldehyde for 10 min at room temperature with gentle rotation and then quenched for 5 min with 0.125 M glycine. 5 million cells were used for each HOXB13 ChIP, 20–25 million cells were used for each HDAC1 or HDAC3 ChIP, 2 million cells were used for each H3K27ac ChIP. Chromatin was sonicated to an average length of 200–600 bp using an E220 focused-ultrasonicator (Covaris). Supernatants containing chromatin fragments were pre-cleared with protein A agarose beads (Millipore) for 40 min and incubated with a specific antibody overnight at 4 °C on a nutator (antibody information were listed in Supplementary Table 1), then added 50 μl of protein A agarose beads and incubated for 2 h. Beads were washed twice with 1× dialysis buffer (2 mM EDTA, 50 mM Tris-Cl, pH 8.0) and four times with IP wash buffer (100 mM Tris-Cl, pH 9.0, 500 mM LiCl, 1% NP40, 1% Deoxycholate). The antibody/protein/DNA complexes were eluted with elution buffer (50 mM NaHCO3, 1% SDS), reversed the crosslinks, and DNA was purified with DNA Clean & Concentrator™–5 kit (ZYMO Research). For ChIP-qPCR, ChIP-enriched DNA was diluted at 1:10 in water, and 4 μl diluted DNA was used as the template for each qPCR reaction. ChIP-qPCR primers are listed in Supplementary Table 2. ChIP-seq libraries were prepared from 3–5 ng ChIPed DNA using NEBNext® Ultra™ II DNA Library Prep Kit (NEB, E7645S), according to the manufacturer’s instructions. Post-amplification libraries were size selected between 250–450 bp using Agencourt AMPure XP beads from Beckman Coulter and were quantified using the Library Quantification Kit from Illumina (Kapa Biosystems, KK4603). Libraries were pooled to a final concentration of 10 nM and sequenced single-end using the Illumina HiSeq 4000.
ChIP for HOXB13, HDAC3 and H3K27ac in LuCaP PDXs was performed as previously described38. Briefly, 50 mg of frozen tissue was cut into small pieces and homogenized using the BeadBug™ benchtop homogenizer. The tissues were crosslinked in 2 steps with 2 mM of DSG (Pierce) for 10 minutes at room temperature, followed by 1% Formaldehyde for 10 minutes. Crosslinked cells were then quenched with 0.125 M glycine for 5 minutes at room temperature. Chromatin shearing, immunoprecipitation, and library preparation were performed as in PCa cell line described above.
Transposase-Accessible Chromatin using sequencing (ATAC-seq) was performed as previously reported55. 50,000 cells were collected, washed once by 1× PBS, and tagmented in 1× TD buffer with 2.5 μl Tn5 (Illumina), 0.01% Digitonin (Promega, G9441), 0.3× PBS. The reactions were incubated at 37 °C for 30 min in a thermomixer with 300 rpm mixing. The tagmented DNA was purified using the DNA Clean & Concentrator™–5 kit (ZYMO Research). Libraries were amplified and adaptor dimer, primer dimer were cleaned up. Paired-end reads (50 bp) were sequenced using an Illumina HiSeq 4000.
Cell invasion and colony formation assay
Cell invasions assays were carried out as previously reported49. In brief, the cell suspension containing 300,000 (C4–2B) or 100,000 (PC-3) cells/ml in serum-free RPMI medium was prepared, 100 μl of cell suspension was transferred into the upper chamber. The lower chamber contained 500 μl of complete growth medium with 40% FBS. After incubation for 72 h, non-invading cells and matrigel were gently removed using a cotton-tipped swab. The inserts were fixed and stained for 15 min in 25% methanol containing 0.5% Crystal Violet. The images of invaded cells were captured under a bright-field microscope, and the number of invaded cells per field view was counted using the cell counter plugins in Image J. For colony formation assay, LNCaP and C-2B (5 × 10³), PC-3 or PC-3M (2 × 10³), RWPE-1 (2 × 10³) cells per well were seeded in 12-well plate. The cells were fixed by 4% paraformaldehyde after 2 weeks’ growth and stained with 0.05% crystal violet. The colonies were imaged with ChemiDoc (BIO-RAD).
Lipidomic analysis and oil red O staining of neutral lipids
Untargeted lipidomic analysis by Q-TOF LC/MS was done at Mass Spectrometry Core of the University of Illinois at Chicago. Lipid molecules were identified and quantified with LipidSearch 4.1.9 software. The lipidomic analysis was performed as previously described 3. Briefly, 10 million LNCaP cells were harvested and washed three times with 1 ml 1× PBS to remove any traces of culture medium. Nonpolar lipids were extracted using the Folch method. The organic phase containing the nonpolar lipids was dried in a SpeedVac rotary evaporator with no heat. Lipid samples were reconstituted in 35 μl of 50% isopropanol (IPA)/50% methanol. 10 μl of samples were subjected to Q-TOF LC/MS analysis. Oil Red O staining of prostate cancer cells, frozen LuCaP PDXs, frozen prostate xenograft tumor, and quantification of staining was performed using Lipid (Oil Red O) Staining Kit (Biovision, catalog # K580-24). For lipid staining of metastasis tumor in the lung, tumors were identified by GFP, and adjacent sections were used for Oil Red O staining. Image J was used for the quantification of staining.
Fatty acid uptake and LipidSpot staining assay
Fatty acid uptake of prostate cancer cells was performed using a fatty acid uptake assay kit (Biovision, Catalog #:K408). Briefly, LNCaP or PC-3M cells with control or HOXB13 KD were seeded at a density of 30,000 to 40,000 cells per well in a 96-well plate in 100 μl of lipid-free (lipoprotein depleted fetal bovine serum, Kalen biomedical, Cat#880100-1), phenol red-free RPMI 1640 medium one day before assay. Kinetics of fatty acid uptake was measured by fluorescence at 485 nm excitation and 528 nm emission for 75 min after the addition of uptake reaction mix. Imaging the extent of fluorescent fatty acid analog uptake after 12 h used Nikon A1 Confocal. To evaluate de novo lipid synthesis of control or HOXB13-KD LNCaP or PC-3M cells under lipid-free condition, total lipid content was measured by LipidSpot™ 610 Lipid Droplet Stain kit (Biotium,70069-T) after cells cultured in lipid-free or regular medium for 2 days. LipidSpot signal intensity in LipidSpot staining assay and fluorescent fatty acid signal intensity in fatty acid uptake assay of each cell was quantified by Image J.
Murine orthotopic and intravenous xenograft studies
Mice were housed in specific pathogen-free animal facilities (at 20–23 °C, with 40–60% humidity and 12 h light/12 h dark cycle). LuCaP PDXs were derived from resected metastatic prostate cancer with the informed consent of patient donors as described previously43 under a protocol approved by the University of Washington Human Subjects Division IRB. NOD SCID male mice at 6–7 weeks old were purchased from Charles River Laboratories. Orthotopic implantations were performed as previously described49. Briefly, a suspension of luciferase labeled PC-3M with control, HOXB13 KD, HOXB13 KD with WT or G84E re-expression stable cells (5 × 10⁵ cells in 30 μl of PBS) was injected into the anterior prostate. To monitor tumor growth and metastasis in vivo, D-Luciferin (100 μl of 15 mg/ml stock; Goldbio) was injected intraperitoneally into mice, and bioluminescence was measured using Lago Bioluminescence/Fluorescence Imaging System at Northwestern core facility. For ex vivo IVIS assay, at the endpoint (scientific endpoint, death, or maximal tumor burden of 2,000 mm3 reached), mice were euthanized 10 min after injected D-Luciferin. Liver, lung, and bone were collected and imaged immediately. Alu-PCR analysis of tumor metastasis was performed as previously reported56. Briefly, qPCR was performed in 20 μl reaction (100 ng genomic DNA, 1× TaqMan™ Universal PCR Master Mix (Fisher, 4364338), 1 μM human Alu forward/reverse primer, and 0.3 μM human Alu TaqMan probe). The PCR reaction was carried out at the following conditions: 50 °C for 2 minutes, 95 °C for 10 minutes, and then 40 cycles at 95 °C for 15 s, 60 °C for 60 s.
For the intravenous xenograft model, a suspension of luciferase labeled PC-3M with control, HOXB13 KD stable cells (2 × 10⁶ cells in 200 μl of 1xPBS) were injected into mice through the tail vein. Ten days after inoculation, mice were randomly divided into two groups and treated with vehicle (30% PEG400) or FASN inhibitor TVB-2640 (100 mg/kg) once daily for 6 weeks by oral gavage. Tumor metastasis was measured as described above by Lago Bioluminescence System. At the endpoint, the liver, lung, hind leg, and rib of the mouse were collected and ex vivo IVIS assay was performed as described above.
Tissue acquisition and tissue microarray analysis
Two sets of primary PCa (n = 51 patients, n = 51 sites) TMAs were used in this study. TMA (PCF 401334) was generated by the Northwestern University Pathology Core and approved by the Northwestern University Institutional Review Board. TMA (CHTN_PrC_Prog1) was obtained through Cooperative Human Tissue Network (CHTN) at the University of Virginia. Tissue microarrays containing metastatic CRPC specimens were obtained as part of the University of Washington Medical Center Prostate Cancer Donor Program, which is approved by the University of Washington Institutional Review Board. All specimens for IHC were formalin-fixed (decalcified in formic acid for bone specimens), paraffin-embedded, and examined histologically for the presence of a nonnecrotic tumor. TMAs were constructed with 1-mm diameter duplicate cores (n = 176) from CRPC patient tissues (n = 25 patients) consisting of visceral metastases and bone metastases (n = 88 sites) from patients within 8 hours of death.
Human TMA IHC staining was conducted using the Dako Autostainer Link 48 with an enzyme-labeled biotin-streptavidin system and the SIGMAFAST DAB Map Kit (MilliporeSigma). Antibodies used in IHC include anti-HOXB13 (1:400, 90944, Cell Signaling Technology) and anti-FASN (1:400, A301–323A, Bethyl). Images were captured with TissueFax Plus from TissueGnostics, exported to TissueFAX viewer, and analyzed using Photoshop CS4 (Adobe). HOXB13 and FASN immunostaining was scored blindly by a pathologist using a score of 0 to 3 for intensities of negative, weak, moderate, or intense multiplied by the percentage of stained cancer cells. IHC staining in mouse lung and liver was performed as in human PCa tissue as described above, Pan-keratin (1:100, Cell Signaling Technology, #4545) and Luciferase (1:1,000, Novus, NB100-1677) were used to identify metastasized human cancer cells (PC-3M).
Statistical Analysis
For each independent in vitro experiment, at least three technical replicates were used. Most in vitro experiments were repeated independently three times, and some were repeated twice. Two-tailed unpaired Student’s t-tests were used to assess statistical significances in quantitative RT-PCR experiments and cell-based functional assays. One-way ANOVA was used to determine statistically significant differences across treatment groups in the xenograft studies. P value less than 0.05 was considered statistically significant. Kaplan-Meier analyses of metastasis-free survival and overall survival of mice were performed using the log-rank test.
RNA-seq and ChIP-seq data analysis
RNA-seq reads were mapped to NCBI human genome GRCh38 using STAR version 1.5.2. Raw counts of genes were calculated by STAR. FPKM values (Fragments Per Kilobase of transcript per Million mapped reads) were calculated by in-house Perl script. Differential gene expression was analyzed by the R Bioconductor DESeq2 package, which uses shrinkage estimation for dispersions and fold-changes to improve the stability and interpretability of estimates. ChIP-seq reads were aligned to the Human Reference Genome (assembly hg19) using Bowtie2 2.0.5. ChIP-seq peak identification, overlapping, subtraction, and feature annotation of enriched regions were performed using the HOMER (Hypergeometric Optimization of Motif EnRichment) suite. Weighted Venn diagrams were created by the R package Vennerable. Heatmap views of ChIP-seq were generated by deepTools. Raw data were uploaded to GEO as GSE153586. For the analysis of lipid metabolism-related pathways regulated by HOXB13, we extracted genes of 21 lipid metabolism-related pathways denoted in the Kyoto Encyclopedia of Genes and Genomes (KEGG) database. We computed a metabolic pathway score for each of the 21 lipid metabolism pathways based on the average Z-scores of expression of all genes within each pathway in LNCaP cells with control, HOXB13 OE, or OE with concomitant shHDAC3.
Analysis of HOXB13 gene methylation in clinical PCa samples
HOXB13 methylation in the TCGA methylation dataset was analyzed using the SMART App57. Alignment of methylation data relative to HOXB13 gene structure and nearby CpG islands was performed using the Wanderer tool58. Methylation status at HOXB13 locus and RNA levels of HOXB13 in CRPC were derived from publicly available dataset that includes paired whole-genome bisulfite sequencing (WGBS) and whole-transcriptome RNA-seq data from 98 CRPC patients45. WGBS for five primary prostate tumors were obtained from the authors of ref46. DNA methylation data of prostate cancer and normal prostate epithelial cell lines were downloaded from a previous study44. HOXB13 gene methylation in CRPC tumors of LuCaP PDX models was determined by MeDIP-seq. Briefly, genomic DNA from the LuCaP PDXs was sheared using a Covaris Sonicator E220, and size selection was performed with AMPure XP beads (Beckman Coulter) to retain 150–250 bp DNA fragments. MeDIP-seq was done following previously published methods59
Data availability
All sequencing data (RNA-seq and ChIP-seq) generated for the study have been deposited in GEO (GSE153586). https://www.ncbi.nlm.nih.gov/geo/query/acc.cgi?acc=GSE153586
The mass spectrometry proteomic data have been deposited to the ProteomeXchange Consortium via the PRIDE60 partner repository with the dataset identifier PXD030810.
Code availability
The code for NGS analyses performed in this manuscript was uploaded to https://github.com/JYULAB/HOXB13_project
Extended Data
Extended Data Fig. 1. HOXB13 WT, but not G84E mutant, inhibits lipogenic programs in PCa.
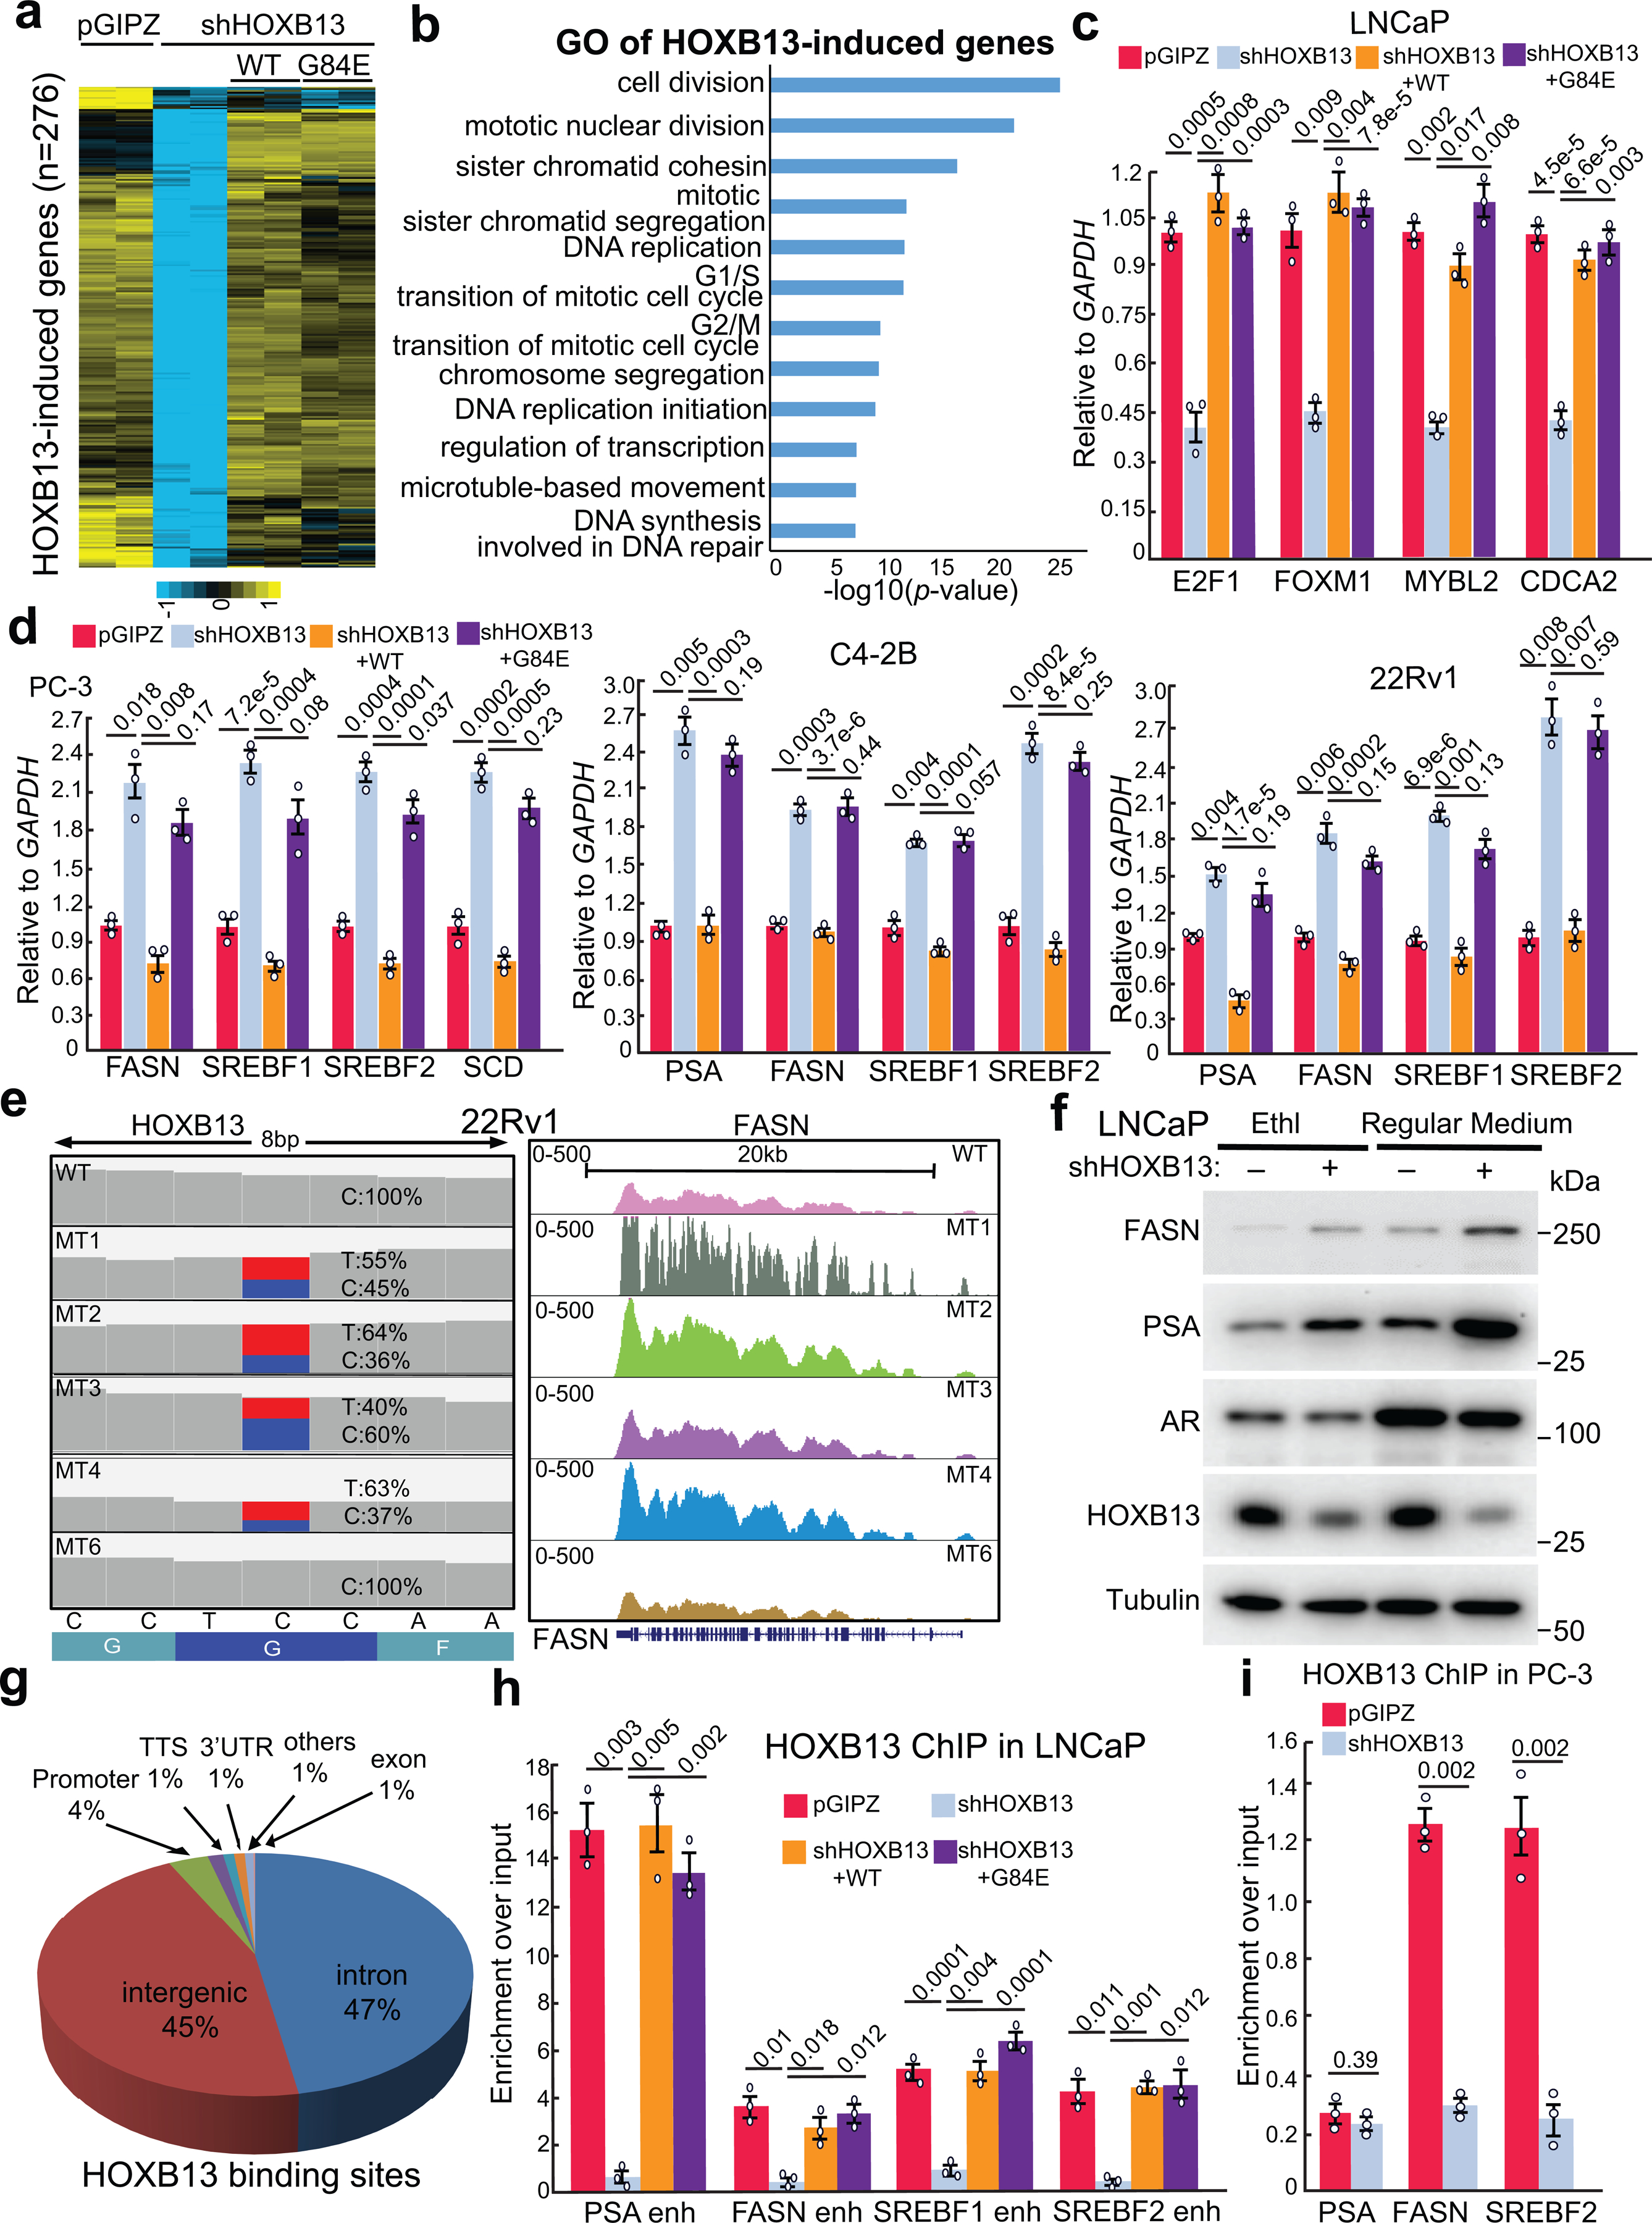
a. Heatmap showing HOXB13-induced gene expression in PCa cells with HOXB13 KD and/or rescue. HOXB13-induced (n=276) genes were derived by comparing shHOXB13 with pGIPZ using FDR<0.05 and fold change>=2.5.
b. GO analysis of HOXB13-induced genes identified in a. GO analyses was performed by DAVID, top enriched molecular concepts are shown. The X-axis indicates enrichment significance. One-sided Fisher’s Exact test was performed and −log10 (p-value) are shown.
c. QRT-PCR validation of cell cycle gene regulation by HOXB13 in LNCaP cells.
d. RT-qPCR validation of PSA and other key lipogenic gene regulation by HOXB13 in PC-3, C4–2B, and 22Rv1 cells.
e. IGV view of the percentage of HOXB13 WT (C) and G84E alleles (T) (left) and genome browser view of mRNA expression of FASN (right, chr17:80,036,214–80,056,106, hg19, hg19) in WT and five isogenic G84E clones of 22Rv1. The isogenic G84E cells of HOXB13 were generated by CRISPR editing.
f. WB validating the expression of FASN, PSA, AR, and HOXB13 in control and HOXB13-KD LNCaP cells. LNCaP cells were infected with control shRNA (pGIPZ) or shRNA targeting HOXB13 (shHOXB13) for four days, followed by hormone starvation (Ethl) or regular medium (10% FBS) for three days.
g. Pie chart showing the genomic distribution of HOXB13 binding sites in LNCaP cells.
h-i. ChIP-qPCR analyses of HOXB13 at lipogenic gene enhancers in LNCaP (h) cells with HOXB13 KD and/or rescue and PC-3 (i) cells with HOXB13 KD.
Data in c,d and h,i were shown as technical replicates from one of three (n=3) independent experiments. Data shown are mean ±s.e.m, P values by unpaired two-sided t-test.
Extended Data Fig. 2. HOXB13 interacts with HDAC3 protein through its MEIS domain.
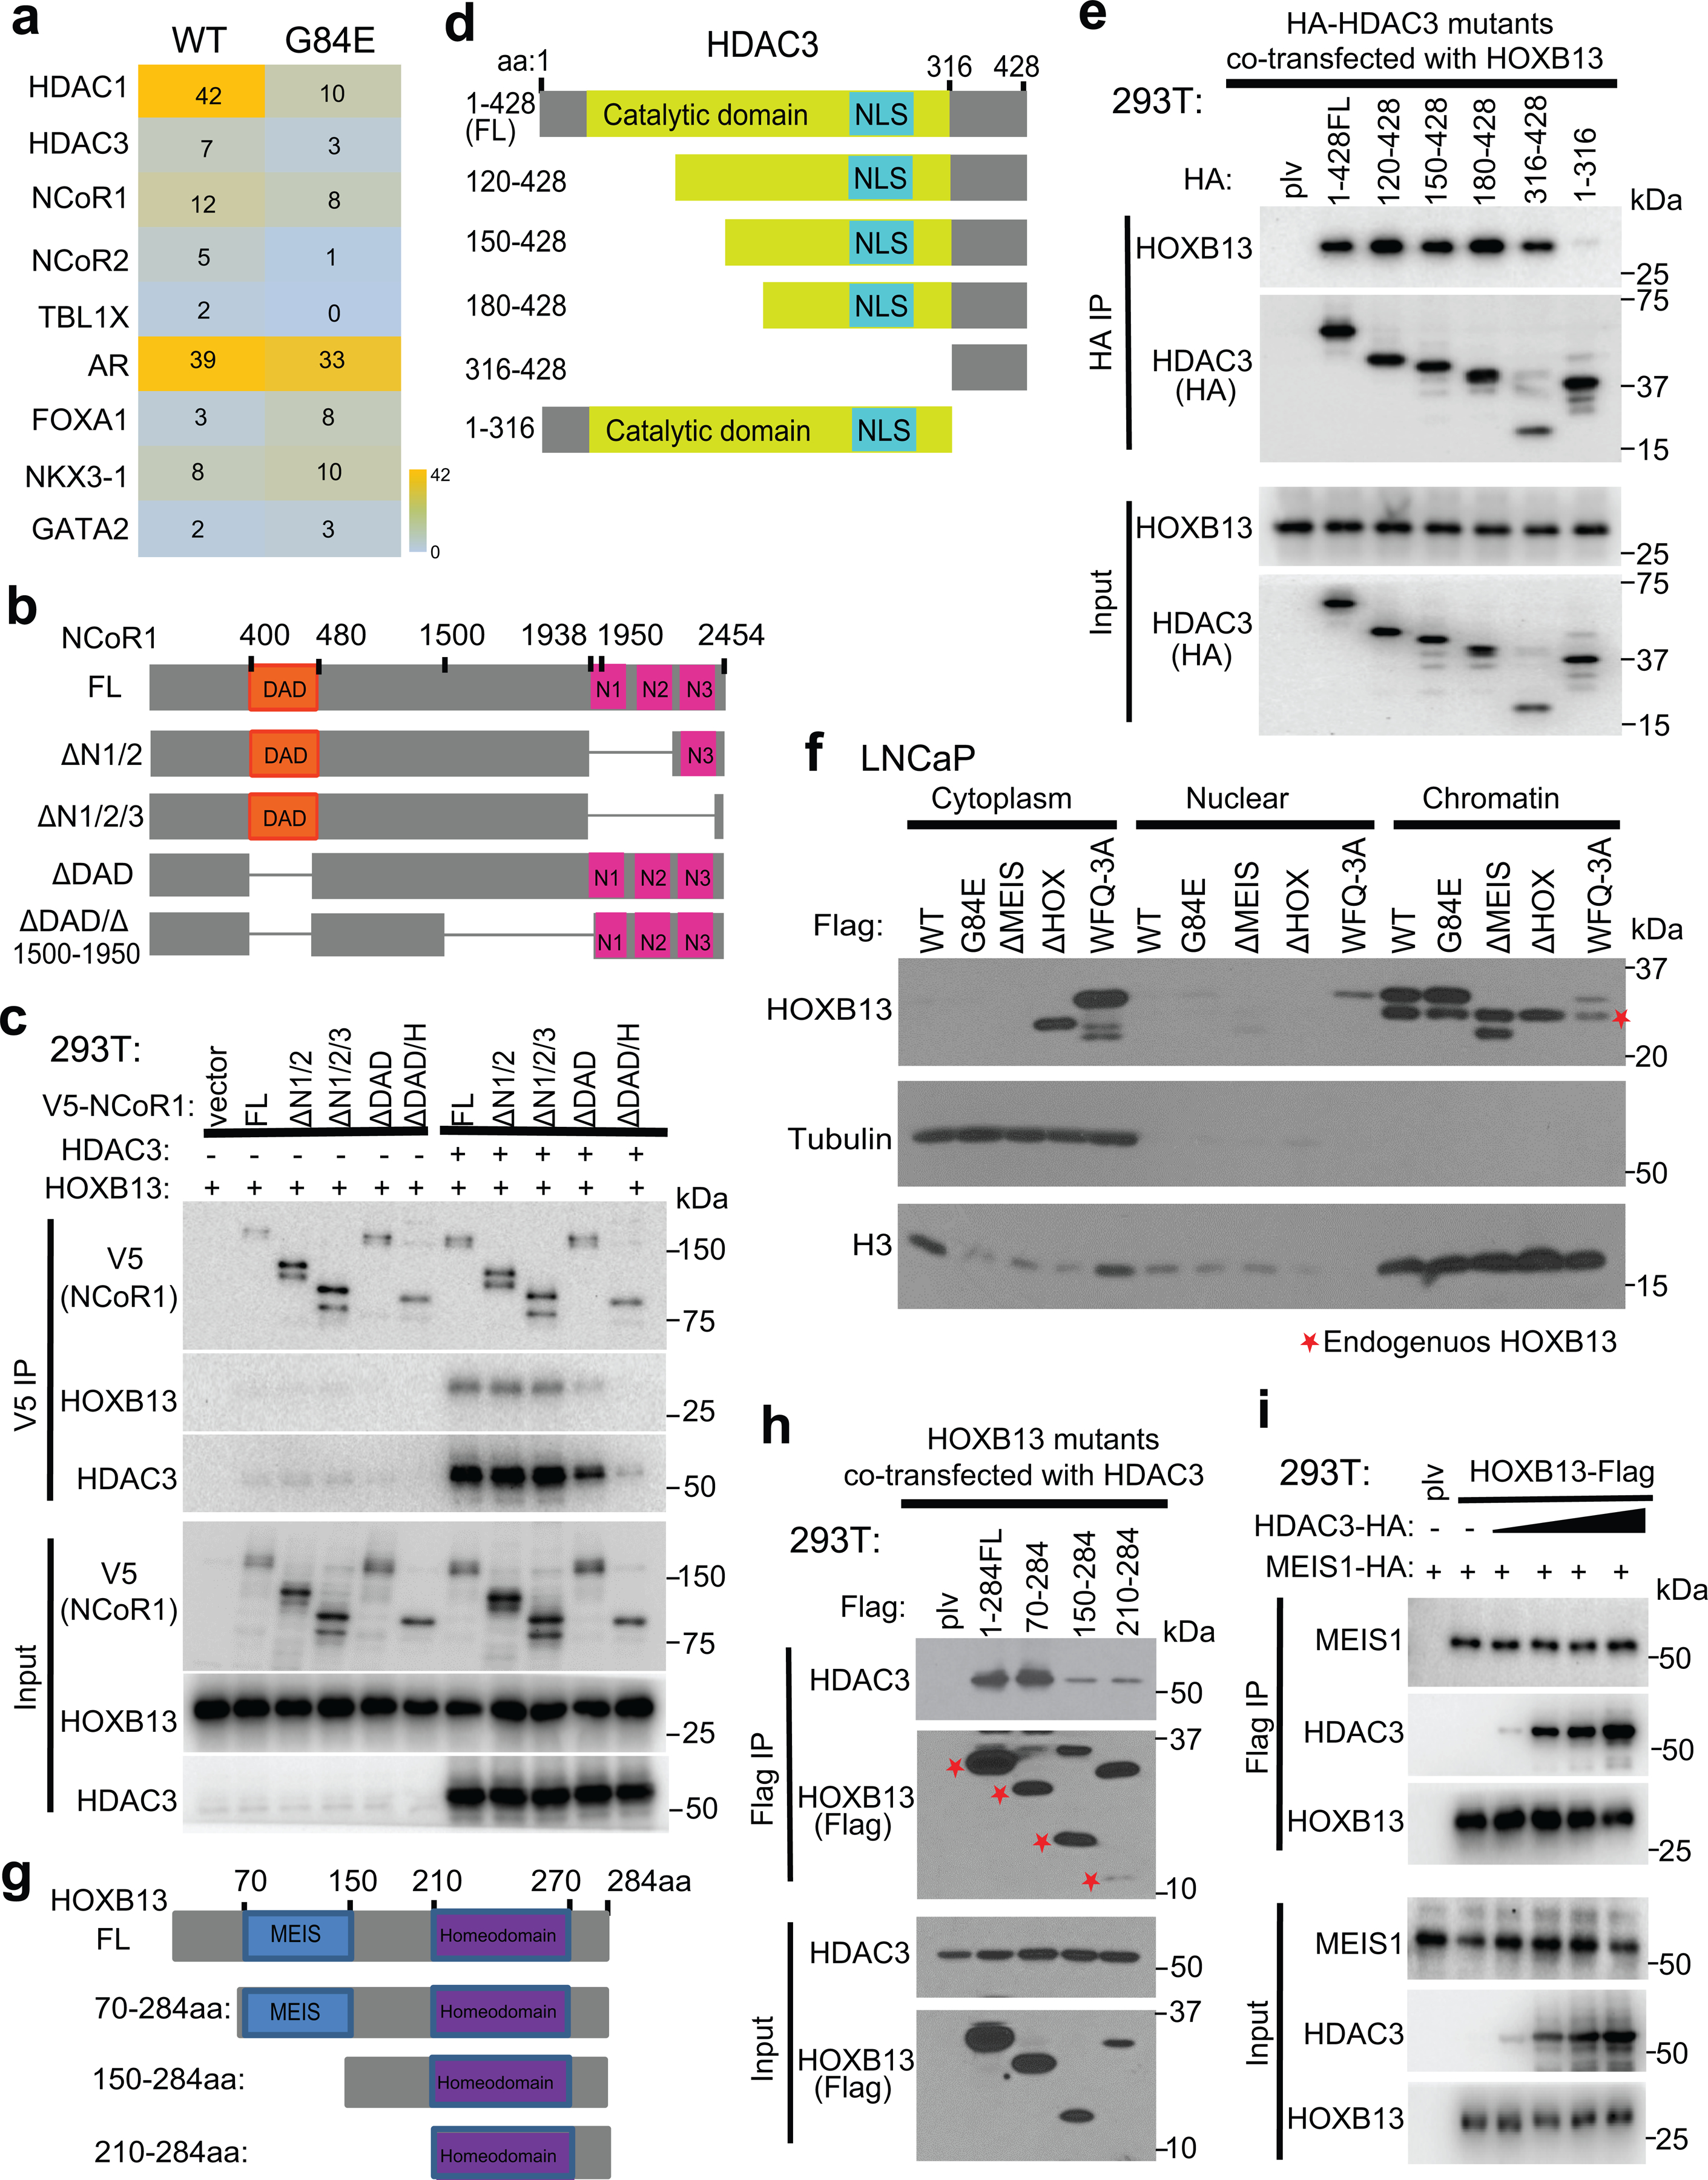
a. Heatmap showing the number of peptides of AR-cofactors and HDAC3/NCoR complex enriched by HOXB13 WT or G84E mutant mass spectrometry. The complete lists are included in Supplemental Table 6.
b-c. Co-IP of V5-NcoR1 full-length (FL) or deletion mutants (b) expressed in 293T cells along with HOXB13, with or without HDAC3 co-expression (c). Co-IP using whole-cell lysates showed no interactions between HOXB13 and NCoR1 in cells without HDAC3 co-expression.
d-e. Co-IP of HA-HDAC3 FL or deletion mutants (d) expressed in 293T cells along with HOXB13 (e). Whole-cell lysates were subjected to co-IP using an anti-HA antibody.
f. Fractionation assay showing cellular localization of HOXB13 WT and mutants in LNCaP cells. WT, G84E and ΔMEIS HOXB13 were detected on the chromatin, whereas ΔHOX and WFQ-3A have impaired ability to bind chromatin. Asterisk indicates endogenous HOXB13.
g-h. Schematic illustration of a series of HOXB13 deletion mutants (g) and their interaction with HDAC3 (h). Whole-cell lysates from 293T cells co-transfected with HA-HDAC3 along with Flag-tagged HOXB13 FL or its deletion mutants were subjected to co-IP using an anti-Flag antibody. Asterisk indicates the size of corresponding mutants.
i. The interaction between HOXB13 and MEIS1 is not interrupted by HDAC3. Whole-cell lysates from 293T cells co-transfected with Flag-HOXB13 along with HA-tagged MEIS1 and gradually increased amount of HA-tagged HDAC3 were subjected to co-IP using an anti-Flag antibody.
Extended Data Fig. 3. HOXB13 recruits HDAC3 to catalyze histone deacetylation.
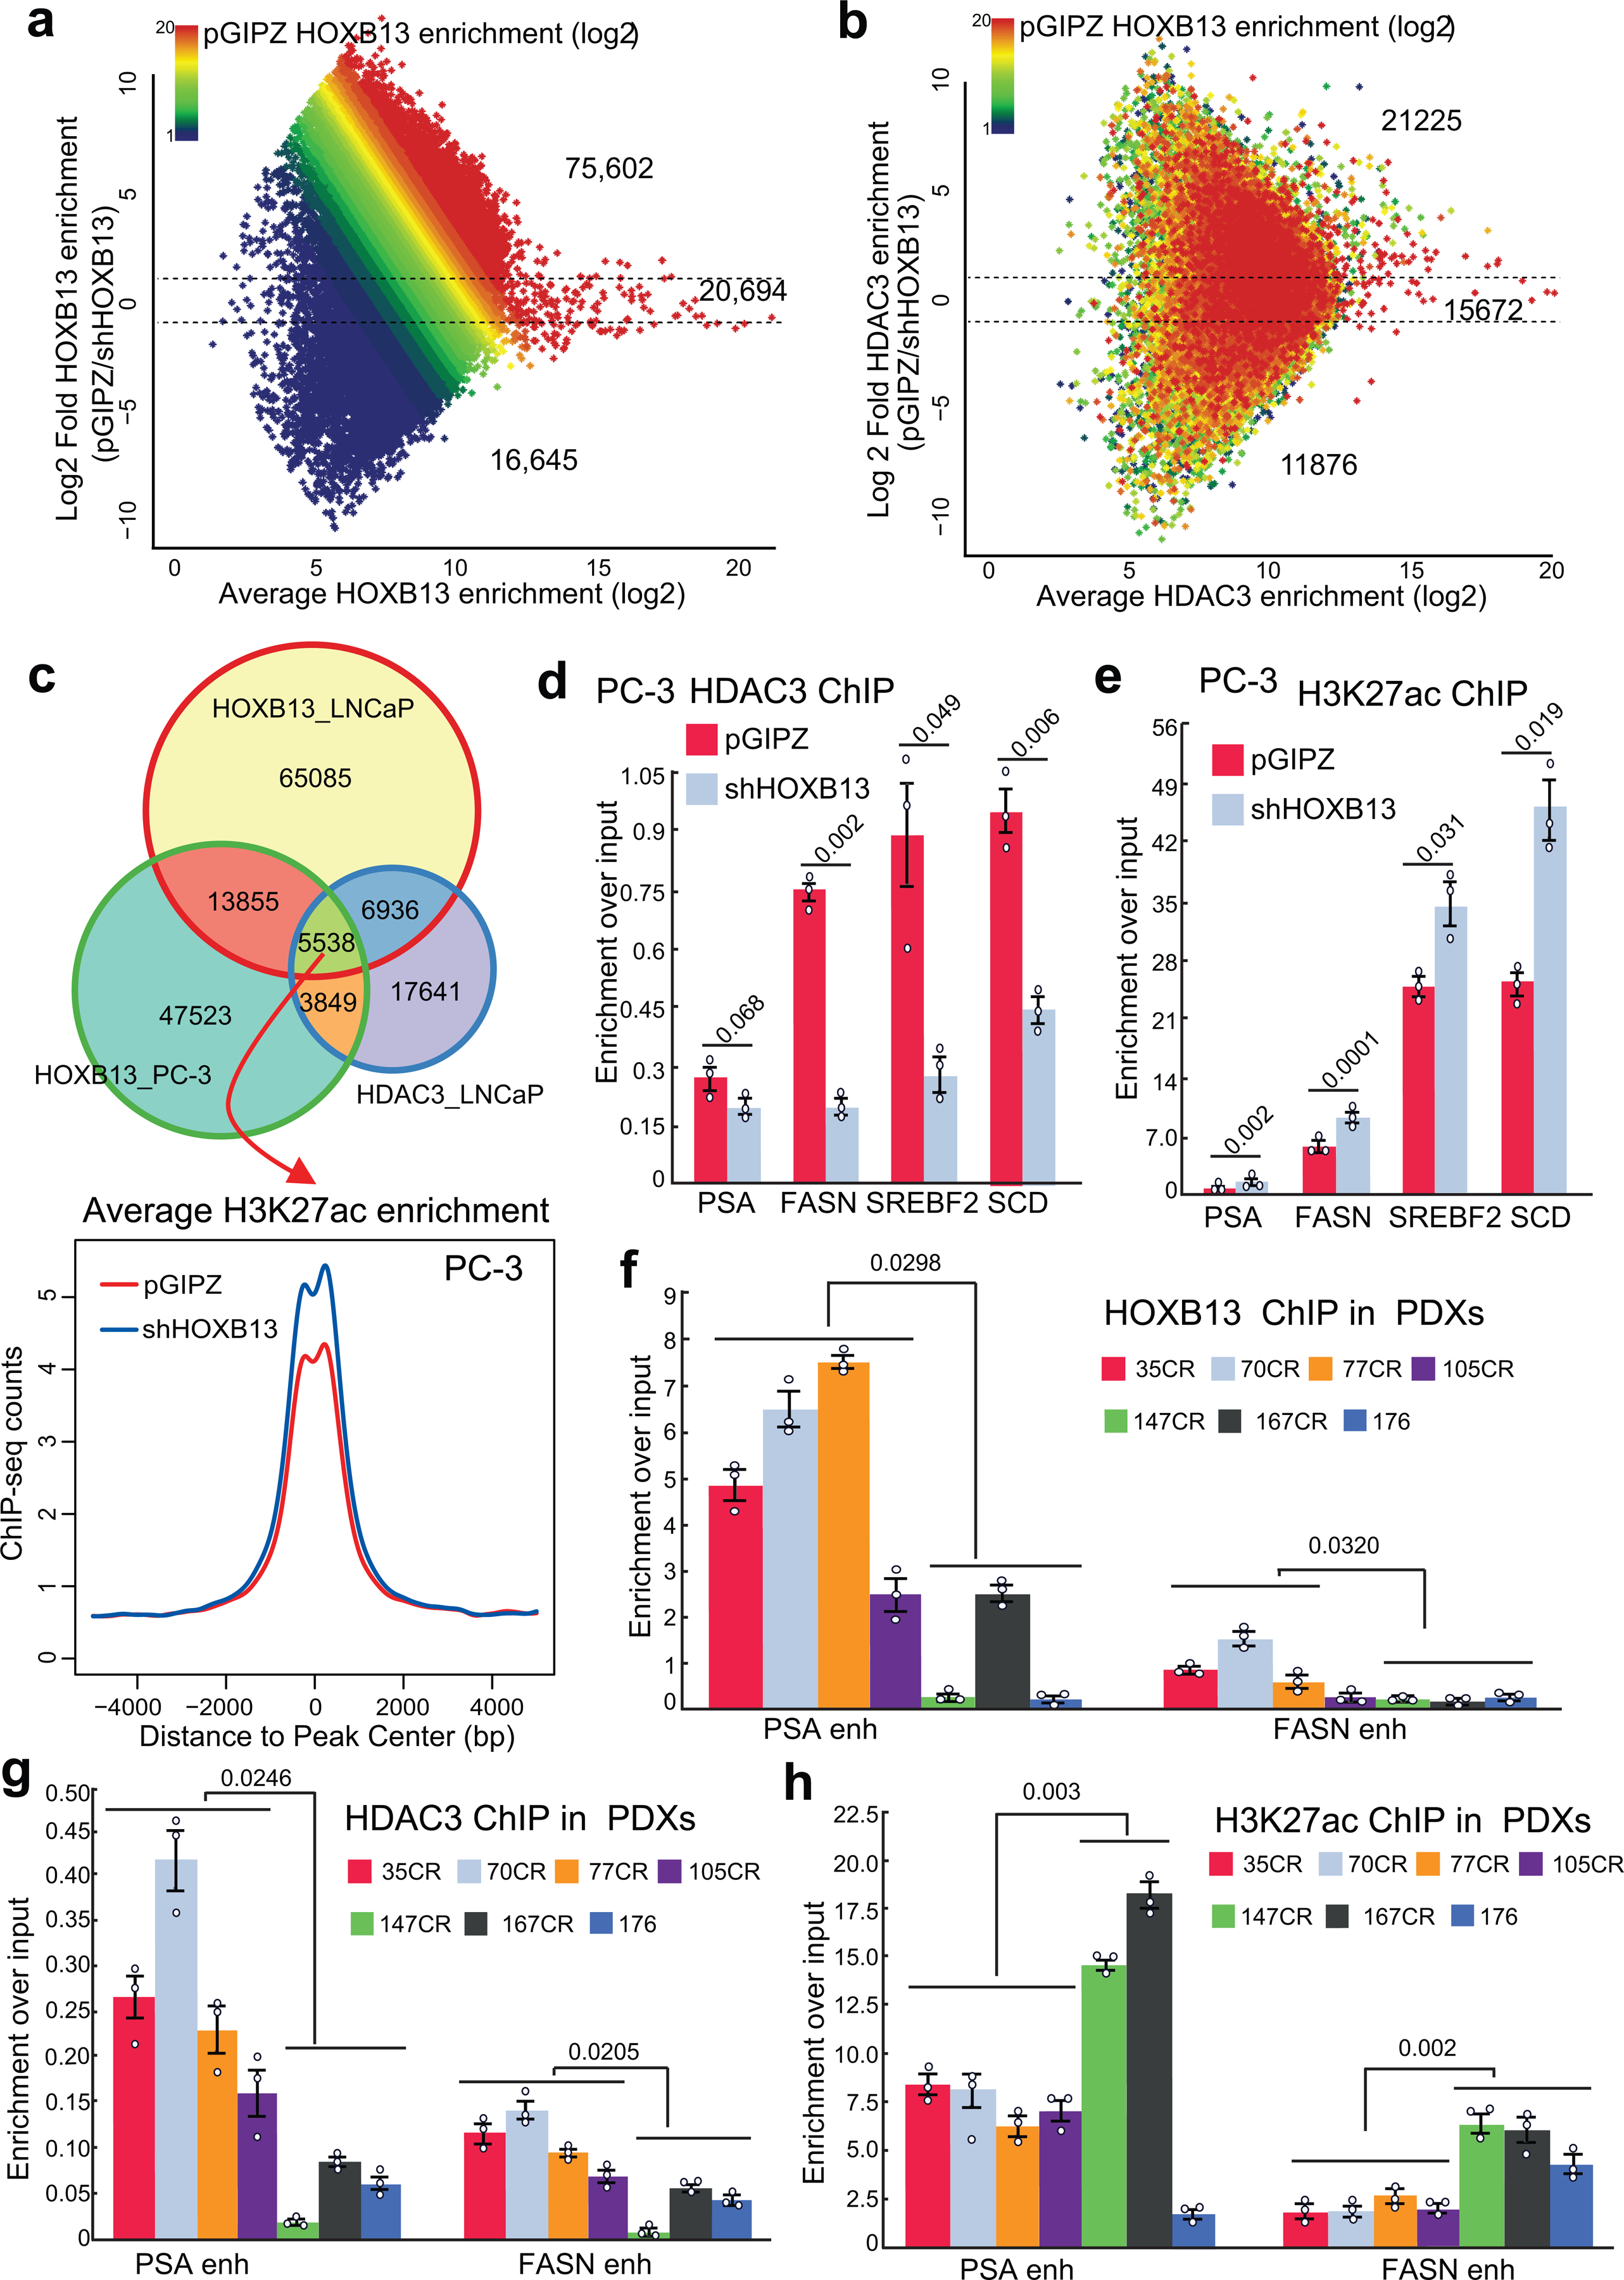
a-b. MA plot showing differential HOXB13 (a) and HDAC3 ChIP-seq enrichment (b) in control (pGIPZ) and HOXB13 KD (shHOXB13) LNCaP cells. Color encodes the intensity of HOXB13 ChIP-seq in control cells. Dotted lines represent 2-fold differences.
c. Venn diagram showing the overlap between HDAC3 and HOXB13 cistromes in PC-3 and LNCaP cells (top). Bottom: H3K27ac ChIP-seq was performed in PC-3 cells with control or HOXB13 KD, and their average intensity plots centered (±5 kb) on co-occupied sites are shown.
d-e. ChIP-qPCR analyses of HDAC3 (d) and H3K27ac (e) at lipogenic gene enhancers in PC3 cells with control or HOXB13 KD. Data were normalized to 2% of input DNA. Shown are the mean ±s.e.m of technical replicates from one of three (n=3) independent experiments. P values were calculated by unpaired two-sided t-test.
f-h. ChIP-qPCR analysis of HOXB13 (f), HDAC3 (g), and H3K27ac (h) at PSA and FASN enhancer in 7 CRPC PDX tumors. Data were normalized to 5% of input DNA. Shown are the mean ±s.e.m of technical replicates from one of three (n=3) independent experiments. Unpaired two-sided t-test was performed between indicated groups.
Extended Data Fig. 4. HDAC3 is required for HOXB13-mediated suppression of de novo lipogenesis.
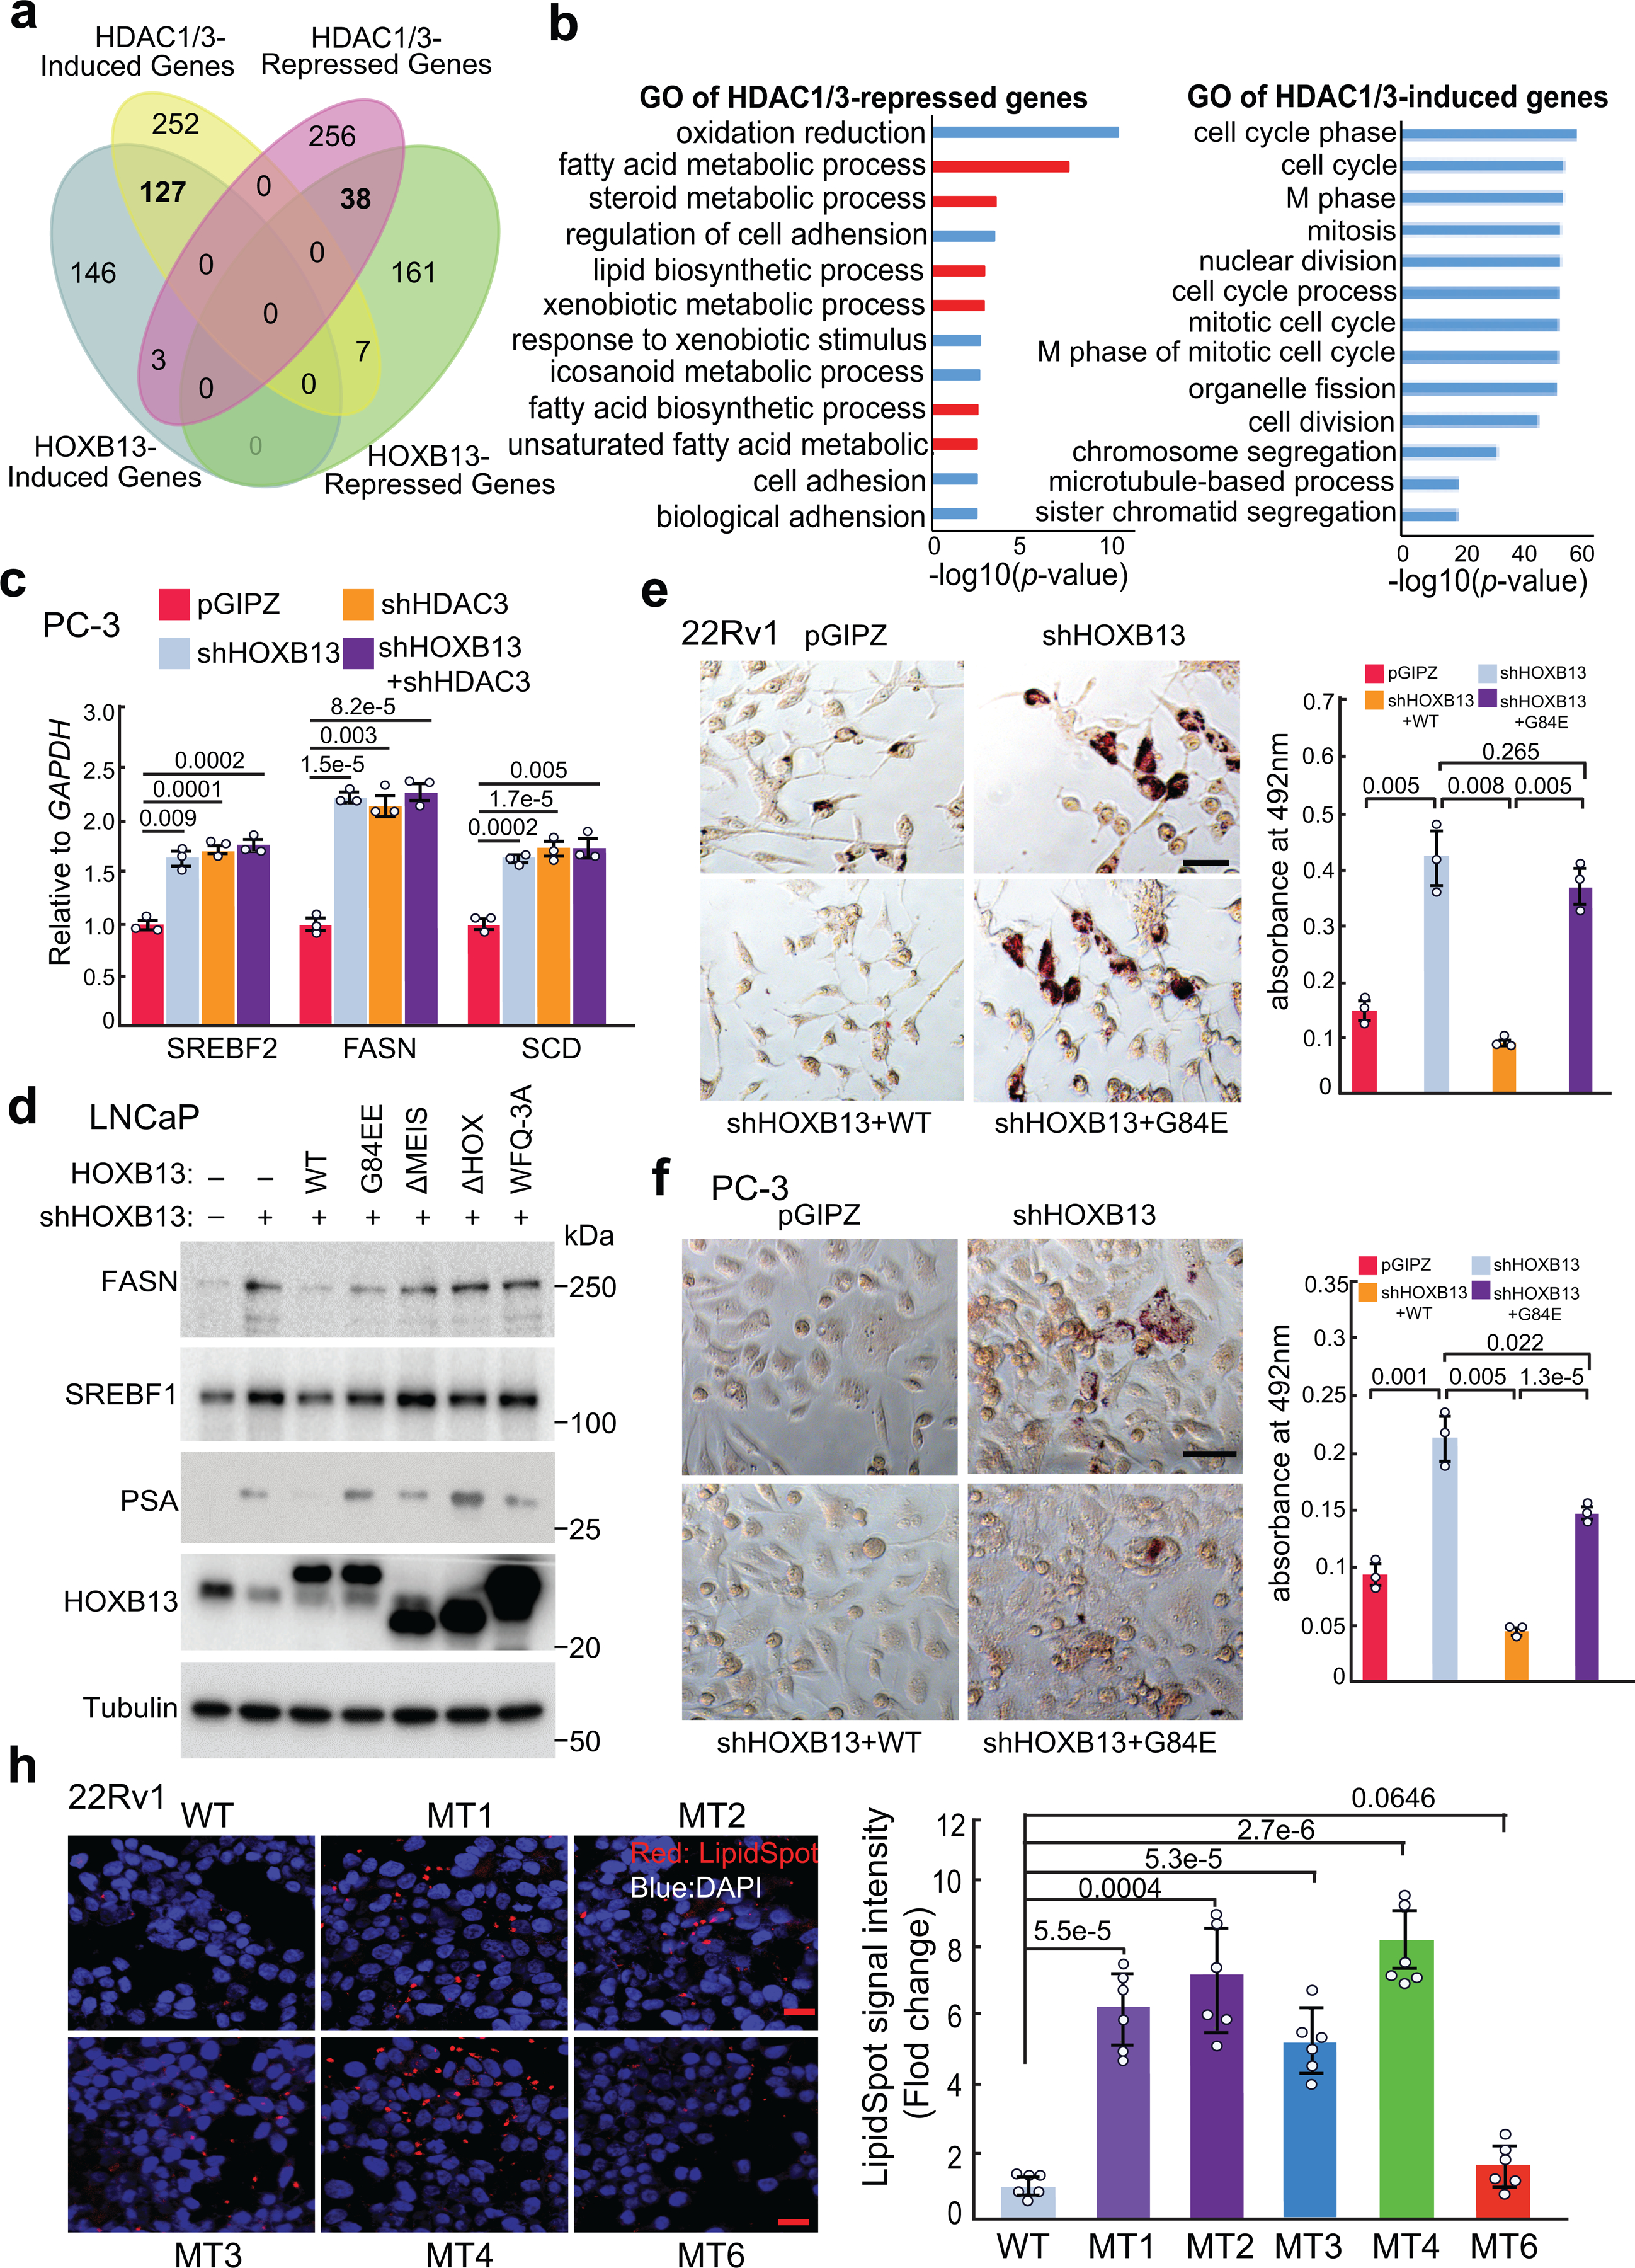
a. Venn Diagram showing the overlap between HOXB13- or HDAC1/3-induced or –repressed genes in LNCaP cells.
b. GO analysis of HDAC1/3-repressed (left) and -induced (right) genes in LNCaP cells. Top enriched molecular concepts are shown. p values were calculated by one-sided Fisher’s exact test.
c. QRT-PCR analysis of SREBF2, FASN, and SCD expression in PC-3 cells with KD of HOXB13, HDAC3, or both. Data were normalized to GAPDH. Shown are mean ±s.e.m of technical replicates from one of three (n=3) independent experiments. P values were calculated by unpaired two-sided t-test.
d. WB analysis of HOXB13 and HDAC1/3 co-regulated genes in LNCaP cells with HOXB13 KD and rescue by HOXB13 WT or mutants. HOXB13 depletion expectedly led to up-regulation of FASN, SREBF1, and PSA, which were again repressed by re-introduction of WT HOXB13. HOXB13 ΔHOX/WFQ-3A mutants, although capable of interacting with HDAC3, are unable to bind DNA17 and consequently failed to repress lipogenic genes. Importantly, ΔMEIS and G84E mutants, which have impaired ability to interact with HDAC3, also failed to fully repress these genes.
e-f. Oil Red O staining and quantification of lipid accumulation in 22Rv1 (e) and PC-3 (f) with shHOXB13 and/or rescue. Scale bar: 30 μm. Quantification data are the mean ±s.d of technical replicates from one of two (n=2) independent experiments. P values were calculated by unpaired two-sided t-test.
h. LipidSpot staining and quantification of lipid droplets in HOXB13 WT and five clones of isogenic G84E 22Rv1. Scale bar:20 μm. LipidSpot staining intensity was quantified and calculated as the fold change of LipidSpot staining in G84E mutant cells compared with WT controls (right). Each data point represents an average of 6 (n=6) fields per independent experiment by image J. Data are the mean ±s.d. Unpaired two-sided t-test was performed between indicated groups as show in figure.
Extended Data Fig. 5. HOXB13 KD induces de novo lipogenesis in PCa cells cultured in either lipid-free or regular medium.
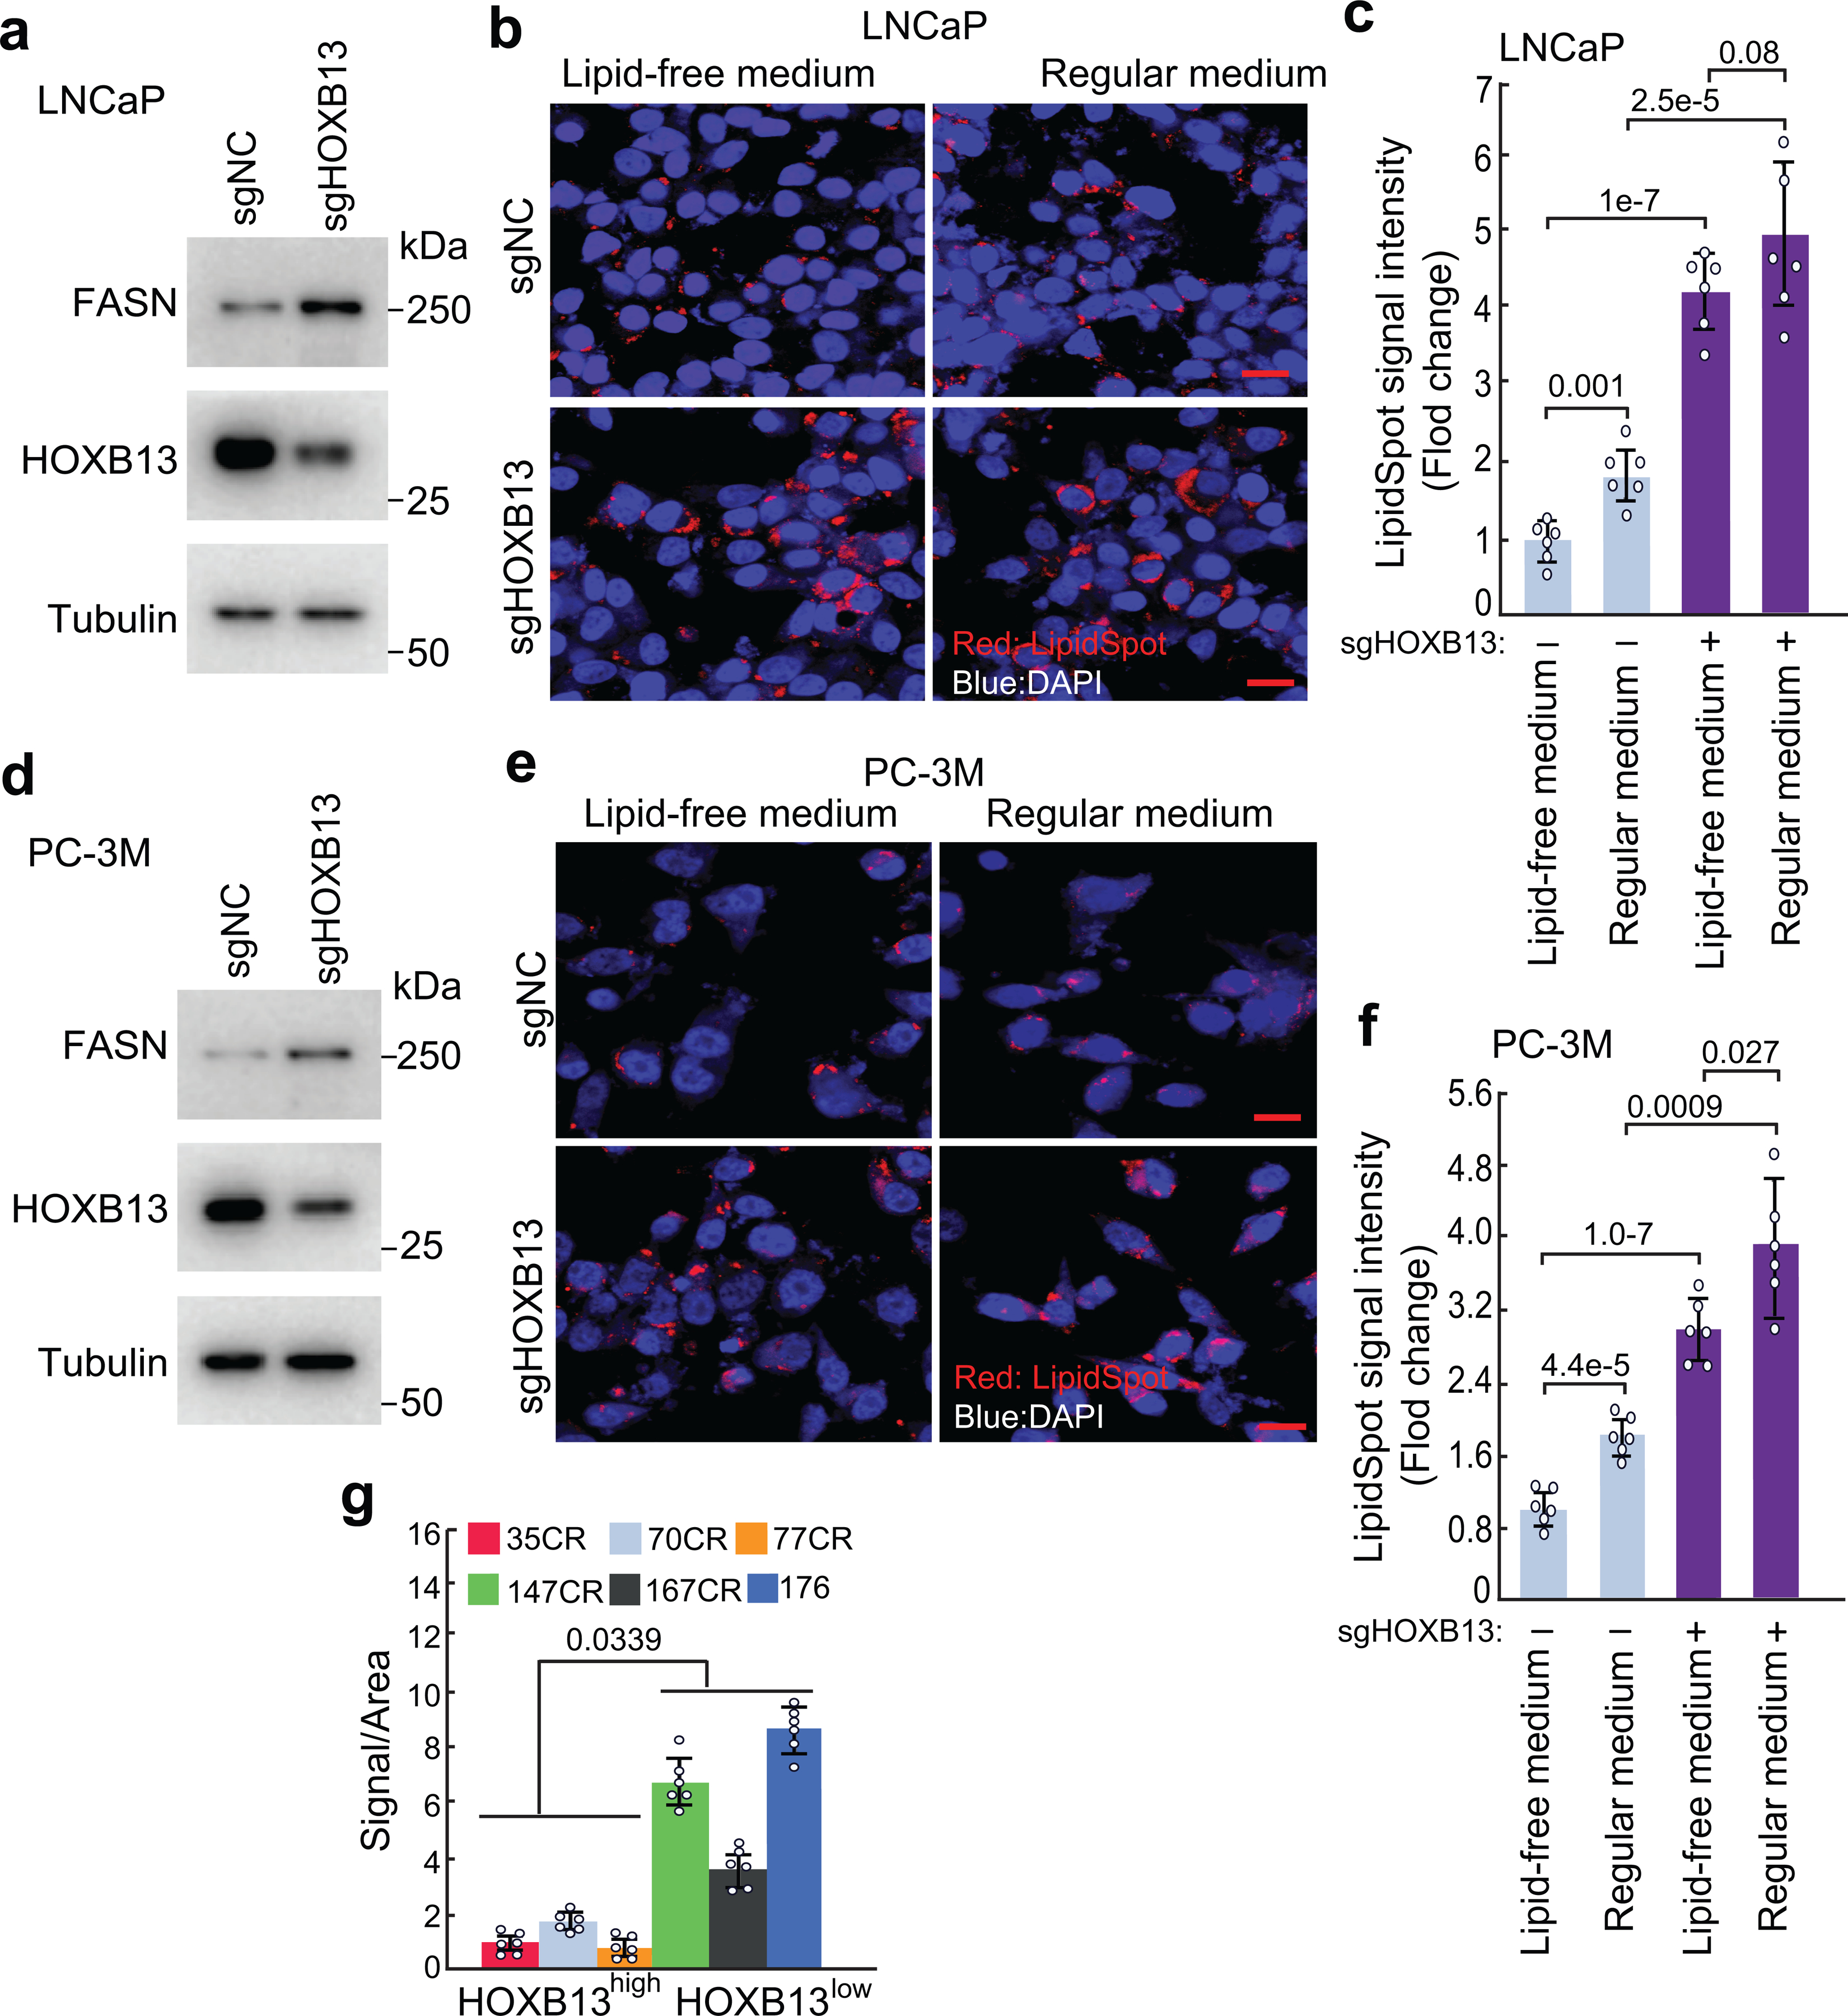
a-e. LipidSpot staining and quantification of lipid droplets in control (sgNC) or HOXB13 KD (sgHOXB13) LNCaP (a-c) and PC-3M (d-f) cultured in lipid-free or regular medium (10% FBS). WB (a,d) validating FASN up-regulation in HOXB13-KD cells cultured in lipid-free medium, confirming de novo lipogenesis. Data (b,e) shown are representative images of LipidSpot staining with a scale bar of 20 μm. LipidSpot staining intensity was quantified and calculated as fold change of LipidSpot staining in each condition normalized to sgNC non-target control under lipid-free medium (c,f). Each data point represents an average of 6 (n=6) fields per independent experiment by image J. Data are the mean ±s.d. Unpaired two-sided t-test were performed between indicated groups as show in figure. g. Quantification of lipid accumulation of PDXs in Fig.4i. Six (n=6) representative areas per PDX were quantified using Image J. Data are shown as mean±s.d. Unpaired one-sided t-test was performed between indicated groups as show in figure.
Extended Data Fig. 6. HOXB13 is hypermethylated and down-regulated in CRPC.
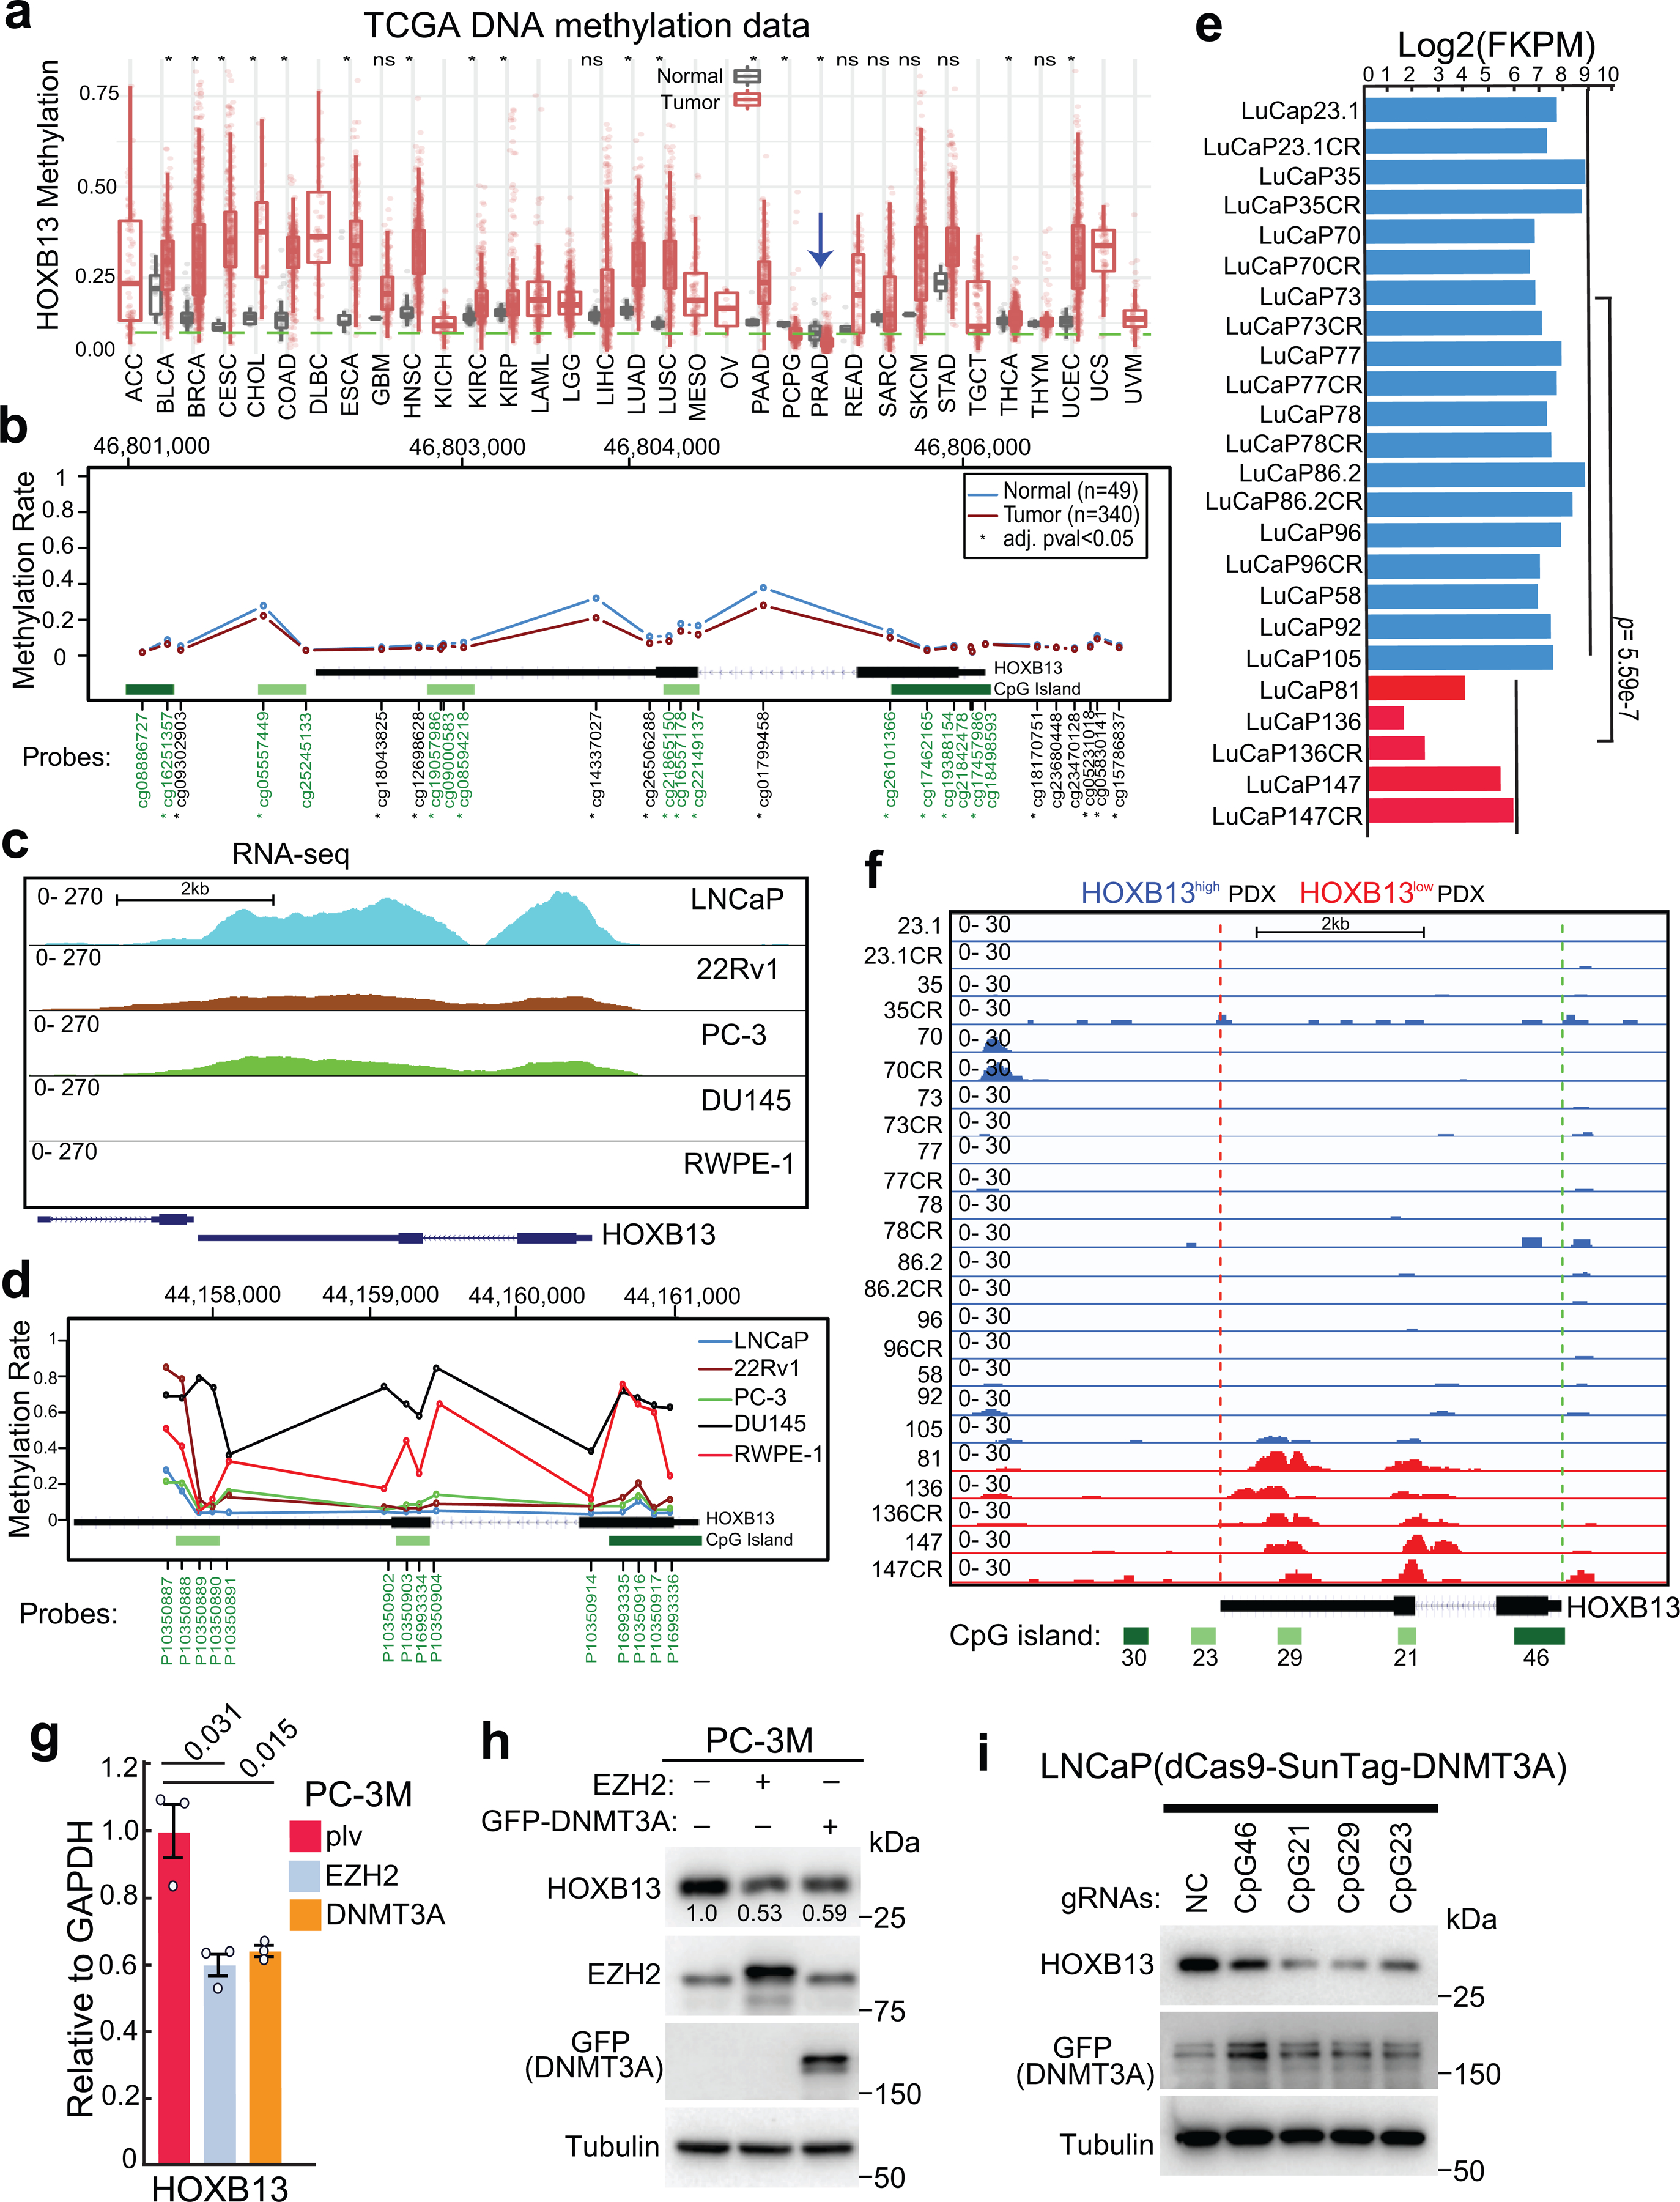
a. HOXB13 gene methylation levels in a variety of cancer types and corresponding benign (normal) samples using TCGA methylation data. Blue arrow indicates PCa (PRAD).
*marks tumor types of significant differences compared with matched benign samples by Wilcoxon rank sum test. The sample sizes were included in Supplemental Table 7.
b. Average methylation levels of Illumina Infinium probes targeting different regions of the HOXB13 gene (chr17:46,802,127–46,806,111. hg19) based on TCGA methylation data. Probes in green fonts target CpG islands. *probes with significantly differential methylation between normal and prostate tumor samples (Wilcoxon rank sum test with adjusted p-value < 0.05).
c-d. Genome browser view of RNA-seq data (c) of HOXB13 (chr17:48,724,763–48,728,750, hg38) and average methylation levels (d) of 3 CpG islands within the HOXB13 gene loci (chr17:44,157,125–44,161,110. hg18) in LNCaP, 22Rv1, PC-3, DU145, and RWPE-1 cells.
e. Expression of HOXB13 in Log2(FKPM) in LuCaP PDXs based on RNA-seq data. Blue indicates high- and red for low-HOXB13 samples.
f. IGV track showing methylation at HOXB13 gene (chr17:46,802,127–46,806,111. hg19) in LuCaP PDX tumors with high or low HOXB13 as indicated in e. HOXB13 gene methylation in LuCaP PDX tumors was analyzed using MeDIP-seq data.
g-h. RT-qPCR and WB analyses of PC-3M cells subjected to EZH2 or GFP-DNMT3A overexpression. PCR data shown are mean ±s.e.m. of technical replicates from one of three (n=3) independent experiments and analyzed by unpaired two-sided t-test.
i. WB analyses of LNCaP cells treated with dCas9-SunTag-DNMT3A system with gRNAs targeting the 4 CpGs within the HOXB13 gene loci. The gRNAs were cloned into the pLKO5.sgRNA.EFS.tRFP657 vector and an sgRNA (NC) that had no cognate target in the human genome was used as a negative control. WB was performed 7 days after co-infection of indicated constructs.
Extended Data Fig. 7. HOXB13 loss induces PCa cell motility in vitro and tumor metastasis in vivo.
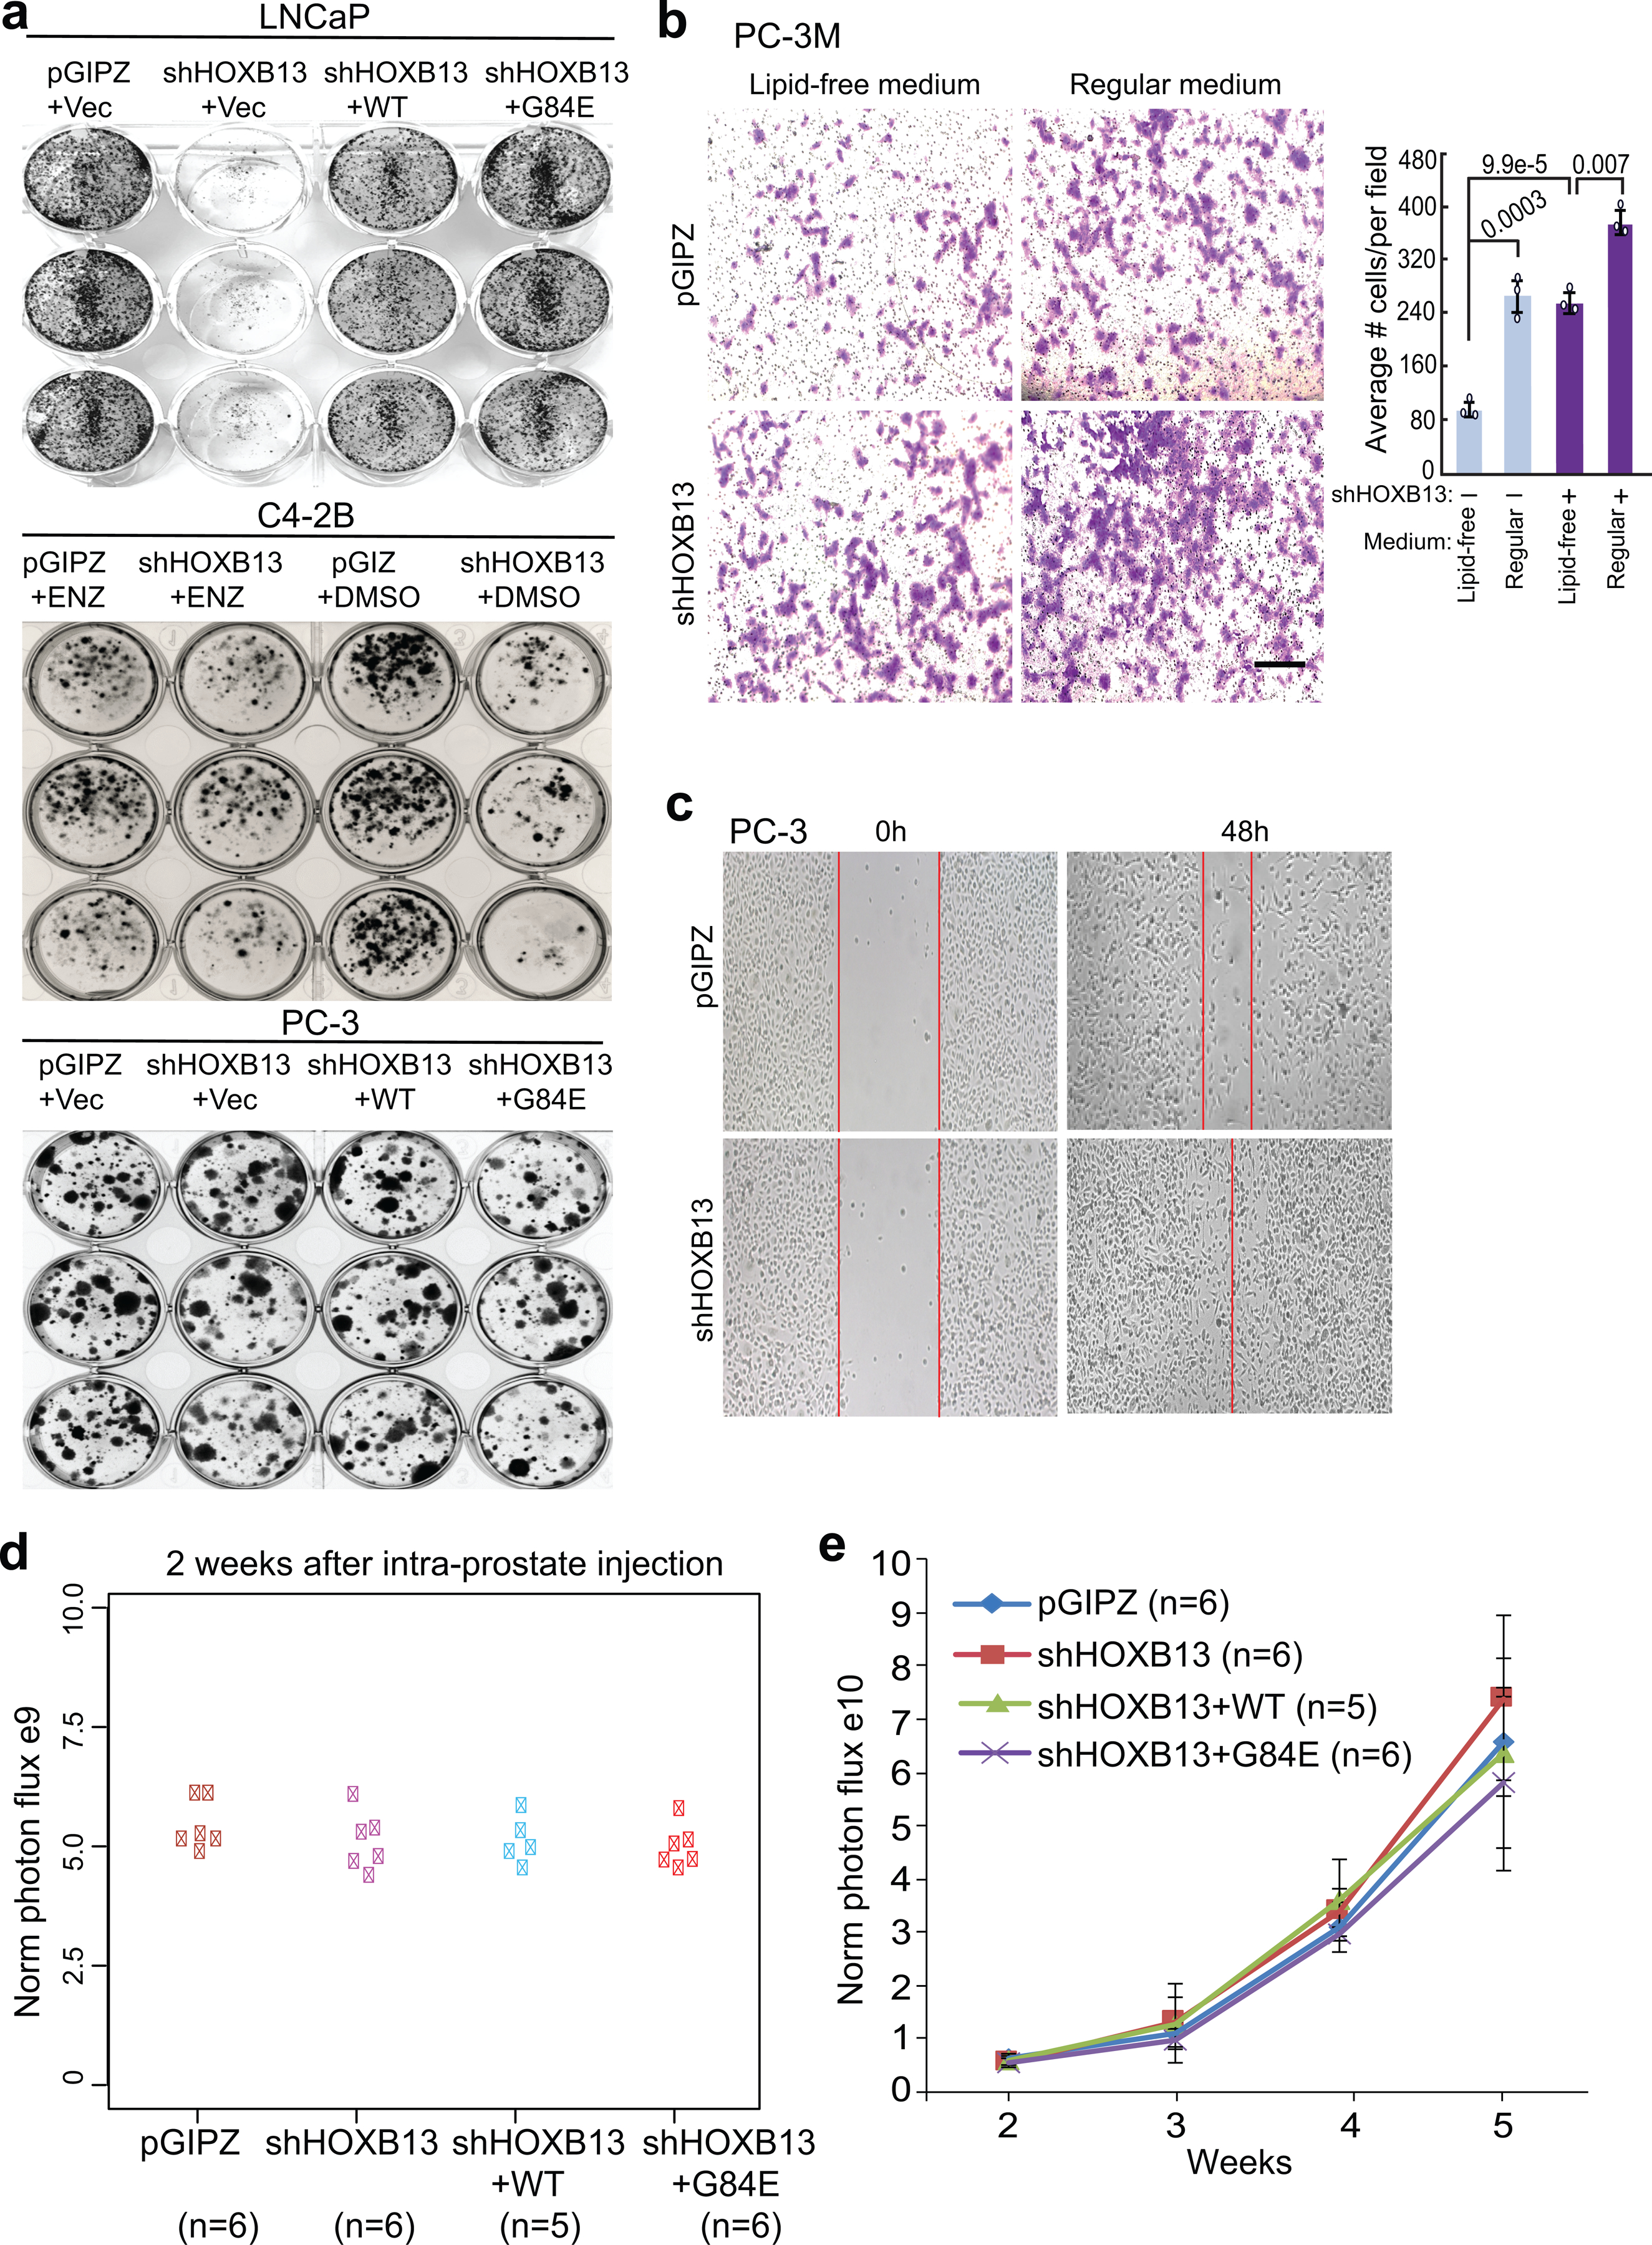
a. Colony formation assays were performed in LNCaP, C4–2B and PC-3 cells with HOXB13 de-regulation or indicated treatment. The data showed that androgen-dependent LNCaP cell growth was abolished by HOXB13 KD, which could be restored by re-expression of either WT or G84E HOXB13, suggesting an AR-dependent effect. By contrast, C4–2B is only partially sensitive to HOXB13 KD, whereas the growth of C4–2B cells pre-treated by enzalutamide (ENZ) and the AR-negative PC-3 cells is unaffected by HOXB13 KD.
b. Cell invasion assays of control or HOXB13-KD PC-3M cells cultured in lipid-free or regular medium. Representative images are shown (left panels), and the number of invaded cells are quantified (right panel). Scale bar: 50 μm. Quantified data shown are mean ±s.d. of three representative fields from one of three (n=3) independent experiments. P values were calculated by unpaired two-sided t-test.
c. Cell migration assays of PC-3 cells with control or shHOXB13. Images shown were taken at 0 and 48 hours after a scratch was created on the cell monolayer.
d. Tumor volume was measured by IVIS after two weeks of intra-prostate inoculation of PC-3M cells. Y-axis shows the normalized luciferase intensity. Statistical significance was evaluated by one-way ANOVA test (P=0.836).
e. HOXB13 de-regulation did not affect PC-3M xenograft tumor growth. Tumor volume was measured every week by IVIS live mice imaging. Y-axis shows the normalized luciferase intensity. Data shown in each time point are mean ± s.d. Statistical significance was evaluated by one-way ANOVA test (P=0.365).
Extended Data Fig. 8. Effect of various lipogenic inhibitors on PCa cells.
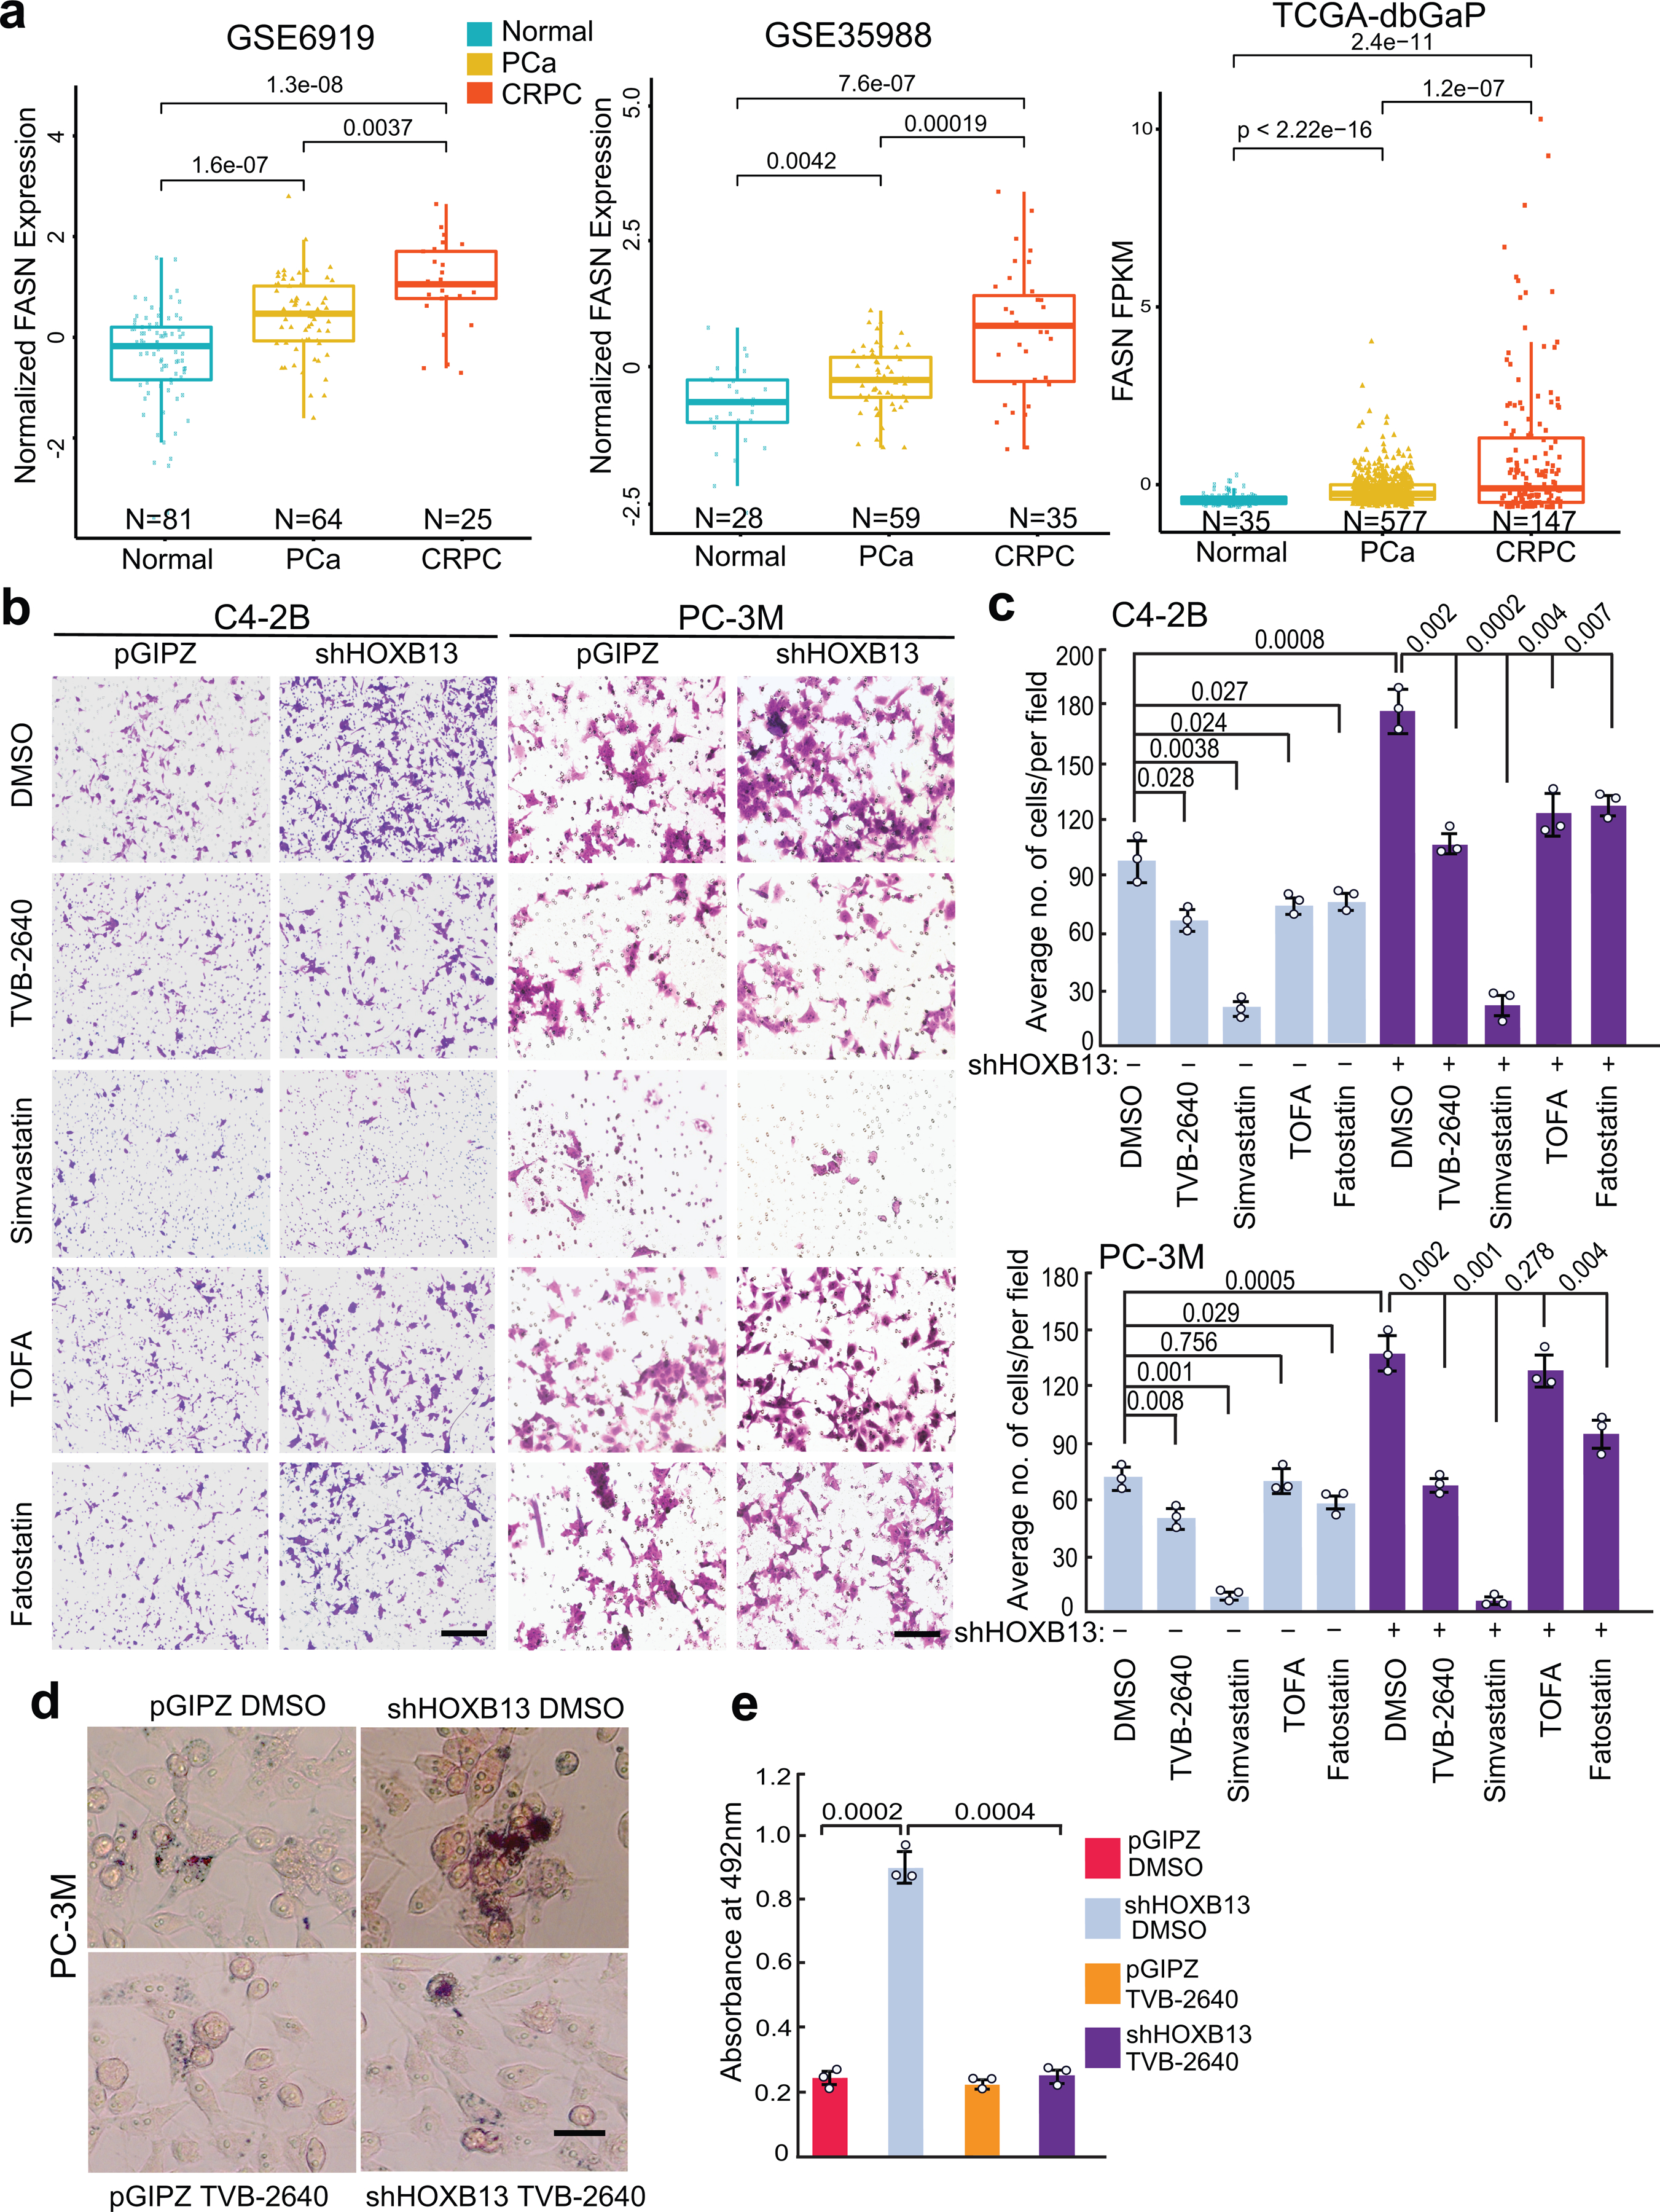
a. FASN mRNA levels in publically available PCa gene expression profiling datasets. Data shown (Y-axis) are log2-transformed microarray expression values for GSE6919 and GSE35988 and FPKM values for TCGA-dbGaP dataset, which combines prostate samples from dbGaP datasets with accession#: phs000178(TCGA), phs000443, phs000915, and phs000909. P values between primary and metastatic PCa were calculated using unpaired two-sided t-test. Boxplots represent the median and bottom and upper quartiles; Whisker edges indicate minimum and maximum values.
b. Cell invasion of control or HOXB13-KD cells treated with various lipid inhibitors. PC-3M cells were treated with 5μM TVB-2640, 5μM TOFA, 2μM Fatostatin or 2μM Simvastatin for 3 days. C4–2B cells were treated with 1μM of indicated inhibitors for 3 days. Representative images are shown for C4–2B with a Scale bar of 50 μm and PC-3M with a Scale bar of 30 μm.
c. Quantification of cell invasion shown in b. Data shown are the mean ±s.d of three representative fields from one of two (n=2) independent experiments. P values were calculated by unpaired two-sided t-test comparing inhibitor groups with DMSO in control or shHOXB13 cells.
d-e. Representative images of Oil Red O staining (d) and quantification (e) of lipid accumulation in HOXB13-KD PC-3M cells treated with DMSO or 5μM TVB-2640 for 3 days. Scale bar: 30 μm. Data shown are the mean ± s.d of triplicate wells from one of two (n=2) independent experiments. Unpaired two-sided t test was performed between indicated groups as shown in figures.
Extended Data Fig. 9. Therapeutic targeting of HOXB13-low tumors with FASN inhibitors in an orthotopic xenograft model.
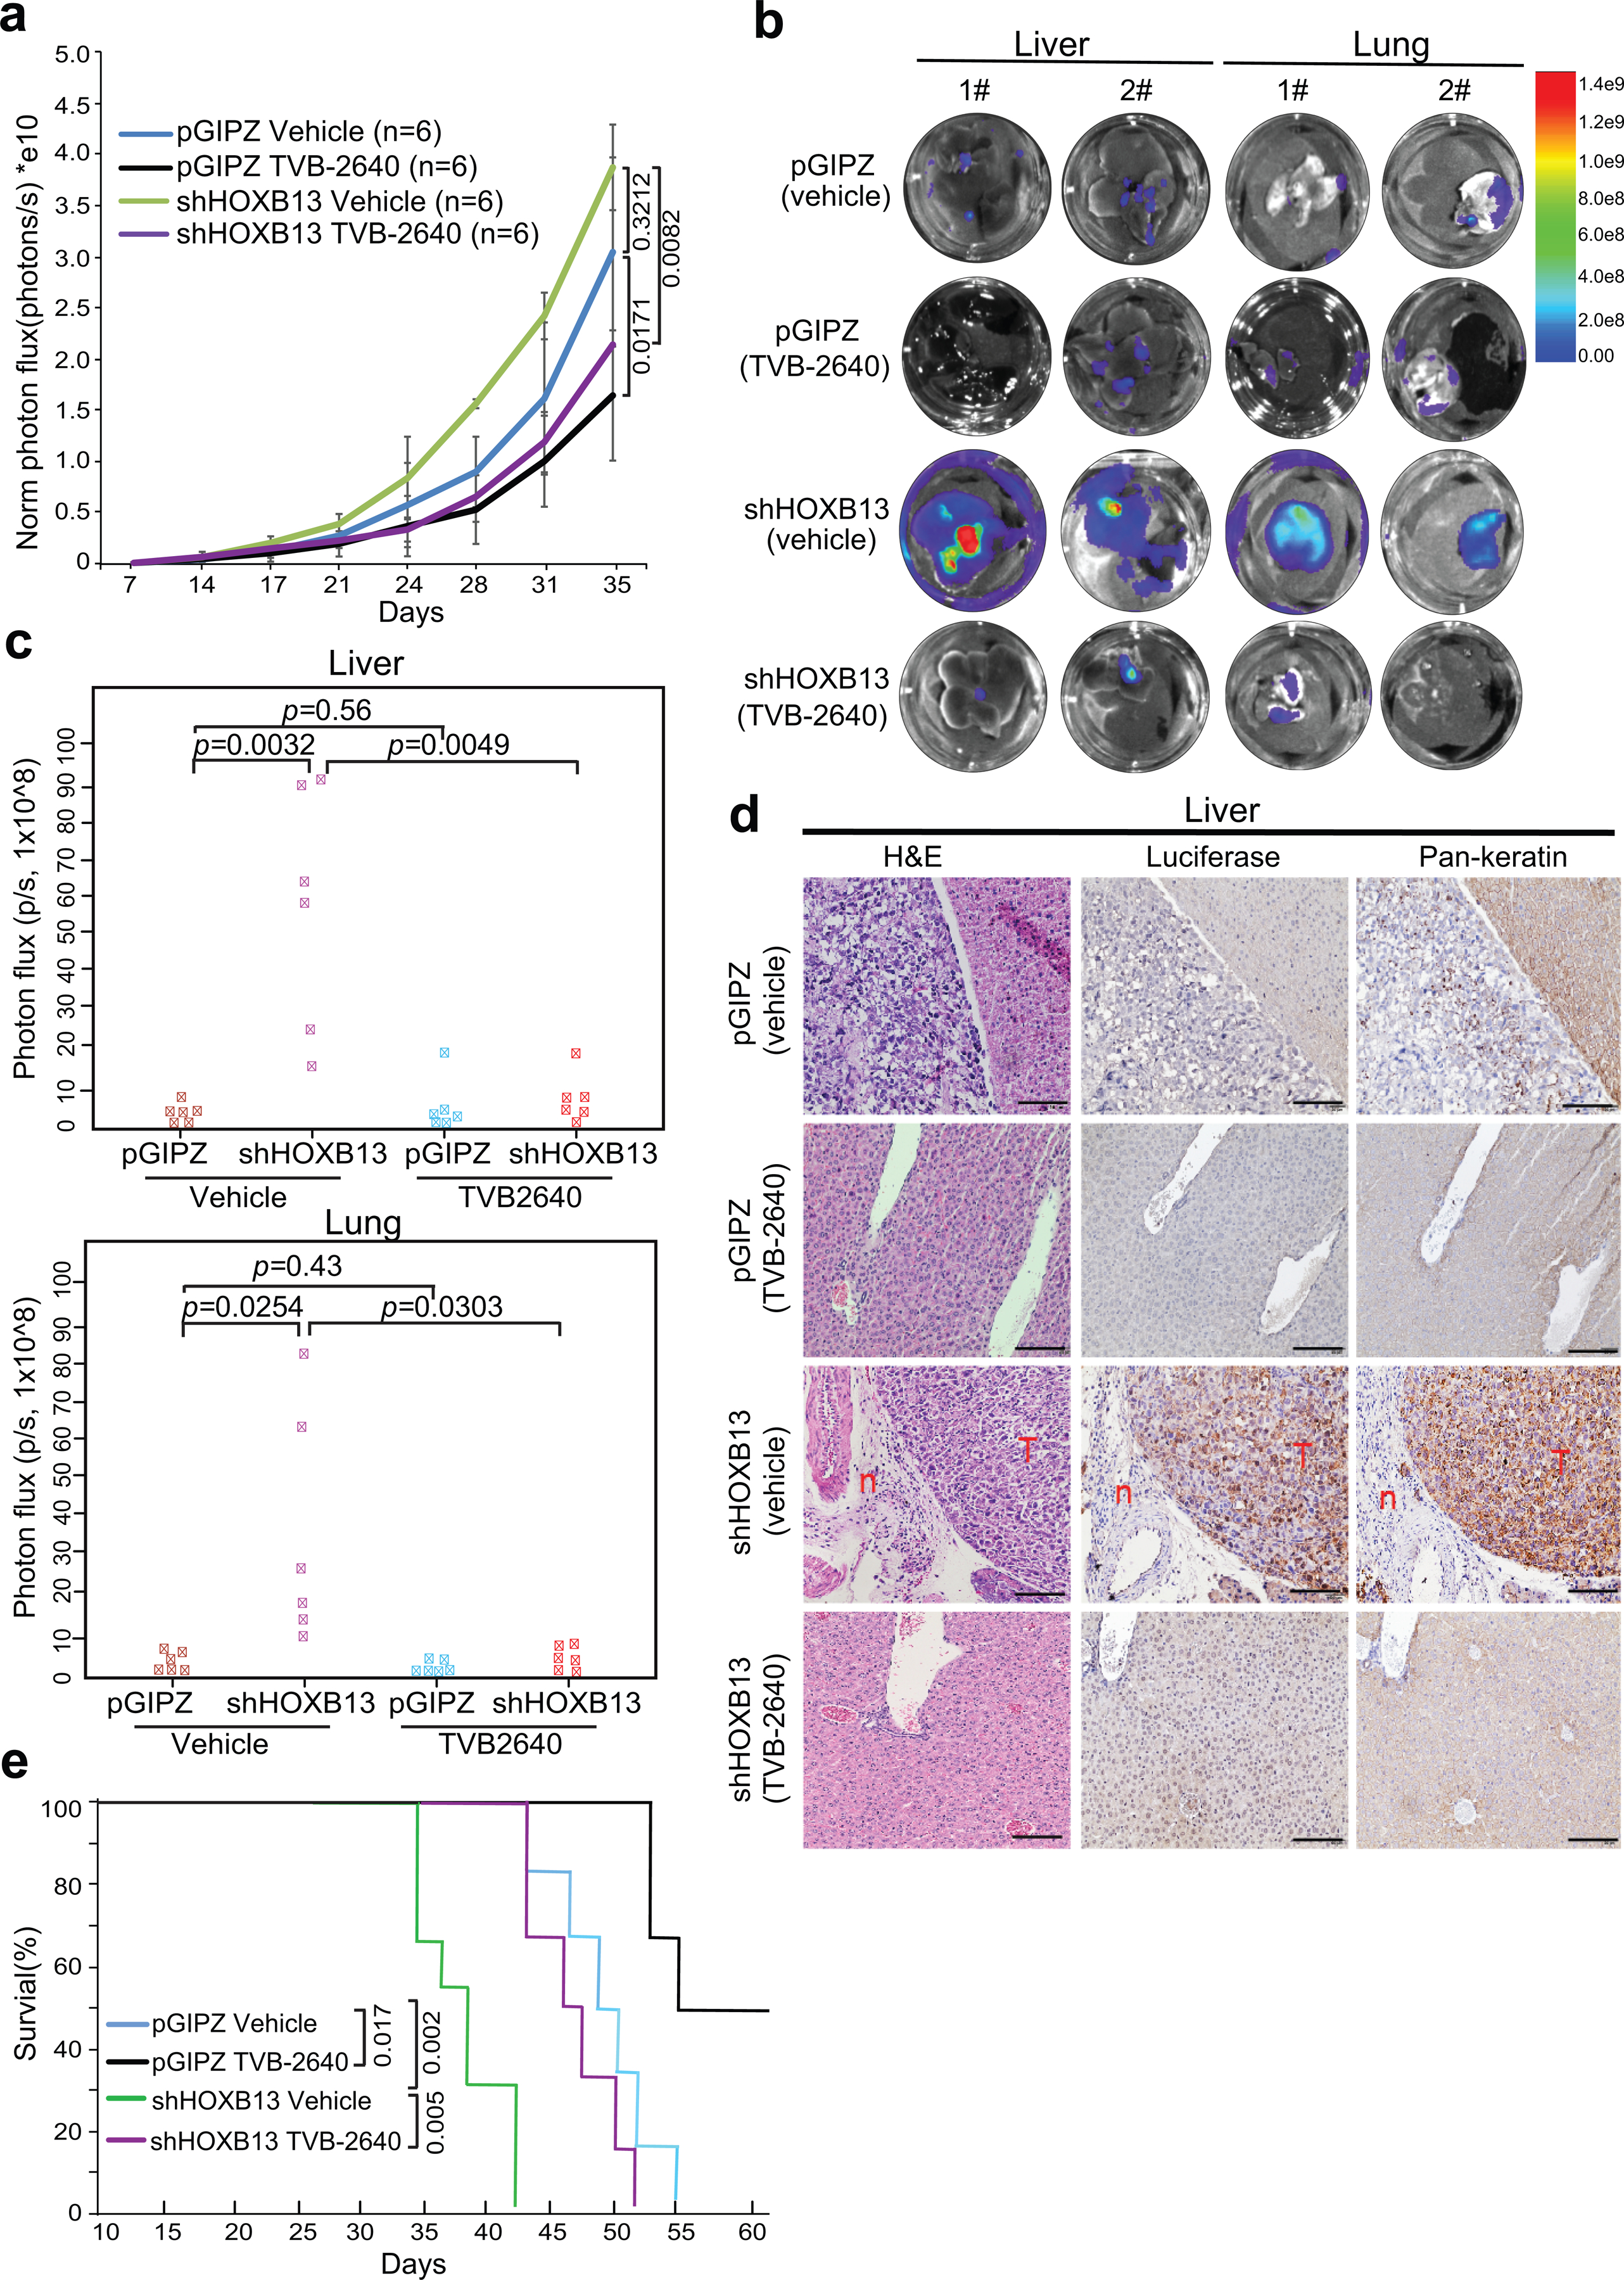
a. Graph showing tumor volumes after intraprostatic inoculation of PC-3M cells. Tumor formation was confirmed by IVIS one week after inoculation. Then the mice were randomized to receive vehicle (30% PEG400) or TVB-2640 (100mg/Kg) every day for 30 days. Tumor volumes were measured twice per week by IVIS after two weeks of inoculation. Y-axis shows the normalized luciferase intensity. Data in each time point are mean ±s.d. Statistical significance was evaluated by one-way ANOVA (P=0.0007) and comparisons between indicated groups by post hoc Tukey test. PC-3M xenograft tumor growth was not affected by HOXB13 KD (p=0.3212). Importantly, primary tumor growth in both control (pGIPZ, p=0.0171) and HOXB13-KD (shHOXB13, p=0.0082) mice was significantly inhibited by TVB-2640.
b-c. Representative ex vivo IVIS images (b) and quantifications (c) of PC-3M tumor metastasis to the liver and lung (n=6 mice per group). Heatmap shows IVIS signal intensity color scale. Indicated p-values were shown by unpaired two-sided t-test. HOXB13 KD significantly promoted PCa metastases, which was abolished by TVB-2640.
d. Validation of PC-3M tumor metastasis to the liver by H&E and IHC. Luciferase and Pan-keratin IHC were used to identify metastasized PC-3M cells in mouse liver. Representative images of H&E, Luciferase and Pan-keratin staining in indicated group (n=3 mice in each group) are shown. Scale bar: 30 μm. “T” indicates tumor and “n” for normal liver.
e. Kaplan-Meier analyses of overall survival of pGIPZ and HOXB13 KD mice treated with vehicle or TVB-2640 (n=6 mice per group). P values were determined by the log-rank test. TVB-2640 treatment prolonged the overall survival of mice in both control (p= 0.017) and HOXB13-KD (p= 0.005) groups.
Extended Data Fig. 10. Therapeutic targeting of HOXB13-low tumors with FASN inhibitors in an intravenous xenograft model.
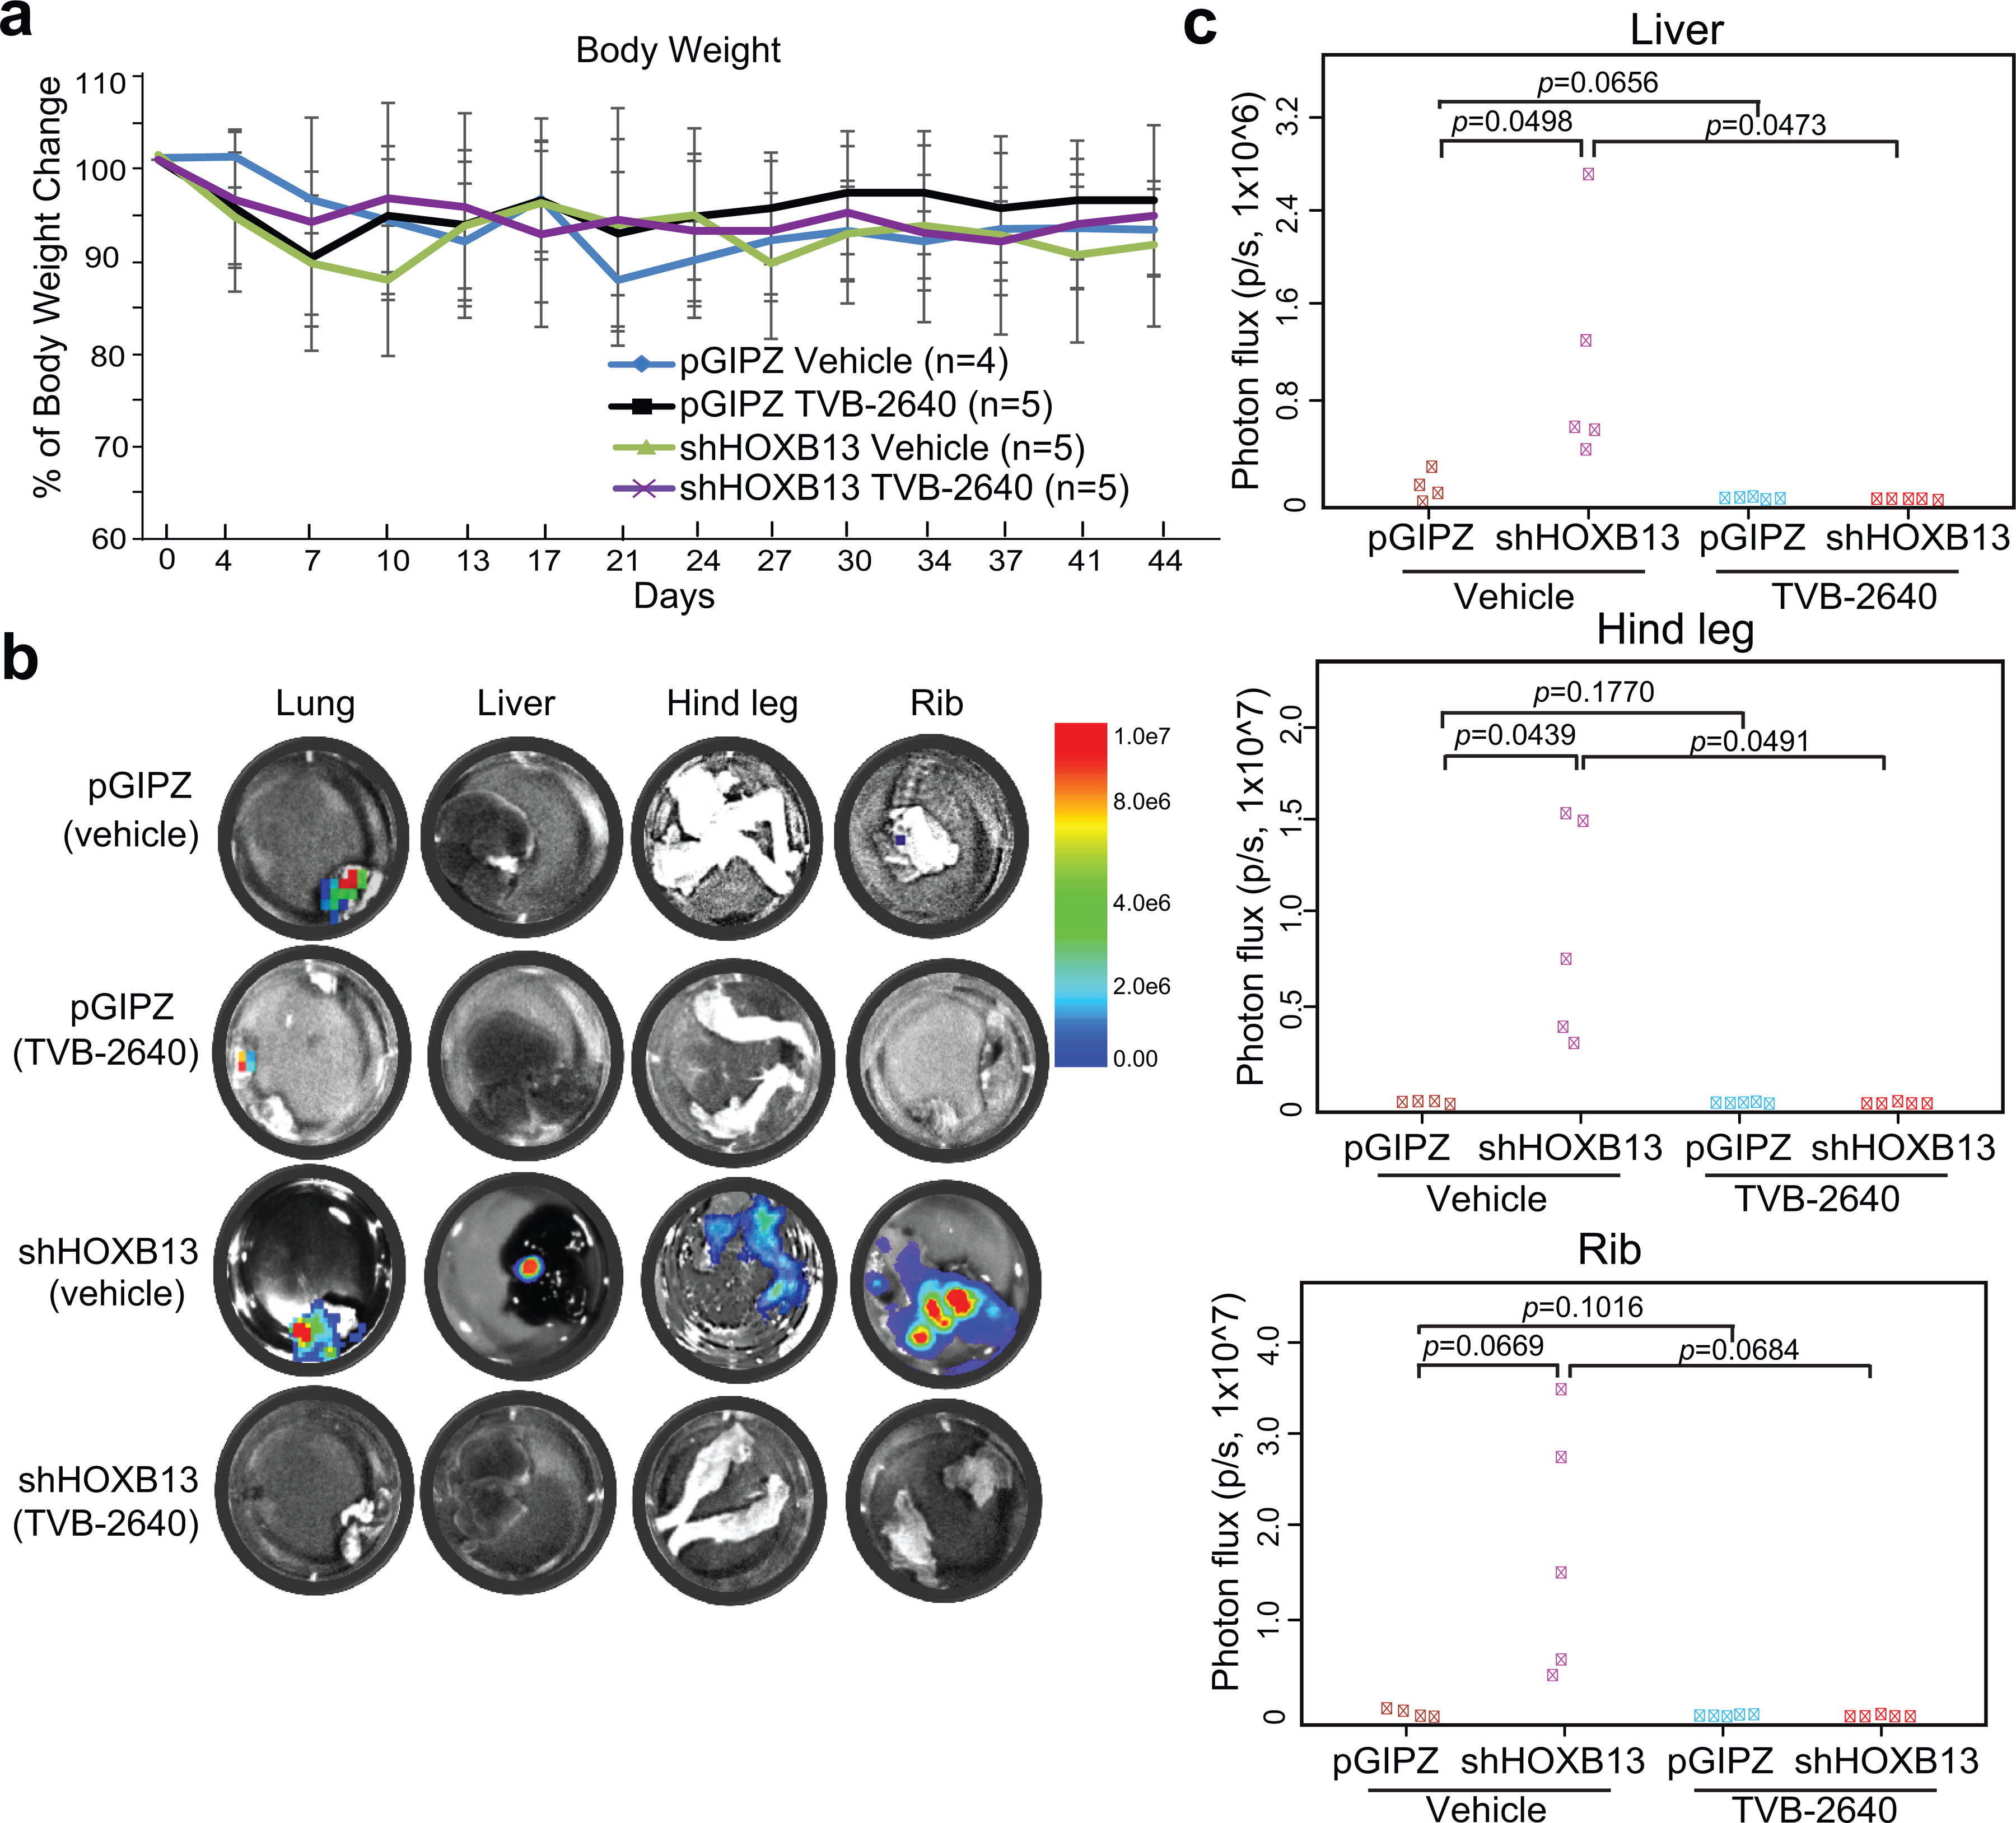
a. Body weight analysis in mice inoculated by control or HOXB13-KD PC-3M cells and treated with vehicle or TVB-2640. Data in each time point are mean ±s.d. Y-axis shows the percentage of body weight change.
b-c. Representative ex vivo IVIS images (b) of PC-3M tumor metastasis to lung, hind leg, liver, and rib and quantification (c) of metastasis to liver, hind leg, and rib (n=4 mice for pGIPZ vehicle group; n=5 mice for the rest groups). At the endpoint, lung, hind leg, liver, and rib were collected and analyzed using ex vivo IVIS. Heatmap in b shows IVIS signal intensity color scale. Y-axis in c shows the normalized luciferase intensity. Indicated p values were by unpaired two-sided t test.
Supplementary Material
ACKNOWLEDGEMENTS
We thank Drs. Yuzhi Jia, and Wanqing Xie for providing some technical support for in vivo experiments. We thank all members of the Yu laboratory for helpful discussions. This work was partially supported by the Northwestern University Pathology Core Facility, Center for Advanced Microscopy/Nikon Imaging Center, and Robert H. Lurie Comprehensive Cancer Center Support Grant (NCI P30CA060553). NGS was done at the University of Chicago Genomics Facility and lipid profiling at Mass Spectrometry Core, the University of Illinois at Chicago. IP-MS was done at Taplin Mass Spectrometry Facility of Harvard Medical School. We thank the patients and their families, Celestia Higano, Evan Yu, Elahe Mostaghel, Heather Cheng, Pete Nelson, Bruce Montgomery, Mike Schweizer, Andrew Hsieh, Jonathan Wright, Daniel Lin, Funda Vakar-Lopez, Xiaotun Zhang, Martine Roudier, Lawrence True and the rapid autopsy teams for their contributions to the University of Washington Medical Center Prostate Cancer Donor Rapid Autopsy Program and the Development of the LuCaP PDX models. Funding supports for the work include the NIH/NCI training grant T32CA09560 (to G.G., L.T.B.), prostate cancer SPORE P50CA180995 (to W.J.C., J.Y., X.Y.), R01CA257446 and R01CA227918 (to J.Y.), R50CA211271 (to J.C.Z.), NIH-R35 CA197532 (to N.S.C.), R01CA251555 (to M.L.F.), Prostate Cancer Foundation 2017CHAL2008 (to J.Y.), and the Department of Defense W81XWH-19-1-0565 and W81XWH-21-1-0234 (to M.L.F.) and W81XWH-17-1-0405 and W81XWH-17-1-0578 (to J.Y.). Generation and maintenance of the LuCaP PDX models were partially funded by NIH awards P50CA97186 and P01CA163227.
Footnotes
Conflict of Interest: All authors have declared that no conflict of interest exists.
REFFERENCE
- 1.Zadra G et al. Inhibition of de novo lipogenesis targets androgen receptor signaling in castration-resistant prostate cancer. Proc Natl Acad Sci U S A 116, 631–640 (2019). [DOI] [PMC free article] [PubMed] [Google Scholar]
- 2.Poulose N et al. Genetics of lipid metabolism in prostate cancer. Nat Genet 50, 169–171 (2018). [DOI] [PubMed] [Google Scholar]
- 3.Butler LM, Centenera MM & Swinnen JV Androgen control of lipid metabolism in prostate cancer: novel insights and future applications. Endocr Relat Cancer 23, R219–27 (2016). [DOI] [PubMed] [Google Scholar]
- 4.Swinnen JV, Esquenet M, Goossens K, Heyns W & Verhoeven G Androgens stimulate fatty acid synthase in the human prostate cancer cell line LNCaP. Cancer Res 57, 1086–90 (1997). [PubMed] [Google Scholar]
- 5.Swinnen JV, Ulrix W, Heyns W & Verhoeven G Coordinate regulation of lipogenic gene expression by androgens: evidence for a cascade mechanism involving sterol regulatory element binding proteins. Proc Natl Acad Sci U S A 94, 12975–80 (1997). [DOI] [PMC free article] [PubMed] [Google Scholar]
- 6.Han W et al. Reactivation of androgen receptor-regulated lipid biosynthesis drives the progression of castration-resistant prostate cancer. Oncogene 37, 710–721 (2018). [DOI] [PMC free article] [PubMed] [Google Scholar]
- 7.Mitra R, Chao O, Urasaki Y, Goodman OB & Le TT Detection of lipid-rich prostate circulating tumour cells with coherent anti-Stokes Raman scattering microscopy. BMC Cancer 12, 540 (2012). [DOI] [PMC free article] [PubMed] [Google Scholar]
- 8.Yue S et al. Cholesteryl ester accumulation induced by PTEN loss and PI3K/AKT activation underlies human prostate cancer aggressiveness. Cell Metab 19, 393–406 (2014). [DOI] [PMC free article] [PubMed] [Google Scholar]
- 9.Chen J et al. Compartmentalized activities of the pyruvate dehydrogenase complex sustain lipogenesis in prostate cancer. Nat Genet 50, 219–228 (2018). [DOI] [PMC free article] [PubMed] [Google Scholar]
- 10.Chen M et al. An aberrant SREBP-dependent lipogenic program promotes metastatic prostate cancer. Nat Genet 50, 206–218 (2018). [DOI] [PMC free article] [PubMed] [Google Scholar]
- 11.Berger MF et al. Variation in homeodomain DNA binding revealed by high-resolution analysis of sequence preferences. Cell 133, 1266–76 (2008). [DOI] [PMC free article] [PubMed] [Google Scholar]
- 12.Huang Q et al. A prostate cancer susceptibility allele at 6q22 increases RFX6 expression by modulating HOXB13 chromatin binding. Nat Genet 46, 126–35 (2014). [DOI] [PubMed] [Google Scholar]
- 13.Sreenath T, Orosz A, Fujita K & Bieberich CJ Androgen-independent expression of hoxb-13 in the mouse prostate. Prostate 41, 203–7 (1999). [DOI] [PubMed] [Google Scholar]
- 14.Edwards S et al. Expression analysis onto microarrays of randomly selected cDNA clones highlights HOXB13 as a marker of human prostate cancer. Br J Cancer 92, 376–81 (2005). [DOI] [PMC free article] [PubMed] [Google Scholar]
- 15.Economides KD & Capecchi MR Hoxb13 is required for normal differentiation and secretory function of the ventral prostate. Development 130, 2061–9 (2003). [DOI] [PubMed] [Google Scholar]
- 16.Pomerantz MM et al. The androgen receptor cistrome is extensively reprogrammed in human prostate tumorigenesis. Nat Genet 47, 1346–51 (2015). [DOI] [PMC free article] [PubMed] [Google Scholar]
- 17.Norris JD et al. The homeodomain protein HOXB13 regulates the cellular response to androgens. Mol Cell 36, 405–16 (2009). [DOI] [PMC free article] [PubMed] [Google Scholar]
- 18.Chen Z et al. Diverse AR-V7 cistromes in castration-resistant prostate cancer are governed by HoxB13. Proc Natl Acad Sci U S A 115, 6810–6815 (2018). [DOI] [PMC free article] [PubMed] [Google Scholar]
- 19.Augello MA et al. CHD1 Loss Alters AR Binding at Lineage-Specific Enhancers and Modulates Distinct Transcriptional Programs to Drive Prostate Tumorigenesis. Cancer Cell 35, 603–617 e8 (2019). [DOI] [PMC free article] [PubMed] [Google Scholar]
- 20.Jung C, Kim RS, Zhang HJ, Lee SJ & Jeng MH HOXB13 induces growth suppression of prostate cancer cells as a repressor of hormone-activated androgen receptor signaling. Cancer Res 64, 9185–92 (2004). [DOI] [PubMed] [Google Scholar]
- 21.VanOpstall C et al. MEIS-mediated suppression of human prostate cancer growth and metastasis through HOXB13-dependent regulation of proteoglycans. Elife 9(2020). [DOI] [PMC free article] [PubMed] [Google Scholar]
- 22.Whitington T et al. Gene regulatory mechanisms underpinning prostate cancer susceptibility. Nat Genet 48, 387–97 (2016). [DOI] [PubMed] [Google Scholar]
- 23.Mazrooei P et al. Cistrome Partitioning Reveals Convergence of Somatic Mutations and Risk Variants on Master Transcription Regulators in Primary Prostate Tumors. Cancer Cell 36, 674–689 e6 (2019). [DOI] [PubMed] [Google Scholar]
- 24.Spisak S et al. CAUSEL: an epigenome- and genome-editing pipeline for establishing function of noncoding GWAS variants. Nat Med 21, 1357–63 (2015). [DOI] [PMC free article] [PubMed] [Google Scholar]
- 25.Ewing CM et al. Germline mutations in HOXB13 and prostate-cancer risk. N Engl J Med 366, 141–9 (2012). [DOI] [PMC free article] [PubMed] [Google Scholar]
- 26.Johng D et al. HOXB13 interaction with MEIS1 modifies proliferation and gene expression in prostate cancer. Prostate 79, 414–424 (2019). [DOI] [PubMed] [Google Scholar]
- 27.Heinzel T et al. A complex containing N-CoR, mSin3 and histone deacetylase mediates transcriptional repression. Nature 387, 43–8 (1997). [DOI] [PubMed] [Google Scholar]
- 28.Abbas A & Gupta S The role of histone deacetylases in prostate cancer. Epigenetics 3, 300–9 (2008). [DOI] [PMC free article] [PubMed] [Google Scholar]
- 29.Horlein AJ et al. Ligand-independent repression by the thyroid hormone receptor mediated by a nuclear receptor co-repressor. Nature 377, 397–404 (1995). [DOI] [PubMed] [Google Scholar]
- 30.Chen JD & Evans RM A transcriptional co-repressor that interacts with nuclear hormone receptors. Nature 377, 454–7 (1995). [DOI] [PubMed] [Google Scholar]
- 31.Guenther MG, Barak O & Lazar MA The SMRT and N-CoR corepressors are activating cofactors for histone deacetylase 3. Mol Cell Biol 21, 6091–101 (2001). [DOI] [PMC free article] [PubMed] [Google Scholar]
- 32.You SH et al. Nuclear receptor co-repressors are required for the histone-deacetylase activity of HDAC3 in vivo. Nat Struct Mol Biol 20, 182–7 (2013). [DOI] [PMC free article] [PubMed] [Google Scholar]
- 33.Knutson SK et al. Liver-specific deletion of histone deacetylase 3 disrupts metabolic transcriptional networks. EMBO J 27, 1017–28 (2008). [DOI] [PMC free article] [PubMed] [Google Scholar]
- 34.Sun Z et al. Hepatic Hdac3 promotes gluconeogenesis by repressing lipid synthesis and sequestration. Nat Med 18, 934–42 (2012). [DOI] [PMC free article] [PubMed] [Google Scholar]
- 35.Feng D et al. A circadian rhythm orchestrated by histone deacetylase 3 controls hepatic lipid metabolism. Science 331, 1315–9 (2011). [DOI] [PMC free article] [PubMed] [Google Scholar]
- 36.Kent LN & Leone G The broken cycle: E2F dysfunction in cancer. Nat Rev Cancer 19, 326–338 (2019). [DOI] [PubMed] [Google Scholar]
- 37.Wang S et al. Target analysis by integration of transcriptome and ChIP-seq data with BETA. Nat Protoc 8, 2502–15 (2013). [DOI] [PMC free article] [PubMed] [Google Scholar]
- 38.Pomerantz MM et al. Prostate cancer reactivates developmental epigenomic programs during metastatic progression. Nat Genet 52, 790–799 (2020). [DOI] [PMC free article] [PubMed] [Google Scholar]
- 39.Sun Z et al. Deacetylase-independent function of HDAC3 in transcription and metabolism requires nuclear receptor corepressor. Mol Cell 52, 769–82 (2013). [DOI] [PMC free article] [PubMed] [Google Scholar]
- 40.Guo C et al. Regulated clearance of histone deacetylase 3 protects independent formation of nuclear receptor corepressor complexes. J Biol Chem 287, 12111–20 (2012). [DOI] [PMC free article] [PubMed] [Google Scholar]
- 41.Li J et al. Both corepressor proteins SMRT and N-CoR exist in large protein complexes containing HDAC3. EMBO J 19, 4342–50 (2000). [DOI] [PMC free article] [PubMed] [Google Scholar]
- 42.Wang Z et al. Genome-wide mapping of HATs and HDACs reveals distinct functions in active and inactive genes. Cell 138, 1019–31 (2009). [DOI] [PMC free article] [PubMed] [Google Scholar]
- 43.Nguyen HM et al. LuCaP Prostate Cancer Patient-Derived Xenografts Reflect the Molecular Heterogeneity of Advanced Disease an--d Serve as Models for Evaluating Cancer Therapeutics. Prostate 77, 654–671 (2017). [DOI] [PMC free article] [PubMed] [Google Scholar]
- 44.Takeshima H, Yamashita S, Shimazu T & Ushijima T Effects of genome architecture and epigenetic factors on susceptibility of promoter CpG islands to aberrant DNA methylation induction. Genomics 98, 182–8 (2011). [DOI] [PubMed] [Google Scholar]
- 45.Zhao SG et al. The DNA methylation landscape of advanced prostate cancer. Nat Genet 52, 778–789 (2020). [DOI] [PMC free article] [PubMed] [Google Scholar]
- 46.Yu YP et al. Whole-genome methylation sequencing reveals distinct impact of differential methylations on gene transcription in prostate cancer. Am J Pathol 183, 1960–1970 (2013). [DOI] [PMC free article] [PubMed] [Google Scholar]
- 47.Vire E et al. The Polycomb group protein EZH2 directly controls DNA methylation. Nature 439, 871–4 (2006). [DOI] [PubMed] [Google Scholar]
- 48.Huang YH et al. DNA epigenome editing using CRISPR-Cas SunTag-directed DNMT3A. Genome Biol 18, 176 (2017). [DOI] [PMC free article] [PubMed] [Google Scholar]
- 49.Jin HJ, Zhao JC, Ogden I, Bergan RC & Yu J Androgen receptor-independent function of FoxA1 in prostate cancer metastasis. Cancer Res 73, 3725–36 (2013). [DOI] [PMC free article] [PubMed] [Google Scholar]
- 50.Heuer TS et al. FASN Inhibition and Taxane Treatment Combine to Enhance Anti-tumor Efficacy in Diverse Xenograft Tumor Models through Disruption of Tubulin Palmitoylation and Microtubule Organization and FASN Inhibition-Mediated Effects on Oncogenic Signaling and Gene Expression. EBioMedicine 16, 51–62 (2017). [DOI] [PMC free article] [PubMed] [Google Scholar]
- 51.Kote-Jarai Z et al. Prevalence of the HOXB13 G84E germline mutation in British men and correlation with prostate cancer risk, tumour characteristics and clinical outcomes. Ann Oncol 26, 756–761 (2015). [DOI] [PubMed] [Google Scholar]
- 52.Ventura R et al. Inhibition of de novo Palmitate Synthesis by Fatty Acid Synthase Induces Apoptosis in Tumor Cells by Remodeling Cell Membranes, Inhibiting Signaling Pathways, and Reprogramming Gene Expression. EBioMedicine 2, 808–24 (2015). [DOI] [PMC free article] [PubMed] [Google Scholar]
- 53.Xu B et al. Altered chromatin recruitment by FOXA1 mutations promotes androgen independence and prostate cancer progression. Cell Res 29, 773–775 (2019). [DOI] [PMC free article] [PubMed] [Google Scholar]
- 54.Fong KW, Zhao JC, Song B, Zheng B & Yu J TRIM28 protects TRIM24 from SPOP-mediated degradation and promotes prostate cancer progression. Nat Commun 9, 5007 (2018). [DOI] [PMC free article] [PubMed] [Google Scholar]
- 55.Corces MR et al. An improved ATAC-seq protocol reduces background and enables interrogation of frozen tissues. Nat Methods 14, 959–962 (2017). [DOI] [PMC free article] [PubMed] [Google Scholar]
- 56.Song B et al. Targeting FOXA1-mediated repression of TGF-beta signaling suppresses castration-resistant prostate cancer progression. J Clin Invest 129, 569–582 (2019). [DOI] [PMC free article] [PubMed] [Google Scholar]
- 57.Li Y, Ge D & Lu C The SMART App: an interactive web application for comprehensive DNA methylation analysis and visualization. Epigenetics Chromatin 12, 71 (2019). [DOI] [PMC free article] [PubMed] [Google Scholar]
- 58.Diez-Villanueva A, Mallona I & Peinado MA Wanderer, an interactive viewer to explore DNA methylation and gene expression data in human cancer. Epigenetics Chromatin 8, 22 (2015). [DOI] [PMC free article] [PubMed] [Google Scholar]
- 59.Shen SY, Burgener JM, Bratman SV & De Carvalho DD Preparation of cfMeDIP-seq libraries for methylome profiling of plasma cell-free DNA. Nat Protoc 14, 2749–2780 (2019). [DOI] [PubMed] [Google Scholar]
- 60.Perez-Riverol Y et al. The PRIDE database and related tools and resources in 2019: improving support for quantification data. Nucleic Acids Res 47, D442–D450 (2019). [DOI] [PMC free article] [PubMed] [Google Scholar]
Associated Data
This section collects any data citations, data availability statements, or supplementary materials included in this article.
Supplementary Materials
Data Availability Statement
All sequencing data (RNA-seq and ChIP-seq) generated for the study have been deposited in GEO (GSE153586). https://www.ncbi.nlm.nih.gov/geo/query/acc.cgi?acc=GSE153586
The mass spectrometry proteomic data have been deposited to the ProteomeXchange Consortium via the PRIDE60 partner repository with the dataset identifier PXD030810.


