

Abstract
Pericardial adipose tissue (PAT), an ectopic adipose depot surrounding the coronary arteries, is a pathogenic risk marker for cardiometabolic disease; however, the association between cardiorespiratory fitness (CRF) and PAT is unclear. Young adults (N=2,614, mean age=25.1 years, 55.8% women, 43.8% Black at baseline 1985–1986) from the CARDIA Study were included. Maximal CRF was estimated at baseline, exam years 7 (1992–1993), and 20 (2005–2006) using a symptom-limited maximal treadmill exercise test (duration in minute) among those achieving ≥ 85% of age-predicted maximal heart rate. PAT volume (mL) was quantified at exam years 15 (2000–2001) and 25 (2010–2011) using computed tomography. Multivariable linear and linear mixed regressions with covariates (sociodemographics, cardiovascular disease risk factors, inflammation, waist circumference) from baseline, year 7, and/or year 20 were used. Separate multivariable regression models revealed inverse associations of CRF at baseline, years 7 or 20 with PAT at year 25 in fully adjusted models (all P < 0.001). The linear mixed model showed that a one-minute increase in treadmill exercise test duration over 20 years was associated with 1.49 mL lower subsequent PAT volume (P < 0.001). In conclusion, findings suggest that higher CRF is inversely associated with subsequent PAT volume. Strategies to optimize CRF may be preventive against excessive PAT accumulation with age.
Keywords: Cardiorespiratory fitness, Pericardial adipose tissue, Cardiovascular health
Pericardial adipose tissue (PAT) is a strong pathogenic risk marker for atherosclerosis1 coronary artery calcification,1 and adverse health outcomes, such as cardiovascular disease (CVD),2 coronary artery disease,3 and type 2 diabetes,4 independent of obesity. Cardiorespiratory fitness (CRF) is a well-established, potentially modifiable factor that is protective not only against CVD risk factors but also visceral adipose tissue.5 However, only a few studies6,7 have examined the associations between CRF and PAT, and these studies were limited through use of cross-sectional data, suboptimal assessment of PAT (i.e., 2-dimensional echocardiography), and small and unrepresentative study samples (e.g., overweight males or hypertensive individuals). Therefore, the overarching goal of this study is to examine the longitudinal associations between CRF and PAT in young to middle-aged adults within a life-course epidemiological framework. We hypothesized that 1) higher CRF at each exam year is associated with lower PAT; and 2) repeated measures of CRF, derived from a maximal GXT are inversely associated with repeated measures of PAT. In addition, we further hypothesized that these associations would vary by sex, age, or race.
Methods
The Coronary Artery Risk Development in Young Adults (CARDIA) study is a population-based, multicenter, longitudinal study aiming to investigate the development of cardiovascular risk and events over time.8 At baseline (1985–1986), a total of 5,114 healthy Black and White men and women, aged 18 to 30 years balanced on sex, race, age, and education were enrolled from one of the 4 field centers: Birmingham, AL; Minneapolis, MN; Chicago, IL; and Oakland, CA. All participants provided written informed consent at each examination, and the study protocols were approved by each Institutional Review Board at the field centers.
In the first set of analyses, 3 separate multivariable linear regression models were repeated: 1) CRF at year 0 with PAT at year 25 (N = 2,614); 2) CRF at year 7 with PAT at year 25 (N =1,602); and 3) CRF at year 20 with PAT at year 25 (N = 1,811). Participants who did not complete a GXT or did not achieve maximal effort (at years 0, 7, or 20), were missing PAT at year 25, and/or missing potential confounders of interest (at years 0, 7, or 20) were excluded. In the second set of analyses, we excluded participants who did not complete a GXT at year 0 or did not achieve maximal effort (N=800), were missing PAT at year 25 (N=1,558), and/or potential confounders of interest from year 0 (N = 142). Therefore, a total of 2,614 participants were analyzed to examine the associations of repeated measures of estimated maximal CRF at years 0, 7, and 20 with repeated measures of PAT at years 15 and 25. Detailed information on the selection of the analytic sample for models is shown in Figure 1. The characteristics of the included and excluded participants at baseline are shown in Supplemental Table A.
Figure 1. Flow diagram of analytical study participant selection, the CARDIA study, 1985–2011.
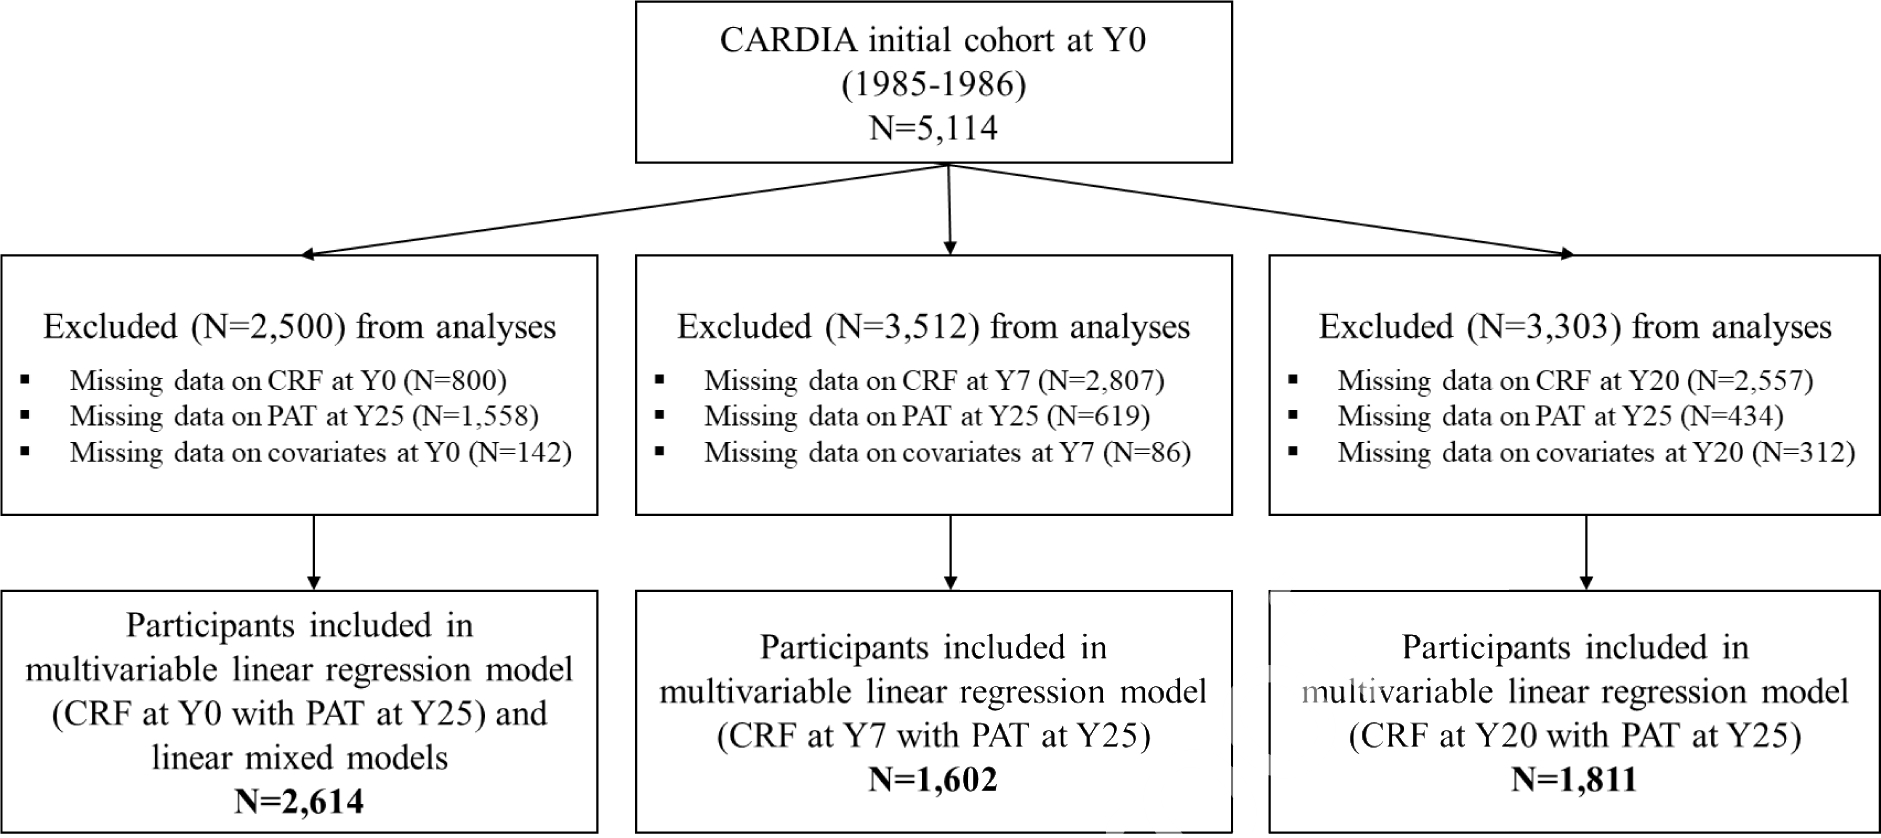
Note: Numbers of study participant who attended exam years 7 and 20 were 4,084 and 3,548, respectively.
Abbreviations: CRF, cardiorespiratory fitness; PAT, pericardial adipose tissue.
At all timepoints, maximal CRF was estimated by a symptom-limited GXT using a modified Balke protocol;9 total duration (seconds; converted to minutes for analyses) of the test was the summary estimate. The testing protocol consisted of the following components: screening for medical eligibility; preparation for electrocardiogram; resting (supine) 12-lead electrocardiogram; pre-exercise (standing) 3-lead electrocardiogram and blood pressure; exercise on the treadmill; recovery following exercise; and participant discharge. The exercise component consisted of a total of 9 stages (2 minutes/stage) for up to 18 minutes, Each stage, the speed and/or grade of the treadmill progressively increased to a maximum (last stage) speed of 5.6 miles/hour and a 25% incline.9 GXT data were considered valid if participants achieved ≥ 85% of their age-predicted maximum heart rate determined using the Tanaka formula [208 – (0.7 × age)].10 At years 0, 7, and 20, 81%, 93%, and 79% of participants achieved 85% of age-predicted maximum heart rate, respectively.
The volume of PAT (mL) was measured using CT scan imaging at years 15 and 25 as previously described.4 The validated structured reading protocol described in the National Heart, Lung, and Blood Institute’s Multi-Ethnic Study of Atherosclerosis was applied.3 Slices 15 mm above and 30 mm below the superior extent of the left main coronary artery were selected using an image processing workstation (OsiriX, Pixmeo, Geneva, Switzerland). The analysts manually segmented the images and then applied a threshold of −190 to −30 Hounsfield units to isolate adipose tissue. Reader reproducibility was calculated in 156 randomly selected re-reads (intra-reader: 49 pairs; inter-reader: 107 pairs). Intra-reader variability was 2.0% and inter-reader variability was 4.2%.4
Sociodemographic characteristics, including sex, age (years), race (Black, White), education (years), employment status (full time; yes/no), as well as alcohol consumption (mL/day; yes/no for analyses), antihypertensive and blood lipid lowering medications use (yes/no) were assessed using a standard questionnaire. Smoking status (never, former, current) was measured using a tobacco use questionnaire which was validated by a previous CARDIA study.11 Body mass index was calculated as measured weight in kilograms divided by height in meters squared. Waist circumference (cm) was measured to the nearest 0.5 cm in duplicate and averaged using anthropometric tape at midway between the iliac crest and the lowest lateral portion of the rib cage. Systolic and diastolic blood pressure was measured 3 times after 5 minutes of rest (one-minute rest between the last 2 readings) using a Hawksley random-zero sphygmomanometer (Hawksley, Lancing, United Kingdom),8 with the first and fifth phase Korotkoff sounds recorded and the second and third measurements averaged. MVPA was assessed using the interviewer-administered CARDIA Physical Activity History Questionnaire. MVPA score was calculated based on frequency, intensity score, and a weighting factor to indicate the duration of each activity, and indicated in Exercise Units (EU), as previously described.12 Diet quality was measured using the Diet Quality Index.13 Diet quality scores were ranged from 0 to 100, with low values reflecting a poor diet and high values reflecting a healthy diet.
Diabetes status (yes/no) was defined as diabetic medication use, 2-h postload glucose ≥ 200 mg/dL, fasting glucose ≥ 126 mg/dL, or HbA1c ≥ 6.5%, as previously described in CARDIA.14 The blood and spun serum (drawn from an arm vein) were aliquoted and shipped to separate laboratories for lipid and lipoprotein measurements. Fasting blood samples were processed at central laboratories (Molecular Epidemiology and Biomarker Research Laboratory, University of Minnesota, Minneapolis, MN, and Northwest Lipid Research Center, Seattle, WA) for measurement of cholesterol, glucose, and triglycerides. Glucose was assayed using the Roche Modular P hexokinase method (Roche, Basel, Switzerland). Plasma concentrations of total cholesterol, high-density lipoprotein cholesterol (HDL-C), and triglycerides were determined enzymatically using a Hitachi 917 analyzer. Inflammatory biomarkers including interleukin-6 (IL-6) and c-reactive protein (CRP) were included. Serum CRP was measured using a high sensitivity new enzyme-linked immunosorbent assay method. IL-6 was measured by ultra-sensitive ELISA (R&D Systems, Minneapolis, MN).
Descriptive statistics were used to calculate the characteristics of participants at the exam years 0, 7, and 20. Normality was examined using graphical and statistical methods. To test the first set of analyses, separate multivariable linear regression models were constructed to examine the independent associations of CRF at year 0, 7, or 20 with PAT at year 25. Coefficient of determination (R2) was calculated to compare different models and model accuracy in predicting subsequent PAT. Multicollinearity was examined in all models. Covariates from the concurrent exam year with CRF (i.e., year 0, 7, or 20) were included in stages in the following order: Model 1 included sex, age, race, field center, education, and employment status; Model 2 included Model 1, plus CVD risk factors including medication use (antihypertensive and/or blood lipid lowering), smoking status, alcohol consumption, systolic and diastolic pressure, triglyceride, total cholesterol, HDL-C (or non HDL-C; total cholesterol – HDL-C), diabetes status, diet quality score, and MVPA; Model 3 included Model 2, plus inflammatory biomarkers including CRP and/or IL-6; and Model 4 included Model 3, plus waist circumference (a proxy for visceral adiposity) to test if associations exist independent of visceral adiposity. We adjusted for clinically relevant covariates a priori based on knowledge from previous studies that may influence the relation between CRF and PAT.6,7
To test the second set of analyses, linear mixed models (PROC MIXED in SAS version 9.4) were used to examine the associations of repeated measures of CRF at years 0, 7, and 20 with repeated measures of PAT at years 15 and 25. All listed covariates from years 0, 7, 15, and/or 20 explained above for the first set of analyses were included and treated as time-varying variables. Age at baseline, sex, race, and field center at baseline (year 0) were treated as fixed given that those variables were constant over time. Education level at year 20 was also treated as fixed because most participants obtained their highest academic degree by year 20. To minimize selection bias and maximize sample size for whom we had adequate data for analysis, we excluded missing data on all exposure variables and covariates at baseline, and PAT at year 25 only. The goodness of fit was examined using Akaike’s and Bayesian information criteria.15 We estimated a random intercept, with compound symmetry covariance structure within person.15 A repeated statement (exam year) was included with a heterogeneous autoregressive covariance structure to specify the within-subject error covariance and to account for correlations between repeated measures at baseline and following exam years.15
Skewed variables, such as triglycerides, CRP, and IL-6 were log-transformed. We analyzed our data using both original and log-transformed PAT because of a slight skewness of PAT. The findings were not materially different; therefore, we present the findings from the original data to facilitate interpretation. Data on blood lipid lowering medication use at year 0 and inflammatory markers at years 0 (both CRP and IL-6) and 7 (IL-6) were not available (not collected). In addition, results with the inclusion of HDL-C vs. non-HDL-C were identical; therefore, we present results with the inclusion of HDL-C only. Lastly, we examined interactions of sex (female/male), age (median split; 25 ≥/25 < years at baseline), and race (Black/White) with CRF using multiplicative terms. SAS (version 9.4; SAS Institute) was used for all statistical analyses. A 2-sided P value < 0.05 was considered statistically significant.
Results
The characteristics of included participants in analyses at years 0, 7, and 20 are presented in Table 1. Overall, participants were healthy and normal weight adults based on the cardiometabolic indicators (e.g., body mass index, waist circumference, biochemical measures, or diabetes status). In addition, the cardiometabolic indicators were gradually, unfavorably changed, and maximal CRF decreased over time. As anticipated, average maximal CRF declined with increasing age, and overall, PAT volumes increased from years 15 to 25.
Table 1.
Characteristics of study participants at exam years 0, 7, and 20, the CARDIA Study, 1985–2011
| Participant Characteristics | Year 0 (N=2,614) | Year 7 (N=1,602) | Year 20 (N=1,811) |
|---|---|---|---|
|
| |||
| Women, | 1,459 (55.8%) | 884 (55.2%) | 1,028 (56.8%) |
| Black, | 1,144 (43.8%) | 711 (44.4%) | 742 (41.0%) |
| Age (years) | 25.1±3.6 | 32.0±3.6 | 45.2±3.6 |
| Education (years) | 14.2±2.2 | 15.1±2.5 | 15.3±2.5 |
| Full time occupation | 1,624 (62.1%) | 1,232 (76.9%) | 1,326 (73.2%) |
| Smoker | |||
| Never | 1,630 (62.4%) | 1,046 (65.3%) | 1,195 (66.0%) |
| Former | 378 (14.5%) | 257 (16.0%) | 366 (20.2%) |
| Current | 606 (23.2%) | 299 (18.7%) | 250 (13.8%) |
| Alcohol consumption (mL/day) | 4.8 (14.5) | 2.4 (13.0) | 2.4 (14.5) |
| Alcohol consumption | 1,599 (61.2%) | 888 (55.4%) | 1,008 (55.7%) |
| Waist circumference (cm) | 77.4±10.7 | 82.8±12.9 | 90.1±13.9 |
| aBody mass index (kg/m2) | 24.4±4.6 | 26.4±5.4 | 28.8±6.6 |
| Systolic blood pressure (mm Hg) | 109.9±10.5 | 106.7±11.0 | 115.1±13.9 |
| Diastolic blood pressure (mm Hg) | 68.7±9.1 | 68.3±9.1 | 72.0±10.8 |
| Total cholesterol (mg/dL) | 177.7±33.2 | 178.3±32.6 | 187.4±34.1 |
| HDL-C (mg/dL) | 53.4±12.8 | 52.3±13.1 | 54.8±17.0 |
| Non HDL-C (mg/dL) | 124.3±33.8 | 126.1±34.5 | 132.5±35.6 |
| Diabetes mellitus | 13 (0.5%) | 14 (0.9%) | 141 (7.8%) |
| Triglyceride (mg/dL) | 61.0 (37.0) | 64.0 (49.0) | 86.0 (67.0) |
| Diet quality score | 64.0±13.0 | 63.1±12.8 | 63.2±12.9 |
| Inflammatory markers | |||
| CRP (mg/L) | N/A | 1.0 (2.2) | 1.1 (2.2) |
| IL-6 (pg/mL) | N/A | N/A | 1.6 (1.8) |
| Self-report MVPA (EU) | 424.3±295.3 | 341.3±275.9 | 361.8±285.8 |
| GXT duration (min) | 10.2±2.7 | 9.4±2.8 | 7.1±2.7 |
| bPAT at year 15 (mL) | 38.7 (28.9) | 38.5 (28.1) | 38.1 (28.1) |
| PAT at year 25 (mL) | 49.0 (37.5) | 48.7 (37.2) | 47.6 (36.5) |
Note: Data are mean ± standard deviation or median (interquartile range) unless otherwise specified.
Subsample (N=2,612 at year 0 and 1,808 at year 20).
Subsample (N=1,958 at year 0, 1,286 at year 7, and 1,444 at year 20).
Abbreviations: HDL-C, high-density lipoprotein-cholesterol; CRP, c-reactive protein; IL-6, interleukin-6; PAT, pericardial adipose tissue; PA, physical activity; EU, exercise unit; MVPA, moderate-to-vigorous intensity physical activity; GXT, graded exercise test.
In multivariable adjusted linear regression models, there were inverse associations of GXT duration at years 0, 7, or 20 with PAT at year 25 in all fully adjusted models (Table 2). In addition, we observed that the proportion of the variance explained (R2) gradually increased over exam years. In separate multivariable regression models, sex and race modified the associations of CRF at years 0, 7, and 20 with PAT at year 25 (all p < 0.05). Stratified analyses (Supplemental Table 2) showed that CRF at year 0 was inversely associated with PAT in both sexes and both races, and the associations of CRF at years 7 and 20 with PAT were significant in both sexes and Whites only (all p < 0.05).
Table 2.
Associations of cardiorespiratory fitness from year 0, 7, or 20 with pericardial adipose tissue at year 25, the CARDIA Study
| PAT (mL) | GXT duration (min) at year 7 (N=2,614) |
Interaction with GXT duration |
|||||
| β | SE | p-value | R 2 | sex | age | race | |
|
| |||||||
| Model 1 | −4.83 | 0.30 | <0.001 | 0.25 | <0.001 | <0.001 | <0.001 |
| Model 2 | −4.30 | 0.34 | <0.001 | 0.27 | <0.001 | 0.055 | <0.001 |
| Model 3 | −2.24 | 0.36 | <0.001 | 0.32 | <0.001 | 0.943 | <0.001 |
|
| |||||||
| PAT (mL) | GXT duration (min) at year 7 (N=1,602) |
Interaction with GXT duration |
|||||
| β | SE | p-value | R 2 | sex | age | race | |
|
| |||||||
| Model 1 | −5.32 | 0.35 | <0.001 | 0.28 | <0.001 | <0.001 | <0.001 |
| Model 2 | −4.54 | 0.40 | <0.001 | 0.30 | <0.001 | 0.005 | <0.001 |
| Model 3 | −4.02 | 0.41 | <0.001 | 0.31 | <0.001 | 0.005 | <0.001 |
| Model 4 | −2.03 | 0.43 | <0.001 | 0.37 | 0.001 | 0.930 | <0.001 |
|
| |||||||
| PAT (mL) | GXT duration (min) at year 7 (N=1,811) |
Interaction with GXT duration |
|||||
| β | SE | p-value | R 2 | sex | age | race | |
|
| |||||||
| Model 1 | −6.58 | 0.31 | <0.001 | 0.35 | <0.001 | <0.001 | <0.001 |
| Model 2 | −4.89 | 0.36 | <0.001 | 0.40 | <0.001 | <0.001 | <0.001 |
| Model 3 | −4.35 | 0.38 | <0.001 | 0.41 | <0.001 | 0.001 | <0.001 |
| Model 4 | −1.75 | 0.38 | <0.001 | 0.49 | 0.031 | 0.965 | <0.001 |
Note: β, beta coefficient of multivariable linear regression models. β can be interpreted as difference in PAT (mL) per increase in GXT duration of 1-min.
Model 1 adjusts for sociodemographic factors (sex, age, race, and field center, employment status, and education level).
Model 2 adjusts for Model 1, plus medication use (antihypertensive and/or blood lipids lowering), CVD risk factors (smoking status, diabetes status, alcohol consumption, systolic and diastolic BP, triglyceride, total cholesterol, HDL-C, diet quality score) and moderate-to-vigorous intensity physical activity.
Model 3 adjusts for Model 2, plus inflammatory markers (CRP and/or IL-6).
Model 4 adjusts for Model 3, plus waist circumference.
Inflammatory markers were not available at baseline; therefore, Model 3 at year 0 includes sociodemographic factors, medication use, CVD risk factors, and waist circumference.
Abbreviations: PAT, pericardial adipose tissue; GXT, graded exercise test; SE, standard error; CVD, cardiovascular disease; BP, blood pressure; HDL-C, high-density lipoprotein-cholesterol; CRP, c-reactive protein; IL-6, interleukin-6.
In linear mixed models (Table 3), repeated measures of GXT duration at years 0, 7, and 20 were inversely associated with repeated measures of PAT at years 15 and 25 in all Models (all p < 0.001). In linear mixed models, age and race interactions were found (all p < 0.05). In stratified analyses, the longitudinal associations were significant in both age groups and Whites only (all p < 0.05; Supplemental Table 3).
Table 3.
Associations of repeated measures of cardiorespiratory fitness at years 0, 7, and 20, with repeated measures of pericardial adipose tissue at years 15 and 25, the CARDIA study
| PAT (mL) | GXT duration (min) |
Interaction with GXT duration |
||||
|---|---|---|---|---|---|---|
| β | SE | P-value | sex | age | race | |
|
| ||||||
| Model 1 | −3.20 | 0.18 | <0.001 | <0.001 | <0.001 | <0.001 |
| Model 2 | −2.46 | 0.20 | <0.001 | <0.001 | <0.001 | <0.001 |
| Model 3 | −4.51 | 0.34 | <0.001 | <0.001 | <0.001 | <0.001 |
| Model 4 | −1.49 | 0.34 | <0.001 | 0.102 | <0.001 | <0.001 |
Note: β, beta coefficient of linear mixed regression models. β can be interpreted as difference in PAT (mL) per increase in GXT duration of 1-min. Total participants (N =2,614) at baseline.
Model 1 adjusts for sociodemographic factors at year 0 (sex, age, race, and field center) or 20 (employment status and education level).
Model 2 adjusts for Model 1, plus medication use (antihypertensive and/or blood lipids lowering), CVD risk factors (smoking status, diabetes status, alcohol consumption, systolic and diastolic BP, triglyceride, total cholesterol, HDL-C, diet quality score) and moderate-to-vigorous intensity physical activity.
Model 3 adjusts for Model 2, plus inflammatory markers (CRP and/or IL-6).
Model 4 adjusts for Model 3, plus waist circumference.
All covariates are from years 0, 7, and/or 20 (treated as time-dependent variables unless otherwise specified).
Abbreviations: PAT, pericardial adipose tissue; GXT, graded exercise test; SE, standard error; CVD, cardiovascular disease; BP, blood pressure; HDL-C, high-density lipoprotein-cholesterol; CRP, c-reactive protein; IL-6, interleukin-6.
Discussion
We found that estimated maximal CRF was inversely associated with prospectively measured PAT approximately 5, 18, and 25 years later. In addition, repeated measures of CRF over 20 years were also inversely associated with repeated measures of PAT over 10 years. The observed associations were robust to adjustment for time-varying covariates, indicating that changes in health profiles, such as physical activity and CVD risk factors including lipids (total cholesterol and HDL-C or non HDL-C), diabetes status, inflammatory markers, and waist circumference over time are likely not important confounders in the longitudinal association of CRF with PAT.
In line with our findings, 2 cross-sectional studies6,7 reported that poor CRF measured using either cycle ergometer or treadmill was associated with high epicardial adipose tissue thickness. However, unlike our study, Kim et al.6 adjusted for body weight and Sengul et al.7 did not adjust for any of the other adiposity indicators in the cross-sectional associations of CRF with epicardial adipose tissue. Adding to the literature, we observed associations between repeated measures of CRF and repeated measures of PAT, irrespective of relevant confounders, including waist circumference. Waist circumference is a proxy measure of abdominal visceral adiposity, and PAT rather than waist circumference is more strongly associated with CRF given that PAT is anatomically proximate to cardiac muscle16 and both PAT and CRF are involved in coronary circulation systems.16 While associations of CRF and PAT remained statistically significant after adjustment for waist circumference, the magnitude of associations of CRF with PAT was noticeably reduced after accounting for waist circumference, suggesting that waist circumference could be a mediating mechanism between CRF and PAT, although it does not fully explain the association. Our results could be understood on the basis of the strong evidence regarding relations between CRF and other health outcomes, independent of overall adiposity. For example, Katzmarzyk et al.18 reported that low CRF was associated with a high risk of all-cause and cardiovascular mortality in men, independent of body mass index. Furthermore, LaMonte et al.19 demonstrated that low CRF was associated with a greater incidence of metabolic syndrome in men and women, irrespective of age and body mass index. Taken together, our study suggests an important clinical implication that CRF might be an independent marker of excessive PAT accumulation independent of well-known determinants of CRF, such as age,20 sex,21 smoking,22 education status,23 alcohol consumption,24 and obesity.25
In clinical studies, echocardiography (ultrasound), magnetic resonance imaging, and cardiac CT scans have been used to measure PAT,16 and PAT is a clinical marker to predict CVD.16 Furthermore, PAT can contribute to coronary artery calcification and atherosclerosis, both well-established markers of CVD risk assessment.3 PAT, rather than abdominal fat and/or body mass index, is highly associated with coronary artery calcification,26 and both PAT and coronary artery calcification are well-established risk factors for coronary heart disease.3 Therefore, the association of CRF not only with PAT but also with coronary artery calcification should be further examined as CVD prevention strategies.
Both CRF5 (inversely) and PAT2,4 (positively) are associated with adverse metabolic profiles including high total cholesterol and/or low HDL-C and greater prevalence of diabetes. Furthermore, previous reports27 have shown inverse associations of CRF with inflammatory markers, including CRP and IL-6, independent of body mass index, and PAT is known as an endocrine organ producing various inflammatory cytokines in the coronary circulation.28 Notably, additional adjustment for lipids, diabetes status, and inflammatory markers did not attenuate associations of CRF with PAT, suggesting that lipids, diabetes, and inflammatory markers are likely not confounders between CRF and PAT.
Although there are established lifestyle-induced or inherent biological differences in CRF and visceral adiposity across sex, age, and/or race,29 our findings suggest that sex, age, and/or race somewhat moderate the magnitude of associations but do not modify the longitudinal association between CRF and PAT. We also observed that CRF was longitudinally associated with PAT in Whites only and this might be due to known differences in visceral adipose distribution and/or consistently larger sample size over time in Whites vs. Blacks. On the other hand, differences in associations between CRF and PAT by sex and age groups were less explicit possibly because men have more PAT than women while women have poorer CRF than men, and both ‘younger’ and ‘older’ groups in our study were young adults between 18 and 34 years, suggesting that CRF may be associated with PAT across this age continuum. 29
Strengths of our study include the large sample size, repeated measures of research variables, thorough examinations of many potential confounding factors, and a criterion measure of PAT. However, we acknowledge that our study has several limitations. First, our results were limited to CARDIA participants who completed the GXT and achieved maximal effort, and it is known that this population (vs. non-participation in GXT) in CARDIA are at less risk of adverse health outcomes and premature mortality.30 However, as shown in Supplemental Table A, PAT at years 15 and 25 were not statistically different between included vs. excluded participants. Second, this study cannot determine causality between research variables due to the nature of observational study designs. Third, repeated observations of exposure and outcome variables were not concurrently measured. Concurrent measures of CRF and PAT in multiple points over an extended period of time will help to better understand the longitudinal associations of CRF and PAT. Lastly, the years 0, 7, and 20 CARDIA GXT protocol did not include gas analysis necessary for the direct measurement of maximal CRF via maximum oxygen uptake.
We identified longitudinal associations between CRF and prospectively measured PAT in early to middle adulthood. Those associations were independent of sociodemographics, CVD risk factors, inflammatory markers, and waist circumference. Our study provides new insight into how CRF is independently related to PAT over time. Maintaining high levels of CRF may be a preventive strategy against excessive PAT accumulation with age. PAT is an emerging CVD risk factor, and this study could help to inform the importance of CRF as a modifiable health strategy for the emerging pathology.
Supplementary Material
Acknowledgements:
The authors thank the other investigators, the staff, and the participants of the CARDIA study for their valuable contributions. The article contents have not been previously presented elsewhere.
Funding:
The CARDIA is conducted and supported by the National Heart, Lung, and Blood Institute (NHLBI) in collaboration with the University of Alabama at Birmingham (HHSN268201800005I & HHSN268201800007I), Northwestern University (HHSN268201800003I), University of Minnesota (HHSN268201800006I), and Kaiser Foundation Research Institute (HHSN268201800004I). Additional support for this work was provided by the CARDIA Fitness Study (R01 HL078972). This manuscript has been reviewed by CARDIA for scientific content. In addition, this work was supported by the PhD Dissertation Writing Fellowship, The College of Liberal Arts & Sciences, University of Iowa.
Footnotes
Declaration of interests
The authors declare that they have no known competing financial interests or personal relationships that could have appeared to influence the work reported in this paper.
Publisher's Disclaimer: This is a PDF file of an unedited manuscript that has been accepted for publication. As a service to our customers we are providing this early version of the manuscript. The manuscript will undergo copyediting, typesetting, and review of the resulting proof before it is published in its final form. Please note that during the production process errors may be discovered which could affect the content, and all legal disclaimers that apply to the journal pertain.
References
- 1.Gorter PM, de Vos AM, van der Graaf Y, Stella PR, Doevendans PA, Meijs MFL, Prokop M, Visseren FLJ. Relation of epicardial and pericoronary fat to coronary atherosclerosis and coronary artery calcium in patients undergoing coronary angiography. Am J Cardiol 2008;102(4):380–385. [DOI] [PubMed] [Google Scholar]
- 2.Mahabadi AA, Massaro JM, Rosito GA, Levy D, Murabito JM, Wolf PA, O’Donnell CJ, Fox CS, Hoffman U. Association of pericardial fat, intrathoracic fat, and visceral abdominal fat with cardiovascular disease burden: the Framingham Heart Study. Eur Heart J 2009;30(7):850–856. [DOI] [PMC free article] [PubMed] [Google Scholar]
- 3.Ding J, Hsu F-C, Harris TB, Liu Y, Kritchevsky SB, Szklo M, Ouyang P, Espeland MA, Lohman KK, Criqui MH, Matthew Allison, Bluemke DA, Carr JJ. The association of pericardial fat with incident coronary heart disease: the Multi-Ethnic Study of Atherosclerosis (MESA). Am J Clin Nutr 2009;90(3):499–504. [DOI] [PMC free article] [PubMed] [Google Scholar]
- 4.Alman A, Jacobs DR Jr, Lewis C, Snell-Bergeon JK, Carnethon MR, Terry JG, Goff DC Jr, Ding J, Carr JJ. Higher pericardial adiposity is associated with prevalent diabetes: The Coronary Artery Risk Development in Young Adults study. Nutr Metab Cardiovasc Dis 2016;26(4):326–332. [DOI] [PMC free article] [PubMed] [Google Scholar]
- 5.Carnethon MR, Gidding SS, Nehgme R, Sidney S, Jacobs DR Jr, Liu K. Cardiorespiratory fitness in young adulthood and the development of cardiovascular disease risk factors. JAMA 2003;290(23):3092–3100. [DOI] [PubMed] [Google Scholar]
- 6.Kim M-K, Tanaka K, Kim M-J, Matsuo T, Tomita T, Ohkubo H, Maeda S, Ajisaka R. Epicardial fat tissue: relationship with cardiorespiratory fitness in men. Med Sci Sports Exerc 2010;42(3):463–469. [DOI] [PubMed] [Google Scholar]
- 7.Sengul C, Ozveren O, Duman D, Eroglu E, Oduncu V, Tanboga HI, Can MM, Akgun T, Dindar I. Echocardiographic epicardial fat thickness is related to altered blood pressure responses to exercise stress testing. Blood Press 2011;20(5):303–308. [DOI] [PubMed] [Google Scholar]
- 8.Friedman GD, Cutter GR, Donahue RP, Hughes GH, Hulley SB, Jacobs DR, Liu K, Savage PJ. CARDIA: study design, recruitment, and some characteristics of the examined subjects. J Clin Epidemiol 1988;41(11):1105–1116. [DOI] [PubMed] [Google Scholar]
- 9.Sidney S, Haskell WL, Crow R, Sternfeld B, Oberman A, Armstrong MA, Cutter GR, Jacobs DR, Savage PJ, Horn LV. Symptom-limited graded treadmill exercise testing in young adults in the CARDIA study. Med Sci Sports Exerc 1992;24(2):177–183. [PubMed] [Google Scholar]
- 10.Abbara S, Desai JC, Cury RC, Butler J, Nieman K, Reddy V. Mapping epicardial fat with multi-detector computed tomography to facilitate percutaneous transepicardial arrhythmia ablation. Eur J Radiol 2006;57(3):417–422. [DOI] [PubMed] [Google Scholar]
- 11.Wagenknecht LE, Cutter GR, Haley NJ, Sidney S, Manolio TA, Hughes GH, Jacobs DR. Racial differences in serum cotinine levels among smokers in the Coronary Artery Risk Development in (Young) Adults study. Am J Public Health 1990;80(9):1053–1056. [DOI] [PMC free article] [PubMed] [Google Scholar]
- 12.Jacobs DJ, Hahn LP, Haskell WL, Pirie P, Sidney S. Validity and reliability of short physical activity history: CARDIA and the Minnesota Heart Health Program. J Cardiopulm Rehabil 1989;9(11):448. [DOI] [PMC free article] [PubMed] [Google Scholar]
- 13.Zamora D, Gordon-Larsen P, Jacobs DR Jr, Popkin BM. Diet quality and weight gain among black and white young adults: the Coronary Artery Risk Development in Young Adults (CARDIA) Study (1985–2005). Am J Clin Nutr 2010;92(4):784–793. [DOI] [PMC free article] [PubMed] [Google Scholar]
- 14.Gunderson EP, Lewis CE, Lin Y, Sorel M, Gross M, Sidney S, Jacobs DR, Shikany JM, Quesenberry CP. Lactation duration and progression to diabetes in women across the childbearing years: the 30-year CARDIA study. JAMA Intern Med 2018;178(3):328–337. [DOI] [PMC free article] [PubMed] [Google Scholar]
- 15.Singer JD. Using SAS PROC MIXED to fit multilevel models, hierarchical models, and individual growth models. J Edu Behav Stat 1998;23(4):323–355. [Google Scholar]
- 16.Iacobellis G, Bianco AC. Epicardial adipose tissue: emerging physiological, pathophysiological and clinical features. Trends Endocrinol Metab 2011;22(11):450–457. [DOI] [PMC free article] [PubMed] [Google Scholar]
- 17.Colonetti T, Grande AJ, Amaral MC, Colonetti L, Uggioni ML, da Rosa MI, Hernandez AV, Tse G, Liu T, Nerlekar N, Biondi-Zoccai G, Neto MG, Duraes AR, Pontes-Neto O, Resende ES, Roever L. Effect of exercise on epicardial adipose tissue in adults: A systematic review and meta-analyses. Heart Fail Rev 2020:1–13. [DOI] [PubMed] [Google Scholar]
- 18.Katzmarzyk PT, Church TS, Blair SN. Cardiorespiratory fitness attenuates the effects of the metabolic syndrome on all-cause and cardiovascular disease mortality in men. Arch Intern Med 2004;164(10):1092–1097. [DOI] [PubMed] [Google Scholar]
- 19.LaMonte MJ, Barlow CE, Jurca R, Kampert JB, Church TS, Blair SN. Cardiorespiratory fitness is inversely associated with the incidence of metabolic syndrome: a prospective study of men and women. Circulation 2005;112(4):505–512. [DOI] [PubMed] [Google Scholar]
- 20.Schneider J Age dependency of oxygen uptake and related parameters in exercise testing: an expert opinion on reference values suitable for adults. Lung 2013;191(5):449–458. [DOI] [PubMed] [Google Scholar]
- 21.Al-Mallah MH, Juraschek SP, Whelton S, Dardari ZA, Ehrman JK, Michos ED, Blumenthal RS, Nasir K, Qureshi WT, Brawner CA, Keteyian SJ, Blaha MJ. Sex differences in cardiorespiratory fitness and all-cause mortality: the Henry Ford ExercIse Testing (FIT) Project. Mayo Clin Proc 2016;91(6):775–762. [DOI] [PMC free article] [PubMed] [Google Scholar]
- 22.Bernaards CM, Twisk JW, Van Mechelen W, Snel J, Kemper HC. A longitudinal study on smoking in relationship to fitness and heart rate response. Med Sci Sports Exerc 2003. [DOI] [PubMed] [Google Scholar]
- 23.Ombrellaro KJ, Perumal N, Zeiher J, Hoebel J, Ittermann T, Ewert R, Dorr M, Keil T, Mensink GBM, Finger JD. Socioeconomic correlates and determinants of cardiorespiratory fitness in the general adult population: a systematic review and meta-analysis. Sports Med Open 2018;4(1):1–19. [DOI] [PMC free article] [PubMed] [Google Scholar]
- 24.Baumeister SE, Finger JD, Gläser S, Dorr M, Markus MR, Ewert R, Felix SB, Grabe H, Bahls M, Mensink GB, Volzke H, Piontek K, Leitzmann MF. Alcohol consumption and cardiorespiratory fitness in five population-based studies. Eur J Prev Cardiol 2018;25(2):164–172. [DOI] [PubMed] [Google Scholar]
- 25.Fogelholm M, Malmberg J, Suni J, Santtila M, Kyröläinen H, Mäntysaari M. Waist circumference and BMI are independently associated with the variation of cardiorespiratory and neuromuscular fitness in young adult men. Int J Obes (Lond) 2006;30(6):962–969. [DOI] [PubMed] [Google Scholar]
- 26.Miao C, Chen S, Ding J, Liu K, Li D, Macedo R, Lai S, Vogel-Claussen J, Brown ER, Lima JAC, Bluemke DA. The association of pericardial fat with coronary artery plaque index at MR imaging: The Multi-Ethnic Study of Atherosclerosis (MESA). Radiology. 2011;261(1):109–115. [DOI] [PMC free article] [PubMed] [Google Scholar]
- 27.LaMonte MJ, Durstine JL, Yanowitz FG, Lim T, DuBose KD, Davis P, Ainsworth BE. Cardiorespiratory fitness and C-reactive protein among a tri-ethnic sample of women. Circulation 2002;106(4):403–406. [DOI] [PubMed] [Google Scholar]
- 28.Gómez-Ambrosi J, Catalan V, Ramírez B, Rodriguez A, Colina I, Silva C, Rotellar F, Mugueta C, Maria Gil, Cienfuegos JA, Salvaldor J, Fruhbeck G. Plasma osteopontin levels and expression in adipose tissue are increased in obesity. J Clin Endocrinol Metab 2007;92(9):3719–3727. [DOI] [PubMed] [Google Scholar]
- 29.Pandey A, Park BD, Ayers C, Das SR, Lakoski S, Matulevicius S, de Lemos JA, Berry JD. Determinants of racial/ethnic differences in cardiorespiratory fitness (from the Dallas Heart Study). Am J Cardiol 2016;118(4):499–503. [DOI] [PubMed] [Google Scholar]
- 30.Pettee KG, Whitaker K, Duprez D, Sternfeld B, Lewis CE, Sidney S, Knell G, Jacobs DR. Clinical importance of non-participation in a maximal graded exercise test on risk of non-fatal and fatal cardiovascular events and all-cause mortality: CARDIA study. Prev Med 2018;106:137–144. [DOI] [PMC free article] [PubMed] [Google Scholar]
Associated Data
This section collects any data citations, data availability statements, or supplementary materials included in this article.