



Abstract
Objective
Emergency department (ED) evaluations for syncope are common, representing 1.3 million annual US visits and $2 billion in related hospitalizations. Despite evidence supporting risk stratification and outpatient management, variation in syncope hospitalization rates persist. We sought to develop a new quality measure for very low risk ED adult syncope patients that could be applied to administrative data.
Methods
We developed this quality measure in two phases. First, we used an existing prospective, observational ED patient dataset to identify a very low-risk cohort with unexplained syncope using two variables: age<50 years and no history of heart disease. We then applied this to the 2019 Nationwide Emergency Department Sample (NEDS) to assess its potential impact, assessing for hospital-level factors associated with hospitalization variation.
Results
Of the 8,647 adult patients in the prospective cohort, 3,292 patients (38%) fulfilled these two criteria: Age under 50 and no history of heart disease. Of these, 15 (0.46%) suffered a serious adverse event within 30 days. In the NEDS, there were an estimated 566,031 patients meeting these two criteria, of whom 15,507 (2.7%, 95% Confidence interval [CI]: 2.48%, 3.00%)) were hospitalized. We found substantial variation in hospitalizations rates for this very low-risk cohort, with a median rate of 1.7%, (range: 0–100%, interquartile range: 0–3.9%). Factors associated with increased hospitalization rates included yearly ED volume >80,000 (Odds Ratio [OR]: 3.14, 95% CI: 2.02 to 4.89) and metropolitan teaching status (OR: 1.5, 95% CI: 1.24 to 1.81).
Conclusion
In sum, our novel syncope quality measure can assess variation in low-value hospitalizations for unexplained syncope. Application of this measure could improve the value of syncope care.
Introduction
Background
Syncope is a common reason for visit to the Emergency Department (ED) comprising over 1.3 million visits per year in the US.1 The total annual costs of syncope-related hospitalization nationally are estimated to be over $2.4 billion.2 Several risk-stratification tools have been developed to better standardize ED disposition decisions and improve the value of care for ED syncope.3–8 Despite these efforts, there is persistent variation in syncope hospitalizations, with up to one third of patients being admitted to the hospital or observation unit 9,10 with unclear clinical benefit.11–13
Importance
National efforts to reduce variation in hospitalization rates through administrative claims-based quality measurement initiatives have been successful across an array of clinical conditions and patient groups.14,15 In the context of syncope, despite substantial evidence of variation, there is a dearth of quality measures to guide improvement efforts and advance national pay-for-performance programs. Historically, the absence of granular clinical data (e.g. specific symptoms, laboratory results, or ECG findings) necessary to apply validated risk-stratification tools to administrative claims data has precluded the development of easily scaled and implementable quality measures for emergency syncope care.3–5,8
Goals of This Investigation
Our objective was to leverage an existing prospective ED cohort in order to develop a novel syncope quality measure comprised of variables readily available in administrative datasets. The denominator for this quality measure would consist of ED patients with unexplained syncope at very low risk of serious adverse events at 30 days post-ED visit and thus could be safely discharged directly from the ED. Among this very low-risk cohort, we further sought to specify an evidence- and expert-based quality measure to quantify national variation in hospitalization rates for this very low-risk syncope cohort using data from the Nationwide Emergency Department Sample (NEDS). Secondly, we sought to investigate hospital-level factors associated with hospitalization rates for this cohort in an effort to explore the underlying sources of variation. The ultimate goal of this quality measure is to improve the value of syncope care by safely reducing low-value hospitalizations.
Methods
Phase 1: Definition of a Very Low-Risk Quality Measure Cohort
Study design and setting:
We performed a secondary analysis of a large, prospective, observational dataset of ED patients with unexplained syncope. These data were collected across 11 urban, academic, hospital-based EDs in Canada over a 9-year period (September 2010 to July 2019) spanning two successive cohorts: the derivation and subsequent validation cohorts of the Canadian Syncope Risk Score studies.3,16 This dataset was used to define a very low-risk cohort using administratively available variables. The ethics review committee at each institution approved this study.
Selection of Participants:
Adult patients (≥ 18 years) who presented to the ED within 24 hours of experiencing syncope were included. Patients with presyncope were not included. Exclusion criteria were as follows: significant language barrier, cognitive impairment, drug or alcohol intoxication, loss of consciousness for greater than 5 minutes, change in mental status from baseline, witnessed seizure, major trauma necessitating hospitalization, or head trauma leading to loss of consciousness. Patients with a new serious diagnosis discovered during the ED visit were also excluded, e.g., cardiac arrhythmia, myocardial infarction, pulmonary embolism (See Appendix 1 for complete list and frequency).
Measurements and Outcomes:
Demographic, clinical, and EKG variables were collected at the time of enrollment. The primary outcome was occurrence of a serious adverse event identified in the 30-day period after ED disposition (admit or discharge). Serious adverse events included death from any cause, serious cardiac arrhythmias, myocardial infarction, structural heart disease, aortic dissection, pulmonary embolism, pulmonary hypertension, subarachnoid hemorrhage, severe hemorrhage, or any other serious condition associated with syncope. Further methodological detail has been published previously.16
Analysis:
We considered the variables previously identified in the primary analysis3 to be significantly associated with 30-day serious adverse events (i.e., Canadian Syncope Risk Score predictors) and age to define the very low-risk cohort. These predictors included past medical history of heart disease, systolic blood pressure, EKG parameters, troponin level, and overall diagnostic impression. Among 43 available variables, 11 of which are used in the Canadian Syncope Risk Score, we identified two known to be commonly available in administrative datasets and suitable for quality measure cohort definition (age, history of heart disease). We sought to combine these variables to create a very low-risk cohort that would minimize the rate of serious outcomes at 30 days post-ED visit while maximizing the number of patients included. This combination of variables then underwent expert review with the American College of Emergency Physicians (ACEP) Quality & Patient Safety Committee and the Clinical Emergency Data Registry Committee in 2021.
Phase 2: Estimating National Variation in Hospitalization Rates in the Quality Measure Cohort
Study design and setting:
We performed a retrospective analysis of adult ED visits for syncope using the National Emergency Department Sample (NEDS) database. The NEDS database is stratified sample of all ED visits to non-federal hospitals in the United States, drawn from 989 hospitals in 41 states.17 We analyzed data from 2019, which contains unweighted data from 33.1 million ED visits representing a weighted sample of 143 million ED visits nationwide that year.
Selection of Participants:
The NEDS lists up to 35 unique ICD-10 diagnosis codes for each ED visit. We classified a visit as being for syncope if the International Classification of Diseases, Tenth Revision, Clinical Modification (ICD-10-CM) code R55 “Syncope and collapse” was listed in any diagnosis fields. We excluded patients who died in the ED or who had any of the exclusion criteria from the Canadian Syncope Risk Score study, such as seizure, major trauma, altered mental status (see above “Selection of Participants” for complete list). We then excluded all patients with a new serious ED diagnosis using ICD-10-CM codes based on criteria from our expert-based exclusion criteria and ACEP Quality & Patient Safety Committee review. Examples of new serious ED diagnoses include cardiac arrhythmia, myocardial infarction, gastrointestinal bleeding, and pulmonary embolism. We then performed an initial frequency analysis and manual review of the remaining associated diagnosis codes to identify any significant diagnoses potentially requiring hospitalization (Appendix 2). Two authors (MP, AJ) independently reviewed all accompanying ICD-10 diagnosis codes potentially appropriate for hospitalization and considered meaningful to the face validity of the quality measure for all diagnosis codes occurring with greater than 0.01% frequency. Disagreements were resolved by consulting a third author (AV). Examples of such diagnoses included dehydration, hypotension, and hyperkalemia. After excluding these cases, the remaining cohort had unexplained syncope without significant associated diagnoses requiring hospitalization. Finally, we used the combination of variables identified in Part 1 above to define a very low-risk cohort based on age and past medical history. This remaining cohort constituted our final study sample and the denominator for our syncope quality measure.
Variation in Quality Measure Score across Emergency Departments and Hospital Types:
Outcomes:
Our primary outcome was hospitalization rate among very low-risk ED patients with unexplained syncope, as defined in Phase 1. Hospitalization was defined as an ED disposition of admission to the same hospital, transfer to another acute care hospital, or, where available, placement in observation status. We collected demographic data on all patients in the final study sample and collected data on hospital characteristics, e.g., ownership status (government, private institution, etc.), urban-rural designation, teaching status, and annual ED visit volume.
Analysis:
After applying exclusion criteria to remove all patients with a new serious ED diagnoses or significant diagnosis potentially requiring hospitalization, survey weights were used to yield nationally representative estimates for the total number of very low-risk syncope visits, as well as the total that were hospitalized in the 2019 NEDS dataset. We used logistic regression clustered at the hospital-based ED level to evaluate the association between likelihood of admission and hospital factors including ownership status, urban-rural designation, teaching status, and annual ED visit volume. Hospital characteristics entered the model as unordered categorical variables, and we report the pseudo-R2. This analysis was performed to assess how the new quality measure might perform in different types of hospital-based EDs. Analyses were performed in R (4.0.2)18 with complex survey design estimates generated with the survey package19. All analytic code for reproducing results is available online (Appendix 3).
Results
Phase 1: Very Low-Risk Syncope Quality Measure Cohort
The prospective, observational cohort from Canada contained 9,006 ED patients with syncope. After exclusion of 359 patients with a new serious ED diagnosis, 8,647 ED patients with unexplained syncope remained. We applied different age thresholds and absence of heart disease to identify the combination which resulted in the lowest rate of serious adverse events at 30 days while including a large cohort of patients. This final combination was composed of two simple variables: age under 50 years and no history of heart disease. In our two-variable logistic regression model, age under 50 years was negatively associated with experiencing an adverse event at 30 days (Odds Ratio [OR]: 0.15, 95% Confidence Interval [CI]: 0.1–0.24), as was no past history of heart disease (OR: 0.26, 95%CI: 0.2–0.33). A total of 5,355 patients were excluded for having age ≥ 50 years or a history of heart disease, leaving 3,292 patients comprising our very low-risk cohort (See Flow Diagram in Figure 1). Characteristics of the very low-risk cohort are presented in Table 1. The rate of serious adverse events at 30 days for this quality measure cohort was 15/3,292 (0.46%). The 15 serious adverse events in this very low-risk cohort consisted of 1 death secondary to sepsis, 3 ventricular arrhythmias, and 11 non-arrhythmic conditions (See Table 2). Admission rates for this very low-risk cohort of syncope patients in the Canadian Syncope Risk Score derivation and validation studies are presented in Appendix 4.
Figure 1:
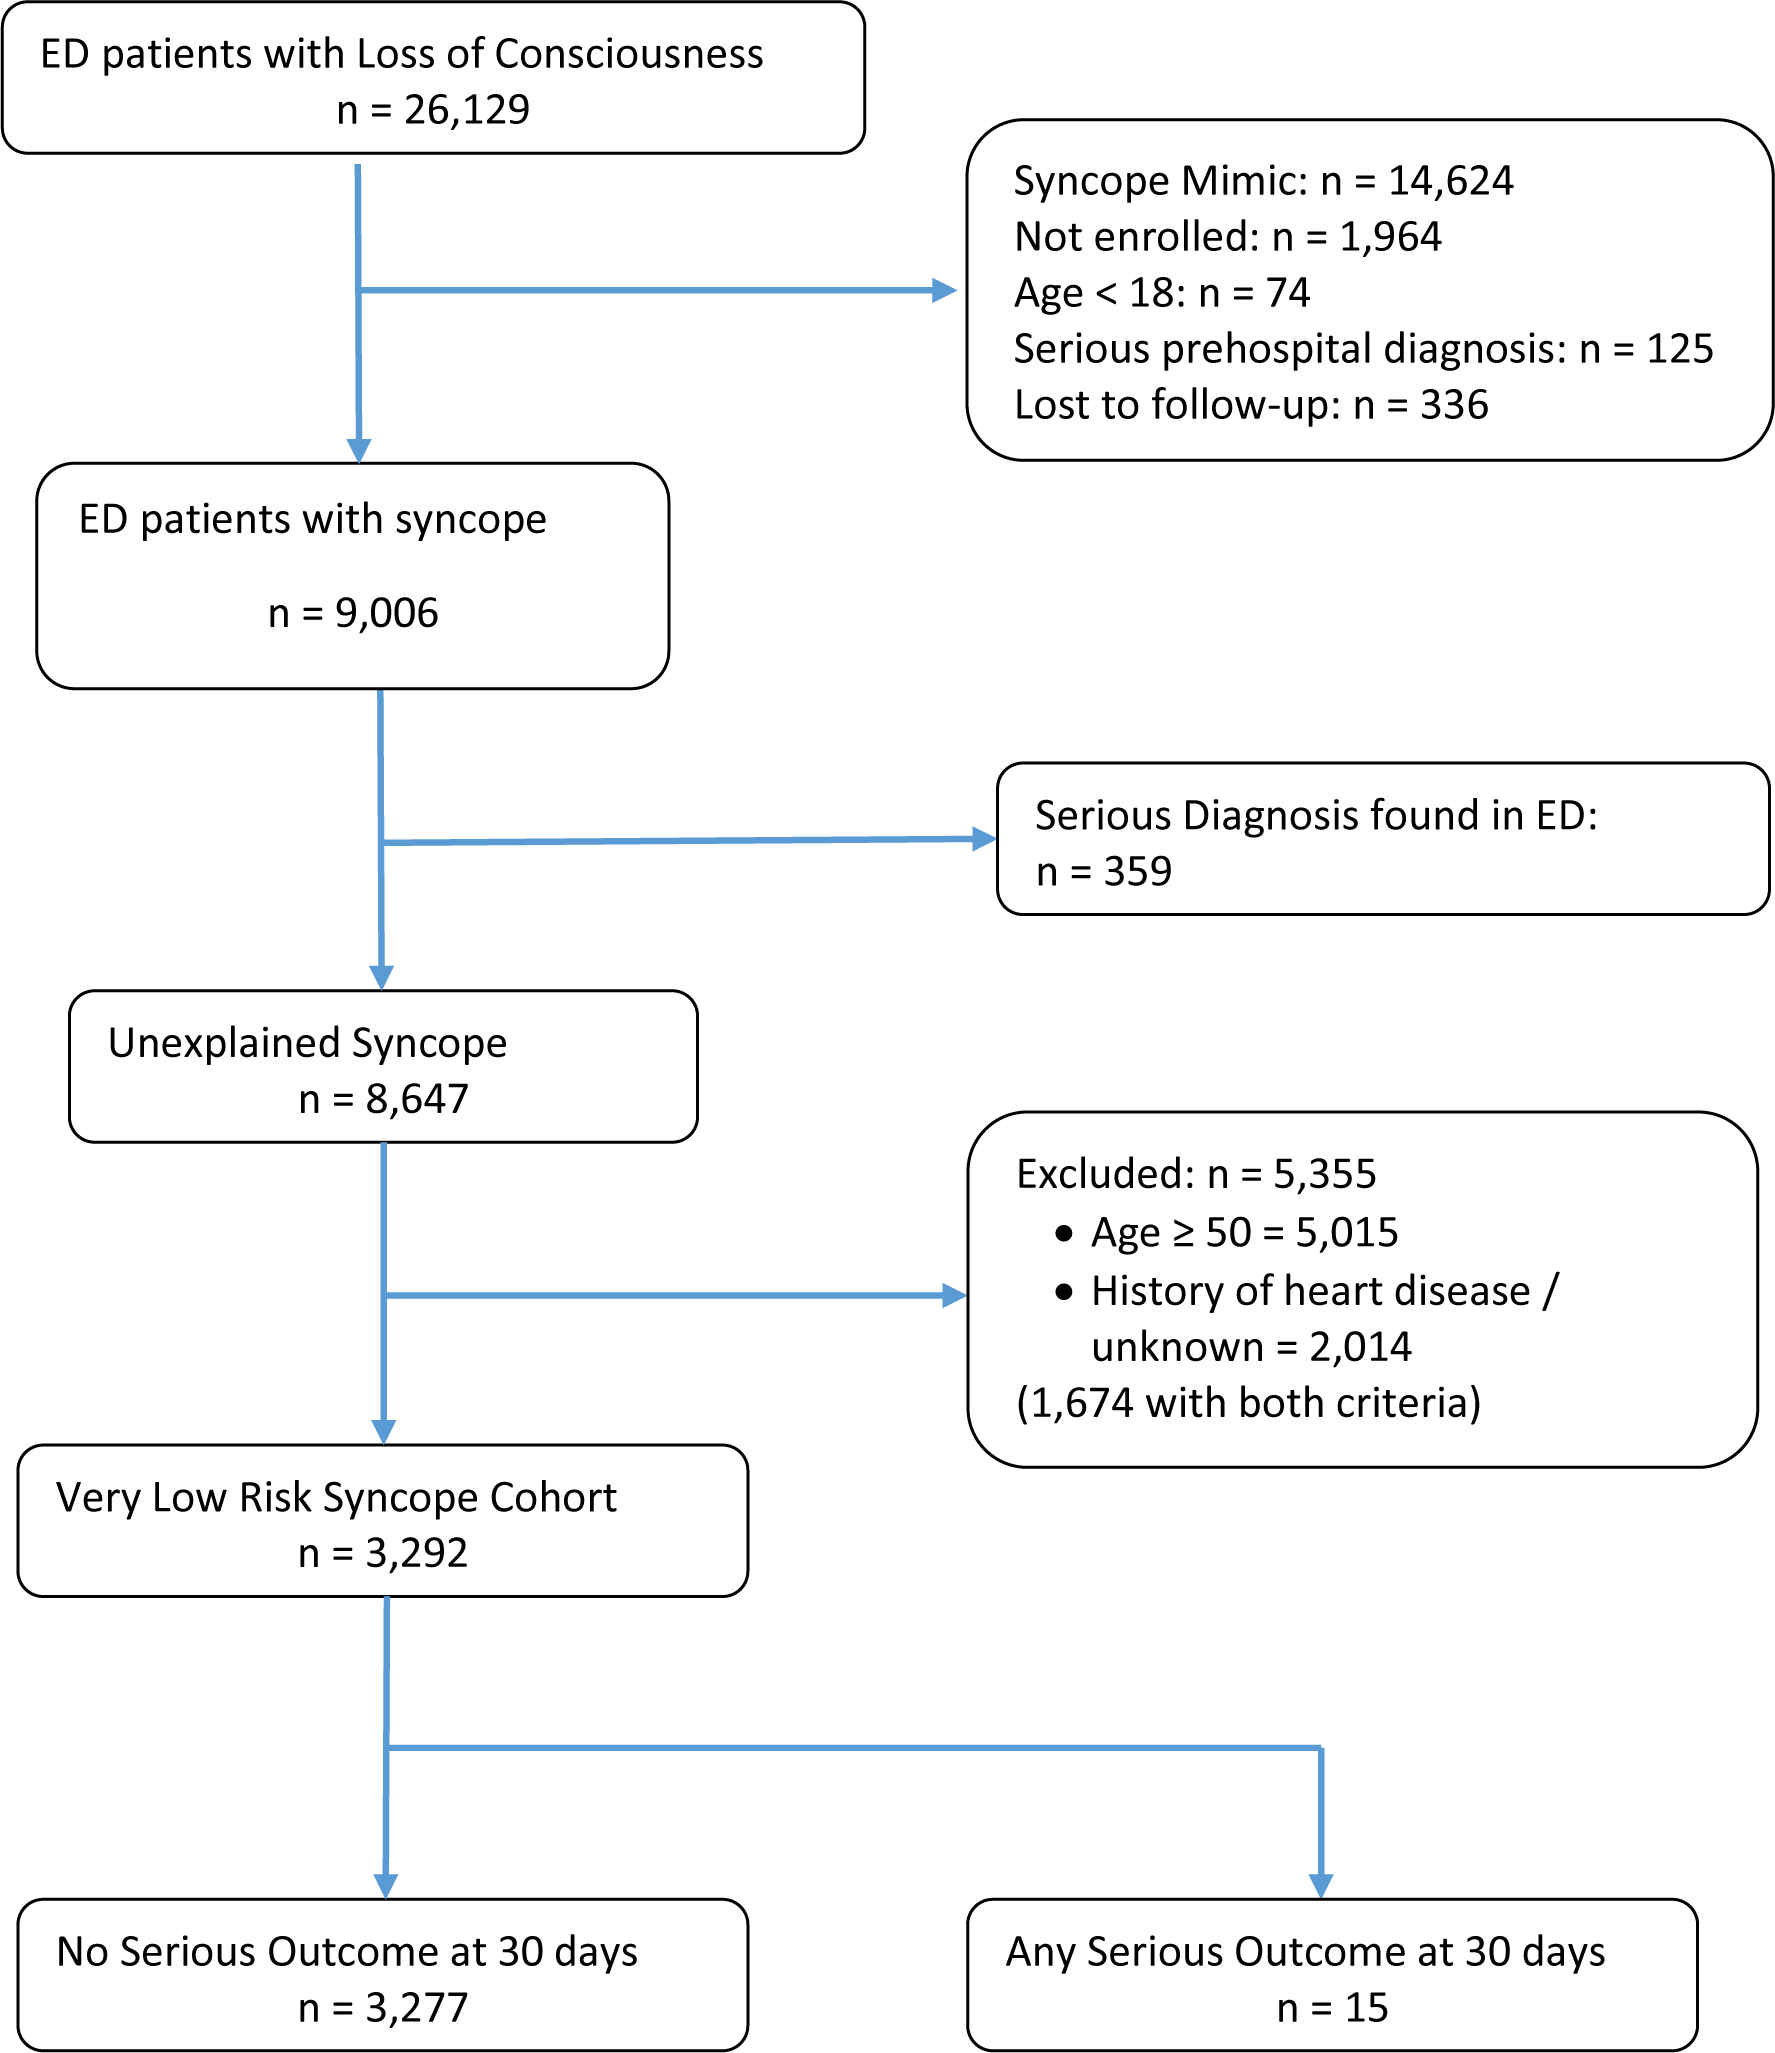
Flow Diagram of Canadian Emergency Department Syncope Patients included in the Very Low-Risk Cohort (Phase 1)
Table 1:
Characteristics of Very Low-Risk* Patients with Unexplained Syncope in the Canadian Cohort
| Characteristic, n (%) | N=3,292 |
|---|---|
|
| |
| Age (years): | |
| Mean (SD) | 30.9 (9.5) |
| Range | 18 – 49 |
| Female | 2,075 (63.0) |
| Arrival by ambulance | 1,674 (50.9) |
| Medical history: | |
| Hypertension | 122 (3.7) |
| Diabetes | 66 (2.0) |
| Heart Disease | 0 (0.0) |
| Management in ED: | |
| ECG performed | 3,288 (99.9) |
| Blood test performed | 2,352 (71.4) |
| Hospitalized | 61 (1.9) |
| 30-day serious outcome after index ED disposition: | 15 (0.5) |
| During index visit hospitalization | 4 (0.1) |
| After index visit | 11 (0.3) |
Very Low-Risk based on age < 50 years and no history of heart disease
SD = standard deviation; ED = emergency department; ECG = electrocardiogram
Table 2:
List of Serious Adverse Events in the Very Low-Risk Canadian Cohort of Patients (n=3,358) with Unexplained Syncope Under Age 50 with no History of Heart Disease.
| Patient No. | Age (Years) | Gender | Initial Disposition | Adverse Event | Setting of Adverse Event | Result of Event |
|---|---|---|---|---|---|---|
| 1 | 46 | Male | Hospitalized | Aortic Dissection | In ED after disposition decision | Procedural Intervention |
| 2 | 22 | Female | Discharged | Appendicitis | Outside the hospital | Procedural Intervention |
| 3 | 43 | Male | Discharged | Aseptic Meningitis | On return visit | Medically Treated |
| 4 | 44 | Female | Discharged | Gastrointestinal Bleeding | On return visit | Procedural Intervention |
| 5 | 44 | Male | Discharged | Gastrointestinal Bleeding | On return visit | Procedural Intervention |
| 6 | 47 | Male | Discharged | Myocardial Infarction | On return visit | Procedural Intervention |
| 7 | 26 | Male | Hospitalized | Pericardial Effusion | As Inpatient | Medically Treated |
| 8 | 23 | Female | Discharged | Perimyocarditis | On return visit | Medically Treated |
| 9 | 42 | Female | Discharged | Pulmonary Embolism | On return visit | Medically Treated |
| 10 | 21 | Female | Discharged | Pulmonary Embolism | Outside the hospital | Medically Treated |
| 11 | 32 | Male | Hospitalized | Pulmonary Embolism | In ED after disposition decision | Medically Treated |
| 12 | 26 | Female | Discharged | Sepsis | On return visit | Death |
| 13 | 23 | Male | Discharged | Ventricular Arrhythmia | Outside the hospital | Procedural Intervention |
| 14 | 35 | Male | Hospitalized | Ventricular Arrhythmia | On return visit | Procedural Intervention |
| 15 | 21 | Female | Hospitalized | Ventricular Arrhythmia | As Inpatient | Procedural Intervention |
Phase 2: Estimating National Variation in Hospitalization Rates
The 2019 NEDS dataset contains 33.1 million unweighted ED visits representing 143 million weighted ED visits nationwide. There were 506,411 unweighted ED visits for ages 18 and over with any diagnosis of syncope (ICD-10-CM code of R55). We excluded visits that resulted in death in the ED (n=526), visits with presenting exclusion criteria, such as seizure, major trauma, altered mental status, (n=75,119), and visits that included a significant ED diagnosis potentially requiring hospitalization, such as dehydration or hypotension, or a serious ED diagnosis such as myocardial infarction, ventricular arrhythmia, pulmonary embolism, (n=153,103). The remaining cohort contained 277,663 visits for unexplained syncope. We then removed all patients aged 50 years or older (n=143,004 and those with a documented history of heart disease (n=3,325). A list of diagnoses and associated ICD-10 codes used to exclude patients with heart disease is provided in Appendix 5. Examples of these include ischemic heart disease, heart failure, valvular disease, and dysrhythmias. This final study sample of very low-risk patients with unexplained syncope contained 131,332 unweighted visits.
After applying survey weights, there were 566,031 very low-risk ED visits for unexplained syncope nationwide in 2019, of which 15,507 (2.7%, 95% CI: 2.48%, 3.00%) were hospitalized, our primary outcome for Phase 2. The characteristics of the very low-risk patients with unexplained syncope in the 2019 NEDS dataset are presented in Table 3. We found substantial hospital-level variation in hospitalization rates for this very low-risk cohort. Hospitalization rates ranged from 0 to 100%, with a median hospitalization rate of 1.7% (IQR: 0–3.9%). The 90th percentile for this outcome corresponded to a hospitalization rate of 8.0%. Figure 2 depicts the distribution of hospitalization rates among hospitals with non-zero rates. Of the 989 hospitals, 265 (26.8%) sites did not report hospitalization for any very low-risk syncope patients. Of note, these were predominantly small sites, with 225 of them reporting a yearly ED visit volume <20,000, and with a median number of visits for very low-risk syncope of 16.
Table 3:
Characteristics of Adults Presenting to the Emergency Department with Unexplained Syncope Deemed Very Low Risk* in the 2019 NEDS Dataset, weighted n=566,031.
| Characteristic | Weighted Count (%) |
|---|---|
| Age: | |
| Mean (SD) | 31.5 (9.4) |
| Age Category: | |
| 16 to <30 | 266,897 (47.2%) |
| 30 to <40 | 160,196 (28.3%) |
| 40 to <50 | 138,938 (24.5%) |
| Gender: | |
| Female | 363,861 (64.3%) |
| Male | 202,139 (35.7%) |
| Race/Ethnicity:** | |
| Black or African American | 106,179 (18.8%) |
| Asian/Pacific Islander | 15,435 (2.7%) |
| Native American | 2,208 (0.4%) |
| Hispanic | 82,807 (14.6%) |
| White | 325,180 (57.4%) |
| Other | 3,080 (0.5%) |
| Primary Payer: | |
| Medicare | 21,229 (3.8%) |
| Medicaid | 151,333 (26.7%) |
| Private Insurance | 267,201 (47.2%) |
| Self-pay | 93,853 (16.6%) |
| Other | 3,080 (0.5%) |
| Percent with selected comorbidities: | |
| Hypertension | 54,661 (9.7%) |
| Diabetes Mellitus | 19,290 (3.4%) |
| Chronic Kidney Disease | 3,060 (0.5%) |
| COPD | 32,390 (5.7%) |
| Hospital-Level Variables | |
| Ownership Status | |
| Government or private (collapsed category) | 82,280 (14.5%) |
| Government, nonfederal (public) | 65,003 (11.5%) |
| Private, not-for-profit (voluntary) | 299,353 (52.9%) |
| Private, investor-owned (proprietary) | 57,122 (10.1%) |
| Private (collapsed category) | 62,272 (11.0%) |
| Urban-Rural | |
| Large metropolitan | 297,287 (52.5%) |
| Small metropolitan | 182,403 (32.2%) |
| Micropolitan | 48,228 (8.5%) |
| Not metropolitan or micropolitan | 20,058 (3.5%) |
| Collapsed categories/other | 18,055 (3.2%) |
| Teaching Status | |
| Metropolitan non-teaching | 118,398 (20.9%) |
| Metropolitan teaching | 373,624 (66.0%) |
| Non-metropolitan hospital | 74,008 (13.1%) |
| Yearly Visits | |
| <20k | 54,105 (9.6%) |
| 20–40k | 105,372 (18.6%) |
| 40–60k | 139,404 (24.6%) |
| 60–80k | 99,356 (17.6%) |
| 80k+ | 167,794 (29.6%) |
Very low risk defined as under age 50 and no history of heart disease.
Note that HCUP summarizes race/ethnicity by first reporting ethnicity. If ‘Hispanic’ is reported, the patient is put in the ‘Hispanic’ category even if the source data also listed ‘white.’
NEDS: Nationwide Emergency Department Sample. SD: Standard Deviation. COPD: Chronic Obstructive Pulmonary Disease.
Figure 2: Variability in Hospitalization Rates Across Hospitals for the Very Low-Risk Syncope Cohort in the 2019 NEDS Dataset, n=722*.

NEDS: Nationwide Emergency Department Sample.
Each dot represents one hospital. The horizontal lines forming the boxes represents that 75th percentile, the median, and the 25th percentile (from top to bottom).
*Figure excludes the 265 of 989 hospitals in the sample that do not report any hospitalizations, as well as two outlier sites with extremely high reporting of ED observation stays for syncope with a total hospitalization rate of 100%.
Hospital characteristics accounted for a small proportion of the observed variation in syncope admission rates (pseudo-R2: 0.04). Two factors were associated with greater odds of hospitalization: annual ED visit volume and metropolitan teaching status. Hospitals with greater than 80,000 ED visits per year had significantly greater odds of hospitalizing patients with very low-risk syncope (OR: 3.14 95% CI 2.02 to 4.89) as compared with smaller volume hospitals (<20,000 visits), and metropolitan teaching status (OR: 1.50, 95% CI 1.24 to 1.81) as compared with metropolitan non-teaching (See Table 4). These findings should be interpreted in the context of there being significant collinearity for urban/rural designation and metropolitan/teaching status (variance inflation factors >10 in each case).
Table 4:
Hospital Characteristics Associated with Hospitalization for Very Low-Risk Syncope Cohort in the 2019 NEDS Dataset.
| OR | 95% CI | ||
|---|---|---|---|
|
| |||
| Ownership Status | |||
| Government, nonfederal (public) | (ref) | ||
| Government or private (collapsed category) | 0.80 | 0.58 | 1.11 |
| Private, not-for-profit (voluntary) | 0.83 | 0.60 | 1.14 |
| Private, investor-owned (proprietary) | 1.18 | 0.87 | 1.60 |
| Private (collapsed category) | 0.60 | 0.43 | 0.83 |
| Urban-Rural | |||
| Large metropolitan | (ref) | ||
| Small metropolitan | 0.83 | 0.67 | 1.02 |
| Micropolitan | 0.67 | 0.27 | 1.68 |
| Not metropolitan or micropolitan | 0.67 | 0.24 | 1.84 |
| Collapsed categories/other | 0.91 | 0.45 | 1.84 |
| Teaching Status | |||
| Metropolitan non-teaching | (ref) | ||
| Metropolitan teaching | 1.50 | 1.24 | 1.81 |
| Non-metropolitan hospital | 0.99 | 0.42 | 2.33 |
| Yearly Visits | |||
| <20k | (ref) | ||
| 20–40k | 2.11 | 1.40 | 3.20 |
| 40–60k | 2.76 | 1.85 | 4.11 |
| 60–80k | 2.49 | 1.63 | 3.80 |
| 80k+ | 3.14 | 2.02 | 4.89 |
Sample includes 989 hospitals in the 2019 Nationwide Emergency Department Sample. A logistic regression model for the outcome hospitalization was estimated with hospital characteristics, with standard errors clustered at the hospital-level. OR = odds ratio; CI = confidence interval
Limitations
Our study is limited by the administrative data available in the NEDS dataset. ICD-10 diagnosis codes may not capture all patients with syncope who present to the ED, particularly if other important diagnoses are uncovered, and may not comprehensively capture past medical history of heart disease or other appropriate reasons for admission. However, our extensive list of diagnoses related to heart disease and reason for admission serves to mitigate this limitation. Further, due to variability in data elements reported by different states in the NEDS database, the data related to observation stays may be incomplete. As well, the ICD-10-CM code for syncope and collapse (R55) also includes pre-syncope, which was excluded from our quality measure derivation cohort. Our analysis included data from 2019 alone; other years may have yielded different results. Our intention was not to derive a new clinical decision instrument; therefore, our very low-risk criteria should not be used to guide individual patient disposition decisions. Finally, the prospective cohort differed from the patients in the NEDS given that the former enrolled syncope patients in Canada, not in the US; however, prior studies have validated similar Canadian decision instruments in U.S. populations.20–22
Discussion
This work describes a prospectively-derived ED cohort for very low-risk syncope linked to specifications of a novel quality measure of hospitalization for syncope. Our Phase 2 results demonstrated substantial variation in hospitalization rates across EDs within a nationally representative administrative dataset. In distinction to prior studies defining risk-stratification criteria for ED syncope presentations,3–7 we find that two factors, age < 50 years and no history of heart disease, determine a population with < 0.5% risk of adverse events at 30 days. These criteria have the advantage of relying on criteria available in standard structured data fields within administrative and claims information, facilitating implementation for a wide variety of quality measurement and improvement use cases, including local performance benchmarking as well as pay-for-performance programs.
While a potentially useful quality metric, our very low-risk criteria, using age and history of heart disease, should not be used by ED clinicians to guide clinical decision-making at the individual patient level. Only prospectively validated risk-stratification tools, in conjunction with clinical gestalt and patient input, should be used for this purpose.23 Further, our metric is not validated or tested for use within an ED to compare physicians— such use risks unintended consequences that could worsen the quality of care. Of note, previous randomized trials evaluating different care pathways for ED patients with syncope have used age under 50 years to define a lower risk cohort.24,25
Our work represents a novel application of clinical research to administrative data with the potential to accelerate the translation of clinical research to quality improvement. Prior studies have suggested the evidence to practice gap may be as long as 17 years.26 The derivation of risk-stratification tools currently relies on clinical data that requires resource-intensive manual chart abstraction or prospective data collection. Simultaneously, the world of quality measurement is moving towards digital quality measures based on structured data elements reliably captured in electronic health records in near real-time across the U.S. Future efforts to derive risk-stratification tools that can be rapidly translated to clinical practice and quality improvement may consider prioritizing simple, reliably available data elements like those we have identified.
Hospitalization for very low-risk patients with syncope is generally not recommended since the clinical benefit is low,11,27 the cost is substantial,2 and there is potential for iatrogenic harm.28 Total direct costs for syncope-related hospitalizations are estimate to be over $2 billion annually.2 The average Medicare payment for the “Syncope & Collapse” Diagnosis Related Group (DRG) is over $5,000 per admission and total hospital costs correlate positively with length of stay.29 If hospitals admitting greater than 2% of low-risk patients reduced their ED hospitalization rate to 2%, an estimated 8,440 hospitalizations per year would be avoided. Based on this estimate, a total of approximately $42 million could potentially be saved by payers annually. Most of this cost could be avoided if hospitals encouraged direct discharge for very low-risk syncope patients with an unremarkable ED evaluation. Potential iatrogenic harms of hospitalization include delirium, hypoglycemia, fall, medication errors, and complications from intravenous and urinary catheter placement.28 Further in-patient testing can result in incidental findings of unclear significance, which, in turn, can lead to more testing and contribute to patient anxiety. Various strategies could be used to encourage discharge of low-risk patients including shared decision-making between patients and physicians,30 use of evidence-based syncope risk-stratification tools,16 and implementation of national quality measures, such as ours. Although, no specific optimal hospitalization rate exists, encouraging “high-utilizing” hospitals to reduce their hospitalization rates for this very low-risk cohort could safely reduce costs, thereby increasing the value of syncope care.
When we apply our two very low-risk criteria to administrative data using the NEDS, we identify a quality gap with substantial variation in hospital-level performance. Although the median hospitalization rate was relatively low at 1.7%, roughly 10% of hospitals in the NEDS were hospitalizing over 8.0% of very low-risk syncope patients. Moreover, variation in admission rates for our very low risk syncope cohort was also observed across the enrolling Canadian EDs, despite each site being an urban, academic hospital-based ED, ranging from 0.9% to 6.1% (See Appendix 4). This suggests a multi-factorial cause of variation in these rates. Of note, admission rates for syncope in Canada are known to be lower than that in the US.31,32 This is consistent with prior work showing variability in hospitalization rates for syncope in general,33 and other cardiopulmonary ED complaints.34,35 Various factors may influence hospitalizations rates at the physician, institutional, and geographical level. These factors may include low risk tolerance among physicians, medico-legal concerns, or fear of uncertainty,36 as well as patient expectations,37 and variation in regional intensity of care.38 Patient-level clinical factors, such as medical complexity and non-cardiac disease burden, among patients under age 50, as well as access to post-ED follow-up care, likely impact the hospitalization rates in our very low risk cohort.39 Thus, additional risk adjustment may be used when considering implementation of this syncope quality measure. Further, given a recent shift towards observation care for syncope over the last several years,9 it is likely that a more comprehensive dataset that more granularly differentiates between observation “status”, admission to the observation unit, and out-patient ED visits would have yielded a significantly greater overall hospitalization rate and increased variation between hospitals. The sites hospitalizing 100% of very low-risk syncope patients were placing nearly all such patients in observation status. Thus, future implementation of our quality measure should likely include both observation and inpatient care as an outcome measure.
In addition to provider level influences on variation in ED syncope hospitalization practices, there may also be hospital-level factors. For example, our multivariable regression analysis using the 2019 NEDS dataset revealed that metropolitan teaching status, and higher annual volume was associated with greater odds of hospitalization. This may be explained by the fact that many large, metropolitan, teaching hospitals care for medically complex patients with significant non-cardiac co-morbidities, e.g., organ transplants, advanced cancer, chronic organ failure, and immunosuppression. Such patients may be deemed high risk by clinicians despite being under age 50 and lacking any documented heart disease.
These very low-risk criteria and accompanying recommendation constitute a new quality measure which could potentially provide benchmarks for comparison across hospital-based EDs or even use in national quality measurement programs tied to value-based payments. In sum, this quality measure could increase the value of emergency syncope care by reducing the number of low-value hospitalizations. If adopted, further research to assess the clinical and economic impact of this quality measure is warranted.
Supplementary Material
Acknowledgements:
Authors acknowledge Shooshan Danagoulian, PhD at Wayne State University in Detroit, MI for advising on emergency department observation utilization and providing access to some of the data.
Financial Support:
Dr. Probst is currently supported by an R01 grant from the NIH/NHLBI (R01HL149680). Drs. Janke and Haimovich are supported by the Emergency Medicine Foundation (EMF). Dr. Lin is supported by a K23 grant from NIH/NHLBI (K23HL143042). Dr. Venkatesh also receives support from the Centers for Medicare and Medicaid Services for the development of hospital and health system quality measures and ratings systems. He is also supported by the Agency for Healthcare Research and Quality (2R01HS022882–02) to study health system value and hospital admissions. Dr. Kocher reports a grant from Blue Cross Blue Shield of Michigan and Blue Care Network to support the Michigan Emergency Department Improvement Collaborative, a quality improvement network, outside the submitted work. Dr. Thiruganasambandamoorthy has received grant funding for syncope research from the Canadian Institutes of Health Research, the Heart and Stroke Foundation of Canada, and the Cardiac Arrhythmia Network of Canada.
Footnotes
Conflict of Interest Disclosure: MP, AJ, AH, AV, ML, KK, MN, and VT disclose no conflicts of interest.
Meetings: This work has not been previously presented at scientific meetings.
Publisher's Disclaimer: This is a PDF file of an unedited manuscript that has been accepted for publication. As a service to our customers we are providing this early version of the manuscript. The manuscript will undergo copyediting, typesetting, and review of the resulting proof before it is published in its final form. Please note that during the production process errors may be discovered which could affect the content, and all legal disclaimers that apply to the journal pertain.
References:
- 1.Probst MA, Kanzaria HK, Gbedemah M, Richardson LD, Sun BC. National trends in resource utilization associated with ED visits for syncope. The American journal of emergency medicine. 2015;33(8):998–1001. [DOI] [PMC free article] [PubMed] [Google Scholar]
- 2.Sun BC, Emond JA, Camargo CA Jr. Direct medical costs of syncope-related hospitalizations in the United States. The American journal of cardiology. 2005;95(5):668–671. [DOI] [PubMed] [Google Scholar]
- 3.Thiruganasambandamoorthy V, Kwong K, Wells GA, et al. Development of the Canadian Syncope Risk Score to predict serious adverse events after emergency department assessment of syncope. CMAJ : Canadian Medical Association journal = journal de l’Association medicale canadienne. 2016;188(12):E289–298. [DOI] [PMC free article] [PubMed] [Google Scholar]
- 4.Quinn JV, Stiell IG, McDermott DA, Sellers KL, Kohn MA, Wells GA. Derivation of the San Francisco Syncope Rule to predict patients with short-term serious outcomes. Annals of emergency medicine. 2004;43(2):224–232. [DOI] [PubMed] [Google Scholar]
- 5.Probst MA, Gibson T, Weiss RE, et al. Risk Stratification of Older Adults Who Present to the Emergency Department With Syncope: The FAINT Score. Annals of emergency medicine. 2019. [DOI] [PMC free article] [PubMed] [Google Scholar]
- 6.Reed MJ, Newby DE, Coull AJ, Prescott RJ, Jacques KG, Gray AJ. The ROSE (risk stratification of syncope in the emergency department) study. Journal of the American College of Cardiology. 2010;55(8):713–721. [DOI] [PubMed] [Google Scholar]
- 7.Serrano LA, Hess EP, Bellolio MF, et al. Accuracy and quality of clinical decision rules for syncope in the emergency department: a systematic review and meta-analysis. Annals of emergency medicine. 2010;56(4):362–373 e361. [DOI] [PMC free article] [PubMed] [Google Scholar]
- 8.Del Rosso A, Ungar A, Maggi R, et al. Clinical predictors of cardiac syncope at initial evaluation in patients referred urgently to a general hospital: the EGSYS score. Heart. 2008;94(12):1620–1626. [DOI] [PubMed] [Google Scholar]
- 9.Anderson TS, Thombley R, Dudley RA, Lin GA. Trends in Hospitalization, Readmission, and Diagnostic Testing of Patients Presenting to the Emergency Department With Syncope. Annals of emergency medicine. 2018;72(5):523–532. [DOI] [PubMed] [Google Scholar]
- 10.Khaliq W, Aboabdo M, Harris CM, et al. Regional variation in outcomes and healthcare resources utilization in, emergency department visits for syncope. The American journal of emergency medicine. 2021;44:62–67. [DOI] [PMC free article] [PubMed] [Google Scholar]
- 11.Probst MA, Su E, Weiss RE, et al. Clinical Benefit of Hospitalization for Older Adults With Unexplained Syncope: A Propensity-Matched Analysis. Annals of emergency medicine. 2019. [DOI] [PMC free article] [PubMed] [Google Scholar]
- 12.Krishnan RJ, Mukarram M, Ghaedi B, et al. Benefit of hospital admission for detecting serious adverse events among emergency department patients with syncope: a propensity-score-matched analysis of a multicentre prospective cohort. CMAJ. 2020;192(41):E1198–E1205. [DOI] [PMC free article] [PubMed] [Google Scholar]
- 13.Kaul P, Tran DT, Sandhu RK, Solbiati M, Costantino G, Sheldon RS. Lack of benefit from hospitalization in patients with syncope: A propensity analysis. J Am Coll Emerg Physicians Open. 2020;1(5):716–722. [DOI] [PMC free article] [PubMed] [Google Scholar]
- 14.Desai NR, Ross JS, Kwon JY, et al. Association Between Hospital Penalty Status Under the Hospital Readmission Reduction Program and Readmission Rates for Target and Nontarget Conditions. JAMA. 2016;316(24):2647–2656. [DOI] [PMC free article] [PubMed] [Google Scholar]
- 15.Ryan AM, Krinsky S, Adler-Milstein J, Damberg CL, Maurer KA, Hollingsworth JM. Association Between Hospitals’ Engagement in Value-Based Reforms and Readmission Reduction in the Hospital Readmission Reduction Program. JAMA Intern Med. 2017;177(6):862–868. [DOI] [PMC free article] [PubMed] [Google Scholar]
- 16.Thiruganasambandamoorthy V, Sivilotti MLA, Le Sage N, et al. Multicenter Emergency Department Validation of the Canadian Syncope Risk Score. JAMA internal medicine. 2020;180(5):737–744. [DOI] [PMC free article] [PubMed] [Google Scholar]
- 17.Cost Healthcare and Project Utilization. Overview of the Nationwide Emergency Department Sample (NEDS). Rockville, MD: Agency forHealthcare Research and Quality; 2018. Available at: https://www.hcup-us.ahrq.gov/db/nation/neds/NEDS_Introduction_2018.jsp. Accessed August 1, 2021. [Google Scholar]
- 18.R Core Team (2020). R: A language and environment for statistical computing. R Foundation for Statistical Computing, Vienna, Austria. URL: https://www.R-project.org/. [Google Scholar]
- 19.Lumley T (2020). “survey: analysis of complex survey samples.” R package version 4.0. https://cran.r-project.org/web/packages/survey/survey.pdf. [Google Scholar]
- 20.Wolf SJ, McCubbin TR, Feldhaus KM, Faragher JP, Adcock DM. Prospective validation of Wells Criteria in the evaluation of patients with suspected pulmonary embolism. Annals of emergency medicine. 2004;44(5):503–510. [DOI] [PubMed] [Google Scholar]
- 21.van Belle A, Buller HR, Huisman MV, et al. Effectiveness of managing suspected pulmonary embolism using an algorithm combining clinical probability, D-dimer testing, and computed tomography. Jama. 2006;295(2):172–179. [DOI] [PubMed] [Google Scholar]
- 22.Modi S, Deisler R, Gozel K, et al. Wells criteria for DVT is a reliable clinical tool to assess the risk of deep venous thrombosis in trauma patients. World J Emerg Surg. 2016;11:24. [DOI] [PMC free article] [PubMed] [Google Scholar]
- 23.Probst MA, Sun BC. How can we improve management of syncope in the Emergency Department? Cardiology journal. 2014;21(6):643–650. [DOI] [PMC free article] [PubMed] [Google Scholar]
- 24.Shen WK, Decker WW, Smars PA, et al. Syncope Evaluation in the Emergency Department Study (SEEDS): a multidisciplinary approach to syncope management. Circulation. 2004;110(24):3636–3645. [DOI] [PubMed] [Google Scholar]
- 25.Sun BC, McCreath H, Liang LJ, et al. Randomized clinical trial of an emergency department observation syncope protocol versus routine inpatient admission. Annals of emergency medicine. 2014;64(2):167–175. [DOI] [PMC free article] [PubMed] [Google Scholar]
- 26.Morris ZS, Wooding S, Grant J. The answer is 17 years, what is the question: understanding time lags in translational research. J R Soc Med. 2011;104(12):510–520. [DOI] [PMC free article] [PubMed] [Google Scholar]
- 27.Johnson PC, Ammar H, Zohdy W, Fouda R, Govindu R. Yield of diagnostic tests and its impact on cost in adult patients with syncope presenting to a community hospital. South Med J. 2014;107(11):707–714. [DOI] [PubMed] [Google Scholar]
- 28.Canzoniero JV, Afshar E, Hedian H, Koch C, Morgan DJ. Unnecessary hospitalization and related harm for patients with low-risk syncope. JAMA internal medicine. 2015;175(6):1065–1067. [DOI] [PubMed] [Google Scholar]
- 29.Probst MA, McConnell JK, Weiss RE, et al. Estimating the Cost of Care for Emergency Department Syncope Patients: Comparison of Three Models. The western journal of emergency medicine. 2017;18(2):253–257. [DOI] [PMC free article] [PubMed] [Google Scholar]
- 30.Probst MA, Lin MP, Sze JJ, et al. Shared Decision Making for Syncope in the Emergency Department: A Randomized Controlled Feasibility Trial. Academic emergency medicine : official journal of the Society for Academic Emergency Medicine. 2020;27(9):853–865. [DOI] [PMC free article] [PubMed] [Google Scholar]
- 31.Thiruganasambandamoorthy V, Hess EP, Turko E, Perry JJ, Wells GA, Stiell IG. Outcomes in Canadian emergency department syncope patients--are we doing a good job? The Journal of emergency medicine. 2013;44(2):321–328. [DOI] [PubMed] [Google Scholar]
- 32.Tran DT, Sheldon RS, Kaul P, Sandhu RK. The Current and Future Hospitalization Cost Burden of Syncope in Canada. CJC Open. 2020;2(4):222–228. [DOI] [PMC free article] [PubMed] [Google Scholar]
- 33.Quinn J, Chung S, Murchland A, et al. Association Between US Physician Malpractice Claims Rates and Hospital Admission Rates Among Patients With Lower-Risk Syncope. JAMA Netw Open. 2020;3(12):e2025860. [DOI] [PMC free article] [PubMed] [Google Scholar]
- 34.Cotterill PG, Deb P, Shrank WH, Pines JM. Variation in chest pain emergency department admission rates and acute myocardial infarction and death within 30 days in the Medicare population. Academic emergency medicine : official journal of the Society for Academic Emergency Medicine. 2015;22(8):955–964. [DOI] [PubMed] [Google Scholar]
- 35.Probst MA, Mower WR, Kanzaria HK, Hoffman JR, Buch EF, Sun BC. Analysis of emergency department visits for palpitations (from the National Hospital Ambulatory Medical Care Survey). The American journal of cardiology. 2014;113(10):1685–1690. [DOI] [PMC free article] [PubMed] [Google Scholar]
- 36.Pines JM, Isserman JA, Szyld D, Dean AJ, McCusker CM, Hollander JE. The effect of physician risk tolerance and the presence of an observation unit on decision making for ED patients with chest pain. The American journal of emergency medicine. 2010;28(7):771–779. [DOI] [PubMed] [Google Scholar]
- 37.Whyte E, Goodacre S. Patient expectations of emergency hospital admission: a cross-sectional questionnaire survey. Eur J Emerg Med. 2016;23(3):203–207. [DOI] [PubMed] [Google Scholar]
- 38.Welch WP, Miller ME, Welch HG, Fisher ES, Wennberg JE. Geographic variation in expenditures for physicians’ services in the United States. The New England journal of medicine. 1993;328(9):621–627. [DOI] [PubMed] [Google Scholar]
- 39.Lin MP, Natsui S, Sinnette C, Ball A, Weissman JS, Schuur JD. Facilitators and Barriers to Reducing Emergency Department Admissions for Chest Pain: A Qualitative Study. Critical pathways in cardiology. 2018;17(4):201–207. [DOI] [PubMed] [Google Scholar]
Associated Data
This section collects any data citations, data availability statements, or supplementary materials included in this article.