Abstract
The acid tolerance of Escherichia coli O157:H7 strains can be overcome by addition of lactate, ethanol, or a combination of the two agents. Killing can be increased by as much as 4 log units in the first 5 min of incubation at pH 3 even for the most acid-tolerant isolates. Exponential-phase, habituated, and stationary-phase cells are all sensitive to incubation with lactate and ethanol. Killing correlates with disruption of the capacity for pH homeostasis. Habituated and stationary-phase cells can partially offset the effects of the lowering of cytoplasmic pH.
The phenomenon of acid tolerance among pathogenic Escherichia coli has been suggested to be one of the factors that has given rise to the increase in infections caused by E. coli O157:H7. Several mechanisms have been suggested that contribute to the tolerance of extremely acidic pHs. Firstly, the growth rate and phase of the cells determine the level of expression of the RpoS-controlled regulon, which enables E. coli and related enteric organisms to survive a range of stresses (9, 11). Secondly, brief exposure of cells to mildly acidic pHs (pH 4.5 to 6.0) has been shown to elicit the expression of a range of genes that specifically counter acid stress (2, 12, 22, 23). These mechanisms act in concert with the basic capacity for pH homeostasis, which is strongly dependent on the limited proton permeability of the bacterial cell membrane (4). Killing by acid must overcome these three barriers. There has been considerable debate over the level of acid tolerance of E. coli O157:H7 compared to those of other enteric bacteria. Some groups have reported enhanced acid tolerance, while others report no significant difference between commensal E. coli and O157:H7 isolates (3, 9, 19, 20). We have, therefore, sought mechanisms by which the killing by acid pH can be augmented.
Combinations of treatments, such as low-pH conditions, organic weak acids, nitrite, low water activity, and membrane perturbants, such as the parabens, have conventionally protected processed foods (15). Most of these treatments are aimed at preventing growth rather than killing the contaminating organisms. However, for severe pathogens it is desirable to be able to kill the organisms, since the infective dose may be very low. In addition, conventional treatments involve extended incubations and therefore may lead to the acquisition of resistance and enhanced virulence. A desirable feature of a killing system would be extreme rapidity, so that the result is a minimally processed product. In this communication we describe the augmentation of killing at acid pHs by lactate and ethanol, alone and in combination.
It is well established that E. coli cells can be induced to become tolerant of extremely acid conditions (pH 3 to 3.5) if they are grown into exponential phase at a mildly acidic pH or if they have entered stationary phase (2, 10, 18). Further, it is known that acid tolerance varies among E. coli isolates, and therefore this study was conducted with a diverse group of both pathogenic E. coli O157:H7 and nonpathogenic organisms (Table 1). Significant variability was observed in the survival of the group of E. coli isolates when stationary-phase cultures were exposed to either pH 2 or pH 3 (Table 1). Cells were challenged by diluting stationary-phase cultures, grown for 18 h in tryptone soya broth (TSB), 1:1,000 into TSB adjusted to pH 2 or pH 3 with HCl. After incubation for 1 h at 37°C, the organisms were serially diluted in McIlvaine’s buffer at pH 7 and plated onto tryptone soya agar (TSA). Survival for 1 h at pH 3 was between 0.69 and 90% for the group of strains, but most organisms failed to survive incubation for 1 h at pH 2 (Table 1). Survival at pH 2 was not restricted to E. coli O157:H7 isolates, since J1, which is a non-O157:H7 isolate, survived almost as well as the pathogenic group. Strain 30-2C4 was the most acid-tolerant organism and was chosen for further study.
TABLE 1.
E. coli strains and their tolerances to low pHs and organic acids
| Strain | Serotype | Description and source | % Survivala
|
|||||
|---|---|---|---|---|---|---|---|---|
| pH 2 | pH 3 | Acetateb | Lactateb | Malateb | Citrateb | |||
| ATCC 35150 | O157:H7 | Clinical isolatec | 0.40 | 75 | 39 | 0.01 | 68 | 66 |
| ATCC 43895 | O157:H7 | Hamburger isolatec | 0.02 | 64 | 79 | 0.08 | 51 | 67 |
| 505B | O157:H7 | Beef isolated | 0 | 4.1 | 1.8 | <0.01 | 0.10 | 12 |
| NCTC 12079 | O157:H7 | Clinical isolatee | 0 | 0.69 | 0.08 | 0.01 | 0.01 | 0.10 |
| 30-2C4 | O157:H7 | Clinical isolate, salamid | 1.5 | 87 | 100 | 6.0 | 85 | 94 |
| C9490 | O157:H7 | Clinical isolate, “Jack-in-the-Box” hamburgerd | 0 | 51 | 6.7 | 0.06 | 78 | 72 |
| 1267 | O157:H7 | Clinical isolatef | 0.40 | 90 | 100 | 3.3 | 76 | 100 |
| W2-2 | O157:H7 | Poultry isolated | 0 | 15 | 2.0 | <0.01 | 6.3 | 10 |
| NCTC 10964 | O157:K88a,c:H19 | Isolate from piglete | 0 | 89 | 34 | 0.20 | 77 | 84 |
| NCTC 9001 | O1:K1:H7 | Clinical isolate, urinee | 0 | 11 | 0.02 | <0.0l | 2.0 | 16 |
| NCTC 10865 | O20:K84:H26 | Clinical isolatee | 0 | 81 | 62 | 2.1 | 100 | 69 |
| J1 | Unknown | Clinical isolate, healthy volunteerg | 0.02 | 28 | 15 | 0.05 | 2.1 | 86 |
Expressed as percentage of CFU per milliliter of inoculum (approximately 5 × 10⁹ CFU · ml−1, diluted 1:1,000). Data are averages from at least two independent experiments and routinely varied by less than 30%. The limit of detection is 50 CFU ml−1.
Undissociated acid 50 mM added to TSB at pH 3.
From the American Type Culture Collection, Manassas, Va.
Supplied by M. P. Doyle, University of Georgia, Griffin.
From the National Collection of Type Cultures, Public Health Laboratory Service, Colindale, United Kingdom.
Supplied by F. Thomson-Carter, Scottish Reference Laboratory, Aberdeen, Scotland.
Supplied by J. Glover, University of Aberdeen, Aberdeen, Scotland.
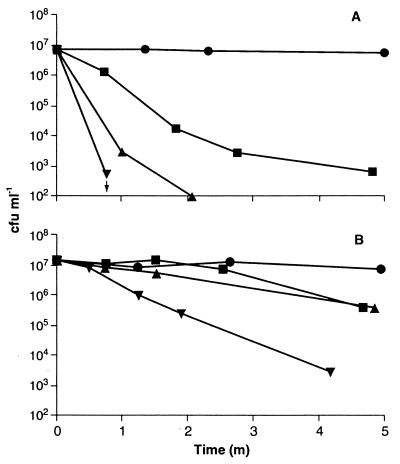
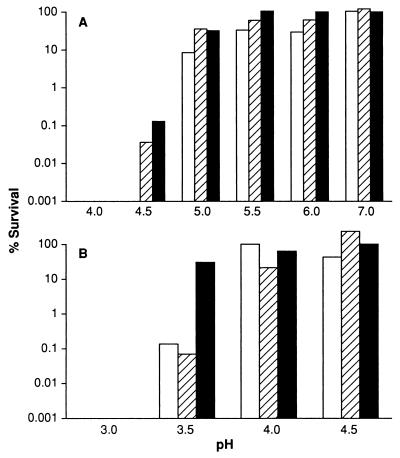
Ethanol and lactate have previously been implicated in the low level of survival of E. coli O157:H7 in certain foods. We therefore investigated the potential of these food additives to compromise the tolerance of E. coli O157:H7 at low pHs. Ethanol (5% [vol/vol]) and lactate (50 mM undissociated acid) reduced the viability of E. coli at pH 3 when added singly or in combination. Initial experiments showed that killing by lactate and/or ethanol was very rapid, and therefore we analyzed the kinetics over the first 5 min of incubation (Fig. 1). Addition of ethanol or lactate, either singly or in combination, dramatically reduced the viability of exponential-phase cells, with at least a 4-log-unit killing in less than 5 min (Fig. 1A). Habituated cells (grown to mid-exponential phase at pH 5.8) and stationary-phase cells were more acid tolerant than cells grown at pH 7 (2, 6, 17). However, viability was rapidly lost upon incubation with either lactate or ethanol, and the combination resulted in a 4-log-unit killing in 5 min (Fig. 1B). For stationary-phase (Fig. 1B) and habituated (data not shown) cells, lactate or ethanol separately gave only a single-log-unit killing in this time period, which indicates that the two agents act synergistically in these cell types. Although there was considerable variation among strains, all were sensitive to the combination of pH 3 and lactate plus ethanol (Table 2). For most strains the effect was specific for lactate, since acetate, malate, and citrate did not cause significant cell death at pH 3 (Table 1). Killing by lactate and ethanol was dependent on the incubation pH. After 1 h of incubation with lactate, survival was high if the incubation pH was equal to or greater than 5, but only limited survival occurred below pH 5 (Fig. 2A). Similarly, survival over the 1-h incubation period was not affected by ethanol (final concentration, 5%) unless the incubation pH was less than 4 (Fig. 2B).
FIG. 1.
Augmentation of killing at pH 3 by ethanol and lactate. Strain 30-2C4 was grown in McIlvaine’s medium to mid-exponential phase at pH 7 (approximately 3 × 10⁸ CFU · ml−1) (A) or to stationary phase at pH 7 (approximately 3 × 10⁹ CFU · ml−1) (B) and was challenged in McIlvaine’s medium at pH 3 for 5 min at 37°C with no additions (●), 50 mM lactate (▴), 5% ethanol (■), or 5% ethanol with 50 mM lactate (▾). Viability was determined by plating three 5-μl spots onto TSA, incubating for 18 h at 37°C, and counting spots that contained 5 to 50 colonies. An arrow indicates the time point after which no survivors were detected. Standard deviations between spots were routinely less than 4. Data are averages from at least two independent experiments, with survival expressed as a percentage of the CFU per milliliter of inoculum, and routinely varied by less than 10%. m, min.
TABLE 2.
Sensitivity of stationary-phase E. coli strains to lactate and ethanol at low pHs
| Strain | Time (min) | % Survivala at pH 3 with:
|
|||
|---|---|---|---|---|---|
| No additions | Lactate (50 mM) | Ethanol (5%) | Lactate (50 mM) and ethanol (5%) | ||
| 30-2C4 | 5 | 100 | 18 | 65 | 8.5 |
| 10 | 85 | 0.07 | 52 | NS | |
| 15 | 100 | NS | 22 | NS | |
| C9490 | 5 | 80 | 0.03 | 30 | 0.01 |
| 10 | 87 | NS | 1.5 | NS | |
| 15 | 22 | NS | 0.02 | NS | |
| 1267 | 5 | 90 | 2.0 | 65 | 0.09 |
| 10 | 70 | 0.03 | 38 | 0.01 | |
| 15 | 54 | 0.11 | 9.0 | NS | |
| J1 | 5 | 100 | 1.5 | 39 | NS |
| 10 | 70 | 0.01 | 11 | NS | |
| 15 | 45 | 0.02 | 9.0 | NS | |
Expressed as a percentage of CFU per milliliter of inoculum. Data are averages from at least two independent experiments and routinely varied by less than 10%. NS, no survivors detected. The minimum level of detection was 20 CFU · ml−1.
FIG. 2.
Toxicity of lactate and ethanol with varying pHs. Strain 30-2C4 was grown in McIlvaine’s medium, and cells were diluted into McIlvaine’s medium supplemented with 50 mM lactate (A) or 5% (vol/vol) ethanol (B) at pH 4 to 7. After 1 h at 37°C, cells were serially diluted in McIlvaine’s buffer at pH 7 and viability was determined. Data are averages of at least two independent experiments, the results of which varied by less than 30% for each data point. Symbols: □, mid-exponential phase at pH 7; ▨, mid-exponential phase at pH 5.8; ■, stationary phase.
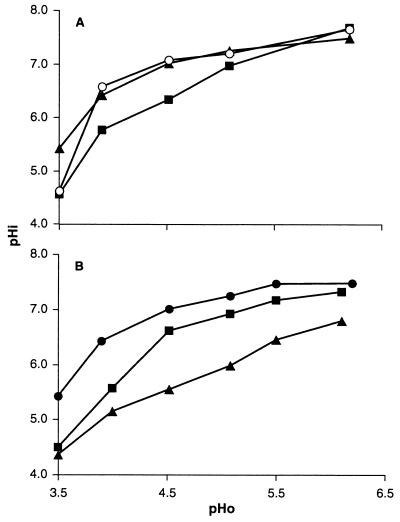
Since survival was attenuated in ethanol and/or lactate, we sought to investigate the mechanisms of inactivation. The cytoplasmic pH of the cells was investigated as described previously (16, 20). Exponential-phase and habituated cells of E. coli 30-2C4 exhibited good pH homeostasis between external pHs of 4.5 and 6.5, but below pH 4.5 there was a decline in cytoplasmic pH that was most marked at pH 3.5 (Fig. 3A). Habituated cells exhibited a higher cytoplasmic pH only at an external pH of 3.5. Stationary-phase cells generally exhibited poorer pH homeostasis, and this was most evident below pH 5. However, at pH 3.5 the cytoplasmic pHs of exponential-phase cells grown at pH 7 and stationary-phase cells were not significantly different (Fig. 3A). Ethanol caused a small but significant lowering of the cytoplasmic pH that was particularly marked below pH 4.5 (Fig. 3B). Lactate reduced the cytoplasmic pH by 0.8 to 1.5 units across the pH range, and it was notable that the cytoplasmic pH value recorded in the presence of either lactate or ethanol at pH 3.5 was the same (Fig. 3B). In the presence of both lactate and ethanol, the cytoplasmic pH was consistently lower than with either compound alone (data not shown). Similar results were obtained with a number of different E. coli strains (data not shown).
FIG. 3.
Maintenance of cytoplasmic pH (pHi) against decreasing extracellular pH (pHo). Strain 30-2C4 was grown in McIlvaine’s medium, harvested, and incubated at 37°C in McIlvaine’s medium at the pH values indicated. (A) Cytoplasmic pH in the absence of either lactate or ethanol. Symbols: ○, mid-exponential-phase cells, ▴, cells habituated by growth at pH 5.8; ■, cells grown into stationary phase. (B) Exponential-phase cells habituated by growth at pH 5.8 were harvested, and the cytoplasmic pH was determined at the pH indicated. Symbols: ●, no additions; ▴, lactate (50 mM); ■, ethanol (5%). Standard deviations varied from 0.02 to 0.25 but were routinely less than 0.06.
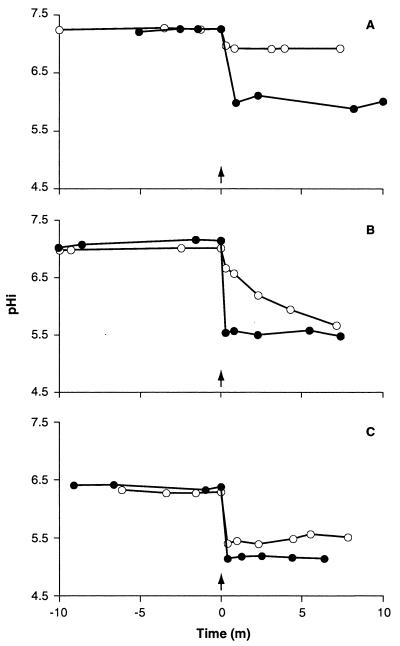
In view of the rapid killing by ethanol and lactate, the kinetics of collapse of the cytoplasmic pH were analyzed (Fig. 4). Lactate caused an immediate drop in cytoplasmic pH (Fig. 4). With habituated cells of E. coli 30-2C4, the final cytoplasmic pHs were approximately 5.9, 5.5, and 5.2 for external pH values of 5.0, 4.5, and 4.0, respectively (Fig. 4). Similar data were obtained with exponential-phase cells grown at pH 7 and with stationary-phase cells (data not shown). The steady-state cytoplasmic pH observed in the presence of lactate was independent of the growth phase (data not shown). At an external pH of 4, the addition of ethanol caused an immediate decline in cytoplasmic pH of at least 1 pH unit (Fig. 4C). In contrast, at pH 4.5, the fall was progressive, but cells eventually reached a steady cytoplasmic pH similar to that seen in lactate-treated cells. At higher external pHs (>4.5), ethanol had only a small effect on cytoplasmic pH (Fig. 4A). Thus, the kinetics of decline of cytoplasmic pH with lactate and ethanol are consistent with rapid killing by these compounds at low pHs.
FIG. 4.
Lowering of cytoplasmic pH by lactate or ethanol. Strain 30-2C4 was grown to mid-exponential phase at pH 5.8, harvested, and incubated at 37°C in McIlvaine’s medium at pH 5 (A), pH 4.5 (B), or pH 4 (C). At the time indicated (arrow), either lactate (50 mM) (●) or ethanol (5%) (○) was added to the medium. Standard deviations were routinely less than 0.02. m, min.
The data presented here establish that the addition of lactate or ethanol, or a combination of these agents, can overcome the acid tolerance of E. coli cells. The addition of either lactate or ethanol alone or in combination collapsed cytoplasmic pH, and this must contribute to the higher rates of cell death. We also establish that habituated cells have a cytoplasmic pH similar to that of cells in exponential phase at pH 7 until extremely low pHs are encountered, where the habituated cells exhibit higher cytoplasmic pH values. These data accord with those of other studies published previously (8). Paradoxically, cells that have entered the stationary phase, which exhibit the highest acid tolerance, have the lowest cytoplasmic pHs. Treatment of these cells with lactate or ethanol is less effective, but the cytoplasmic pH is lower still than for exponential-phase or habituated cells. Thus, lowering the cytoplasmic pH itself is not sufficient to cause cell death; the changes in gene expression and enzyme activity consequent upon entry into stationary phase (2, 22) must override the consequences of the collapse of cytoplasmic pH to a very acidic value.
Recent data suggest that sorbate has a marked ability to perturb membrane structure and that lactate may have similar effects (26, 26a). Similarly, ethanol is a membrane perturbant (13). The observation of the collapse of cytoplasmic pH in the presence of these two agents suggests that ethanol and lactate compromise the permeability to protons and/or the capacity to pump protons out of the cell.
Lactate and ethanol are both acceptable food additives, and combinations may potentiate a reduction in viable bacterial counts in food products. For example, the lower bacterial counts in fermented, compared with nonfermented, apple juice have been attributed to the accumulation of ethanol to approximately 5% (24). In this product, the final pH values were not significantly different (pH 3.3 to 3.8) after fermentation, but the presence of ethanol led to a 7-log-unit kill in 3 days. Weak acids, such as benzoate and sorbate, were not effective, but lactate was not investigated (21). Lactate has previously been suggested to be less effective than acetate, but such studies investigated higher pH ranges (1, 5, 14, 27). Our study shows that lactate can be very effective at low pHs and that its efficacy can be improved by using lactate-ethanol mixtures.
Acknowledgments
We thank Jonathan Marks for technical assistance.
This work was funded by the Ministry of Agriculture, Fisheries, and Food (Reading Group) and by the Department of Health (Aberdeen Group).
REFERENCES
- 1.Abdul-Raouf U M, Beuchat L R, Ammar M S. Survival and growth of Escherichia coli O157:H7 in ground, roasted beef as affected by pH, acidulants, and temperature. Appl Environ Microbiol. 1993;59:2364–2368. doi: 10.1128/aem.59.8.2364-2368.1993. [DOI] [PMC free article] [PubMed] [Google Scholar]
- 2.Bearson B, Bearson B, Foster J W. Acid stress responses in enterobacteria. FEMS Microbiol Lett. 1997;147:173–180. doi: 10.1111/j.1574-6968.1997.tb10238.x. [DOI] [PubMed] [Google Scholar]
- 3.Benjamin M M, Datta A T. Acid tolerance of enterohemorrhagic Escherichia coli. Appl Environ Microbiol. 1995;61:1669–1672. doi: 10.1128/aem.61.4.1669-1672.1995. [DOI] [PMC free article] [PubMed] [Google Scholar]
- 4.Booth I R. Regulation of cytoplasmic pH in bacteria. Microbiol Rev. 1985;49:359–378. doi: 10.1128/mr.49.4.359-378.1985. [DOI] [PMC free article] [PubMed] [Google Scholar]
- 5.Connor D E, Kotrola J S. Growth and survival of Escherichia coli O157:H7 under acidic conditions. Appl Environ Microbiol. 1995;61:382–385. doi: 10.1128/aem.61.1.382-385.1995. [DOI] [PMC free article] [PubMed] [Google Scholar]
- 6.Davis M J, Coote P J, O’Byrne C P. Acid tolerance in Listeria monocytogenes: the adaptive acid tolerance response (ATR) and growth-phase dependent acid resistance. Microbiology. 1996;142:2975–2982. doi: 10.1099/13500872-142-10-2975. [DOI] [PubMed] [Google Scholar]
- 7.Ferguson G P, Creighton R I, Nikolaev Y, Booth I R. The importance of RpoS and Dps in the survival of both exponential- and stationary-phase Escherichia coli cells against the electrophile N-ethylmaleimide. J Bacteriol. 1998;180:1030–1036. doi: 10.1128/jb.180.5.1030-1036.1998. [DOI] [PMC free article] [PubMed] [Google Scholar]
- 8.Foster J W, Hall H K. Inducible pH homeostasis and the acid tolerance response of Salmonella typhimurium. J Bacteriol. 1991;173:5129–5135. doi: 10.1128/jb.173.16.5129-5135.1991. [DOI] [PMC free article] [PubMed] [Google Scholar]
- 9.Garren M G, Harrison M A, Russell S M. Retention of acid tolerance and acid shock responses of Escherichia coli O157:H7 and non-O157:H7 isolates. J Food Prot. 1997;60:1478–1482. doi: 10.4315/0362-028X-60.12.1478. [DOI] [PubMed] [Google Scholar]
- 10.Goodson M, Rowbury R J. Habituation to normally lethal acidity by prior growth of Escherichia coli at a sub-lethal pH value. Lett Appl Microbiol. 1989;8:77–79. [Google Scholar]
- 11.Hengge-Aronis R. Survival of hunger and stress—the role of rpoS in early stationary phase gene regulation in E. coli. Cell. 1993;72:165–168. doi: 10.1016/0092-8674(93)90655-a. [DOI] [PubMed] [Google Scholar]
- 12.Hickey E W, Hirshfield I R. Low-pH-induced effects on patterns of protein synthesis and on internal pH in Escherichia coli and Salmonella typhimurium. Appl Environ Microbiol. 1990;56:1038–1045. doi: 10.1128/aem.56.4.1038-1045.1990. [DOI] [PMC free article] [PubMed] [Google Scholar]
- 13.Ingram L O, Buttke T M. Effects of alcohols on microorganisms. Adv Microb Physiol. 1984;25:253–300. doi: 10.1016/s0065-2911(08)60294-5. [DOI] [PubMed] [Google Scholar]
- 14.Ita P S, Hutkins R W. Intracellular pH and survival of Listeria monocytogenes Scott A in tryptic soy broth containing acetic, lactic, citric, and hydrochloric acids. J Food Prot. 1991;54:15–19. doi: 10.4315/0362-028X-54.1.15. [DOI] [PubMed] [Google Scholar]
- 15.Jay J M. Modern food microbiology. New York, N.Y: Chapman and Hall; 1992. [Google Scholar]
- 16.Kroll R G, Booth I R. The role of potassium transport in the generation of a pH gradient in Escherichia coli. Biochem J. 1981;198:691–698. doi: 10.1042/bj1980691. [DOI] [PMC free article] [PubMed] [Google Scholar]
- 17.Lee S, Slonczewski J L, Foster J W. A low-pH-inducible, stationary phase acid tolerance response in Salmonella typhimurium. J Bacteriol. 1994;176:1422–1426. doi: 10.1128/jb.176.5.1422-1426.1994. [DOI] [PMC free article] [PubMed] [Google Scholar]
- 18.Leyer G L, Wang L-L, Johnson E A. Acid adaptation of Escherichia coli O157:H7 increases survival in acidic foods. Appl Environ Microbiol. 1995;61:3752–3755. doi: 10.1128/aem.61.10.3752-3755.1995. [DOI] [PMC free article] [PubMed] [Google Scholar]
- 19.Lin J, Smith M P, Chapin K C, Baik H S, Bennett G N, Foster J W. Mechanisms of acid resistance in enterohemorrhagic Escherichia coli. Appl Environ Microbiol. 1996;62:3094–3100. doi: 10.1128/aem.62.9.3094-3100.1996. [DOI] [PMC free article] [PubMed] [Google Scholar]
- 20.McLaggan D, Naprstek J, Buurman E T, Epstein W. Interdependence of K+ and glutamate accumulation during osmotic adaptation of Escherichia coli. J Biol Chem. 1994;269:1911–1917. [PubMed] [Google Scholar]
- 21.Miller L M, Kaspar C W. Escherichia coli O157:H7 acid tolerance and survival in apple cider. J Food Prot. 1994;57:460–464. doi: 10.4315/0362-028X-57.6.460. [DOI] [PubMed] [Google Scholar]
- 22.Olson E R. Influence of pH on bacterial gene expression. Mol Microbiol. 1993;8:5–14. doi: 10.1111/j.1365-2958.1993.tb01198.x. [DOI] [PubMed] [Google Scholar]
- 23.Raja N, Goodson M, Chui W C M, Smith D G, Rowbury R J. Habituation to acid in Escherichia coli: conditions for habituation and its effect on plasmid transfer. J Appl Bacteriol. 1991;70:59–65. doi: 10.1111/j.1365-2672.1991.tb03787.x. [DOI] [PubMed] [Google Scholar]
- 24.Semanchek J J, Golden D A. Survival of Escherichia coli O157:H7 during fermentation of apple cider. J Food Prot. 1996;59:1256–1259. doi: 10.4315/0362-028X-59.12.1256. [DOI] [PubMed] [Google Scholar]
- 25.Shelef L A. Antimicrobial effects of lactates: a review. J Food Prot. 1994;57:445–450. doi: 10.4315/0362-028X-57.5.445. [DOI] [PubMed] [Google Scholar]
- 26.Stratford M, Anslow P A. Evidence that sorbic acid does not inhibit yeast as a “classic weak-acid preservative.”. Lett Appl Microbiol. 1998;27:203–206. doi: 10.1046/j.1472-765x.1998.00424.x. [DOI] [PubMed] [Google Scholar]
- 26a.Stratford, M. Personal communication.
- 27.Young K M, Foegeding P M. Acetic, lactic and citric acids and pH inhibition of Listeria monocytogenes Scott A and the effect on intracellular pH. J Appl Bacteriol. 1993;74:515–520. [PubMed] [Google Scholar]


