

Abstract
Objective:
To examine trajectories of satisfaction with life (SWL) of burn survivors over time and their clinical, demographic, and other predictors.
Design:
Longitudinal survey.
Setting:
Not applicable.
Participants:
Individuals ≥18 years of age who underwent burn-related surgery and met one of the following criteria: (1) >10% total body surface area (TBSA) burn and ≥65 years of age; (2) >20% TBSA burn and 18 to 64 years of age; (3) electrical high voltage/lightning injury; or (4) burn injury to the hands, face, or feet. The participants (N=378) had data on all variables of interest and were included in the analyses.
Interventions:
Not applicable.
Main Outcome Measure:
Satisfaction With Life Scale.
Results:
Growth mixture modeling identified 2 classes with different trajectories of SWL. The mean SWL of the unchanged class (n=224, 60%) was flat over 2 years with high initial SWL scores. The SWL of the dissatisfied class (n=154, 40%) was at the low end of average and got progressively worse over time.
Conclusions:
SWL after burn injury can be described by 2 different trajectories with substantially different outcomes. Older age, worse mental health, and unemployment prior to injury predicted membership in the dissatisfied class. Additional services could be provided to those at high risk for low SWL to achieve better outcomes.
Keywords: Burns, Quality of life, Rehabilitation, Statistical models
With increased survival rates among people with burn injury, postinjury health-related quality of life (HRQOL) has become an important aspect of burn research.1 Prior studies have examined complications after burn injuries because of contractures, hyper-trophic scarring, muscle weakness, heterotopic ossification, amputations, nervous system injury, difficulty with thermoregulation and pruritus,2 and specific aspects of HRQOL.3 HRQOL postburn injury has also been compared with general population samples, and changes over time have been examined. However, differences in trajectories of HRQOL postburn injury for different patient subgroups have been understudied, and research to date has only examined potential differences because of severity of burn4,5 or age at time of injury.6
Satisfaction with life (SWL) is a global indicator of well-being that measures people’s perception of overall quality of life (QOL) and is influenced by a broad range of factors. Because burns can be complex injuries7 that can affect many facets of life, including physical, psychological, and social,8 SWL is a useful construct for tracking well-being in people with burn injury. Past research on SWL in burn injury has indicated that several characteristics, including mental health,9,10 level of functioning,11 changes to appearance,2 longer number of days in the intensive care unit,12 burn-related amputation,12 and marital status,12 have all been shown to have an effect on SWL and other aspects of HRQOL. However, previous research on SWL has assumed that burn survivors were homogeneous in terms of SWL trajectory and that one mean trajectory represents all burn survivors.13 Although treating burn survivors as a homogeneous group can provide important insights into the most common burn survivor trajectory, there may be underlying differences worth exploring. It is also possible that burn survivor trajectories are defined not by one characteristic, but by some combination of demographic and clinical characteristics.
In this study, we aim to answer the following research questions: (1) Does 1 mean trajectory best represent the SWL of burn survivors or is there >1 trajectory that better describes SWL over time? (2) How do different clinical, demographic, and other characteristics affect the initial level of SWL and changes in SWL over time in burn survivors?
Methods
Participants
Participant data were accessed through the National Institute on Disability, Independent Living, and Rehabilitation Research–funded Burn Model System (BMS) National Longitudinal Database. For inclusion in the BMS National Database, individuals must have undergone burn-related surgery and meet one of the following criteria: (1) >10% total body surface area (TBSA) burn and ≥65 years of age; (2) >20% TBSA burn and 0 to 64 years of age; (3) electrical high voltage/lightning injury; or (4) burn injury to the hand, face, or feet. For the current study, only adults ≥18 years of age with complete data on the main outcome of interest (ie, SWL) collected between 1993 and 2015 were included in analyses. Additional information on the database, such as follow-up strategies and data verification processes, is described in detail in published literature14 and online (available at: http://burndata.washington.edu/standard-operating-procedures/). All data are collected using procedures approved by each clinical center’s institutional review board.
The statistical methodology used removes all cases with missing data on predictors, resulting in reduction of the sample size.15 To examine differences between those included in the analyses and the larger population of consented adult participants in the BMS database, we compared the samples on TBSA burned, length of inpatient hospital stay, age, sex, employment, and ethnicity.
Measures
The primary outcome in this study was SWL. Predictors previously reported to be associated with SWL12,13 and available in the database were included in the model. Additional variables not included in previous SWL studies were also included in the model as predictors when available in the dataset and authors’ clinical experience suggested that they may be related to SWL. Demographic variables (age, sex, ethnicity, and employment), clinical variables (TBSA, visible burn, postburn hospital length of stay, heterotopic ossification, and burn-related amputation), and health or treatment measures (mental and physical health, satisfaction with appearance, pain, prior alcohol or drug abuse, and prior psychiatric treatment) were modeled as predictors of SWL.
Satisfaction with life
SWL was measured using the Satisfaction With Life Scale (SWLS).16 The SWLS contains items measuring a global evaluation of one’s life, and is widely used in HRQOL research. It has been used in burn research12,13 and is currently a National Institutes of Health Common Data Element for general life satisfaction for rehabilitation populations with moderate to severe disabilities.17,18 Studies of the SWLS have reported adequate psychometric properties19,20; however, a recent study has questioned the appropriateness and properties of one of the scale’s items for use in populations with traumatic injury.21 Items are summed and scores range from 5 to 35, with higher scores indicating greater satisfaction. Total summary SWLS scores are assigned qualitative grades by increments of 5 points (eg, 5–9 indicates extremely dissatisfied; 31–35 indicates extremely satisfied).
Participants were invited to respond to the SWLS 4 times. The first response was to provide a retroactive report of SWL prior to the burn injury at discharge, referred to as preinjury SWL. Thereafter, SWLS scores were collected at 6, 12, and 24 months postinjury.
Demographic, health, and clinical variables
Sex (0 [female] or 1 [male]), ethnicity (0 [nonwhite] or 1 [white]), employment status at time of injury (0 [unemployed] or 1 [employed]), psychiatric treatment prior to injury (0 [no] or 1 [yes]), and alcohol abuse (0 [no] or 1 [yes]) or drug abuse (0 [no] or 1 [yes]) prior to injury were collected via self-report at time of discharge. Other variables were collected at discharge from medical records, including date of birth and burn (used to calculate age at time of injury), burn location, length of hospital stay (in days), percent TBSA, amputation related to burn injury (0 [no] or 1 [yes]), and presence of heterotopic ossification (0 [no] or 1 [yes]). Burn location was recoded to indicate whether the burn was visible while wearing clothing or not (0 [not visible] or 1 [visible]). Satisfaction with appearance was measured using the Satisfaction With Appearance Scale (SWAP) developed by Lawrence et al22 for use with individuals with a burn injury. Total scores range from 12 to 84 points, with higher scores indicate greater dissatisfaction. SWAP scores were collected at discharge and at 6, 12, and 24 months postinjury. The Physical Component Summary (PCS) and Mental Component Summary (MCS) scores of the 12-Item Short Form Health Survey (SF-12) were used to measure QOL-related physical and mental health.23 The SF-12 is one of the most commonly used patient-reported outcome measures, and scores are on the T metric with a population mean of 50, and higher scores indicate better QOL-related health. The SF-12 domains are well understood and have been used by burn researchers and clinicians to evaluate QOL in people admitted to burn centers.24,25 The related Medical Outcomes Study 36-Item Short-Form Health Survey has also been validated for use in burns.26 Both the PCS and MCS were measured at time of hospital discharge. Pain in the last 7 days was measured at discharge using a numerical rating scale of average pain intensity, with scores ranging from 0 to 10.
Analysis
Descriptive statistics
Means and SDs were calculated for continuous variables, and frequencies and percentages were calculated for dichotomous variables.
Rescaling variables
Growth mixture modeling (GMM) is a computationally complex procedure, and the modeling software often has difficulty converging to a proper solution when there are a number of variables on different metrics.27,28 To aid in convergence, all covariates were rescaled to fall between 0 and 1. All variables were divided by either their maximum value in the data, or their maximum theoretical value. This method was chosen for ease of implementation and interpretation and was based on published recommendations.27 For instance, the PCS, MCS, and length of hospital stay were divided by the maximum observed score in the data (62.74, 78.90, and 186, respectively). Pain intensity and SWAP scores were divided by their maximum possible value (10 and 76, respectively). TBSA burned and age were both divided by 100.
Growth mixture modeling
GMM was used to analyze the SWL trajectories.29 GMM is a person-centered analysis used to examine the presence of subgroups of individuals, based on the shape of the longitudinal trajectory. Traditional analysis of growth trajectories assumes that all individuals follow the same pattern (eg, all improve or decline).28 GMM evaluates the presence of different subgroups, referred to as classes, within the sample, each with a different trajectory shape. The effect of predictors on both the intercept and slope of each trajectory and on class membership can be estimated, providing a description of differences between classes. This is important if a class that represents a problematic outcome (eg, a class with low SWL postinjury) is identified because the predictors of people in that class can be compared with predictors of classes with better outcomes, and appropriate interventions can be developed to identify people at risk for problematic outcomes.
The analysis was completed in Mplus v7.415,a using maximum likelihood estimation with robust SEs, the default estimator in Mplus. This estimator adjusts SEs when the data have some degree of kurtosis, but are still multivariate normal.
The full model that included the SWL at 4 time points as an outcome variable and all predictors was used to determine the number of classes present in the data.30,31 Increasing number of classes were specified to determine the number of latent classes that best describes the data. The predictors were regressed on the intercept and slope of each class, with the estimates free to vary between classes. The logistic regression of the covariates on class membership provided an estimate of how well each variable predicts class membership.
Multiple indicators of the appropriate number of classes are recommended,32 including the Bayesian information criterion, the sample size–adjusted Bayesian information criterion, the Lo-Mendell-Rubin likelihood ratio test, the parametric bootstrapped likelihood ratio test, entropy values, and the clinical relevance of the classes. Lower information criterion values indicate a better model and a significant Lo-Mendell-Rubin likelihood ratio test. Entropy is a measure of classification accuracy, or how well the model does in placing individuals into classes. Higher values (>.70) suggest a better model. The combination of all this information is used to select the number of classes that best represent the data.
Once the number of classes is selected, the final model is examined. The model estimates of most interest include the significance and magnitude of the effect of the covariates on the intercept and slope of each trajectory, the multinomial logistic regression of class membership on the covariates, and class membership probabilities for each individual.
Power to determine the number of classes by growth mixture models is difficult to estimate because of the complexity of the models and the number of parameters. The number of repeated observations is often more important for power consideration than the number of cases included.33 The results from the study by Nylund et al32 indicate that a sample size of 378 is sufficient to determine the number of classes with a reasonable level of certainty.
Results
Participants
A total of 3587 individuals ≥18 years of age were consented and included in the BMS database during the time period of this study; however, only 427 had complete data on SWL at all timepoints. SWL data were missing for several reasons including loss to follow-up (n=1618), death because of burn-related or non–burn-related complications (n=55), withdrew or refused follow-up (n=104), unable to respond (n=40), and medical record data collection only (n=1343) (ie, no self-report measures were collected). Of the 427 patients, 378 people with burn injury were used for the analysis because they had complete data on SWL and on all predictors of interest. Descriptive statistics at discharge are available in table 1. Compared with the 3209 individuals in the BMS database excluded because of missing SWL or predictor data, the study sample had significantly higher mean TBSA (22.1% vs 18.1%, respectively; t3535 = −4.42; P<.001), mean length of hospital stay (32.2 vs 27.8d, respectively; t3559=−2.46; P=.01), and mean age at time of injury (45.1 vs 42.1y, respectively; t3576=−3.51; P<.001). Individuals in the model were also more likely to be employed (79.1%) than those excluded (72.4%) (; P<.01). No statistically significant differences were observed in sex or ethnicity.
Table 1.
Descriptive statistics of study sample (N=378)
| Characteristic | Value |
|---|---|
| SWLS score preinjury (collected at discharge) | 25.76±7.401 |
| SWLS score at 6mo | 21.44±8.46 |
| SWLS score at 12mo | 21.74±8.58 |
| SWLS score at 24mo | 22.23±8.49 |
| Age at injury, y | 45.08±15.75 |
| TBSA | 22.14±18.03 |
| Length of hospital stay, d | 32.19±25.98 |
| MCS at discharge | 48.69±11.51 |
| PCS at discharge | 32.52±10.04 |
| SWAP score at discharge | 26.56±17.12 |
| Pain intensity at discharge | 5.05±2.82 |
| Sex | |
| Female | 103 (27.2) |
| Male | 275 (72.8) |
| Ethnicity | |
| Nonwhite | 136 (36.0) |
| White | 242 (64.0) |
| Employment status preinjury | |
| Unemployed | 79 (20.9) |
| Employed | 299 (79.1) |
| Visible burn | |
| Nonvisible | 52 (13.8) |
| Visible | 326 (86.2) |
| Previous alcohol abuse | |
| No | 341 (90.2) |
| Yes | 37 (9.8) |
| Previous drug abuse | |
| No | 350 (92.6) |
| Yes | 28 (7.4) |
| Psychiatric treatment | |
| No | 344 (91.0) |
| Yes | 34 (9.0) |
| Heterotopic ossification | |
| No | 353 (93.4) |
| Yes | 25 (6.6) |
| Amputation | |
| No | 346 (91.5) |
| Yes | 32 (8.5) |
NOTE. Values are mean ± SD or n (%). All variables except for SWLS score collected only at discharge.
Model selection
After standard procedures,30 a model including all the hypothesized predictors was used to determine the optimal number of classes. First, a model with 1 latent class was specified. This model assumes 1 mean trajectory represents all people in the sample. The model fit indices for the 1 trajectory model were poor (root mean square error of approximation, .121; comparative fit index, .766; Tucker-Lewis index, .556), and the residual variances for the intercept (ie, mean SWL preinjury score) and slope (ie, shape of the trajectory over time) were both significant, suggesting heterogeneity in SWL trajectories. Next, GMM with increasing number of classes was specified and evaluated. The 2-class model was selected because the Bayesian information criterion was smaller, the entropy was strong, clinical interpretation of the model was relevant, and the 3- and 4-class models failed to converge at a proper solution (table 2).
Table 2.
Fit statistics for growth mixture model selection
| Classes | Covariates | Free Parameters | LL | BIC | ΔBIC | Adj. BIC | ΔAdj. BIC | Entropy | BLRT | Class 1 (n) | Class 2 (n) | Class 3 (n) |
|---|---|---|---|---|---|---|---|---|---|---|---|---|
| 1 | 9 | 27 | 23,064.67 | – | 22,978.9 | – | – | – | – | – | – | |
| 2 | 9 | 57 | −5213.99 | 10,769.34 | 12,295.33 | 10,588.48 | 12,390.43 | 0.843 | 0.022 | 220 | 179 | – |
| 3 | 9 | 87 | −5163.74 | 10,848.53 | −79.187 | 10,572.47 | 16.004 | 0.84 | 0.371 | 206 | 122 | 71 |
Abbreviations: Adj., adjusted; BIC, Bayesian information criterion; BLRT, bootstrap likelihood ratio test; LL, log likelihood.
Model results
Model selection procedures resulted in a model with 2 classes. In class 1 (n=224, 60%), the mean trajectory was flat over 2 years with high initial SWL scores on average (fig 1). We refer to this class as unchanged. The second class (n=154, 40%) had below average SWL and a trajectory of SWL that progressively worsened over time. We refer to this class as dissatisfied. Full model results are found in table 3.
Fig 1.
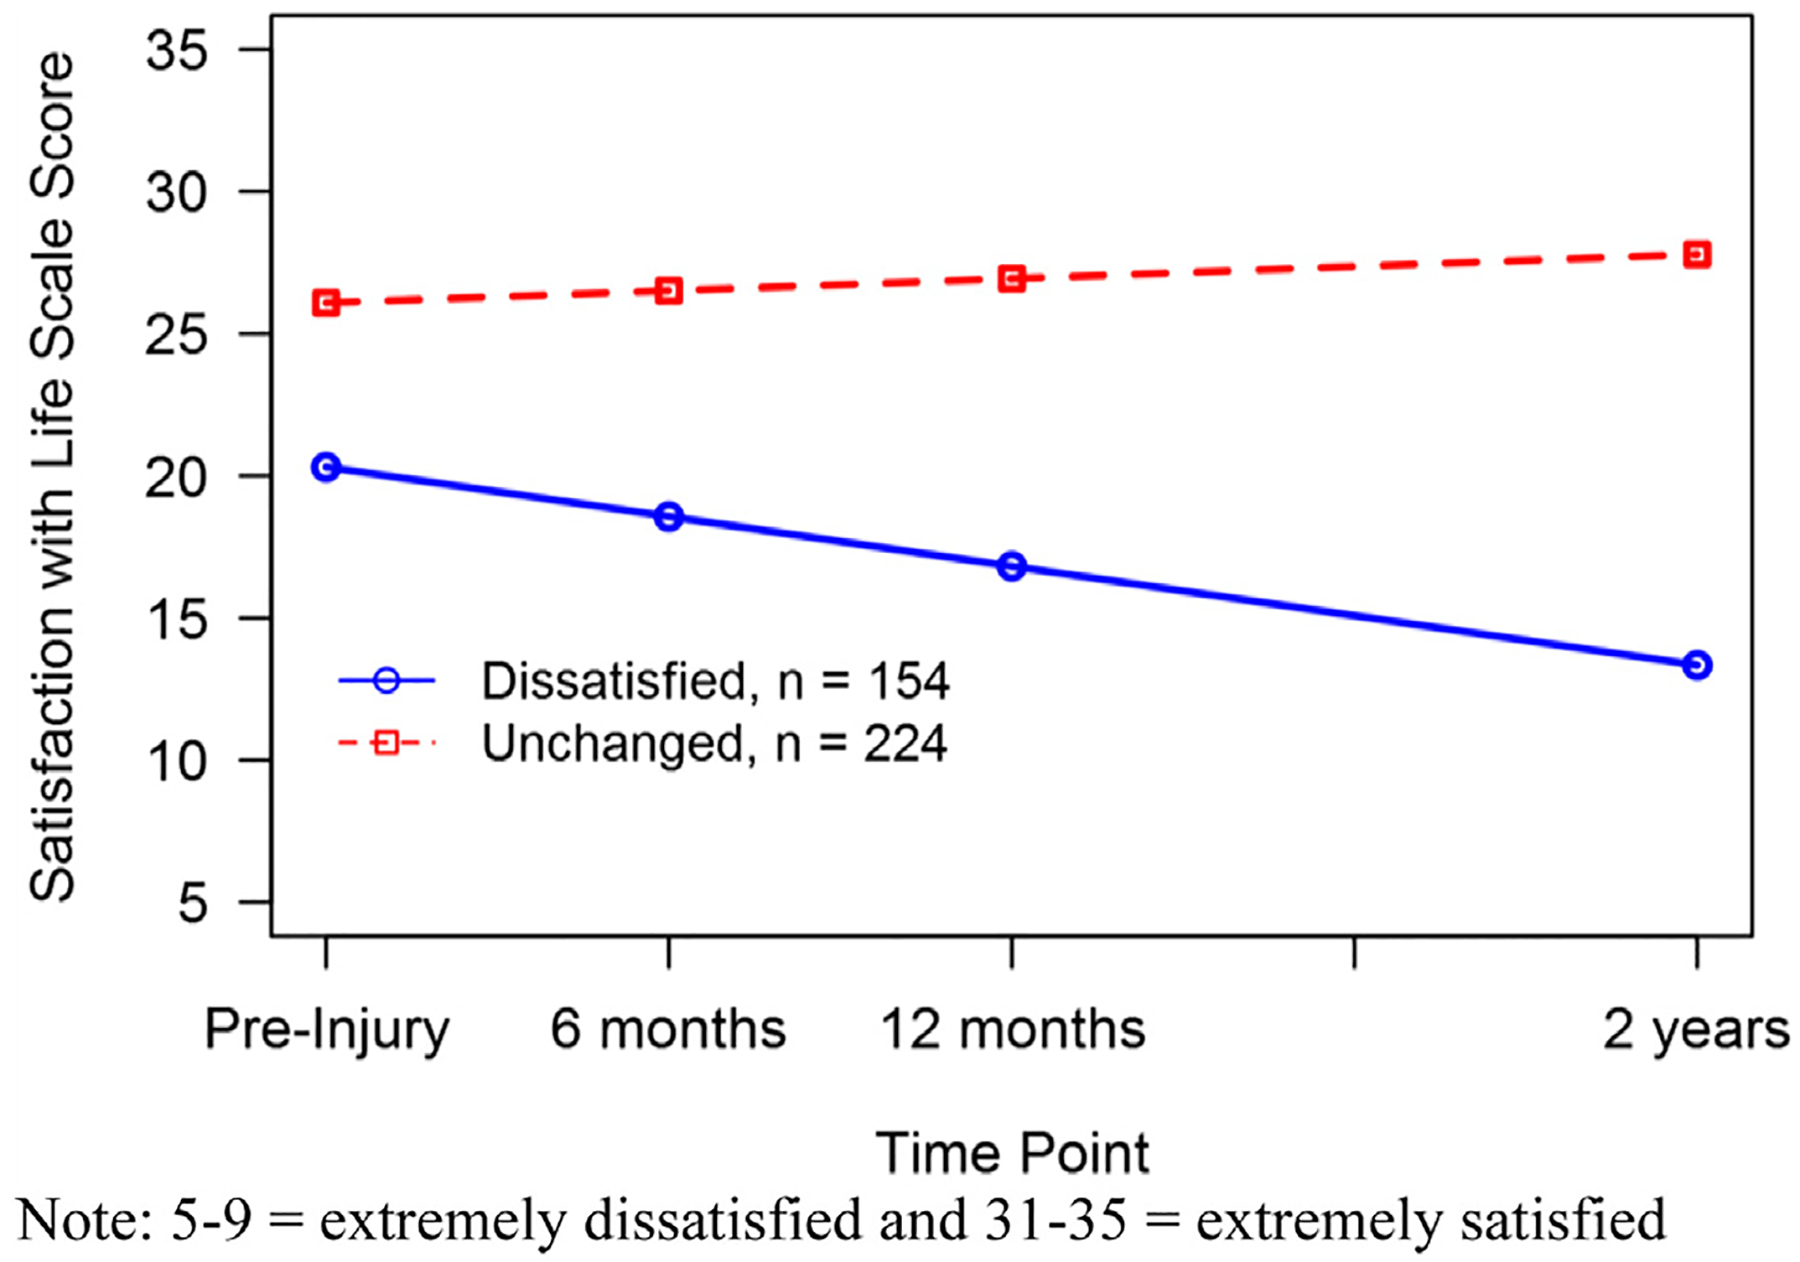
SWL class trajectories of burn survivors from preinjury to 2 years postinjury (N=378). Scores of 5 to 9 indicate extremely dissatisfied and 31 to 35 indicate extremely satisfied.
Table 3.
Statistics and characteristics of the 2-class growth mixture model
| Class 1: Unchanged (n = 224) | Class 2: Dissatisfied (n = 154) | |||||||||||
|---|---|---|---|---|---|---|---|---|---|---|---|---|
| Intercept | Slope | Intercept | Slope | |||||||||
| Characteristic | Loading | SE | P | Loading | SE | P | Loading | SE | P | Loading | SE | P |
| White ethnicity | 0.14 | 0.08 | NA | −0.03 | 0.16 | NA | −0.25 | 0.13 | NA | 0.30 | 0.24 | NA |
| Male sex | −0.11 | 0.09 | NA | −0.03 | 0.15 | NA | −0.31 | 0.13 | * | 0.15 | 0.21 | NA |
| TBSA | 0.15 | 0.08 | NA | −0.05 | 0.19 | NA | 0.24 | 0.19 | NA | −0.08 | 0.32 | NA |
| Age at injury | 0.03 | 0.07 | NA | 0.07 | 0.16 | NA | −0.27 | 0.12 | * | 0.52 | 0.24 | * |
| MCS at discharge | 0.13 | 0.08 | NA | −0.22 | 0.19 | NA | 0.05 | 0.16 | NA | −0.06 | 0.24 | NA |
| PCS at discharge | 0.12 | 0.08 | NA | 0.18 | 0.18 | NA | 0.15 | 0.13 | NA | −0.11 | 0.22 | NA |
| Visible burn | 0.00 | 0.08 | NA | 0.14 | 0.17 | NA | 0.17 | 0.12 | NA | −0.07 | 0.21 | NA |
| Previous alcohol abuse | −0.02 | 0.10 | NA | 0.07 | 0.19 | NA | 0.15 | 0.12 | NA | −0.41 | 0.20 | NA |
| Previous drug abuse | −0.36 | 0.10 | † | 0.48 | 0.27 | NA | −0.22 | 0.15 | NA | 0.37 | 0.23 | NA |
| Previous psychiatric treatment | −0.38 | 0.09 | † | 0.14 | 0.20 | NA | −0.22 | 0.11 | * | −0.12 | 0.17 | NA |
| Employed prior to injury | 0.09 | 0.08 | NA | −0.28 | 0.20 | NA | 0.19 | 0.13 | NA | −0.63 | 0.27 | * |
| Length of hospital stay | −0.36 | 0.10 | † | 0.34 | 0.26 | NA | −0.28 | 0.20 | NA | 0.32 | 0.36 | NA |
| SWAP score | −0.12 | 0.10 | NA | 0.08 | 0.23 | NA | −0.44 | 0.16 | ‡ | 0.02 | 0.27 | NA |
| PI at discharge | −0.05 | 0.09 | NA | 0.05 | 0.18 | NA | −0.26 | 0.15 | NA | 0.19 | 0.23 | NA |
| HO | 0.08 | 0.08 | NA | −0.10 | 0.16 | NA | 0.16 | 0.13 | NA | −0.02 | 0.22 | NA |
| Amputation | −0.13 | 0.07 | NA | −0.07 | 0.18 | NA | −0.08 | 0.11 | NA | 0.00 | 0.14 | NA |
| I with S | −0.26 | 0.46 | NA | NA | NA | NA | −0.26 | 0.46 | NA | NA | NA | NA |
| Estimated means | 26.09 | 0.48 | † | 0.86 | 0.24 | † | 20.30 | 0.71 | † | −3.48 | 0.38 | † |
| R 2 | Estimate | SE | P | Estimate | SE | P |
|---|---|---|---|---|---|---|
| Discharge | 0.41 | 0.05 | † | 0.36 | 0.07 | † |
| 6mo | 0.36 | 0.05 | † | 0.32 | 0.06 | † |
| 1y | 0.36 | 0.04 | † | 0.33 | 0.05 | † |
| 2y | 0.60 | 0.19 | ‡ | 0.64 | 0.16 | † |
| Intercept | 0.71 | 0.10 | † | 0.64 | 0.11 | † |
| Slope | 0.77 | 0.68 | NA | 0.82 | 0.58 | NA |
Abbreviations: HO, heterotopic ossification; I, intercept; NA, not applicable; PI, pain intensity score; S, slope.
P<.05.
P<.001.
P<.01.
The multinomial logistic regression identified age at time of burn, QOL-related mental health at hospital discharge, and preinjury employment status as significant indicators of class membership, using the dissatisfied group as the reference. For an SD increase in age (about 16y), the odds of membership in the unchanged group were 92% lower than being in the dissatisfied group (ie, older burn survivors were more likely to belong to the dissatisfied group). Employment prior to the injury increased the odds of membership in the unchanged group 216% over the dissatisfied group. A 1 SD increase in QOL-related mental health (about 12 points) resulted in the odds of membership in the unchanged group being 17 times higher than the dissatisfied group (see table 4 for logistic regression results). The descriptive statistics by class membership are provided in table 5. The dissatisfied class included more women, more people who identified as white, more people with visible burns, and more people with heterotopic ossification; however, the differences were not statistically significantly different between the classes.
Table 4.
Multinomial logistic regression of the covariates on class membership using the dissatisfied class as a reference
| Class 2 | Coefficient | SE | P | OR |
|---|---|---|---|---|
| White ethnicity | −0.412 | 0.37 | NA | 0.66 |
| Male sex | −0.017 | 0.331 | NA | 0.98 |
| TBSA | −0.55 | 1.109 | NA | 0.58 |
| Age at injury | −2.494 | 1.127 | * | 0.08 |
| MCS at discharge | 2.856 | 1.065 | † | 17.39 |
| PCS at discharge | 0.241 | 1.044 | NA | 1.27 |
| Visible burn | −0.151 | 0.456 | NA | 0.86 |
| Previous alcohol abuse | 0.455 | 0.525 | NA | 1.58 |
| Previous drug abuse | −0.259 | 0.677 | NA | 0.77 |
| Previous psychiatric treatment | 0.548 | 0.515 | NA | 1.73 |
| Employed preinjury | 1.146 | 0.354 | † | 3.15 |
| Hospital stay duration | −1.459 | 1.362 | NA | 0.23 |
| SWAP score | −1.423 | 0.975 | NA | 0.24 |
| Pain intensity at discharge | −0.585 | 0.619 | NA | 0.56 |
| HO | −0.218 | 0.815 | NA | 0.80 |
| Amputation | 0.081 | 0.669 | NA | 1.08 |
Abbreviations: HO, heterotopic ossification; NA, not applicable; OR, odds ratio.
P<.05.
P<.01.
Table 5.
Descriptive statistics by class
| Characteristic | Unchanged (n = 224) | Dissatisfied (n = 154) | Significance |
|---|---|---|---|
| SWLS score at preinjury (collected at discharge) | 27.79±6.48 | 22.80±7.68 | 6.8*,† |
| SWLS score at 6mo | 25.18±7.02 | 15.99±7.36 | −12.3*,† |
| SWLS score at 1y | 26.12±6.57 | 15.36±7.04 | −15.2*,† |
| SWLS score at 2y | 28.16±4.43 | 13.61±4.76 | −30.4*,† |
| Age at injury | 43.58±16.73 | 47.27±13.96 | 2.25†,‡ |
| TBSA | 21.13±17.10 | 23.61±19.27 | −1.3† |
| Hospital stay duration | 30.39±24.93 | 34.82±27.30 | −1.6† |
| MCS at discharge | 50.99±10.60 | 45.33±11.99 | −4.8*,† |
| PCS at discharge | 32.99±10.12 | 31.83±9.91 | −1.1† |
| SWAP score | 23.56±15.93 | 30.92±17.88 | 4.19*,† |
| Pain intensity at discharge | 4.83±2.70 | 5.38±2.97 | 1.9† |
| Sex | |||
| Female | 53 (24) | 50 (32) | 3.6§ |
| Male | 171 (76) | 104 (68) | |
| Ethnicity | |||
| Nonwhite | 85 (38) | 51 (33) | 0.9§ |
| White | 139 (62) | 103 (67) | |
| Employment status preinjury | |||
| Unemployed | 31 (14) | 48 (31) | 16.6*,§ |
| Employed | 193 (86) | 106 (69) | |
| Visible burn | |||
| Nonvisible | 33 (15) | 19 (12) | 0.4§ |
| Visible | 191 (85) | 135 (88) | |
| Previous alcohol abuse | |||
| No | 203 (91) | 138 (90) | 0.1§ |
| Yes | 21 (9) | 16 (10) | |
| Previous drug abuse | |||
| No | 209 (93) | 141 (92) | 0.4§ |
| Yes | 15 (7) | 13 (8) | |
| Previous psychiatric treatment | |||
| No | 204 (91) | 140 (91) | 0.003§ |
| Yes | 20 (9) | 14 (9) | |
| Heterotopic ossification | |||
| No | 212 (95) | 141 (92) | 1.4§ |
| Yes | 12 (5) | 13 (8) | |
| Amputation | |||
| No | 205 (92) | 141 (92) | <0.01§ |
| Yes | 19 (8) | 13 (8) |
NOTE. Values are mean ± SD, n (%), or as otherwise indicated.
P<.001.
Significance t376.
P<.05.
Significance tested by t-test (t376).
Predictors were regressed on the intercept and slope of each trajectory separately. For the unchanged group, drug abuse and psychological treatment prior to burn injury were associated with lower preinjury SWL, as was a longer hospital stay. None of the included predictors had a significant effect on the slope of the unchanged group’s average trajectory (see table 3).
In the dissatisfied class we found a different relationship between predictors and change over time. Sex, age at injury, previous psychiatric treatment, and SWAP scores were negatively significantly related to initial SWL. Being a man, being older, having undergone previous psychiatric treatment, and having lower satisfaction with appearance were associated with lower preinjury SWL. The slope of the dissatisfied class was significantly related to age at injury and preinjury employment status. For members of the dissatisfied group, older age was associated with less decline in SWL, whereas being employed prior to injury was associated with more decline in SWL over time (see table 3).
The amount of variance in SWL scores accounted for at each time point for each class (R2) ranged from .32 to .64. The model explained more variance at the final time point, and values were generally higher for the unchanged group. The model also accounted for the variation in the intercepts and slopes for each class, with R2 values ranging from .64 to .82 (see table 3).
Discussion
The results of this study indicate that recovery from burn injury can be described by 2 trajectories with substantially different outcomes.
Most burn survivors evaluated (60%) maintain a healthy SWL up to the 2 years after discharge from the hospital. The members of the unchanged class tended to be younger at time of injury, employed prior to their injury, and have higher QOL-related mental health at time of discharge. These findings corroborate the importance of evaluating psychiatric history and monitoring throughout recovery and beyond.9 For the members of the unchanged class, a history of drug abuse, previous psychological treatment, and longer hospital stay were associated with lower SWL.
The members of the dissatisfied class (about 40% of the sample) reported on average significantly lower SWL than those in the unchanged class, and their SWL continued to decline over the 2 years postinjury. In the dissatisfied class, lower initial SWL was related to being older, being a man, being less satisfied with appearance, and having previous psychiatric treatment. Although people who were employed prior to injury were more likely to belong to the unchanged class, members of the dissatisfied class who were employed prior to injury reported a steeper decline in SWL than those who were unemployed prior to injury. Younger age was also associated with steeper decline in SWL in the dissatisfied class. People with these characteristics who are also men, are dissatisfied with appearance, and report previous psychiatric treatment are at most risk for gradually worsening SWL over time. Early identification and treatment may improve health outcomes and SWL in the long run.
Burn survivors should be identified as at risk for lower SWL if they were older at the time of injury, reported below the mean QOL-related mental health at discharge, and reported unemployment prior to injury.
SWL has been examined using GMM in people with traumatic brain injury; results indicated 4 different trajectories.34 Predictors were different across the 2 studies and the number of classes differed; therefore, it is difficult to compare the results, but age was found to be a significant predictor of the class membership in both studies.
Study limitations and future directions
The study had several limitations. The sample was not representative of burn survivors in general because the inclusion criteria focuses on more severe burns. Additionally, the sample used was significantly older, was more likely to be employed, and had significantly larger burns and longer length of stay than the participants excluded because of missing data. It is possible that those with missing data are qualitatively different from those who completed all instruments. Using missing data management strategies (eg, multiple imputation techniques35,36) may address this shortcoming because missing data are typical in longitudinal studies. In addition to significant missing data, preinjury SWL was reported postinjury. Retrospective reporting of SWL is likely influenced by the experience of burn injury, and the life before the injury may seem more satisfying in the context of the injury and hospital stay compared with the rating that would have been provided before the injury. However, we think that the perception of SWL before the injury was important to include in spite of the shortcomings because preinjury SWL provides important context for the postinjury SWL and allowed us to examine to what degree postinjury SWL returns to preinjury level over time.
Our study used the original 5-item SWLS despite evidence that 1 item does not appear to function well in people with traumatic injury. Although it was recommended by Amtmann et al21 that the last item be removed to improve the psychometric properties of the SWLS score, no alternate validated scoring has been provided to date. We think that the original SWLS score has sufficient reliability and validity, and that the higher reliability of the SWLS score that would result from removing the item would be unlikely to change the results of this study.
Most importantly, the results of this study are mostly theoretical and not specific enough for use in clinical practice. Additional work will be required to develop specific criteria (eg, specific age or level of mental functioning) that clinicians could use to identify patients at risk for low SWL postinjury.
Finally, as always, replication of the study with additional samples is necessary to ensure generalizability. Similar findings in other samples would strengthen the conclusions drawn and provide a strong foundation for clinical action.
Conclusions
The results of the study illustrate how advanced statistical methods (eg, GMM) can be used to help identify patients most in need of additional treatment. Although examining 1 average trajectory of SWL in burn survivors suggested that all people with burn injury are at risk for lower SWL, modeling >1 average trajectory helps identify people at most risk for low SWL. Predictors of less than optimal long-term outcomes can be measured at discharge, and additional services could be provided to assist with injury recovery, using limited health care resources where they will provide the greatest benefit.
Supplier
a. Mplus v7.4; Muthén & Muthén.
Acknowledgments
Supported in part by the U.S. Administration for Community Living, Department of Health and Human Services, Washington, DC (grant no. 90DP0053).
Grantees undertaking projects under government sponsorship are encouraged to express freely their findings and conclusions. Points of view or opinions do not, therefore, necessarily represent official Administration for Community Living policy.
List of abbreviations:
- BMS
Burn Model System
- GMM
growth mixture modeling
- HRQOL
health-related quality of life
- MCS
Mental Component Summary
- PCS
Physical Component Summary
- QOL
quality of life
- SF-12
12-Item Short Form Health Survey
- SWAP
Satisfaction With Appearance Scale
- SWL
satisfaction with life
- SWLS
Satisfaction With Life Scale
- TBSA
total body surface area
Footnotes
Presented as an oral presentation to the American Burn Association, March 24, 2017, Boston, MA.
Disclosures: none.
References
- 1.Tompkins RG. Survival from burns in the new millennium 70 years’ experience from a single institution. Ann Surg 2015;261:263–8. [DOI] [PMC free article] [PubMed] [Google Scholar]
- 2.Esselman PC. Burn rehabilitation: an overview. Arch Phys Med Rehabil 2007;88(12 Suppl 2):S3–6. [DOI] [PubMed] [Google Scholar]
- 3.Stavrou D, Weissman O, Tessone A, et al. Health related quality of life in burn patients – a review of the literature. Burns 2014;40:788–96. [DOI] [PubMed] [Google Scholar]
- 4.Pavoni V, Gianesello L, Paparella L, Buoninsegni LT, Barboni E. Outcome predictors and quality of life of severe burn patients admitted to intensive care unit. Scand J Trauma Resusc Emerg Med 2010;18:24. [DOI] [PMC free article] [PubMed] [Google Scholar]
- 5.Elsherbiny OE, Salem MA, El-Sabbagh AH, Elhadidy MR, Eldeen SM. Quality of life of adult patients with severe burns. Burns 2011;37:776–89. [DOI] [PubMed] [Google Scholar]
- 6.Murphy ME, Holzer CE 3rd, Richardson LM, et al. Quality of life of young adult survivors of pediatric burns using world health organization disability assessment scale ii and burn specific health scale-brief: a comparison. J Burn Care Res 2015;36:521–33. [DOI] [PMC free article] [PubMed] [Google Scholar]
- 7.Herndon DN. Total burn care. 4th ed. New York: Saunders Elsevier; 2012. [Google Scholar]
- 8.Falder S, Browne A, Edgar D, et al. Core outcomes for adult burn survivors: a clinical overview. Burns 2009;35:618–41. [DOI] [PubMed] [Google Scholar]
- 9.Klinge K, Chamberlain DJ, Redden M, King L. Psychological adjustments made by postburn injury patients: an integrative literature review. J Adv Nurs 2009;65:2274–92. [DOI] [PubMed] [Google Scholar]
- 10.Riis A, Andersen M, Pedersen MB, Hall KW. Long-term psychosocial adjustment in patients with severe burn injuries: a follow-up study. Burns 1992;18:121–6. [DOI] [PubMed] [Google Scholar]
- 11.Druery M, Brown TL, Muller M. Long term functional outcomes and quality of life following severe burn injury. Burns 2005;31:692–5. [DOI] [PubMed] [Google Scholar]
- 12.Patterson DR, Ptacek JT, Cromes F, Fauerbach JA, Engrav L. The 2000 Clinical Research Award. Describing and predicting distress and satisfaction with life for burn survivors. J Burn Care Rehabil 2000;21: 490. [PubMed] [Google Scholar]
- 13.Goverman J, Mathews K, Nadler D, et al. Satisfaction with life after burn: A Burn Model System National Database Study. Burns 2016;42: 1067–73. [DOI] [PMC free article] [PubMed] [Google Scholar]
- 14.Klein MB, Lezotte DL, Fauerbach JA, et al. The National Institute on Disability and Rehabilitation Research burn model system database: a tool for the multicenter study of the outcome of burn injury. J Burn Care Res 2007;28:84. [DOI] [PubMed] [Google Scholar]
- 15.Muthén LK, Muthén BO. Mplus user’s guide. 7th ed. Los Angeles: Muthén & Muthén; 1998. [Google Scholar]
- 16.Diener E, Emmons RA, Larsen RJ, Griffin S. The Satisfaction With Life Scale. J Pers Assess 1985;49:71–5. [DOI] [PubMed] [Google Scholar]
- 17.Maas AI, Harrison-Felix CL, Menon D, et al. Common data elements for traumatic brain injury: recommendations from the interagency working group on demographics and clinical assessment. Arch Phys Med Rehabil 2010;91:1641–9. [DOI] [PubMed] [Google Scholar]
- 18.Biering-Sorensen F, Alai S, Anderson K, et al. Common data elements for spinal cord injury clinical research: a National Institute for Neurological Disorders and Stroke project. Spinal Cord 2015;53:265–77. [DOI] [PMC free article] [PubMed] [Google Scholar]
- 19.Pavot W, Diener E, Colvin CR, Sandvik E. Further validation of the Satisfaction With Life Scale: evidence for the cross-method convergence of well-being measures. J Pers Assess 1991;57:149–61. [DOI] [PubMed] [Google Scholar]
- 20.Rosengren L, Jonasson SB, Brogårdh C, Lexell J. Psychometric properties of the Satisfaction With Life Scale in Parkinson’s disease. Acta Neurol Scand 2015;132:164–70. [DOI] [PubMed] [Google Scholar]
- 21.Amtmann D, Bocell FD, Bamer A, et al. Psychometric properties of the Satisfaction with Life Scale in people with traumatic brain, spinal cord, or burn injury: a National Institute on Disability, Independent Living, and Rehabilitation Research Model System Study. Assessment 2017;2:1–11. [DOI] [PMC free article] [PubMed] [Google Scholar]
- 22.Lawrence JW, Heinberg LJ, Roca R, Munster A, Spence R, Fauerbach JA. Development and validation of the Satisfaction With Appearance Scale: assessing body image among burn-injured patients. Psychol Assess 1998;10:64–70. [Google Scholar]
- 23.Ware JE Jr, Kosinski M, Keller SD. A 12-Item Short-Form Health Survey: construction of scales and preliminary tests of reliability and validity. Med Care 1996;34:220–33. [DOI] [PubMed] [Google Scholar]
- 24.Miller T, Bhattacharya S, Zamula W, et al. Quality-of-life loss of people admitted to burn centers, United States. Qual Life Res 2013;22: 2293–305. [DOI] [PubMed] [Google Scholar]
- 25.Druery M, Newcombe PA, Cameron CM, Lipman J. Factors influencing psychological, social and health outcomes after major burn injuries in adults: cohort study protocol. BMJ Open 2017;7: e017545. [DOI] [PMC free article] [PubMed] [Google Scholar]
- 26.Edgar D, Dawson A, Hankey G, Phillips M, Wood F. Demonstration of the validity of the SF-36 for measurement of the temporal recovery of quality of life outcomes in burns survivors. Burns 2010;36:1013–20. [DOI] [PubMed] [Google Scholar]
- 27.Little TD. Longitudinal structural equation modeling. New York: Guilford Press; 2013. [Google Scholar]
- 28.Jung T, Wickrama KA. An introduction to latent class growth analysis and growth mixture modeling. Soc Personal Psychol Compass 2008;2: 302–17. [Google Scholar]
- 29.Muthén BO, Shedden K. Finite mixture modeling with mixture outcomes using the EM algorithm. Biometrics 1999;55:463–9. [DOI] [PubMed] [Google Scholar]
- 30.Muthén BO. Latent variable analysis: growth mixture modeling and related techniques for longitudinal data. In: Kaplan D, editor. The Sage handbook of quantitative methodology for the social sciences. Newbery Park: Sage Publications; 2004. p 345–68. [Google Scholar]
- 31.Duncan TE, Duncan SC, Strycker LA. An introduction to latent variable growth curve modeling: concepts, issues, and applications. 2nd ed. Mahwah: Lawrence Erlbaum Associates; 2006. [Google Scholar]
- 32.Nylund K, Asparouhov T, Muthén B. Deciding on the number of classes in latent class analysis and growth mixture modeling: a Monte Carlo simulation study. Struct Equ Modeling 2007;14:535–69. [Google Scholar]
- 33.Curran PJ, Obeidat K, Losardo D. Twelve frequently asked questions about growth curve modeling. J Cogn Dev 2010;11:121–36. [DOI] [PMC free article] [PubMed] [Google Scholar]
- 34.Juengst SB, Adams LM, Bogner JA, et al. Trajectories of life satisfaction after traumatic brain injury: influence of life roles, age, cognitive disability, and depressive symptoms. Rehabil Psychol 2015; 60:353–64. [DOI] [PMC free article] [PubMed] [Google Scholar]
- 35.Graham JW. Missing data analysis: making it work in the real world. Annu Rev Psychol 2009;60:549–76. [DOI] [PubMed] [Google Scholar]
- 36.Horton NJ, Kleinman KP. Much ado about nothing: a comparison of missing data methods and software to fit incomplete data regression models. Am Stat 2007;61:79–90. [DOI] [PMC free article] [PubMed] [Google Scholar]