

Abstract
Previous studies suggested that osteocyte lacunar network disruption could play a role in the complex pathophysiology of bone changes in aging and disease. Considering that particular research interest is lacking, we aimed to assess alcoholic liver cirrhosis (ALC)–induced changes in osteocyte lacunar network and bone marrow adiposity. Immunohistochemistry was conducted to assess changes in the micro‐morphology of osteocyte lacunar network and bone marrow adiposity, and expression of connexin 43 and sclerostin in vertebral and femoral samples collected from 40 cadaveric men (age range between 44 and 70 years) divided into ALC group (n = 20) and control group (n = 20). Furthermore, the assessment of the potential association between bone changes and the severity of the hepatic disorder (given by Knodell's pathohistologic scoring) was conducted. Our data revealed fewer connexin 43‐positive osteocytes per vertebral and femoral bone area (p < 0.01), suggesting defective signal transduction among osteocytes in ALC individuals. Moreover, we found an ALC‐induced increase in the number of adipocytes in the vertebral bone marrow (p = 0.038). Considering significant associations between the severity of liver tissue disturbances and impaired functionality of osteocyte lacunar network (Pearson's correlation analyses, p < 0.05), we may assume that timely treatment of the liver disease may delay bone impairment. ALC induced an increase in osteocytic sclerostin expression (p < 0.001), suggesting its role in mediating low bone formation among ALC individuals. Hence, medicaments targeting low bone formation may be beneficial to attenuate the bone changes among ALC patients. However, future clinical studies are required to verify the therapeutic utility of these findings.
Keywords: alcoholic liver cirrhosis, bone marrow adipose tissue, connexin 43, osteocytes, sclerostin
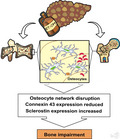
Osteocyte lacunar network disruption may participate in ALC‐induced bone changes. Connexin 43 expression was reduced in vertebral and femoral samples from ALC men. The increased osteocytic sclerostin expression could reduce bone formation in ALC men. A higher number of adipocytes was noted in the vertebral bone marrow of ALC men. Our data indicate a role of low bone formation in mediating ALC‐induced bone loss.
1. INTRODUCTION
The mechanisms underlying the etiopathogenesis of bone changes in patients with alcoholic liver cirrhosis (ALC) are complex and still insufficiently understood. ALC‐induced skeletal damage is often described as a disorder of the bone remodeling process, which leads to a decrease in bone mass and mineral density (Culafić et al., 2014; López‐Larramona et al., 2013), thereby reducing bone strength and increasing fracture risk (Emkey, 2018; Otete et al., 2018). However, little is known as to whether increased bone resorption or decreased bone formation has a dominant role in the etiopathogenesis of ALC‐induced bone loss. Another issue in understanding ALC‐related skeletal alterations is that the chronic alcohol intake has additional negative direct (via osteoblasts) and indirect (via the changes associated with end‐stage liver disease) effects on bone turnover (Guañabens & Parés, 2018). Specifically, previous studies noted that dose‐dependent adverse effects of alcohol intake on function, differentiation, proliferation, and maturation of osteoblasts could reduce bone formation (Chakkalakal, 2005; Luo et al., 2017). In addition, low vitamin D, sarcopenia, reduced physical activity, and an unbalanced diet combined with hormonal and metabolic disorders (hyperparathyroidism, hypogonadism, malabsorption syndrome, and intestinal microbiome disorders) could significantly impair bone metabolism among patients prone to alcohol abuse (Alvisa‐Negrín et al., 2009; Jeong & Kim, 2019; Luo et al., 2017). On the molecular level, disturbed receptor activator for nuclear factor kappa B ligand and osteoprotegerin ratio, altered production of pro‐inflammatory cytokines and trophic factors (Ehnert et al., 2019; Guañabens & Parés, 2018; Luo et al., 2017), changes in matrix metalloproteinase activity, or bilirubin and bile acids stasis are described as mechanisms leading to bone impairment in patients with liver cirrhosis (Mitchell et al., 2011; Santori et al., 2008; Sens et al., 2017). Previous studies identified an osteocyte‐derived protein, sclerostin, as a negative regulator of osteoblastic bone matrix synthesis and bone formation (González‐Reimers et al., 2013; Wakolbinger et al., 2020; Yousry et al., 2016). It has been suggested that increased serum concentrations of sclerostin could be involved in the pathogenesis of bone impairment among patients with different alcoholic liver disease stages through inducing low bone formation (Ehnert et al., 2019; González‐Reimers et al., 2013; Rhee et al., 2014; Wakolbinger et al., 2020; Yousry et al., 2016). Moreover, increased local sclerostin expression has recently been observed in the liver tissue samples obtained from patients with primary biliary cirrhosis (Guañabens et al., 2016). Considering the known methodologic limitations of the serum sclerostin assessment and the fact that it could depicture sclerostin of extraosseous origin (De Maré et al., 2019), analysis of local osteocytic sclerostin expression in bone tissue is required to provide valuable insight into the mechanisms of ALC‐induced bone loss.
To fully understand the etiopathogenesis of ALC‐induced bone impairment, the assessment of osteocyte lacunar network could be of importance given that osteocytes are known as important regulators of bone remodeling (Power et al., 2001). However, alcohol‐induced changes in the osteocyte lacunar network have only been assessed on animal models (Maurel et al., 2014, 2011, 2012, 2012, 2014). Previous data suggested that functional integrity of the osteocyte lacunar network and interosteocytic communication is maintained by intercellular channels (Stains et al., 2014, 2020), formed by monomeric subunits called connexins. Connexin 43 (Cx43) is the most frequently expressed connexin type in osteocytes (Plotkin, 2011; Stains et al., 2014, 2020). Previous data have shown that Cx43 is an essential part of intracellular machinery responsible for the signal transduction in the bone tissue (Plotkin, 2011). Altered Cx43 expression levels were noted in bone tissue and liver cells in various animal models of aging and liver disease (Balasubramaniyan et al., 2013; Cooreman et al., 2020; Davis et al., 2018). In addition, altered Cx43 expression has been found in liver tissue samples collected from patients with liver cirrhosis (Hernández‐Guerra et al., 2019; Yanguas et al., 2016). However, there are no data regarding osteocytic Cx43 expression in bone tissue samples from ALC individuals.
Considering that preferential allocation toward adipocyte lineage in bone marrow could contribute to bone loss (Woods et al., 2020), the assessment of bone marrow adiposity could contribute to a better understanding of ALC‐induced bone impairment. Indeed, alcohol‐induced increased bone marrow adiposity has been noted in rodent animal models (Maurel et al., 2014, 2011, 2012, 2012, 2014). Yet, the bone marrow adiposity has not been assessed in adult human ALC patients, but it was noted in adolescent individuals with nonalcoholic fatty liver disease (Albakheet et al., 2020; Yu et al., 2017).
With all that in mind, we aimed to investigate changes in osteocyte lacunar network, bone marrow adiposity, and expression levels of Cx43 and sclerostin in bone tissue samples collected from individuals with ALC, compared with healthy age‐ and sex‐matched controls. Furthermore, the potential association between morphologic and functional changes in osteocyte lacunar network and bone marrow adiposity and the severity of the hepatic disorder, illustrated by Knodell's pathohistologic scoring, was analyzed.
2. MATERIALS AND METHODS
2.1. Experimental design and study sample
Based on the frequency and importance of vertebral and femoral fragility fractures in ALC individuals (Otete et al., 2018; Santori et al., 2008), this cross‐sectional study analyzed bone samples of lumbar vertebrae and proximal femora obtained postmortem, in consent to institutional ethics review board (approval no. 1322/V‐1). Given that ALC is more common in men (Santori et al., 2008), 40 adult cadaveric men were included in this study. As presented in Figure 1, the bone chips (approximate sample size: 1 cm × 1 cm × 2 mm) from the central part of the anterior mid‐transverse portion of the fifth lumbar vertebral body and middle part of the intertrochanteric line of proximal femora were collected from individuals with ALC group (aged between 44 and 70 years) and age‐matched controls (aged between 46 and 68 years).
FIGURE 1.
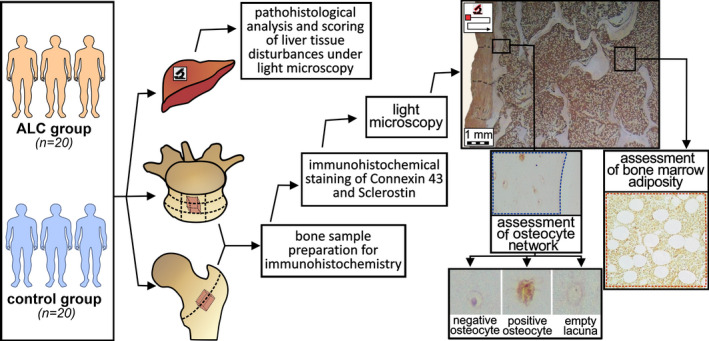
Flowchart summarizing the methodology used in the comparative assessment of osteocyte lacunar network and bone marrow adiposity between the ALC group and the control group
The initial inclusion criteria for the ALC donors were visible signs of liver cirrhosis and chronic alcoholism present at the autopsy, coupled with the data about long‐term drinking habits (at least three units of alcohol per day for more than 5 years) provided by the family members. In contrast, healthy age‐matched (±5 years) men without any visible sign or available data about liver disorders and chronic alcoholism at the time of autopsy were included in the control group. The exclusion criteria were as follows: positive history of previous vertebral and hip low‐trauma fracture; hereditary or acquired bone‐affecting diseases (chronic kidney disease, dysfunction of parathyroid, thyroid and adrenal glands, gonad dysfunctions, and pancreas disorders); and the presence of solitary or metastatic cancerous bone lesions; use of bone‐affecting therapy (e.g., vitamin D, reproductive hormonal therapy, corticosteroids, cytostatics, or antiresorptive treatment). Additionally, participants included in the study were not abstinent in drinking or on specific treatment for liver disease at the time of death.
When pathohistologic analysis verified the presence of liver cirrhosis (defined as diffuse, irreversible, severe, bridging, and “chicken‐wire” fibrosis coupled with substantial hepatonodular degeneration), donors were finally included in the ALC group (n = 20). In contrast, the control group encompassed bone samples of individuals without any significant pathohistologic sign of liver disease (n = 20).
2.2. Pathohistologic analysis and scoring of the liver tissue samples
The 5‐μm‐thick sections of formalin‐fixed paraffin‐embedded liver tissue samples were mounted on the slides, stained with Hematoxylin/Eosin and Masson's Trichrome, and analyzed under light microscopy (optical DM 1000 LED microscope with a CMOS ICC500W digital camera, Leica Microsystems). To estimate the potential association between the ALC stage and bone tissue changes, Knodell's scoring system was used (Goodman, 2007). In short, an experienced pathologist assigned a numerical score for periportal and bridging necrosis of the liver parenchyma, focal hepatocellular necrosis, portal inflammation, and intralobular degeneration, thereby creating the necroinflammatory score for each biopsy specimen (from 0/absence of necroinflammatory feature/to 18/the most severe necroinflammatory changes/). Finally, the investigator summarized the fibrosis score (from 0/no fibrosis/to 4 /cirrhosis/) and the necroinflammatory score to calculate the Histology Activity Index (HAI) for each specimen (from 0/suggesting the absence of pathohistologic features/to 22/indicating the most severe liver tissue disturbances/) (Goodman, 2007), which was used for statistical analysis.
2.3. Sample preparation for immunohistochemical staining
Next, 2‐mm‐thick bone samples of vertebral bodies and proximal femora (Figure 1) were cut using an electrical autopsy saw (Kugel Medical), fixed in formalin, and decalcified in an ethylenediaminetetraacetic acid (EDTA)‐based solution (USEDECALC, Medite) using Sonocool 255 ultrasonic unit (Bandelin Electronic). Decalcification was conducted with 50% of ultrasound power and on the auto‐regulated temperature (37°C) to prevent bone marrow damage and overheating. The bending test and radiographic assessment were used to establish the end point for decalcification in collaboration with the Department of Diagnostic Radiology, Faculty of Dental Medicine, University of Belgrade. Afterward, the femoral and vertebral bone samples were paraffin‐embedded, and 5‐µm‐thick sections of cancellous and cortical bone were obtained (Figure 1). Further, the sections were mounted on the slides, deparaffinized at 60°C for 30 min, submerged in xylene and decreasing ethanol solutions (100%, 90%, 70%, 50%, and distilled water) to rehydrate bone tissue.
2.4. Immunohistochemical staining of sclerostin
Antigen retrieval was performed with Tween‐20 solution; 3% hydrogen peroxide (H2O2) deactivated endogenous peroxidase; and bovine serum antigen (BSA) dilution in phosphate‐buffered saline (PBS) was utilized to hamper nonspecific staining. The bone tissue sections were incubated overnight at 4°C with the unconjugated rabbit polyclonal primary antibody binding to the N‐terminal region of human sclerostin (Cat: SAB1300086, RRID:AB_10604638, MiliporeSigma) diluted in 1% BSA solution in PBS (1:100). The manufacturer provided the immunoblotting validation of antibody specificity and recommended the antibodies for immunohistochemistry purposes on formalin‐fixed paraffin‐embedded human tissue specimens in the stated dilution. The conditions for transport, storage, and handling of the purchased antibodies required by the manufacturer were ensured at all times. Primary antibodies were detected with 60‐min‐long incubation with biotin‐conjugated goat antirabbit secondary antibodies (Cat: 21537, RRID:AB_916366, MiliporeSigma) diluted in 1% BSA in PBS buffer (1:200). To confirm the absence of nonspecific binding of secondary antibody, incubation without the primary antibody served as a negative control. After horseradish peroxidase (HRP)‐conjugated streptavidin (DAKO) was applied, staining was developed with diaminobenzidine (DAB) chromogen (DAKO), while aqueous hematoxylin solution (1:5) was used for counterstaining. Described staining protocol is a perfected version that ensured the adequate quality of osteocyte staining (more than 10% positive) in the Laboratory for Bone Biology and Bioanthropology setting. The procedure was performed consistently on all samples to ensure the appropriate interindividual comparison.
2.5. Immunohistochemical staining for Cx43
Antigen retrieval was performed by incubation in a trypsin solution at 37°C, 3% H2O2 was used to deactivate endogenous peroxidase, and BSA diluted in PBS was utilized to hamper nonspecific staining. The bone tissue sections were incubated overnight at 4°C with unconjugated rabbit polyclonal affinity isolated primary antibody to Gap junction α‐1 protein (Cx43, Cat: SAB4501175, RRID:AB_10746172, MiliporeSigma) diluted in 1% BSA solution in PBS (1:100). The manufacturer provided the immunoblotting validation of antibody specificity and recommended the antibodies for immunohistochemistry purposes on formalin‐fixed paraffin‐embedded human tissue specimens in the stated dilution. The conditions for transport, storage, and handling of the purchased antibodies required by the manufacturer were ensured at all times. Primary antibodies were detected with 60‐min‐long incubation with biotin‐conjugated goat anti‐rabbit secondary antibodies (Cat: 21537, RRID:AB_916366, MiliporeSigma) diluted in 1% BSA in PBS buffer (1:200). To confirm the absence of nonspecific binding of secondary antibody, incubation without the primary antibody served as a negative control. After streptavidin‐HRP (DAKO) was applied, staining was developed with DAB (DAKO), while aqueous hematoxylin solution (1:5) was used for counterstaining. Described staining protocol is a perfected version that ensured the adequate quality of osteocyte staining (at least 10% positive) in the used laboratory setting. The procedure was performed consistently on all samples to ensure the appropriate interindividual comparison.
2.6. Image analysis
Images of analyzed bone sections were captured with an optical DM 1000 LED microscope equipped with a 5‐megapixel CMOS ICC500W digital camera (Leica Microsystems), using the Leica Las EZ V2.0 software and ×200 magnification. Under ASBMR nomenclature guidelines (Dempster et al., 2013), the number of lacunae (N. Lc/B. Ar), the number of osteocytes (N. Ot/B. Ar), and the number of empty lacunae (N. Em. Lc/B. Ar) were manually determined per mm2 of assessed bone area (blue dashed line, Figure 1) using open‐source ImageJ software with BoneJ plug‐in V2.0 (https://imagej.net/, RRID:SCR_003070 and http://bonej.org/, RRID:SCR_018166). A single investigator conducted the histomorphometric evaluation for all included samples to ensure consistent rating. The investigator stuck to the rule that an empty lacuna was an osteocytic lacuna without a visible nucleus, while an osteocyte was defined as a lacuna with a visible nucleus (Figure 1). Moreover, the number of sclerostin‐positive (cells with brown‐colored cytoplasm) and sclerostin‐negative osteocytes (blue‐colored lacuna with a visible nucleus) per bone area were manually determined in each bone sample. Likewise, Cx43‐positive (cells with brown‐colored cytoplasm) and negative osteocytes (blue colored) were manually determined per analyzed bone area of vertebral and femoral samples (Figure 1). To ensure representative evaluation, the investigator excluded bone samples if at least 4 mm2 of bone tissue area could not be appropriately measured, following previous suggestions (Wölfel et al., 2020). Thus, data for a total of 40 lumbar vertebrae samples (20 samples from ALC vs. 20 samples from healthy controls) and 31 femoral samples (samples obtained from 14 controls and 17 ALC individuals) were presented in the study. Additionally, in line with the most recent BMAS recommendations (Tratwal et al., 2020), adipocyte number per bone marrow area (N. Ad/Ma. Ar; #/mm2), percentage of adipocyte area over bone marrow area, known as “bone marrow adipose area” (Ad. Ar/Ma. Ar, %), and mean adipocyte diameter (Ad. Dm, µm) were calculated in bone marrow area of lumbar vertebral bone samples (red dashed line, Figure 1). To provide the acceptable comparability of our findings with other human cadaveric studies (Wölfel et al., 2020), the minimal assessed bone marrow area was 1.25 mm2.
2.7. Statistical analysis
Distribution assumptions were initially tested using box plots, and then the Kolmogorov–Smirnov test was performed to assess the normality of data distribution. The differences between ALC and the control group were assessed with the Student's t‐test for normally distributed (parametric) data and Mann–Whitney U test for nonparametric data. The differences between lumbar vertebrae and proximal femora were assessed with the Student's t‐test (or Mann–Whitney U test, where appropriate). We used Pearson's correlation analysis (or Spearman's correlation analysis where appropriate) to estimate the correlation between bone parameters and the pathohistologic score of liver tissue damage. Open source EZR statistical software V3.5.2 was used for statistical analysis at a 0.05 level of significance.
3. RESULTS
3.1. Liver tissue disturbances in men with ALC
Pathohistologic hallmarks of liver cirrhosis were confirmed in donors of the ALC group, whereas liver tissue disturbances were missing in control individuals. Namely, severe periportal, bridging, and “chicken‐wire” fibrosis coupled with regenerating nodules were hallmarks of liver damage in the ALC donors. The more severe liver tissue disturbance in ALC men was suggested by increased HAI values compared with healthy men without the liver disorder (11 ± 3 vs. 3 ± 2, respectively; p < 0.001). At the same time, more prominent necroinflammatory features (reflected by increased necroinflammatory score) were noted in the liver tissue of the ALC group compared with healthy control individuals (7 ± 3 vs. 3 ± 2, respectively; p < 0.001). A compensated form of ALC was present in the majority of individuals included in our ALC group, with the exception of one individual with known hepatic encephalopathy, one donor with variceal bleeding, and two individuals with ascites observed during autopsy.
3.2. Histomorphometric assessment of osteocyte lacunar network micro‐morphology
Histomorphometric assessment revealed minor intergroup differences in the osteocyte lacunar network. Namely, a tendency to an increased number of empty lacunae was noted in vertebral bone samples of ALC individuals (median [min–max]: 31.1 (13.9–78.4)/mm2 vs. 28.3 (20.6–60.1)/mm2), but statistical significance was not reached due to prominent interindividual variations in the groups (p = 0.090; Mann–Whitney U test, Figure 2). In addition, an increased number of empty lacunae was observed in femoral bone samples from ALC donors (43.3 ± 17.4/mm2) compared with healthy controls (26.4 ± 9.3/mm2; p = 0.003, Figure 3). Pearson's correlation analysis suggested that the severity of liver tissue disturbance (as reflected by HAI values) was positively associated with the number of empty lacunae per femoral bone area (r = 0.369; p = 0.049). Spearman's correlation analysis suggested that the number of empty lacunae per vertebral bone area was not associated with the pathohistologic scores of liver disorder noted in our individuals (p > 0.05). The number of osteocytes and the number of lacunae were not significantly altered in the vertebral bone samples (p = 0.416 and p = 0.648, respectively; Figure 2) nor femoral bone samples of the ALC group (p = 0.509 and p = 0.666, respectively; Figure 3). As shown in Figure 4, an inverse association was found between HAI values and the total number of osteocytes in the femoral bone samples (r = −0.431; p = 0.017), while the remaining parameters of micro‐morphology of osteocyte lacunar network were not significantly correlated with the severity of liver tissue disturbances noted in included individuals (p > 0.05, Pearson's correlation test). In addition, our assessment did not reveal any significant intersite differences in the osteocyte lacunar network between assessed vertebral and femoral samples. Namely, the total number of osteocytes, the total number of lacunae, and the number of empty lacunae per bone area were not significantly different between the analyzed vertebral and femoral bone samples (p = 0.387, p = 0.654, and p = 0.415, respectively).
FIGURE 2.
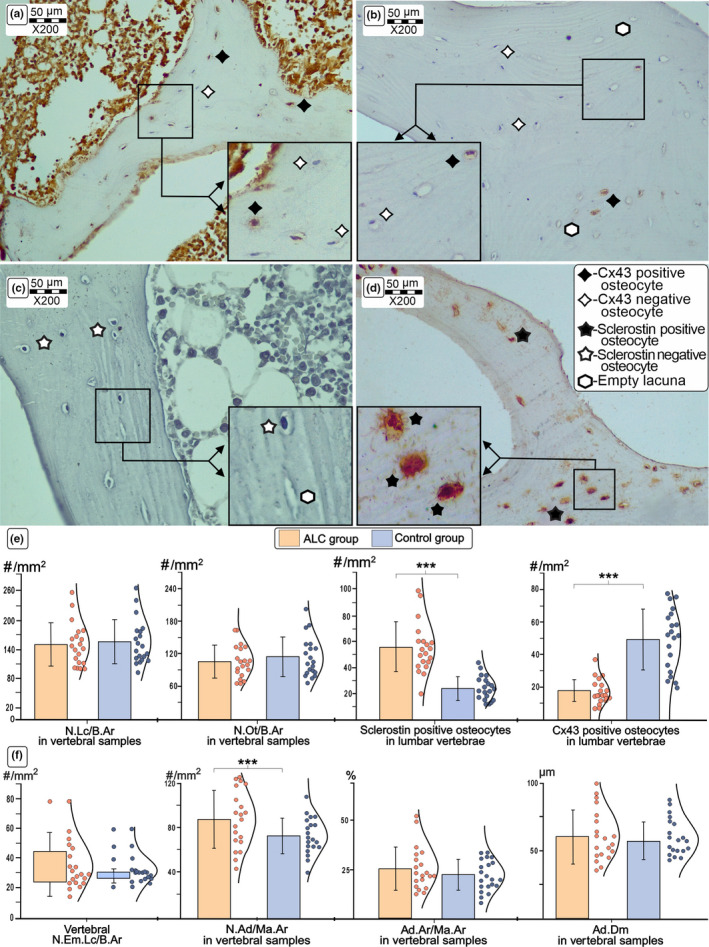
Comparison of the representative immunohistochemistry findings in lumbar vertebrae from ALC donors and healthy age‐matched controls. Detail shows the comparison of typical light microscopy findings (×200 magnification) of Cx43 and sclerotin expression levels between control (a, c) and ALC groups (b, d). Our results suggest a significant decrease in expression of Cx43 and an increase in sclerostin expression levels in osteocytes of the lumbar vertebrae obtained from ALC individuals (f). Last, an increased number of adipocytes was noted in the ALC group (f). Statistical significance of the difference between ALC and control groups was estimated using Student's t‐test (***p < 0.05) and Mann–Whitney U test, where appropriate. Bar graphs represent the parametric data as mean ± SD, including the distribution of individual data points. (For interpretation of the references to color in the figure legend, the reader is referred to the web version of the article.) Abbreviations: Cx43, Connexin 43; ALC, alcoholic liver cirrhosis; N. Lc/B. Ar, the number of lacunae per bone area; N. Ot/B. Ar, the number of osteocytes per bone area; N. Em. Lc/B. Ar, the number of empty lacunae per bone area; N. Ad/Ma. Ar, number of adipocytes per bone marrow area; Ad. Ar/Ma. Ar, percentage of adipocyte area over bone marrow area; Ad. Dm, mean adipocyte diameter
FIGURE 3.
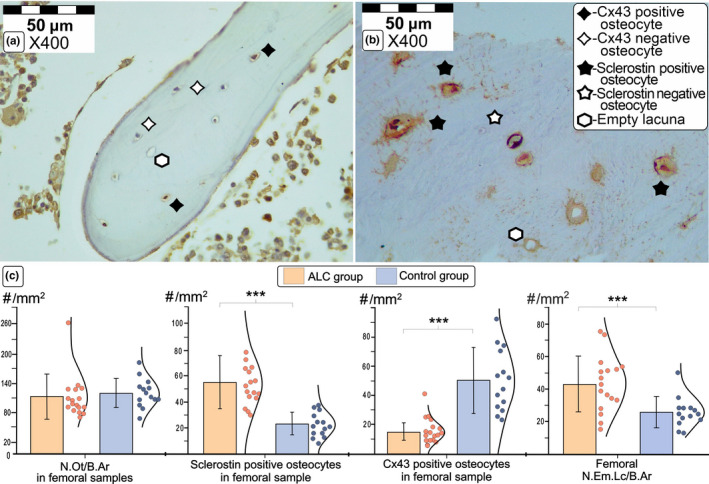
Comparison of the representative immunohistochemistry findings in proximal femora from ALC group and healthy controls. Detail shows the comparison of typical light microscopy finding (×400 magnification) of Cx43 expression levels in a femoral sample obtained from a control individual (a) and sclerostin osteocytic expression levels in the femoral bone sample collected from ALC donor (b). Our data suggest increased sclerostin and decreased Cx43 expression in osteocytes (c), coupled with an increased number of empty lacunae in the femoral samples collected from ALC individuals (d). Statistical significance of the intergroup differences was estimated using Student's t‐test (***p < 0.05). Bar graphs represent the parametric data as mean ± SD, including the individual data points distribution. (For interpretation of the references to color in the figure legend, the reader is referred to the web version of this article.) Abbreviations: Cx43, connexin 43; ALC, alcoholic liver cirrhosis; N. Lc/B. Ar, the number of lacunae per bone area; N. Ot/B. Ar, the number of osteocytes per bone area; N. Em. Lc/B. Ar, the number of empty lacunae per bone area
FIGURE 4.
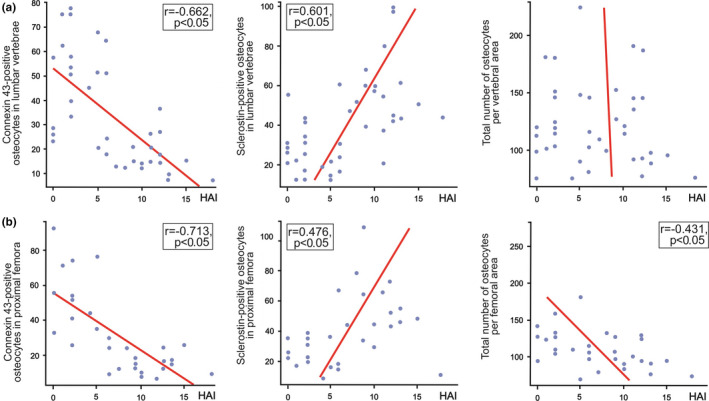
Estimation of the association between liver tissue disturbances (given by Knodell's Histology Activity Index) and bone immunohistochemistry findings, presented by scatter plots. Pearson's correlation analysis revealed that the number of Connexin 43‐positive osteocytes in the vertebral (a) and femoral samples (b) was inversely associated with the pathohistologic score of liver tissue disturbances in included individuals. In addition, osteocytic sclerotin expression levels in vertebral (a) and femoral samples (b) displayed a significant correlation with the Histology Activity Index (HAI) in all included individuals. Last, we noted an inverse association was between HAI values and the total number of osteocytes in the femoral bone samples (b)
3.3. Immunohistochemical assessment of osteocytic Cx43 and sclerostin expression levels
The significantly higher number of sclerostin‐positive osteocytes was noted in the vertebral (55.9 ± 19.3/mm2 vs. 24.3 ± 9.1/mm2; p < 0.001, Figure 2) and femoral bone samples obtained from ALC donors (55.3 ± 20.5/mm2 vs. 23.6 ± 8.9/mm2; p < 0.001, Figure 3). Moreover, a substantial decline in osteocytic expression of Cx43 was noted in the lumbar vertebrae (17.2 ± 7.4/mm2 vs. 49.3 ± 18.7/mm2; p < 0.001, Figure 2) and proximal femora obtained from ALC donors, compared with control individuals (14.6 ± 5.8/mm2 vs. 50.4 ± 21.5/mm2; p < 0.001, Figure 3). At the same time, the number of Cx43‐negative osteocytes in the femoral (293.3 ± 126.4/mm2 vs. 239.7 ± 171.9/mm2; p = 0.069) and vertebral samples (118.8 ± 39.7/mm2 vs. 76.0 ± 31.1/mm2; p < 0.001) was higher in the ALC group than in healthy controls. Last, the number of sclerostin‐negative osteocytes tended to decrease in the proximal femora (38.0 ± 14.9/mm2 vs. 65.3 ± 22.3/mm2; p < 0.01) and lumbar vertebrae of the ALC group compared with control samples (62.7 ± 48.3/mm2 vs. 86.3 ± 50.6/mm2; p = 0.141). As shown in Figure 4, Pearson's correlation analysis suggested that the number of Cx43‐positive osteocytes in the vertebral and femoral samples was inversely associated with HAI (r = −0.662 and r = −0.713, respectively; p < 0.001). Likewise, Pearson's correlation analysis suggested that osteocytic sclerotin expression levels in vertebral (r = 0.601; p < 0.001) and femoral samples (r = 0.476; p = 0.008) displayed a significant correlation with the severity of liver tissue disturbances (Figure 4). On the other side, the osteocytic expression levels of Cx43 and sclerostin were not different between analyzed vertebral and femoral bone samples (p > 0.05).
3.4. Assessment of bone marrow adiposity
In addition to assessing the osteocyte lacunar network, we evaluated the parameters of vertebral bone marrow adiposity (Figure 2). A higher number of adipocytes per bone marrow area (87.6 ± 26.5/mm2 vs. 72.9 ± 16.2/mm2) and a tendency to larger adipocyte diameter (67 ± 16 µm vs. 58 ± 14 µm) was noted in the ALC group compared with the control group (p = 0.038 and p = 0.060, respectively). Yet, we found no significant difference in the bone marrow adipose area (25.2 ± 10.8% vs. 22.4 ± 7.8%) between the ALC and control groups (p = 0.346). The indices of bone marrow adiposity were not associated with the HAI values in the ALC group (p > 0.05, Pearson's correlation test).
4. DISCUSSION
Osteocytes are the most abundant bone cells occupying the osteocyte lacunar network formed of pores (known as lacunae) and channels between them (known as canaliculi) (Rolvien et al., 2018). Signal transduction, molecular transport, and nutrient supply through the osteocyte lacunar network are recognized as essential for bone homeostasis (Milovanovic & Busse, 2019); hence, disruption of the osteocyte lacunar network morphology and osteocyte functionality could be a contributing factor for compromised bone quality and substantial bone strength decline associated with aging and disease. Previous studies were conducted to illuminate age‐associated or site‐specific alterations in the osteocyte lacunar network of human bone samples (Milovanovic & Busse, 2019; Rolvien et al., 2018), whereas the present study focused on the assessment of ALC‐induced disturbances in the functionality and morphology of the osteocyte lacunar network. Our histomorphometric evaluation revealed a tendency to a minor ALC‐induced disruption of osteocyte lacunar network integrity, reflected in an increased number of empty lacunae per femoral bone area (Figure 3). These data are in accordance with the results of Maurel et al., which indicated that heavy alcohol consumption caused an increased number of empty lacunae and promoted osteocyte apoptosis in the tibia of adult rats (Maurel et al., 2011; Maurel et al., 2014). Although previous studies showed site‐specific age‐associated changes in osteocyte lacunar network characteristics (Rolvien et al., 2018), our comparison between lumbar vertebrae and intertrochanteric femoral region did not reveal significant ALC‐induced difference in assessed parameters of osteocyte lacunar network.
Our finding of the reduced number of Cx43‐positive osteocytes in vertebral and femoral bone samples from ALC men (Figures 2 and 3) indicates that signal transduction between osteocytes could be harmed in ALC patients. These data are in line with previous in vitro studies, animal studies, and studies using human liver biopsies, which revealed that liver cirrhosis might affect the expression of Cx43 in hepatocytes and other liver cells (Balasubramaniyan et al., 2013; Cooreman et al., 2020; Hernández‐Guerra et al., 2019; Yanguas et al., 2016). Considering our and previous data, we may assume that the mechanosensing potential and signal transduction through the osteocyte lacunar network may be impaired in ALC individuals (Plotkin, 2011; Stains et al., 2020) due to the weakening of osteocytic Cx43 expression (Figure 5).
FIGURE 5.
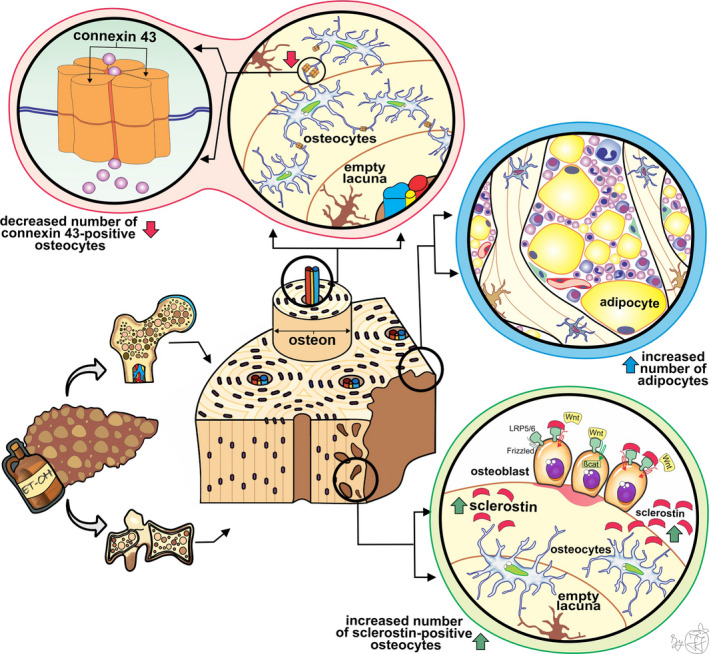
Schematic representation of our main findings and hypothetical summary. A minor disruption in the osteocyte lacunar network, depicted by an increased number of empty lacunae, was induced by ALC. In addition, the altered intercellular communication between osteocytes was suggested by reduced expression of transmembrane protein (connexin 43), which forms a continuous aqueous channel between the cytoplasm of two osteocytes known as a gap junction. Considering that the exchange of small molecules, ions, and nutrients is enabled through that intercellular channel, we may assume that signal transduction triggered by various stimuli is compromised in ALC men. It has been known that in the presence of sclerostin, the Wnt ligand could not bound the LRP‐5/6‐Frizzled receptor complex, which affects the phosphorylation of β‐catenin, and subsequently leads to reduced bone formation. Our finding of increased sclerostin expression, secreted by osteocytes, indicates that low bone formation plays an important role in ALC‐induced bone impairment. Last, ALC negatively affects the balance between adipogenesis and osteogenesis, causing an increased number of vertebral bone marrow adipocytes in ALC individuals
Previous clinical studies also revealed that altered serum concentrations of sclerostin may contribute to bone impairment among individuals with various stages of alcoholism (Callaci et al., 2009; González‐Reimers et al., 2013), including ALC patients (Wakolbinger et al., 2020). However, the assessment of osteocytic sclerostin expression in bone samples could improve the understanding of the pathogenesis of ALC‐induced bone impairment, considering that serum assessment includes the sclerostin of extraosseous origin (De Maré et al., 2019). In line with the previous results, we found increased osteocytic sclerostin expression in vertebral and femoral samples from men with ALC compared with healthy controls (Figures 2 and 3). Thus, we may speculate that our finding of increased sclerostin expression in osteocytes suggests that decreased bone formation could lead to significant ALC‐induced bone loss (Figure 5) and microstructural disruption previously noted in lumbar vertebrae (Jadzic, Cvetkovic, Milovanovic, et al., 2020) and proximal femora (Jadzic, et al., 2021). Likewise, the increased serum sclerostin concentrations were previously associated with bone deterioration in individuals with nonalcoholic liver disorders (Rhee et al., 2014; Wakolbinger et al., 2020).
Previous studies have suggested that the damaging effects of alcohol intake on the musculoskeletal system are not limited to bone cells. Namely, increased bone marrow fat content and size of lipid droplets were found in rodent animal models exposed to heavy alcohol consumption (Maddalozzo et al., 2009; Maurel et al., 2014, 2012, 2014). In addition, the results of previous in vitro studies also suggested that chronic alcohol intake could display a negative effect on the balance between adipogenesis and osteogenesis and subsequently cause increased bone marrow fat content (Cui et al., 2006). These data align with our observation of the significantly increased number of adipocytes and the tendency to larger adipocyte diameter in the vertebral bone marrow of the ALC group (Figure 5). In addition, previous clinical studies revealed a high content of vertebral bone marrow adipose tissue in adolescents with nonalcoholic fatty liver disease (Albakheet et al., 2020; Yu et al., 2017), which is in line with our results on adult men with ALC.
Our histomorphometric analysis showed a significant association between the severity of liver tissue disturbance associated with ALC and osteocytic Cx43 and sclerostin expression levels in investigated femoral and vertebral bone samples (Figure 4). These findings suggest that the staging of liver disease could significantly contribute to ALC‐induced bone loss (Figure 5), which was previously indicated by various studies dealing with individuals with alcoholic and nonalcoholic liver disease (Culafić et al., 2014; Jadzic, Cvetkovic, Tomanovic, et al., 2020; Jadzic, et al., 2021; Schmidt et al., 2021). However, the assessed osteocytic lacunar network parameters and bone marrow adiposity parameters in lumbar vertebrae did not significantly correlate with the HAI values of the ALC group. Results of other research teams that used peripheral quantitative CT to assess bone deterioration in alcoholic and nonalcoholic liver cirrhosis patients did not show significant correlations between micro‐structural bone loss and clinical stages (Schmidt et al., 2021; Wakolbinger et al., 2019), suggesting that the clinical utility of our findings requires further confirmation in large prospective studies in controlled clinical settings.
The main strengths and shortcomings of this study should be discerned. To the best of our knowledge, this is the first study aiming to address the alteration in osteocyte lacunar network morphology, osteocytic expression levels of Cx43 and sclerotin, and bone marrow adiposity in men with pathohistologic confirmation of ALC. However, we could not assess the progression of osteocyte lacunar network deterioration over time due to the cross‐sectional design of the study. In addition, standard clinical scores commonly used for the liver disease staging could not be utilized to reflect the severity of ALC among our individuals; therefore, we relied on pathohistologic indicators. Histomorphometric light microscopy assessment is limited by its 2D nature and image resolution, suggesting that future studies could benefit from using state‐of‐the‐art 3D technologies to further assess the morphology of the osteocyte lacunar network. The estimate of the alcoholic origin of liver cirrhosis was based on data about average units of alcoholic drinks consumed per day and duration of the drinking habit provided by family members, but these data could be subject to recall bias. Finally, complete medical records are often difficult to obtain for cadaveric donors, so unreported life habits (drug and tobacco use, the level of physical activity) and undiagnosed health disturbances (various comorbidities not detectable at the autopsy) might display a covariant effect on our results.
In summary, immunohistochemical analysis conducted in this study revealed decreased osteocytic Cx43 expression in lumbar vertebrae and proximal femora from ALC individuals, suggesting compromised osteocytic intercellular communication in these individuals. Moreover, our study revealed an ALC‐induced rise in the number of vertebral bone marrow adipocytes. Considering that our study revealed significant associations between the level of liver tissue disturbances and impaired functionality of the osteocyte lacunar network, we may assume that liver disease treatment may affect the progression of ALC‐induced bone alterations. Last, increased sclerostin expression in bone samples from individuals with ALC illuminated that decreased bone formation could be an important mechanism in the pathogenesis of ALC‐induced bone fragility. With that in mind, we may speculate that treatment targeting low bone formation could have beneficial effects in attenuating bone changes among ALC patients. However, future clinical studies are required to verify the clinical utility of these findings.
CONFLICTS OF INTEREST
Jelena Jadzic, Petar Milovanovic, Danica Cvetkovic, Vladimir Zivkovic, Slobodan Nikolic, Nada Tomanovic, Marija Djuric, and Danijela Djonic have no conflicts of interest to declare.
AUTHOR CONTRIBUTION
Conceptualization: Petar Milovanovic and Danijela Djonic; Methodology: Jelena Jadzic and Petar Milovanovic, Investigation: Jelena Jadzic, Danica Cvetkovic, and Nada Tomanovic; Resources: Danica Cvetkovic, Vladimir Zivkovic, and Slobodan Nikolic; Formal analysis: Jelena Jadzic; Data interpretation: Jelena Jadzic, Danijela Djonic, Petar Milovanovic, and Marija Djuric; Visualization: Jelena Jadzic; Writing‐original draft: Jelena Jadzic and Danijela Djonic; Writing—Review and Editing: Petar Milovanovic and Marija Djuric; Project administration and Funding acquisition: Petar Milovanovic and Marija Djuric; Supervision: Danijela Djonic; Final approval of the submitted manuscript: all authors.
ETHICS APPROVAL
Sample collection and other procedures performed during this study were in accordance with the ethical standards of the Ethics Committee of the Faculty of Medicine, the University of Belgrade, Serbia (No. 1322/V‐1) and under the 1964 Helsinki declaration and its later amendments or comparable ethical standards. The Institutional Ethics Committee waived the requirement of informed consent for the collection of the samples included in the study.
CODE AVAILABILITY
Not applicable.
ANIMAL RESEARCH
Not applicable.
CONSENT TO PARTICIPATE
Not applicable.
CONSENT FOR PUBLICATION
Not applicable.
ACKNOWLEDGMENTS
The authors would like to thank lead laboratory technician Vesna Petronijević (Institute for Oncology and Radiology of Serbia) for her valuable suggestions and help during the preparation of bone samples for immunohistochemistry. Further, we are thankful to medical staff from the Institute of Forensic Medicine, the University of Belgrade for their assistance during the autopsy, sample collection, and liver tissue samples preparation for pathohistologic assessment.
Jadzic, J. , Milovanovic, P.D. , Cvetkovic, D. , Zivkovic, V. , Nikolic, S. , Tomanovic, N. , et al (2022) The altered osteocytic expression of connexin 43 and sclerostin in human cadaveric donors with alcoholic liver cirrhosis: Potential treatment targets. Journal of Anatomy, 240, 1162–1173. Available from: 10.1111/joa.13621
Funding information
This study received financial support from the Science Fund of the Republic of Serbia (IDEAS program, BoFraM group and PROMIS program, DiaBoNet group), the Ministry of Education and Science of the Republic of Serbia (no. III 45005/7), and from Alexander von Humboldt Foundation (Research linkage program, no. 3.4‐1162414‐SRB‐IP).
DATA AVAILABILITY STATEMENT
All data that support findings generated during this study are available from the corresponding author (Prof. Dr. Danijela Djonic) upon request.
REFERENCES
- Albakheet, S.S. , Yoon, H. , Shin, H.J. , Koh, H. , Kim, S. & Lee, M.J. (2020) Bone marrow fat change in pediatric patients with non‐alcoholic fatty liver disease. PLoS One, 15(6), 1–10. 10.1371/journal.pone.0234096 [DOI] [PMC free article] [PubMed] [Google Scholar]
- Alvisa‐Negrín, J. , González‐Reimers, E. , Santolaria‐Fernández, F. , García‐Valdecasas‐Campelo, E. , Valls, M.R.A. , Pelazas‐González, R. et al. (2009) Osteopenia in alcoholics: effect of alcohol abstinence. Alcohol and Alcoholism, 44(5), 468–475. 10.1093/alcalc/agp038 [DOI] [PubMed] [Google Scholar]
- Balasubramaniyan, V. , Dhar, D.K. , Warner, A.E. , Vivien Li, W.Y. , Amiri, A.F. , Bright, B. et al. (2013) Importance of connexin‐43 based gap junction in cirrhosis and acute‐on‐chronic liver failure. Journal of Hepatology, 58(6), 1194–1200. 10.1016/j.jhep.2013.01.023 [DOI] [PubMed] [Google Scholar]
- Callaci, J.J. , Himes, R. , Lauing, K. , Wezeman, F.H. & Brownson, K. (2009) Binge alcohol‐induced bone damage is accompanied by differential expression of bone remodeling‐related genes in rat vertebral bone. Calcified Tissue International, 84(6), 474–484. 10.1007/s00223-009-9240-z [DOI] [PMC free article] [PubMed] [Google Scholar]
- Chakkalakal, D.A. (2005) Alcohol‐induced bone loss and deficient bone repair. Alcoholism: Clinical and Experimental Research, 29(12), 2077–2090. 10.1097/01.alc.0000192039.21305.55 [DOI] [PubMed] [Google Scholar]
- Cooreman, A. , Van Campenhout, R. , Crespo Yanguas, S. , Gijbels, E. , Leroy, K. , Pieters, A. et al. (2020) Cholestasis differentially affects liver connexins. International Journal of Molecular Sciences, 21(18), 6534. 10.3390/ijms21186534 [DOI] [PMC free article] [PubMed] [Google Scholar]
- Cui, Q. , Wang, Y. , Saleh, K.J. , Wang, G.J. & Balian, G. (2006) Alcohol‐induced adipogenesis in a cloned bone‐marrow stem cell. Journal of Bone and Joint Surgery ‐ Series A, 88(SUPPL. 3), 148–154 10.2106/jbjs.f.00534 [DOI] [PubMed] [Google Scholar]
- Culafić, D. , Djonic, D. , Culafic‐Vojinovic, V. , Ignjatovic, S. , Soldatovic, I. , Vasic, J. et al. (2014) Evidence of degraded BMD and geometry at the proximal femora in male patients with alcoholic liver cirrhosis. Osteoporosis International, 26(1), 253–259. 10.1007/s00198-014-2849-4 [DOI] [PubMed] [Google Scholar]
- Davis, H.M. , Aref, M.W. , Aguilar‐Perez, A. , Pacheco‐Costa, R. , Allen, K. , Valdez, S. et al. (2018) Cx43 overexpression in osteocytes prevents osteocyte apoptosis and preserves cortical bone quality in aging mice. JBMR Plus, 2(4), 206–216. 10.1002/jbm4.10035 [DOI] [PMC free article] [PubMed] [Google Scholar]
- De Maré, A. , Verhulst, A. , Cavalier, E. , Delanaye, P. , Behets, G.J. , Meijers, B. et al. (2019) Clinical inference of serum and bone sclerostin levels in patients with end‐stage kidney disease. Journal of Clinical Medicine, 8(12), 2027. 10.3390/jcm8122027 [DOI] [PMC free article] [PubMed] [Google Scholar]
- Dempster, D.W. , Compston, J.E. , Drezner, M.K. , Glorieux, F.H. , Kanis, J.A. , Malluche, H. et al. (2013) Standardized nomenclature, symbols, and units for bone histomorphometry : a 2012 update of the report of the ASBMR Histomorphometry Nomenclature Committee. Journal of Bone and Mineral Research 28(1), 1–16. 10.1002/jbmr.1805 [DOI] [PMC free article] [PubMed] [Google Scholar]
- Ehnert, S. , Aspera‐Werz, R.H. , Ruoß, M. , Dooley, S. , Hengstler, J.G. , Nadalin, S. et al. (2019) Hepatic osteodystrophy‐molecular mechanisms proposed to favor its development. International Journal of Molecular Sciences, 20(10), 2555. 10.3390/ijms20102555 [DOI] [PMC free article] [PubMed] [Google Scholar]
- Emkey, G.R. (2018) Secondary osteoporosis. Encyclopedia of Endocrine Diseases, 39(3), 253–269. 10.1016/B978-0-12-801238-3.65820-8 [DOI] [Google Scholar]
- González‐Reimers, E. , Martín‐González, C. , de la Vega‐Prieto, M.J. , Pelazas‐González, R. , Fernández‐Rodríguez, C. , López‐Prieto, J. et al. (2013) Serum sclerostin in alcoholics: a pilot study. Alcohol and Alcoholism, 48(3), 278–282. 10.1093/alcalc/ags136 [DOI] [PubMed] [Google Scholar]
- Goodman, Z.D. (2007) Grading and staging systems for inflammation and fibrosis in chronic liver diseases. Journal of Hepatology, 47(4), 598–607. 10.1016/j.jhep.2007.07.006 [DOI] [PubMed] [Google Scholar]
- Guañabens, N. & Parés, A. (2018) Osteoporosis in chronic liver disease. Liver International, 38(5), 776–785. 10.1111/liv.13730 [DOI] [PubMed] [Google Scholar]
- Guañabens, N. , Ruiz‐Gaspà, S. , Gifre, L. , Miquel, R. , Peris, P. , Monegal, A. et al. (2016) Sclerostin expression in bile ducts of patients with chronic cholestasis may influence the bone disease in primary biliary cirrhosis. Journal of Bone and Mineral Research, 31(9), 1725–1733. 10.1002/jbmr.2845 [DOI] [PubMed] [Google Scholar]
- Hernández‐Guerra, M. , Hadjihambi, A. & Jalan, R. (2019) Gap junctions in liver disease: implications for pathogenesis and therapy. Journal of Hepatology, 70(4), 759–772. 10.1016/j.jhep.2018.12.023 [DOI] [PubMed] [Google Scholar]
- Jadzic, J. , Cvetkovic, D. , Milovanovic, P. , Tomanovic, N. , Zivkovic, V. , Nikolic, S. et al. (2020) The micro‐structural analysis of lumbar vertebrae in alcoholic liver cirrhosis. Osteoporosis International, 31(11), 2209–2217. 10.1007/s00198-020-05509-7 [DOI] [PubMed] [Google Scholar]
- Jadzic, J. , Cvetkovic, D. , Tomanovic, N. , Zivkovic, V. , Nikolic, S. , Milovanovic, P. et al. (2020). The severity of hepatic disorder is related to vertebral microstructure deterioration in cadaveric donors with liver cirrhosis. Microscopy Research and Technique, 84(5), 840–849. 10.1002/jemt.23642 [DOI] [PubMed] [Google Scholar]
- Jadzic, J. , Mijucic, J. , Nikolic, S. , Djuric, M. & Djonic, D. (2021) The comparison of age‐ and sex‐specific alteration in pubic bone microstructure: a cross‐sectional cadaveric study. Experimental Gerontology, 150(February), 111375. 10.1016/j.exger.2021.111375 [DOI] [PubMed] [Google Scholar]
- Jadzic, J. , Milovanovic, P. , Cvetkovic, D. , Ivovic, M. , Tomanovic, N. , Bracanovic, M. et al. (2021) Mechano‐structural alteration in proximal femora of individuals with alcoholic liver disease: Implications for increased bone fragility. Bone, 150(4), 1160. 10.1016/j.bone.2021.116020 [DOI] [PubMed] [Google Scholar]
- Jeong, H.M. & Kim, D.J. (2019) Bone diseases in patients with chronic liver disease. International Journal of Molecular Sciences, 20(17), 4270. 10.3390/ijms20174270 [DOI] [PMC free article] [PubMed] [Google Scholar]
- López‐Larramona, G. , Lucendo, A.J. & González‐Delgado, L. (2013) Alcoholic liver disease and changes in bone mineral density. Revista Española de Enfermedades Digestivas, 105(10), 609–621. 10.4321/s1130-01082013001000006 [DOI] [PubMed] [Google Scholar]
- Luo, Z. , Liu, Y. , Liu, Y. , Chen, H. , Shi, S. & Liu, Y. (2017) Cellular and molecular mechanisms of alcohol‐induced osteopenia. Cellular and Molecular Life Sciences, 74(24), 4443–4453. 10.1007/s00018-017-2585-y [DOI] [PMC free article] [PubMed] [Google Scholar]
- Maddalozzo, G.F. , Turner, R.T. , Edwards, C.T.H. , Howe, K.S. , Widrick, C.J. , Rosen, U.T. et al. (2009) Alcohol alters whole body composition, inhibits bone formation, and increases bone marrow adiposity in rats. Osteoporosis International, 20, 1529–1538. 10.1007/s00198-009-0836-y [DOI] [PubMed] [Google Scholar]
- Maurel, D.B. , Benaitreau, D. , Jaffré, C. , Toumi, H. , Portier, H. , Uzbekov, R. et al. (2014) Effect of the alcohol consumption on osteocyte cell processes: a molecular imaging study. Journal of Cellular and Molecular Medicine, 18(8), 1680–1693. 10.1111/jcmm.12113 [DOI] [PMC free article] [PubMed] [Google Scholar]
- Maurel, D.B. , Jaffre, C. , Rochefort, G.Y. , Aveline, P.C. , Boisseau, N. , Uzbekov, R. et al. (2011) Low bone accrual is associated with osteocyte apoptosis in alcohol‐induced osteopenia. Bone, 49(3), 543–552. 10.1016/j.bone.2011.06.001 [DOI] [PubMed] [Google Scholar]
- Maurel, D.B. , Pallu, S. , Jaffré, C. , Fazzalari, N.L. , Boisseau, N. , Uzbekov, R. et al. (2012) Osteocyte apoptosis and lipid infiltration as mechanisms of alcohol‐induced bone loss. Alcohol and Alcoholism, 47(4), 413–422. 10.1093/alcalc/ags057 [DOI] [PubMed] [Google Scholar]
- Milovanovic, P. & Busse, B. (2019) Inter‐site variability of the human osteocyte lacunar network: implications for bone quality. Current Osteoporosis Reports, 17(3), 105–115. 10.1007/s11914-019-00508-y [DOI] [PubMed] [Google Scholar]
- Mitchell, R. , McDermid, J. , Ma, M.M. & Chik, C.L. (2011) MELD score, insulin‐like growth factor 1 and cytokines on bone density in end‐stage liver disease. World Journal of Hepatology, 3(6), 157–163. 10.4254/wjh.v3.i6.157 [DOI] [PMC free article] [PubMed] [Google Scholar]
- Otete, H. , Deleuran, T. , Fleming, K.M. , Card, T. , Aithal, G.P. , Jepsen, P. et al. (2018) Hip fracture risk in patients with alcoholic cirrhosis: a population‐based study using English and Danish data. Journal of Hepatology, 69(3), 697–704. 10.1016/j.jhep.2018.04.002 [DOI] [PubMed] [Google Scholar]
- Plotkin, L.I. (2011) Connexin 43 and bone: not just a gap junction protein. Actualizaciones En Osteologia, 7(2), 79–90. http://www.ncbi.nlm.nih.gov/pubmed/22679450%0Ahttp://www.pubmedcentral.nih.gov/articlerender.fcgi?artid=PMC3367377 [PMC free article] [PubMed] [Google Scholar]
- Power, J. , Noble, B.S. , Loveridge, N. , Bell, K.L. , Rushton, N. & Reeve, J. (2001) Osteocyte lacunar occupancy in the femoral neck cortex: an association with cortical remodeling in hip fracture cases and controls. Calcified Tissue International, 69(1), 13–19. 10.1007/s00223-001-0013-6 [DOI] [PubMed] [Google Scholar]
- Rhee, Y. , Kim, W.J. , Han, K.J. , Lim, S.K. & Kim, S.H. (2014) Effect of liver dysfunction on circulating sclerostin. Journal of Bone and Mineral Metabolism, 32(5), 545–549. 10.1007/s00774-013-0524-z [DOI] [PubMed] [Google Scholar]
- Rolvien, T. , vom Scheidt, A. , Stockhausen, K.E. , Milovanovic, P. , Djonic, D. , Hubert, J. et al. (2018) Inter‐site variability of the osteocyte lacunar network in the cortical bone underpins fracture susceptibility of the superolateral femoral neck. Bone, 112(2017), 187–193. 10.1016/j.bone.2018.04.018 [DOI] [PubMed] [Google Scholar]
- Santori, C. , Ceccanti, M. , Diacinti, D. , Attilia, M.L. , Toppo, L. , D’Erasmo, E. et al. (2008) Skeletal turnover, bone mineral density, and fractures in male chronic abusers of alcohol. Journal of Endocrinological Investigation, 31(4), 321–326. 10.1007/BF03346365 [DOI] [PubMed] [Google Scholar]
- Schmidt, C. , Stürznickel, J. , Strahl, A. , Oheim, R. , Weiler‐Normann, C. , Sebode, M. et al. (2021) Bone microarchitecture in patients with autoimmune hepatitis. Journal of Bone and Mineral Research, 36(7), 1316–1325. 10.1002/jbmr.4289 [DOI] [PubMed] [Google Scholar]
- Sens, C. , Altrock, E. , Rau, K. , Klemis, V. , von Au, A. , Pettera, S. et al. (2017) An O‐glycosylation of fibronectin mediates hepatic osteodystrophy through α4β1 integrin. Journal of Bone and Mineral Research, 32(1), 70–81. 10.1002/jbmr.2916 [DOI] [PubMed] [Google Scholar]
- Stains, J.P. , Fontana, F. & Civitelli, R. (2020) Chapter 18 ‐ Intercellular junctions and cell–cell communication in the skeletal system. In Bilezikian, J.P. , Martin, T.J. , Clemens, T.L. & Rosen, C.J. (Eds.) Principles of bone biology, 4th edition. London: Academic Press, pp. 423–442. 10.1016/B978-0-12-814841-9.00018-X [DOI] [Google Scholar]
- Stains, J.P. , Watkins, M.P. , Grimston, S.K. , Hebert, C. & Civitelli, R. (2014) Molecular mechanisms of osteoblast/osteocyte regulation by connexin43. Calcified Tissue International, 94(1), 55–67. 10.1007/s00223-013-9742-6 [DOI] [PMC free article] [PubMed] [Google Scholar]
- Tratwal, J. , Labella, R. , Bravenboer, N. , Kerckhofs, G. , Douni, E. , Scheller, E.L. et al. (2020) Reporting guidelines, review of methodological standards, and challenges toward harmonization in bone marrow adiposity research. Report of the Methodologies Working Group of the International Bone Marrow Adiposity Society. Frontiers in Endocrinology, 11(February), 1–36. 10.3389/fendo.2020.00065 [DOI] [PMC free article] [PubMed] [Google Scholar]
- Wakolbinger, R. , Muschitz, C. , Scheriau, G. , Bodlaj, G. , Kocijan, R. , Feichtinger, X. et al. (2019) Bone microarchitecture and bone turnover in hepatic cirrhosis. Osteoporosis International, 30(6), 1195–1204. 10.1007/s00198-019-04870-6 [DOI] [PMC free article] [PubMed] [Google Scholar]
- Wakolbinger, R. , Muschitz, C. , Wallwitz, J. , Bodlaj, G. , Feichtinger, X. , Schanda, J.E. et al. (2020) Serum levels of sclerostin reflect altered bone microarchitecture in patients with hepatic cirrhosis. Wiener Klinische Wochenschrift, 132(1–2), 19–26. 10.1007/s00508-019-01595-8 [DOI] [PMC free article] [PubMed] [Google Scholar]
- Wölfel, E.M. , Jähn‐Rickert, K. , Schmidt, F.N. , Wulff, B. , Mushumba, H. , Sroga, G.E. et al. (2020) Individuals with type 2 diabetes mellitus show dimorphic and heterogeneous patterns of loss in femoral bone quality. Bone, 140(March), 115556. 10.1016/j.bone.2020.115556 [DOI] [PubMed] [Google Scholar]
- Woods, G.N. , Ewing, S.K. , Sigurdsson, S. , Kado, D.M. , Eiriksdottir, G. , Gudnason, V. et al. (2020) Greater bone marrow adiposity predicts bone loss in older women. Journal of Bone and Mineral Research, 35(2), 326–332. 10.1002/jbmr.3895 [DOI] [PubMed] [Google Scholar]
- Yanguas, S.C. , Willebrords, J. , Maes, M. , da Silva, T.C. , Pereira, I.V.A. , Cogliati, B. et al. (2016) Connexins and pannexins in liver damage. EXCLI Journal, 15, 177–186. 10.17179/excli2016-119 [DOI] [PMC free article] [PubMed] [Google Scholar]
- Yousry, W.A. , Hussein, M.M. , Mohse, M.M. , W, S. & El‐EZZ, M.A. (2016) Value of serum sclerostin in osteopenia and osteoporosis associated with liver cirrhosis and post liver transplantation. IOSR Journal of Dental and Medical Sciences, 15(08), 59–64. 10.9790/0853-1508065964 [DOI] [Google Scholar]
- Yu, N.Y. , Wolfson, T. , Middleton, M.S. , Hamilton, G. , Gamst, A. , Angeles, J.E. et al. (2017) Bone marrow fat content is correlated with hepatic fat content in paediatric non‐alcoholic fatty liver disease. Clinical Radiology, 72(5), 425.e9–425.e14. 10.1016/j.crad.2016.11.017 [DOI] [PMC free article] [PubMed] [Google Scholar]
Associated Data
This section collects any data citations, data availability statements, or supplementary materials included in this article.
Data Availability Statement
All data that support findings generated during this study are available from the corresponding author (Prof. Dr. Danijela Djonic) upon request.