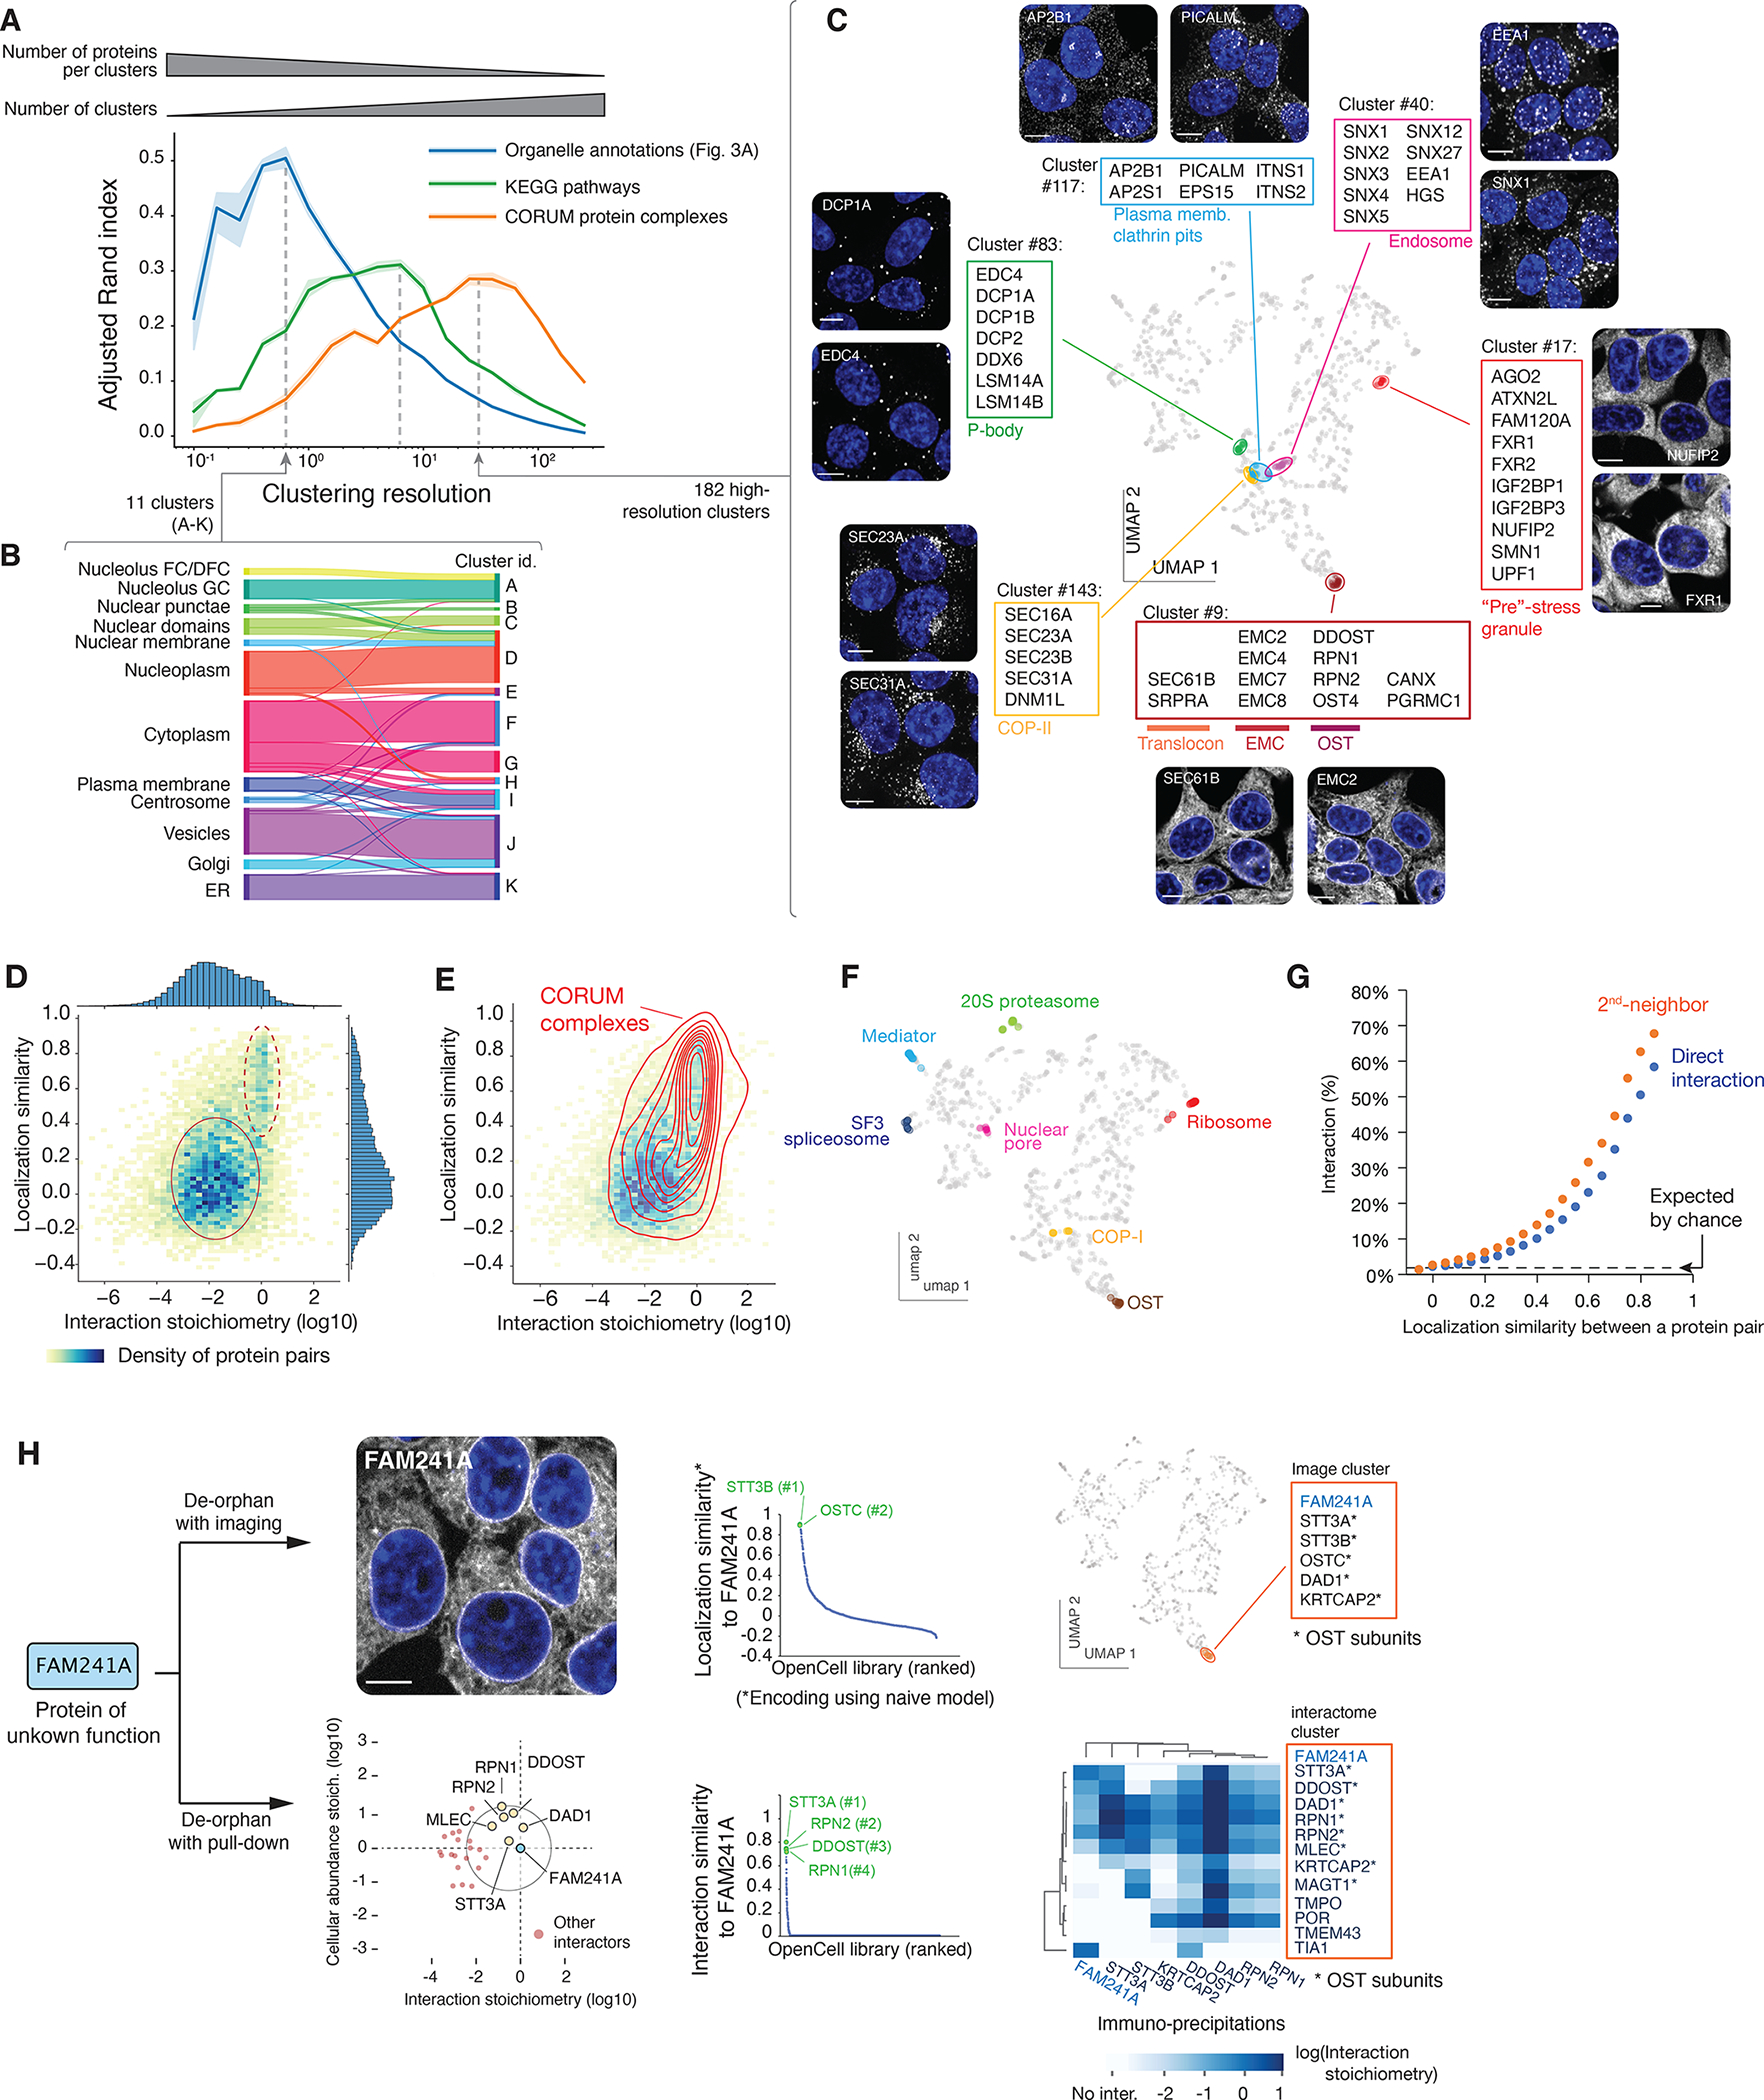
Figure 4: protein functional features derived from unsupervised image analysis.

(A) Comparison of image-based Leiden clusters with ground-truth annotations. The Adjusted Rand Index (ARI, (86)) of clusters relative to three ground-truth datasets is plotted as a function of the Leiden clustering resolution. ARI (a metric between 0 and 1, see Materials and Methods) measures how well the groups from a given partition (in our case, the groups of proteins delineated at different clustering resolutions) match groups defined in a reference set. The amplitude of the ARI curves is approximately equal to the number of pairs of elements that partition similarly between sets; the resolution at which each curve reaches its maximum corresponds to the resolution that best captures the information in each ground-truth dataset. At a low resolution, Leiden clustering delineates groups that recapitulate about half of the organellar localization annotations, while at increasing resolutions, clustering recapitulates about a third of pathways annotated in KEGG, or molecular protein complexes annotated in CORUM. Shaded regions show standard deviations calculated from 9 separate repeat rounds of clustering, and average values are shown as a solid line. (B) High correspondence between low-resolution image clusters and cellular organelles. (C) Examples of functional groups delineated by high-resolution image clusters, highlighted on the localization UMAP. (D) Heatmap distribution of localization similarity (defined as the Pearson correlation between two deep learning-derived encoding vectors) vs. interaction stoichiometry between all interacting pairs of OpenCell targets. Two discrete sub-groups are outlined: low stoichiometry/low localization similarity pairs (solid line) and high stoichiometry/high localization similarity pairs (dashed line). (E) Probability density distribution of CORUM interactions mapped on the graph from (D). Contours correspond to iso-proportions of density thresholds for each 10th percentile. (F) Localization patterns of different subunits from example stable protein complexes, represented on the localization UMAP. (G) Frequency of direct (1st-neighbor) or once-removed (2nd neighbor, having a direct interactor in common) protein-protein interactions between any two pairs of OpenCell targets sharing localization similarities above a given threshold (x-axis). (H) Parallel identification of FAM241A as a new OST subunit by imaging or mass-spectrometry. See text for details.
