

Abstract
With the emergence of the Industry 4.0 era in China, more refined methods are being proposed for healthy living requirements for human settlements. Since the rural human settlements in China are relatively backward, this study aimed to investigate the influencing factors of human health. First, through field surveys and questionnaires conducted with villagers in Xiangxi's traditional villages in Hunan Province, we analyzed the factors affecting human health qualitatively and quantitatively using the SPSS software. We identified three main dimensions affecting human health in rural human settlements including human behavioral activities, physical environment, and natural environment. Then, we used correlation analysis and multiple linear regression analysis methods to analyze the correlation between environmental factors and human health. The results showed that human activities, building physical environment, and natural environment are significantly correlated with human health. Among them, human behavior has the strongest correlation with health. This research contributes to creating healthy human settlements and guiding the creation of a healthy environment in rural China.
1. Introduction
Under the backdrop of the Industry 4.0 paradigm, various industries around the world are gradually intelligent, integrated, and automated. Big data, interconnections, and artificial intelligence have been applied in the construction elements, which tend to develop in the directions of digitized, multifunctional, and health promotion [1–10]. Compared with traditional construction methods, Industry 4.0 has brought an innovation orientation and technological advancements to China's construction industry and improved the quality of human settlements, efficiency, and safety of construction processes [11–17]. With the increased emphasis on health performance in settlements, how to build a living environment that meets the needs of human health in the era of Industry 4.0 remained unclear, especially on environmental factors that affect health in different settings. Existing research on healthy architecture and living environments is valuable and involves multidimensional and multilevel fields, such as medicine, psychology, society, and planning [18–21].
In recent years, under the background of Industry 4.0, science and technology have developed rapidly in China. Research on the health of human settlements has been extensive, but most of it relates to urban settlements, while studies on the construction of traditional villages have been rare [22]. The production mode of construction industrialization has many advantages, including high production efficiency, good quality, low construction cost, saving resources, and protecting the environment. It can greatly improve the problems existing in rural housing, with the following positive effects:
① Improve the quality of housing construction
② Improve energy conservation and emission reduction
③ Improve the style of rural housing
④ Improve the construction speed
⑤ Improve the comfort of living environment
⑥ Reduce construction costs
⑦ Stimulate rural economic growth and resolve excess capacity [23, 24]
Therefore, the industrialized production of construction is the development trend of the construction mode of new rural construction in the future, and the state has issued a series of policies and measures to promote the industrialized construction and development of rural areas. To further promote the steady and healthy development of industrialization in rural areas, the healthy living environment in rural areas [23, 24]isfocused. Due to the acceleration of China's economic, social development, and process of urbanization, a large number of young laborers from rural areas have poured into cities, resulting in the widespread phenomenon of elderly people and children left behind in rural areas and even the emergence of “ghost villages.” Numerous theoretical studies have shown that the living environment is directly related to the physical and mental health of the residents[25–27]. The rural environment in China is significantly different from the urban environment in terms of infrastructure, humanities and culture, and living conditions, thus resulting in significant differences in the physical and mental health levels of different groups of residents [28–30]. Generally, the village environment is rich in green resources and has good geography. In addition, the layout of the village and the housing structure follow the traditional idea of harmony between man and nature. These factors have a positive impact on human health. At the same time, bottlenecks in transportation, poor infrastructure construction, and physical environment need urgent improvements as such problems have a negative effect on people's physical and mental health. Therefore, to optimize rural human settlements and improve their physical and mental health, we aimed to conduct a correlation study on the influencing factors of health among rural humans.
2. Literature Review
Human health is a complex and comprehensive research topic involving multiple fields of study, such as medicine, sociology, and environmental science. Human settlement is a complex manifestation of many factors related to humanity, nature, and society. A healthy and comfortable human settlement can stabilize people's emotions and is conducive to physical and mental health; hence, building healthy human settlements is one of the trends of the construction industry under the background of Industry 4.0. In foreign countries, they have paid more attention to the construction of healthy human settlements earlier and have obtained substantial research results. Many international organizations, such as the World Health Organization, the European Environment Agency, and the United Nations Environment Program, have issued a series of guidelines and standards for healthy environments [31, 32]. In recent years, the WELL building standards released in the United States have established indicators for assessing the building environment across seven areas, namely air, water, nutrition, light, fitness, comfort, and mood. The associated research has presented various perspectives [33]. Previous research scholars have used different methodologies and techniques to systematically assess the health performance of living environments involving different spatial environments and specific populations [34, 35]. In addition, previous mixed-methods studies have examined the interactions and feedback between multiple environmental physical factors and human health and propounded the possibilities and ways to achieve healthy living in an increasingly urbanized built environment [25, 36–44].
With the emphasis on healthy human settlements in China, deep and relevant research in multiple fields has been developed. Numerous scholars have analyzed in detail the health indicator systems of different urban environments, including transportation systems, infrastructure, air quality, sewage treatment, health care, social development, environmental management, and lifestyles. Many analysis methods have also been used to conduct relevant health assessments on environmental factors [45–52]. Most studies on healthy human settlements in China have focused on urban areas, whereas the rural environment in China has significant differences from urban areas in terms of spatial distribution, lifestyle, humanistic characteristics, infrastructure, and other environmental factors. Many studies have shown that various environmental factors with distinct rural characteristics influence people's lifestyles and behaviors at the social, humanistic, and material levels, which in turn have positive or negative effects on human physical and mental health [53–58]. Therefore, this work took Xiangxi's traditional villages in China as an example and conducted a correlation study on their human settlements related to human health.
3. Research Plan Design
3.1. Research Object
There are many traditional Chinese villages with obvious and different characteristics. With regard to the list of five batches of “Chinese traditional villages” published, the number of traditional villages distributed in Xiangxi has reached 172. At the same time, due to the special geographical and ecological environment and historical changes, Xiangxi still retains a relatively complete village form and humanistic tradition. Since ancient times, many ethnic groups, including Miao, Han, Tujia, Dong, and Yao, have been living in the area, with strong ethnic characteristics and living features. Therefore, we selected traditional villages with essentially complete settlement patterns as the main research focus. Our list comprised Lahao Village in the Duli Township of Fenghuang County, Laodong Village in the Machong Township, and Guantianshan Village (Figure 1). The long-term residents of the village were randomly selected as the study participants. Following uniform standards, we adopted methods such as the interview and participatory observation method to obtain information from the participants. Basic data were obtained by mapping and basic testing the human settlements of the villages.
Figure 1.

Area where the Xiangxi villages are located.
3.2. Research Methods
To obtain the health indicators of the permanent residents in the Xiangxi rural environment, this study used the SF-36 scale to measure the eight dimensions of general health, physical function, physical role, somatic pain, vitality, social function, emotional function, and mental health [59, 60]. The average of the total scores of the eight dimensions was used as the dependent variable y as an overall indicator for health evaluation. Second, according to the survey indicators of the human settlements, a questionnaire for the healthy villages' human settlements was constructed by reviewing the literature and consulting experts while considering the operability of data collection and the specificity of village lifestyles. When screening the evaluation indicators of the questionnaires, the first-level criteria layer was determined as the three dimensions of human behavior, natural environment, and physical environment by literature review. The secondary evaluation factors were 16 relevant environmental evaluation indicators based on existing studies, and after consulting with relevant scholars and experts by email in various fields such as architecture, planning and design, and landscape professionals, the evaluation feedback was filtered and modified based on expert feedback. After multiple additions and deletions of evaluation factors, a total of 18 factors were determined from three dimensions of human behavior, natural environment, and building physical environment. Related questions were set up around the 18 factors to form a structured questionnaire (Table 1). By designing a Likert scale, this study divided the evaluation factors of the environment into five evaluations based on the statements regarding the attitudes of approval or disapproval: very good, good, fair, poor, and very poor. We transformed the scale into a fixed-distance evaluation level of subjective evaluation [61, 62].
Table 1.
Human settlement assessment factors of Xiangxi villages.
| Dimension (A) | Evaluation factor (B) |
|---|---|
| Human behavior (A1) | B1 daily physical pattern and frequency |
| B2 daily walking distance | |
| B3 frequency of communication with neighbors | |
| B4 daily hobbies and interests | |
| B5 daily cooking style | |
| B6 understanding of and access methods to health knowledge | |
| Natural environment (A2) | B7 air quality of the natural environment |
| B8 climate temperature and humidity comfort | |
| B9 daily noise pollution | |
| B10 waste disposal methods | |
| B11 medical level and care | |
| B12 living house orientation | |
| Physical environment (A3) | B13 indoor temperature and humidity in summer and winter |
| B14 construction methods and materials of the houses | |
| B15 indoor hygienic environment conditions | |
| B16 indoor ventilation and lighting conditions | |
| B17 indoor and outdoor vegetation and greenery | |
| B18 embodiment of regional culture decoration |
Correlation analysis was performed on the health self-assessment results and environmental influences. Subsequently, multiple linear regression analysis was used to establish regression equations to further explore the association between health and environment. All analyses were performed using SPSS.
3.3. Research and Analysis
3.3.1. Sample Characteristics
Of the 160 questionnaires distributed, 153 participants completed the assessment. The effective response rate was 95.6%. Among the 153 qualified participants, 73 (47.7%) were aged over 60 years and 83 (54.2%) were female (Table 2). In the SF-36 health assessment, 19 (12.4%) rated their overall health status as “excellent,” 53 (34.6%) as “very good,” 45 (29.4%) as “good,” 35 (22.9%) as “fair,” and 1 (0.7%) as “poor.”
Table 2.
Summary of basic information of the questionnaire.
| Statistical index | Frequency | Proportion (%) | |
|---|---|---|---|
| Gender | Male | 70 | 45.8 |
| Female | 83 | 54.2 | |
| Age | ≤18 | 8 | 5.2 |
| 19–39 | 27 | 17.6 | |
| 40–59 | 45 | 29.4 | |
| 60–79 | 65 | 42.5 | |
| ≥80 | 8 | 5.2 | |
| Education level | Primary school and below | 116 | 75.8 |
| Middle school | 23 | 15.0 | |
| High school/junior college | 12 | 7.8 | |
| College and above | 2 | 1.3 | |
Xiangxi is in the northwestern part of Hunan Province, China, east of the Wuling Mountains areas of the Yungui Plateau. In total, 401 villages in Hunan Province are included in the fifth batch of the list of traditional villages in China, and Xiangxi accounts for 90 villages. Xiangxi is dotted with many Miao traditional villages of different forms and long histories. The climate in Xiangxi has four distinct seasons, with rainfall concentrated between April and June, accounting for 41–47% of the annual precipitation. Due to the complex terrain and the influence of airflow, the amount of solar radiation received varies, and the lighting and temperature of each region are different.
As an example, a typical local traditional residential building was mapped and tested for temperature, humidity, and light level. Using a French KIMO HD100S portable hygrometer thermometer with a temperature and humidity monitor, measurements were taken during the hours of 8 : 00–19 : 00 from January 15 to January 17 in a typical local winter season and from July 9 to 11 in a summer season, and the temperature and humidity of the measurement points (at 1.1 m from the ground) were recorded with an interval of 30 minutes. The measurement points were at five locations: outdoor courtyard, lobby, bedroom, kitchen, and fire pit, as shown in Figure 2 and Table 3. The results showed that the indoor and outdoor humidity was generally high, and the difference between the indoor and outdoor temperatures in summer and winter was within 3 °C due to the influence of the houses' construction materials and methods. The residential heating in winter mainly relied on firewood, which causes pollution.
Figure 2.

Temperature, humidity, and illuminance detection point of a typical traditional house.
Table 3.
Temperature and humidity data of the measurement points in summer and winter.
| Measurement point | Average summer temperature (°C) | Average summer humidity (%) |
|---|---|---|
| 1 | 31.5 | 82.7 |
| 2 | 29.6 | 88.5 |
| 3 | 29.4 | 85.7 |
| 4 | 29.8 | 88.9 |
| 5 | 29.1 | 89.2 |
|
| ||
| 1 | 6.4 | 75.7 |
| 2 | 7.3 | 78.5 |
| 3 | 7.1 | 77.7 |
| 4 | 7.9 | 79.6 |
| 5 | 8.5 | 76.9 |
To measure the indoor and outdoor illumination conditions, a Sigma AS82 handheld illuminance meter was used, and measurements were made at 12 : 00 noon on January 15 in winter and July 9 in summer. The weather we chose to measure was cloudy days without precipitation in winter and sunny days in summer, as shown in Table 4. Considering the different degrees of the influence of illumination on functional rooms, the measurement points included the outdoor courtyard, foyer, bedroom, kitchen, and fire pit. In addition to the five measurement points, the bathroom was also included as an illumination measurement point, as shown in Table 4. Due to the long scale of building depth and the limitation of building materials for the window and door openings, the indoor lighting was fair.
Table 4.
Illuminance data of the measurement points in summer and winter.
| Measurement point | Summer illuminance (lux) | Winter illuminance (lux) |
|---|---|---|
| 1 | 63701 | 3614 |
| 2 | 330 | 281 |
| 3 | 236 | 168 |
| 4 | 305 | 204 |
| 5 | 179 | 115 |
| 6 | 158 | 177 |
3.3.2. Reliability and Validity Test
This study used Cronbach's alpha coefficient to test the inherent reliability of the survey questionnaire. The range of Cronbach's alpha coefficient is between 0.00 and 1.00, with higher values indicating higher reliability and lower values indicating lower reliability. The survey results show that the overall Cronbach's alpha coefficient of the dimension of human behavior in the questionnaire was 0.723; the coefficient of the second dimension of the questionnaire of the physical environment of the building was 0.972; and the coefficient of the third dimension of the natural environment was 0.849, indicating that the questionnaire had good reliability and the measurement results were reliable (Table 5).
Table 5.
Reliability test results.
| Cronbach's coefficient | Number of terms |
|---|---|
| People 0.723 | 4 |
| Building 0.972 | 10 |
| Nature 0.849 | 4 |
Validity tests were conducted using structural validity, and the KMO test and the Bartlett sphere test were used. When the KMO test coefficient is greater than 0.50 and the Bartlett sphere test, X2 has a P value less than 0.05, and the research questionnaire has structural validity. Validity tests were performed on the three dimensions, and the respective KMO test values were 0.702, 0.903, and 0.801, all of which were greater than 0.70. The corresponding P values were less than 0.05. The significant difference between the correlation coefficient and the unit matrix indicates that there is a correlation among the survey data. Therefore, the questionnaire has structural validity.
3.3.3. Correlation Analysis
Through the analysis of the questionnaire, the total score of the eight dimensions of the SF-36 health evaluation result was used as the dependent variable y, and the 18 environmental factor assignment calculations were divided into three dimensions using SPSS for correlation analysis. The Pearson correlation value is between [−1, +1]. A value greater than 0 means positive correlation, and a value less than 0 means negative correlation. The closer the absolute value is to 1, the stronger the correlation is. Since the data belonged to different populations, to decrease potential confounding of health status, gender, age, and education level were added to the correlation analysis as independent variables. In the correlation analysis results, the significance of the four variables of people, build, nature, and age is 0.000, 0.039, 0.009, and 0.000, all of which were less than 0.05 and statistically significant. Among population attributes, gender, education level, and health status had no significant correlation, while age and health status were significantly negatively correlated. In addition, the Pearson value corresponding to age is -0.495, indicating a negative correlation, and the older the age, the worse the health. In the three dimensions of people, build, and nature, the value of the Pearson correlation with y was 0.520, 0.167, and 0.211, all of which are positive numbers, suggesting that the variables of the three dimensions are positively correlated with the dependent variable y. Table 6 shows that human behavior has a stronger correlation with health status, whereas the correlation between the physical and natural environment of the building and health status is weak. Among these three dimensions, the factors that have the strongest correlation with health status are “daily physical activity level,” “summer indoor temperature evaluation,” and “housing orientation evaluation.”
Table 6.
Correlation analysis results.
| Gender | Age | Education level | People | Building | Nature | Y | ||
|---|---|---|---|---|---|---|---|---|
| Gender | Pearson's correlation | 1 | 0.062 | 0.015 | 0.149 | −0.054 | −0.050 | −0.012 |
| P (two-tailed) | 0.448 | 0.859 | 0.067 | 0.508 | 0.542 | 0.882 | ||
| N | 153 | 153 | 153 | 153 | 153 | 153 | 153 | |
|
| ||||||||
| Age | Pearson's correlation | 0.062 | 1 | −0.355∗∗ | −0.140 | −0.078 | −0.235∗∗ | −0.495∗∗ |
| P (two-tailed) | 0.448 | 0.000 | 0.084 | 0.340 | 0.004 | 0.000 | ||
| N | 153 | 153 | 153 | 153 | 153 | 153 | 153 | |
|
| ||||||||
| Education level | Pearson's correlation | 0.015 | −0.355∗∗ | 1 | −0.009 | −0.025 | 0.059 | 0.102 |
| P (two-tailed) | .859 | 0.000 | 0.913 | 0.758 | 0.470 | 0.211 | ||
| N | 153 | 153 | 153 | 153 | 153 | 153 | 153 | |
|
| ||||||||
| People | Pearson's correlation | 0.149 | −0.140 | −0.009 | 1 | −0.116 | −0.012 | 0.520∗∗ |
| P (two-tailed) | 0.067 | 0.084 | 0.913 | 0.154 | 0.887 | 0.000 | ||
| N | 153 | 153 | 153 | 153 | 153 | 153 | 153 | |
|
| ||||||||
| Building | Pearson's correlation | −0.054 | −0.078 | −0.025 | −0.116 | 1 | −0.056 | 0.167∗ |
| P (two-tailed) | 0.508 | 0.340 | −0.758 | 0.154 | 0.489 | 0.039 | ||
| N | 153 | 153 | 153 | 153 | 153 | 153 | 153 | |
|
| ||||||||
| Nature | Pearson's correlation | −0.050 | −0.235∗∗ | 0.059 | −0.012 | −0.056 | 1 | 0.211∗∗ |
| P (two-tailed) | 0.542 | 0.004 | 0.470 | 0.887 | 0.489 | 0.009 | ||
| N | 153 | 153 | 153 | 153 | 153 | 153 | 153 | |
|
| ||||||||
| Y | Pearson's correlation | −0.012 | −0.495∗∗ | 0.102 | 0.520∗∗ | 0.167∗ | 0.211∗∗ | 1 |
| P (two-tailed) | 0.882 | 0.000 | 0.211 | 0.000 | 0.039 | 0.009 | ||
| N | 153 | 153 | 153 | 153 | 153 | 153 | 153 | |
∗∗ P < 0.01. ∗P < 0.05.
3.3.4. Regression Model Establishment
The independent variables were quantitative and more than one in number in our research, so we choose the multiple linear regression analysis method to examine the relationship between the independent variables of the three dimensions and health status. The mathematical model of multiple linear regression is E(y) = β0 + β1x1 + β2x2 + … + βp, where xp explains the linear change in y caused by the change in variable x; xp(i = 1,…, p) is the independent variable; p is the number of independent variables; β0 is the constant term of the regression equation; and βp(i = 1,…, p) is the regression coefficient.
The scores of gender, age, education level, mean values of the scores of human behavior, building physical environment, and natural environment were taken as the six independent variables, and regression analysis was performed with the dependent variable as health status. The results show that the D-W test value was 1.630 and its value tended to 2, indicating that there was no autocorrelation. That is, heteroscedasticity was considered not to exist (Table 7). R2 was 0.508, which suggested that the independent variables of the three dimensions could jointly explain 50.8% of the dependent variable.
Table 7.
D-W test results.
| Model | R | R 2 | Adjusted R2 | Error in standard estimate | Durbin–Watson |
|---|---|---|---|---|---|
| 1 | 0.713a | 0.508 | 0.488 | 18.87590 | 1.630 |
a. Predictor variables: constant, nature, people, building, gender, age, and education level. b. Dependent variable: y.
We performed the F test on the model, and the model's P value is less than 0.001, indicating that the model passed the F test, and the linear relationship was valid. At the same time, the statistical significance of the regression model also indicated that compared with the null model, the inclusion of independent variables helped to predict the dependent variable, or that the model was better than the null model; that is, at least one of the six independent variables could affect the health status (Table 8).
Table 8.
F test results.
| Model | Sum of squares | Degree of freedom | Mean square | F | P | |
|---|---|---|---|---|---|---|
| 1 | Regression | 53792.997 | 6 | 8965.500 | 25.163 | 0.000(b) |
| Residual | 52019.735 | 146 | 356.300 | |||
| Sum | 105812.733 | 152 | ||||
(a) Dependent variables: y. (b) Predictor variables: constant, nature, people, building, gender, age, and education level.
Through the verification analysis, the results of the histogram showed that the curve was roughly normal distribution; the closer the distribution of each point in the normal P-P graph was to the diagonal line, the closer the data were to the normal distribution. Figures 3 and 4 depict that the residuals were approximately normally distributed, and the regression model was statistically significant.
Figure 3.

Histogram residual.
Figure 4.
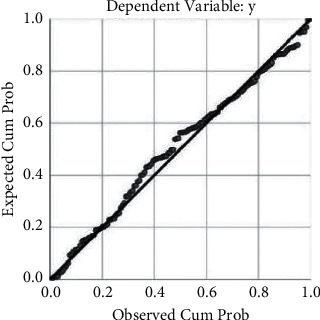
Normal P-P plot of regression standardized.
In the regression, the dependent variable y was health status; the independent variables were gender, age, education level, people, building, and nature, which represented the four independent variables of age, human behavioral activities, building physical environment, and natural environment, respectively. The P value for each of these four independent variables was less than 0.05. The following equation was established:
| (1) |
That is, for each additional person, y increased by 12.095 units; for each unit increase in building, y increased by 4.259 units; for each unit volume increase in nature, y increased by 5.122 units; and for every unit increase in age, y decreased by 10.395 units (Table 9).
Table 9.
Regression analysis results.
| Model | Nonstandardized coefficient | Standardized coefficient | t | P | |
|---|---|---|---|---|---|
| B | Standard error | β | |||
| Constant | 122.422 | 12.203 | 10.032 | .000 | |
| Gender | −2.320 | 3.115 | 0-.044 | −0.745 | .458 |
| Age | −10.395 | 1.757 | 0-.387 | −5.917 | .000 |
| Education level | −1.312 | 2.417 | 0-.034 | −0.543 | .588 |
| People | 12.095 | 1.464 | 0.496 | 8.259 | .000 |
| Building | 4.259 | 1.266 | 0.199 | 3.363 | .001 |
| Nature | 5.122 | 2.240 | 0.137 | 2.286 | .024 |
Dependent variable: y.
4. Conclusions and Recommendations
With the acceleration of China's economic and social development and urbanization, the population structure of China is gradually changing into an aging population. In this study, 47.7% of the study participants were aged 60 years and above; most of the elderly were unaccompanied by children at home; and their physical functions have reduced over time. Some studies have shown that age is one of the main elements affecting health assessment, followed by gender, income, physical environment, health-related behaviors, and regional medical level. These are all factors relevant to health status [63–67].
The results of the univariate analysis in this study show that age was correlated with overall health negatively and significantly; that is, the higher the age, the lower the health self-assessment score. Income and education were not significantly correlated with health assessment results, and this result was related to the overall low income and low education level of the research subjects. At the same time, the results of this survey show that gender was not significantly correlated with health assessment results, because within the scope of the survey, gender differences are associated with cultural, social status, division of labor, living habits, etc., all of which can indirectly affect physical health [68, 69]. Among the eight dimensions of health assessment, older adults had lower mental health scores and generally were depressed and had negative emotional conditions due to lack of family companionship and recreational life. Some scholars have found that gender, age, ethnicity, hobbies, life satisfaction, and physical health were associated with mental health among the Xiangxi older adults [70–72].
Second, about 82.4% of the villagers among the research subjects needed to perform daily work activities and therefore maintained a certain amount of daily exercise. In the correlation analysis of this study, the factor “daily physical activity level” in the dimension of “human behavior” was significantly correlated with the health status. In the specific environment and cultural background of rural areas in China, work activity is an essential life support behavior, and this necessary lifestyle has a positive impact on the health of the research subjects. In the survey area, many medical records and surveys have shown that the lifestyle, medical condition, and labor intensity had a certain impact on human physical and mental health, and the health level of urban and rural residents is different [73–75].
The building physical environment has a direct impact on human perception, and the results of this study show that the “building physical environment” has a significant correlation with health status. We investigated the issues related to the setting of room temperature and humidity, kitchen drainage, and room spatial scale in the building physical environment. The strongest correlation with the dependent variable health status was the “summer indoor temperature evaluation.” This is consistent with many existing research results such as indoor air pollution, heat, and humidity conditions affecting human health [76].
The natural environment is closely related to human health. In traditional Chinese culture, related theories emphasize the harmonious relationship between nature, architecture, and human beings. Our findings suggested that the natural environment and health status have a significant correlation, among which the univariate analysis showed that the “housing orientation evaluation” under the “natural environment” dimension had the strongest correlation [77–80].
Lastly, we proposed the following suggestions for healthy rural human settlements in Xiangxi. (1) Pay attention to the physical and mental health of the elderly living in the villages; increase the village infrastructure for adapting to the aged; improve the medical service system; enrich the recreational life of the middle-aged and elderly; and realize “healthy elderly care.” At the same time, promote healthy lifestyles and popularize knowledge about healthy living for all. (2) Improve the living environment of villages and improve the comfort and convenience of the indoor environment of buildings. Modernize and renovate the pollution sources of the indoor environment and pay attention to the heat insulation performance of the houses. (3) Consider the orientation and the influence of light in the layout and site selection of the building. Draw lessons from the traditional village Taoist law of nature, the harmony between man and nature, and the movement according to time. Focus on the relationship between man and nature in urban architectural design to promote a positive impact on human health.
The questionnaire design in this study considered limited dimensions and factors. Considering the operability and practicality of the data, it mainly focused on architecture and environmental psychology, but many environmental impact factors were not included. Future studies should consider including more covariates.
Acknowledgments
The authors show special gratitude to the reviewers for their careful evaluation and useful comments. This research was funded by the National Natural Science Foundation of China (52078484) and the Nature Science Fund of Hunan Province (2020JJ4727).
Data Availability
The data used to support the findings of this study are included within the article.
Conflicts of Interest
The authors declare no conflicts of interest.
Authors' Contributions
S.T., Y.Z., and Z.L. conceptualized the study. S.T. and Y.Z. developed methodology, performed formal analysis, and wrote and prepared the original draft; S.T. and Z.L. reviewed and edited the manuscript. Y.Z. visualized the study; S.T. supervised the study and administered the project; and Z.L acquired funding. All authors have read and agreed to the published version of the manuscript.
References
- 1.Lasi H., Fettke P., Kemper H.-G., Feld T., Hoffmann M. Industry 4.0. Business & Information Systems Engineering . 2014;6(4):239–242. doi: 10.1007/s12599-014-0334-4. [DOI] [Google Scholar]
- 2.Gorecky D., Schmitt M., Loskyll M., Zuhlke D. Human-machine-interaction in the industry 4.0 era. Management Science . 2014;23(6):595–605. [Google Scholar]
- 3.Kiel D., Müller J. M., Arnold C., Voigt K.-I. Sustainable industrial value creation: benefits and challenges of industry 4.0. International Journal of Innovation Management . 2017;21(8) doi: 10.1142/s1363919617400151.1740015 [DOI] [Google Scholar]
- 4.Kozlovska M., Klosova D., Strukova Z. Impact of industry 4.0 platform on the formation of construction 4.0 concept: a literature review. Sustainability . 2021;13(5):p. 2683. doi: 10.3390/su13052683. [DOI] [Google Scholar]
- 5.Perrier N., Bled A., Bourgault M., et al. Construction 4.0: a survey of research trends. Journal of Information Technology in Construction . 2020;25:416–437. doi: 10.36680/j.itcon.2020.024. [DOI] [Google Scholar]
- 6.Bona G. D., Cesarotti V., Arcese G., Gallo T. Implementation of Industry 4.0 technology: new opportunities and challenges for maintenance strategy. Procedia Computer Science . 2021;180:424–429. doi: 10.1016/j.procs.2021.01.258. [DOI] [Google Scholar]
- 7.Dallasega P., Rauch E., Linder C. Industry 4.0 as an enabler of proximity for construction supply chains: a systematic literature review. Computers in Industry . 2018;99:205–225. doi: 10.1016/j.compind.2018.03.039. [DOI] [Google Scholar]
- 8.Murugaiyan P., Ramasamy P. Analyzing interrelated enablers of industry 4.0 for implementation in present industrial scenario. Management Research Review . 2021;44(9):1241–1262. doi: 10.1108/mrr-08-2020-0499. [DOI] [Google Scholar]
- 9.Jimeno-Morenilla A., Azariadis P., Molina-Carmona R., Kyratzi S., Moulianitis V. Technology enablers for the implementation of Industry 4.0 to traditional manufacturing sectors: a review. Computers in Industry . 2021;125:p. 103390. doi: 10.1016/j.compind.2020.103390. [DOI] [Google Scholar]
- 10.Qin S., Cheng K. Special issue on future digital design and manufacturing: embracing industry 4.0 and beyond. Chinese Journal of Mechanical Engineering . 2016;29(6):p. 1045. doi: 10.3901/cjme.2016.0909.110. [DOI] [Google Scholar]
- 11.You Z., Feng L. Integration of industry 4.0 related technologies in construction industry: a framework of cyber-physical system. IEEE Access . 2020;8:122908–122922. doi: 10.1109/access.2020.3007206. [DOI] [Google Scholar]
- 12.Li J., Yang H., Zhao L. A research on development of construction industrialization based on BIM technology under the background of industry 4.0. Matec Web of Conferences . 2017;100:p. 2046. doi: 10.1051/matecconf/201710002046. [DOI] [Google Scholar]
- 13.Wang Z., Xu T., Zhou Q. Exploration on construction mode of training base under background of Industry 4.0. Experimental Technology and Management . 2015 [Google Scholar]
- 14.Li L. China’s manufacturing locus in 2025: with a comparison of “Made-in-China 2025” and “Industry 4.0”. Technological Forecasting and Social Change . 2018;135:66–74. doi: 10.1016/j.techfore.2017.05.028. [DOI] [Google Scholar]
- 15.Tian S., Pan Z. Made in China 2025” und Industrie 4.0” – Gemeinsam in Bewegung . Berlin Heidelberg: Springer; 2016. [Google Scholar]
- 16.Wang J., Wu H., Chen Y. Made in China 2025 and manufacturing strategy decisions with reverse QFD. International Journal of Production Economics . 2020;224 doi: 10.1016/j.ijpe.2019.107539.107539 [DOI] [Google Scholar]
- 17.Zhang P., Liu H., Wenjing L. I., Fanqin Z. H. O. Industrial intelligent network: deepening and upgrading of industrial Internet. Journal on Communications . 2018;39(12):p. 134. [Google Scholar]
- 18.Zumelzu A., Herrmann-Lunecke M. G. Mental well-being and the influence of place: conceptual approaches for the built environment for planning healthy and walkable cities. Sustainability . 2021;13 doi: 10.3390/su13116395. [DOI] [Google Scholar]
- 19.Yu T., hen H. C., Li Z., He Q., Lin B. An efficient method of evaluating large scale urban residential skylight environment and an empirical study of Beijing main area. 建筑模拟(英文) . 2021;14(4):p. 13. doi: 10.1007/s12273-020-0704-4. [DOI] [Google Scholar]
- 20.Clavier C., Gendron S., Lamontagne L., Potvin L. Understanding similarities in the local implementation of a healthy environment programme: insights from policy studies. Social Science & Medicine . 2012;75(1):171–178. doi: 10.1016/j.socscimed.2012.02.044. [DOI] [PubMed] [Google Scholar]
- 21.Cheng-Chen C. [Incorporating smart technologies and resilience into healthy living environment designs] . Hu li za zhi The journal of nursing . 2019;66(3):23–28. doi: 10.6224/JN.201906_66(3).04. [DOI] [PubMed] [Google Scholar]
- 22.Wang Q., Chong M., Li G., Liu M. Development concept,status and trend of healthy building in China. Building Science . 2018;9:12–17. [Google Scholar]
- 23.Xiao S., Hao S. Y., Xu R. A strategic analysis of developing prefabricated building in China’s rural area. Journal of Engineering Management . 2018 [Google Scholar]
- 24.Zhang Y., Chen Z., Sun H., Zhang S., Feng K., Liu H. Research on development countermeasures of prefabricated buildings in new rural construction -- A case study of longfeng village, hunan province. E3S Web of Conferences . 2019;136:p. 4056. doi: 10.1051/e3sconf/201913604056. [DOI] [Google Scholar]
- 25.Biswas A. A nexus between environmental literacy, environmental attitude and healthy living. Environmental Science and Pollution Research . 2020;27(6):5922–5931. doi: 10.1007/s11356-019-07290-5. [DOI] [PubMed] [Google Scholar]
- 26.Bungău C. C., Prada I. F., Prada M., Bungău C. Design and operation of constructions: a healthy living environment-parametric studies and new solutions. Sustainability . 2019;11(23):p. 6824. [Google Scholar]
- 27.Morris J., Deeming C., Wilkinson P., Dangour A. D. Action towards healthy living--for all. International Journal of Epidemiology . 2010;39(1):266–273. doi: 10.1093/ije/dyp403. [DOI] [PubMed] [Google Scholar]
- 28.Guo B., Cheng H., Liu Y. Study on influencing factors of health service utilization of rural elderly from the perspective of healthy aging. Chinese Medical Ethics . 2019 [Google Scholar]
- 29.Peng C., Zhang C. Rural residential environment quality and its influencing factors. Journal of Macro-quality Research . 2019 [Google Scholar]
- 30.Groot R. D., Katja V., Schoonmade L. J., de Kort W. L., Brug J., Lakerveld J. Urban-rural differences in the association between blood lipids and characteristics of the built environment: a systematic review and meta-Analysis. British Medical Journal Global Health . 2019;4(1) doi: 10.1136/bmjgh-2018-001017. [DOI] [PMC free article] [PubMed] [Google Scholar]
- 31. Environmental Risk Assessment: Approaches, Experiences and Information sources[S] Copenhagen K Denmark: Europian Environment Agency; 2016. [Google Scholar]
- 32.European Centre for Disease Prevention and Control. Operational Guidance on Rapid Risk Assessment Methodology . Solna Municipality, Sweden: European Centre for Disease Prevention and Control; 2011. [Google Scholar]
- 33. WELL Building Standard V1 with January 2017 Addenda . IWBI; 2017. [Google Scholar]
- 34.Zheng R. F., Choi J. H. Analysis OF exploratory ON healthy building assessment abroad. Architectural Technology . 2019 [Google Scholar]
- 35.Motaghifard A., Omidvari M., Kaazemi A. Introducing a conceptual model for evaluating health safety environmental performance of residential buildings using the fuzzy decision-making approach. Environmental Monitoring and Assessment . 2020;192(1):19.1–19.10. doi: 10.1007/s10661-019-8004-0. [DOI] [PubMed] [Google Scholar]
- 36.Hills A. P., Farpour-Lambert N. J., Byrne N. M. Precision medicine and healthy living: the importance of the built environment. Progress in Cardiovascular Diseases . 2019;62(1):34–38. doi: 10.1016/j.pcad.2018.12.013. [DOI] [PubMed] [Google Scholar]
- 37.Li C., Li Q., Tong D., et al. Environmental impact and health risk assessment of volatile organic compound emissions during different seasons in Beijing. Journal of Environmental Sciences . 2019;93:1–12. doi: 10.1016/j.jes.2019.11.006. [DOI] [PubMed] [Google Scholar]
- 38.Liao W.-Ju, Cheng Fu-C. Quality assessment of environmental hygiene and health of indoor bathroom design. Architectural Journal, 2019(110_S:Special Issue on Innovative Low-Carbon and Green Buildings II) . 2019;110:49–58. [Google Scholar]
- 39.Carter P. Environmental health risk assessment for global climate change and atmospheric greenhouse gas pollution. Climate Action . 2020:413–423. doi: 10.1007/978-3-319-95885-9_95. [DOI] [Google Scholar]
- 40.O’Sullivan K. C. Health impacts of energy poverty and cold indoor temperature - ScienceDirect. Encyclopedia of Environmental Health . 2019:436–443. [Google Scholar]
- 41.Basu S., Banerjee B. Impact of environmental factors on mental health of children and adolescents: a systematic review. Children and Youth Services Review . 2020;119 doi: 10.1016/j.childyouth.2020.105515.105515 [DOI] [Google Scholar]
- 42.Mannan M., Weldu Y. W., Al-Ghamdi S. G. Health impact of energy use in buildings: radiation propagation assessment in indoor environment. Energy Reports . 2020;6:915–920. doi: 10.1016/j.egyr.2019.12.004. [DOI] [Google Scholar]
- 43.Zhang B., Zeng R., Li X. Environmental and human health impact assessment of major interior wall decorative materials. Frontiers of Engineering Management . 2019;6(3):406–415. doi: 10.1007/s42524-019-0025-4. [DOI] [Google Scholar]
- 44.Kallio J., Vildjiounaite E., Koivusaari J., et al. Assessment of perceived indoor environmental quality, stress and productivity based on environmental sensor data and personality categorization. Building and Environment . 2020;175:p. 106787. doi: 10.1016/j.buildenv.2020.106787. [DOI] [Google Scholar]
- 45.Pang J. T., Qing-Long Y. U., Zou Y. H. Analysis of status and strategies of healthy environment in shenzhen. China Health Industry . 2019 [Google Scholar]
- 46.Mei C., Xin Q., Zhang L. Public participation in environmental management in China: status quo and mode innovation. Environmental Management . 2015;55(3):523–535. doi: 10.1007/s00267-014-0428-2. [DOI] [PubMed] [Google Scholar]
- 47.Yi Y., Liao Y., Zheng L., et al. Health selectivity and rural-urban migration in China: a nationwide multiple cross-sectional study in 2012, 2014, 2016. International Journal of Environmental Research and Public Health . 2019;16(9) doi: 10.3390/ijerph16091596. [DOI] [PMC free article] [PubMed] [Google Scholar]
- 48.Shao S., Zhang H., Chen X., et al. Health education services utilization and its determinants among migrants: a cross-sectional study in urban-rural fringe areas of Beijing, China. BMC Family Practice . 2020;22(1):1–19. doi: 10.1186/s12875-021-01368-1. [DOI] [PMC free article] [PubMed] [Google Scholar]
- 49.He X., Zhou G., Ma Y., et al. Winter vacation, indoor air pollution and respiratory health among rural college students: a case study in Gansu Province, China. Building and Environment . 2020;188:p. 107481. [Google Scholar]
- 50.Lin L., Jiang H. Healthy environment and healthy living in urban China: an emerging field in research (SPECIAL ISSUE: China’s environmental challenges and sustainable development) The journal of contemporary China studies . 2016;5 doi: 10.1080/24761028.2016.11869093. [DOI] [Google Scholar]
- 51.Shan J., Zhanyun W. U. The healthy China initiative: reality, problems and remedies. Chinese Journal of Urban and Environmental Studies (CJUES) . 2018;6 doi: 10.1142/s2345748118500197. [DOI] [Google Scholar]
- 52.Xueying W., Wu L. PEST analysis of the comprehensive health industry industry in the context of healthy China. Contemporary Social Sciences (English) . 2018 [Google Scholar]
- 53.Lu T., Lu T. Health and rural-urban migration in rural China: a longitudinal analysis. Proceedings of the PPA 2018 Annual Meeting; April 2018; Denver, Colorado. [Google Scholar]
- 54.You H., Zhou D., Wu S., Hu X., Bie C. Social deprivation and rural public health in China: exploring the relationship using spatial regression. Social Indicators Research . 2020;147(3):843–864. doi: 10.1007/s11205-019-02183-z. [DOI] [Google Scholar]
- 55.Li Y., Zeng B., Wu T., Hao H. Effects of urban environmental policies on improving firm efficiency: evidence from Chinese new energy vehicle firms. Journal of Cleaner Production . 2019;215:600–610. [Google Scholar]
- 56.Ding X. J., Hong-Xing L. I., Fan F. C. Construction and evaluation indicator system of healthy village based on modified Delphi method and consensus meeting method. Journal of Environment and Health . 2019 [Google Scholar]
- 57.Fang L. M., Nan L. U., Insurance S. O. Can the middle-aged and the elderly achieve their health improvement from domestic energy consumption structure optimization in rural China. China Population,Resources and Environment . 2019;29:40–49. [Google Scholar]
- 58.Deng Li-na, Zhang J.-heng, Wu Ji-lin, et al. Research on spatial and temporal distribution characteristics of traditional villages in Xiangxi prefecture and the influencing factors. Hunan Agricultural Sciences . 2020;8:108–113. [Google Scholar]
- 59.Ware J. E., Sherbourne C. D., Sherbourne C. D. The MOS 36-ltem short-form health survey (SF-36) Medical Care . 1992;30(6):473–483. doi: 10.1097/00005650-199206000-00002. [DOI] [PubMed] [Google Scholar]
- 60.Gladman J. R. F. Assessing health status with the SF-36. Age and Ageing . 1998;27(1):p. 3. doi: 10.1093/ageing/27.1.3. [DOI] [PubMed] [Google Scholar]
- 61.Gil M. Á., González-Rodríguez G. Fuzzy vs. Likert scale in statistics. Combining Experimentation and Theory . 2012:407–420. doi: 10.1007/978-3-642-24666-1_27. [DOI] [Google Scholar]
- 62.Barua A. Methods for decision-making in survey questionnaires based on Likert scale. Journal of Asian Scientific Research . 2013;3:35–38. [Google Scholar]
- 63.Deng Q., Yi Y., Yu K. Influencing factors and countermeasures of the health of residents in the city clusters along the middle reaches of the yangtze river. Healthcare . 2020;8(2) doi: 10.3390/healthcare8020093. [DOI] [PMC free article] [PubMed] [Google Scholar]
- 64.Shi T., Wang Y. Heavy metals in indoor dust: spatial distribution, influencing factors, and potential health risks. The Science of the Total Environment . 2020:p. 755. doi: 10.1016/j.scitotenv.2020.142367. [DOI] [PubMed] [Google Scholar]
- 65.Xu L. M., Xie L. F., Li X., Wang L., Gao Yu-meng. A meta-analysis of factors influencing health literacy among Chinese older adults. Journal of Public Health . 2021;(6) [Google Scholar]
- 66.Pickett W., King N., Trask C., et al. Factors related to self-perceived health in rural men and women. Journal of Agromedicine . 2015;20(2):178–187. doi: 10.1080/1059924x.2015.1010063. [DOI] [PubMed] [Google Scholar]
- 67.Miilunpalo S., Vuori I., Oja P., Pasanen M., Urponen H. Self-rated health status as a health measure: the predictive value of self-reported health status on the use of physician services and on mortality in the working-age population. Journal of Clinical Epidemiology . 1997;50(5):517–528. doi: 10.1016/s0895-4356(97)00045-0. [DOI] [PubMed] [Google Scholar]
- 68.Xu J. Gender differences of the elderly health in China and its decomposition. Journal of Northwest Normal University . 2015;52(01):139–144. [Google Scholar]
- 69.Pan D., Liu X. Effect of social participation on health with gender difference in rural China——econometric analysis based on propensity score matching model. Journal of Agrotechnical Economics . 2020;11:71–82. [Google Scholar]
- 70.Sun P., Wang Y., Zhang J., Wang C. Support demand and its influencing factors among rural elderly people. Nursing Journal of Chinese People’s Liberation Army . 2017;34(03):13–17. [Google Scholar]
- 71.Yao W., Yang S. Q., Wang W. H. Relativity study on sleep disturbance and anxiety,depression for elderly People of Rural Areas in Hunan. Journal of Hunan Normal University(Medical Sciences) . 2016 [Google Scholar]
- 72.Bai Y., Bian F., Zhang L., Cao Y. The impact of social support on the health of the rural elderly in China. International Journal of Environmental Research and Public Health . 2020;17(6):p. 2004. doi: 10.3390/ijerph17062004. [DOI] [PMC free article] [PubMed] [Google Scholar]
- 73.Yao Q., Hou J., Zhu D., Luo K., Chen Z., Lu Z. Mental Health and social Security construction of the widowed elderly in western Hunan minority areas. Chinese Journal of Gerontology . 2018;38(07):1759–1760. [Google Scholar]
- 74.Cao Z. H., Xiao-Sheng X. U., Ling J. J. Current status of health literacy and its influencing factors among 5,999 residents in some areas of hunan. Practical Preventive Medicine . 2011 [Google Scholar]
- 75.Song Z. Research on the physical health status and influencing factors of the left-behind elderly in rural areas of western Hunan. Sports World(Scholarly) . 2019;8:p. 4. [Google Scholar]
- 76.Shi J., Tang L. Investigation and countermeasure research on health status of “empty nesters” in west Hunan. Contemporary Sports Technology . 2019;9(10):200–202. [Google Scholar]
- 77.Zhong Q. Analysis on the health risk factors of indoor living environment. Value Engineering . 2019;38(27):195–196. [Google Scholar]
- 78.Chen Yu, Chen B., Zeng C. SEM model of indoor environment associated health effects in residential buildings. China Housing Facilities . 2016;15(5):88–91. [Google Scholar]
- 79.Zhang J., Pallasati L. L. Indoor air pollution and its health hazards in rural China. Journal of Environment and Occupational Medicine . 2007;24(4):p. 5. [Google Scholar]
- 80.Wang X.-mei, Huang T., Chen Y.-hua. Environmental health hazard factors in rural areas of Hunan province in 2012-2014. Journal of Environment and Health . 2016 [Google Scholar]
Associated Data
This section collects any data citations, data availability statements, or supplementary materials included in this article.
Data Availability Statement
The data used to support the findings of this study are included within the article.