

Abstract
Diabetes is a common chronic disease affecting millions of people worldwide. It underlies various complications and imposes many costs on individuals and society. Discovering early diagnostic biomarkers takes excellent insight into preventive plans and the best use of interventions. Therefore, in the present study, we aimed to evaluate the association between the level of amino acids and acylcarnitines and diabetes to develop diabetes predictive models. Using the targeted LC–MS/MS technique, we analyzed fasting plasma samples of 206 cases and 206 controls that were matched by age, sex, and BMI. The association between metabolites and diabetes was evaluated using univariate and multivariate regression analysis with adjustment for systolic and diastolic blood pressure and lipid profile. To deal with multiple comparisons, factor analysis was used. Participants' average age and BMI were 61.6 years, 28.9 kg/m2, and 55% were female. After adjustment, Factor 3 (tyrosine, valine, leucine, methionine, tryptophan, phenylalanine), 5 (C3DC, C5, C5OH, C5:1), 6 (C14OH, C16OH, C18OH, C18:1OH), 8 (C2, C4OH, C8:1), 10 (alanine, proline) and 11 (glutamic acid, C18:2OH) were positively associated with diabetes. Inline, factor 9 (C4DC, serine, glycine, threonine) and 12 (citrulline, ornithine) showed a reverse trend. Some amino acids and acylcarnitines were found as potential risk markers for diabetes incidents that reflected the disturbances in the several metabolic pathways among the diabetic population and could be targeted to prevent, diagnose, and treat diabetes.
Subject terms: Biomarkers, Diseases, Endocrinology
Introduction
Diabetes is a prevalent chronic disease affecting millions of people worldwide associated with the development of many microvascular and macrovascular complications and leads to reduced quality of life and increased economic burden1, 2. Conventional risk factors and diagnostic methods of diabetes play a significant role in screening; however, there is a need for novel biomarkers that are not dependent on common clinical risk factors3. Diabetes does not have very apparent symptoms, especially in the early stage of the disease, and can exist many years before becoming clinically evident. In this regard, researchers have attempted to identify early diagnostic approaches for diabetes to develop strategies that could improve preventive plans and make the best use of interventions4.
In the last decades, it has become clear that the high-throughput approaches represent a promising avenue of research to identify biomarkers related to disease occurrence. Metabolomics is an emerging field defined as the systematic analysis of metabolites in biological systems affected by genetic and environmental features. Therefore, it is essential to discriminate the molecular fluctuations that occur in the development of diabetes to progress the health of these patients and decrease the severe consequences5, 6.
Several studies have been performed to assess the connection between a broad range of metabolites and diabetes progression7, including hexoses, amino acids, phospholipids, triglycerides, and acylcarnitine5, 8. However, as a result of the plentiful metabolites, different ethnicities, and study designs, outcomes vary from separate studies, and there is no comprehensive agreement concerning the application of metabolites as diabetes predictive or diagnostic biomarkers4, 9, 10.
Thus, we established a large case–control study to evaluate fasting plasma amino acid and acylcarnitine metabolites in diabetic patients, using targeted LC–MS/MS metabolomics.
Results
Baseline characteristics
The study population was composed of diabetic (n = 206) and non-diabetic (n = 206) individuals with 45–90 years age range and mostly (31%) aged 50–59 years. The majority of the participants were overweight (BMI = 25–29.9, ~ 40%) or obese (BMI ≥ 30, ~ 39%). About 55% of participants were female. Baseline characteristics are presented in Table 1. FPG, HbA1c, HDL-C, non-HDL-C, and triglyceride concentrations in the analysis groups were found to be significantly different. FPG, HbA1c, and triglyceride levels were higher in cases than in controls. HDL-C and non-HDL-C were lower in cases.
Table 1.
Baseline characteristics of study participants.
| Variable | Non-Diabetes (n = 206) | Diabetes (n = 206) | P value |
|---|---|---|---|
| Gender, n (%) | 0.921 | ||
| Female | 113 (54.85) | 113 (54.85) | |
| Male | 93 (45.15) | 93 (45.15) | |
| Age (year) | 61.54 ± 11.93 | 61.7 ± 11.51 | 0.890 |
| < 50 | 34 (16.51) | 34 (16.51) | |
| 50–59 | 64 (31.07) | 64 (31.07) | |
| 60–69 | 53 (25.73) | 53 (25.73) | |
| 70–79 | 39 (18.93) | 39 (18.93) | |
| ≥ 80 | 16 (7.77) | 16 (7.77) | |
| BMI (Kg/m2) | 28.73 ± 5.06 | 29.00 ± 4.9 | 0.582 |
| < 18.5 | 1 (0.49) | 1 (0.49) | |
| 18.5–24.9 | 43 (20.87) | 42 (20.39) | |
| 25.0–29.9 | 83 (40.29) | 82 (39.8) | |
| ≥ 30 | 79 (38.35) | 81 (39.32) | |
| WC/HC (cm) | 0.94 ± 0.08 | 0.95 ± 0.13 | 0.380 |
| Blood pressure (mmHg) | |||
| Systolic | 138.09 ± 21.88 | 140.88 ± 22.39 | 0.202 |
| Diastolic | 82.02 ± 12.12 | 82.33 ± 13.08 | 0.803 |
| FPG (mg/dL) | 95.1 ± 12.0 | 153.27 ± 62.74 | < 0.001 |
| HbA1c (%) | 5.58 ± 0.4 | 7.68 ± 1.75 | < 0.001 |
| HDL-C (mg/dL) | 42.27 ± 11.83 | 38.43 ± 11.42 | 0.001 |
| Non-HDL Cholesterol (mg/dL) | 100.37 ± 25.44 | 92.32 ± 34.32 | 0.008 |
| Cholesterol (mg/dL) | 167.92 ± 31.84 | 163.95 ± 43.58 | 0.294 |
| Triglycerides (mg/dL) | 128.98 ± 67.80 | 170.69 ± 157.88 | < 0.001 |
| Hyperlipidemia medication | 16 (7.77) | 53 (25.73) | < 0.001 |
Continuous variables were presented as mean ± SD, and categorical variables were presented as numbers (column percentage).
BMI: body mass index, WC/ HC: waist circumference to hip circumference ratio, FPG: fasting plasma glucose, HDL-C: high-density lipoprotein cholesterol.
Significant values are in bold.
Metabolites with different concentrations in diabetes compared to non-diabetes
As shown in Supplementary Table 1, many short- (C2, C3, C3DC, C4OH, C4DC, C5:1, C5OH) and long-chain (C14OH, C16OH, C18OH) acylcarnitines were increased, and only C18:1 acylcarnitine levels were decreased in diabetes compared to controls. Alanine, leucine, and valine had an increasing trend, while arginine, citrulline, glycine, ornithine, threonine, serine, and histidine had decreased significantly in diabetes. Mainly changed metabolites have been depicted by the volcano plot and represented in Fig. 1.
Figure 1.

Volcano plot mainly displaying changed amino acids and acylcarnitines in diabetes compared to control group (Metaboanalyst software version 5.0).
After adjusting for covariates (Supplementary Table 2), C3DC, C4OH, C4DC, C5:1, C5OH, C16OH, C18OH, alanine, leucine, valine, glycine, threonine, serine, and histidine alteration among study groups were independent of blood pressure and lipid profile. The effect of age, BMI, and sex, as pair-matching participants had eliminated covariates.
According to sex differences, C5, C5DC, C8:1 acylcarnitines, glutamic acid, leucine, methionine, valine, glycine, proline, and tryptophan amino acids were different between non-diabetes men and women. For diabetes, C3, C5, C5DC, C8:1 acylcarnitines along with leucine, methionine, phenylalanine, citrulline, glycine, and tryptophan amino acids were different between the two sexes (Supplementary Table 3).
Extracted factors
Metabolite patterns were extracted using PCA with eigenvalues more than one from the scree plot (Supplementary Fig. 1). The factor-loading matrix is presented in Supplementary Table 4. As presented in Table 2, the 13 factors explained 75.5% of the total variation. The first three factors accounted for most of the overall variability; they described 22.9%, 12.5%, and 6.8%, respectively. Results of the factor analysis were acceptable as suggested by a high KMO coefficient of 0.84 and a highly significant P value of Bartlett sphericity test of < 0.001.
Table 2.
Principal Component Analysis (PCA). The table lists of factors identified by PCA and the associated individual components, description, eigenvalue and variance.
| Factor | Description | Components | Eigenvalue | % of Variance | Cumulative % |
|---|---|---|---|---|---|
| 1 | Medium-chain acylcarnitines | C5DC, C6, C8, C10, C10:1, C12, C14, C14:1, C14:2 | 11.438 | 22.876 | 22.876 |
| 2 | Long-chain acylcarnitines | C14, C16, C16:1, C16:1OH, C18, C18:1 | 6.271 | 12.543 | 35.418 |
| 3 | BCAA and AAA | Tyrosine, Leucine, Valine, Methionine, Tryptophan, Phenylalanine | 3.388 | 6.776 | 42.194 |
| 4 | Polar amino acids | Lysine, Glutamine, Asparagine, Histidine, Aspartic Acid | 3.17 | 6.341 | 48.535 |
| 5 | Short-chain acylcarnitines | C3DC, C5, C5:1, C5OH | 2.526 | 5.053 | 53.588 |
| 6 | Hydroxylated long-chain acylcarnitines | C14OH, C16OH, C18OH, C18:1OH | 1.888 | 3.776 | 57.364 |
| 7 | Short-chain acylcarnitines | C0, C3, C4 | 1.707 | 3.414 | 60.778 |
| 8 | Short-chain acylcarnitines | C2, C4OH, C8:1 | 1.529 | 3.059 | 63.837 |
| 9 | Other amino acids | Serine, Glycine, Threonine, C4DC | 1.378 | 2.757 | 66.594 |
| 10 | Non-polar amino acids | Alanine, Proline | 1.21 | 2.42 | 69.014 |
| 11 | Other amino acids | C18:2OH, Glutamic Acid | 1.119 | 2.238 | 71.252 |
| 12 | Uria cycle amino acids | Citrulline, Ornithine | 1.092 | 2.184 | 73.436 |
| 13 | Other amino acids | Arginine | 1.012 | 2.023 | 75.459 |
BCAA: Branched-chain amino acids, AAA: Aromatic amino acids.
Significant values are in bold.
Identification of the relationship between metabolite patterns and diabetes incidence
Factor 3, 5, 6, 8, 10, and 11 were positively associated with diabetes. Inline, factors 9 and 12 showed a reverse trend. Extracted factors were still associated with diabetes after adjustment for systolic and diastolic blood pressure and lipid profile, except factor 11. Results were reported in Table 3. Contrary to our expectation, the association between the first two extracted factors and diabetes incidence was insignificant.
Table 3.
Crude and adjusted odds ratios (OR) and their 95% confidence intervals (CI) of the extracted factors analyzed the relationship between metabolite patterns and diabetes incidence.
| Factor | Model 1 | Model 2 | Model 3 | ||||||
|---|---|---|---|---|---|---|---|---|---|
| OR | 95% CI | P value | OR | 95% CI | P value† | OR | 95% CI | P value†† | |
| 1 | 0.997 | (0.964–1.03) | 0.875 | 0.996 | (0.962–1.03) | 0.814 | 1.003 | (0.968–1.04) | 0.871 |
| 2 | 0.973 | (0.916–1.03) | 0.366 | 0.967 | (0.91–1.03) | 0.286 | 0.971 | (0.91–1.036) | 0.377 |
| 3 | 1.096 | (1.03–1.17) | 0.005 | 1.1 | (1.0311.17) | 0.004 | 1.069 | (1.02–1.14) | 0.047 |
| 4 | 0.968 | (0.909–1.03) | 0.322 | 0.968 | (0.908–1.03) | 0.312 | 0.978 | (0.915–1.05) | 0.507 |
| 5 | 1.284 | (1.15–1.43) | < 0.001 | 1.277 | (1.15–1.42) | < 0.001 | 1.275 | (1.14–1.42) | 0.001 |
| 6 | 1.17 | (1.06–1.29) | < 0.001 | 1.162 | (1.05–1.29) | < 0.001 | 1.164 | (1.05–1.29) | 0.005 |
| 7 | 1.064 | (0.93–1.22) | 0.367 | 1.063 | (0.929–1.22) | 0.373 | 0.992 | (0.857–1.15) | 0.91 |
| 8 | 1.237 | (1.09–1.41) | < 0.001 | 1.231 | (1.08–1.40) | 0.002 | 1.243 | (1.09–1.43) | 0.002 |
| 9 | 0.625 | (0.537–0.73) | < 0.001 | 0.617 | (0.529–0.72) | < 0.001 | 0.618 | (0.526–0.727) | < 0.001 |
| 10 | 1.457 | (1.22–1.74) | < 0.001 | 1.46 | (1.22–1.74) | < 0.001 | 1.335 | (1.11–1.61) | 0.002 |
| 11 | 1.292 | (1.05–1.58) | 0.014 | 1.297 | (1.058–1.59) | 0.012 | 1.182 | (0.962–1.45) | 0.112 |
| 12 | 0.767 | (0.647–0.908) | < 0.001 | 0.767 | (0.647–0.91) | 0.002 | 0.795 | (0.666–0.949) | 0.011 |
| 13 | 0.793 | (0.626–1.01) | 0.056 | 0.8 | (0.631–1.01) | 0.065 | 0.783 | (0.611–1.00) | 0.058 |
P value, crude model (Model 1).
P value†, adjusted by blood pressure (Model 2).
P value††, adjusted by blood pressure and lipid profile (HDL-C, cholesterol, triglyceride) (Model 3).
Significant values are in bold.
Pathway analysis
Based on differential metabolites, the disturbed pathways were determined and shown in Fig. 2, and a detailed pathway analysis table is presented in Supplementary Table 5.
Figure 2.
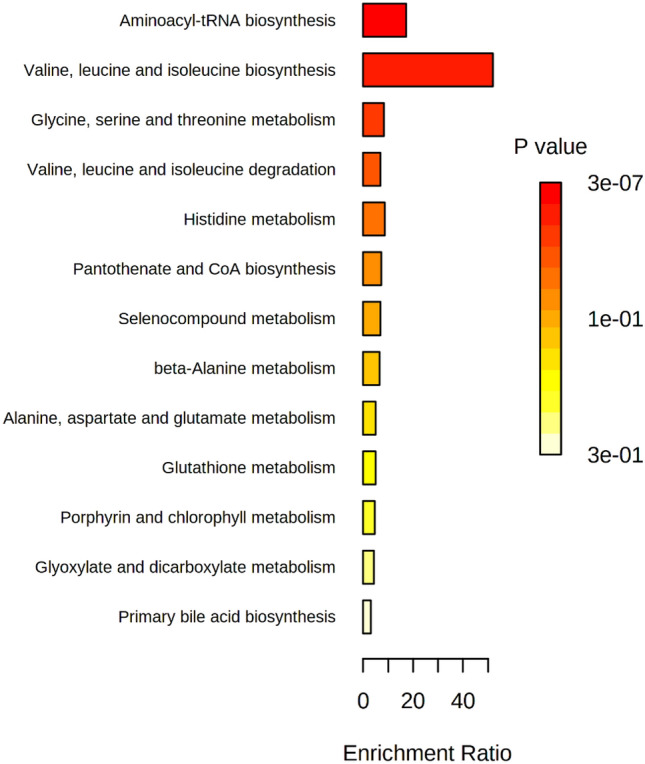
Pathway analysis. Enrichment overview (Metaboanalyst software version 5.0).
For diabetes versus non-diabetes, valine, leucine, and isoleucine biosynthesis had the most enrichment ratio. Enrichment Ratio is computed by Hits/Expected, where Hits, refer to observed hits, and Expected, refers to expected hits. After that, aminoacyl-tRNA biosynthesis, serine, glycine and threonine metabolism, leucine, isoleucine, and valine degradation had the most enrichment ratio.
Discussion
An emerging assumption is that the combinations of known biomarkers in a further personalized approach are required to give more effectiveness in terms of evaluating the degree or progress of diabetes and prove the most reliable preventive or diagnostic plans11, 12.
By a short review of the published articles about metabolomics analysis (comprising amino acids or acylcarnitines) in blood samples of diabetic patients in the PubMed database (Table 4), we found that studies mainly had cohort design, and most of the others had used part of cohort data and designed as nested case–control or cross-sectional. In most of them, the number of diabetic patients was close to 200–300 people but the number of controls varied within studies. Some were matched 1:1, such as our study and some others had no limitation in the number of controls.
Table 4.
Literature review on biomarkers in diabetes metabolomics studies.
| Refs. | First author, year | Study design | Ethnicity/Country | Study population | Average age | Average BMI | Metabolites | |||||
|---|---|---|---|---|---|---|---|---|---|---|---|---|
| Controls (M/F) | Patients (M/F) | Controls | Patients | Controls | Patients | Amino acid | Acylcarnitine | Other metabolites | ||||
| 44 | Kwang Seob Lee, 2021 | Nested case–control | Korea | 500 (210/290) | 204 (85/119) | 54.0 (47.0–61.0)** | 57.0 (50.5–63.5) ** | 26.7 (25.6–27.8)** | 27.25 (25.75–28.75)** | Yes | Yes | Yes |
| 45 | Yishuang Duan, 2021 | Case–control | China | 60 (33/27) | 60 (33/27) | 56 ± 7 | 56 ± 7 | 25.0 ± 2.7 | 25.0 ± 2.7 | Yes | No | Yes |
| 46 | Lichao Wang, 2020 | Cohort (3 cohorts) | China |
Set-1 76 (40/36) Set-2 64 (29/35) Set-3 40 (18/22) |
174 (82/92) 108 (52/56) 77 (38/39) |
49.09 ± 13.08 41.20 ± 16.29 40.50 ± 16.16 |
50.70 ± 10.75 52.81 ± 11.80 51.17 ± 11.95 |
23.97 ± 3.53 22.97 ± 4.25 23.89 ± 3.66 |
24.81 ± 3.58 25.18 ± 3.24 24.93 ± 3.74 |
Yes | Yes | Yes |
| 14 | Samuel H Gunther, 2020 | Prospective Study | Singapore |
2999 (1366/1633) |
314 (152/162) |
47.0 ± 11.6 | 53.5 ± 11.2 | 23.1 ± 3.8 | 26.3 ± 4.8 | Yes | Yes | No |
| 8 | Xin Li, 2020 | Cohort | China | 54 (38/16) |
Simple diabetes 21 (10/11) |
54.22 ± 13.33 | 50.82 ± 9.73 | 22.86 ± 3.21 | 25.15 ± 2.53 | Yes | Yes | No |
|
Diabetic complication 103 (60/43) |
55.78 ± 9.23 | 24.35 ± 2.69 | ||||||||||
| 47 | Jumana Y Al-Aama, 2019 | Case–control | Saudi Arabia (middle east population) | 33 | 34 | 37.65 | 52.94 | – | – | Yes | No | Yes |
| 48 | Marta Guasch-Ferre, 2019 | Case-cohort | Mediterranean population | 641 (233/408) | 251 (113/138) | 66.5 ± 5.7 | 66.4 ± 5.7 | 29.7 ± 3.5 | 30.8 ± 3.4 | No | Yes | No |
| 49 | Yonghai Lu, 2019 | Nested case–control | China |
Prevalent diabetes 144 (62/82) |
144 (62/82) | 62.7 ± 5.9 | 62.7 ± 6.1 | 23.1 ± 3.3 | 24.6 ± 3.6 | Yes | No | No |
| Incident diabetes 160 (79/81) | 160 (79/81) | 61.9 ± 6.0 | 61.6 ± 5.6 | 22.6 ± 3.5 | 24.6 ± 3.4 | |||||||
| 50 | Casey M. Rebholz, 2018 | Subset of a cohort | USA | 1813 (732/1081) | 1126 (479/674) | 53.6 ± 5.8 | 52.8 ± 5.5 | 27.2 ± 5.1 | 30.0 ± 6.0 | Yes | No | Yes |
| 51 | Jordi Merino, 2018 | Prospective study | USA | 1055 (419/636) | 95 (52/43) | 53 ± 10 | 54 ± 9 | 26.18 ± 4.28 | 29.66 ± 5.18 | Yes | No | Yes |
| 12 | Lin Shi, 2018 | Nested case–control | Swedish population | 503 (224/279) | 503 (224/279) | 50.1 ± 8.0 | 50.2 ± 7.9 | 25.5 ± 3.8 | 29.5 ± 4.9 | Yes | No | Yes |
| 52 | Gopal Peddinti, 2017 | Nested case–control | Finland | 397 (200/197) | 146 (74/72) | 48.22 ± 0.72* | 52.34 ± 0.99* | 25.91 ± 0.19* | 28.46 ± 0.37* | Yes | No | Yes |
| 53 | Jun Liu, 2017 | Cohort | Netherlands |
2564 (1132/1432) |
212 (108/104) |
48.2 ± 14.3 | 59.8 ± 11.8 | 26.7 ± 4.6 | 30.0 ± 5.9 | Yes | No | Yes |
| 1434 (595/839) | 137 (78/59) | 47.7 ± 13.9 | 57 ± 10.7 | 26.6 ± 4.4 | 30.1 ± 5.1 | |||||||
| 54 | Birgit Knebel, 2016 | Cohort | Germany | 129 (46/83) |
T1D 127 (79/48) |
58 ± 11 | 35 ± 13 | 26.3 ± 4.4 | 24.6 ± 4.3 | Yes | Yes | Yes |
|
T2D 244 (155/89) |
53 ± 11 | 31.7 ± 5.9 | ||||||||||
| 55 | Gaokun Qiu, 2016 | Nested case–control 2cohorts | China | 1039 (464/575) | 1039 (464/575) | 62.93 ± 7.32 | 62.82 ± 7.23 | 23.64 ± 3.07 | 25.73 ± 3.34 | Yes | Yes | Yes |
| 520 (181/339) | 520 (181/339) | 53.74 ± 10.18 | 53.82 ± 10.25 | 23.70 ± 3.22 | 25.53 ± 3.42 | |||||||
| 56 | Yonghai Lu, 2016 | Nested case–control | Chinese men and women in Singapore | 197 (80/117) | 197 (80/117) | 55.1 ± 2.7 | 55.2 ± 2.9 | 22.7 ± 3.1 | 25.5 ± 3.8 | Yes | Yes | Yes |
| 20 | Therese Tillin, 2015 | cross-sectional | European and South Asian men | 2286 (2286/-) | 1444 (1444/-) | 51.75 ± 7.15 | 51.6 ± 7.1 |
25.56 (23.59–27.75)** |
25.46 (23.5–27.5)** |
Yes | No | No |
| 28 | Anna Floegel, 2013 | Case-cohort | Germany | 2282 (867/1415) | 800 (462/338) | 49.5 ± 8.9* | 54.7 ± 7.3* | 26.1 ± 0.09* | 30.1 ± 0.15* | Yes | Yes | Yes |
| 29 | Cristina Menni, 2013 | Cross-sectional | U. K | 1897 (-/1897) | 115 (-/115) | 50.02 ± 14.43 | 63.00 ± 9.61 | 25.42 ± 4.55 | 30.58 ± 6.32 | Yes | No | Yes |
**Data reported as median (IQR); *Data reported as mean ± SEM; others reported as mean ± SD.
M: Male; F: Female; BMI: Body mass index.
Regarding ethnicity, a few publications are available on the middle east population. We could not find another metabolomics study in blood samples of Iranian or middle east populations of diabetes. As reviewed by Sonia Liggi et al. in 2017, there was no cohort study assessing metabolites that have been conducted on the middle east population until that time13.
For average age and BMI, most of the studies were age-matched or had study groups in a similar range of age and were mostly conducted in 40–60 decades of life. Diabetic participants usually had higher BMI than controls and took part in the obese category.
Evaluated metabolites varied, but the number of studies on acylcarnitines was small.
In this regard, we investigated the metabolic perturbations of amino acids and acylcarnitines among diabetes and non-diabetic individuals.
By factor analysis, 13 factors were extracted by PCA method, each of them mostly comprised of chemically and functionally correlated metabolites (Table 2). Factors 1 (medium-chain acylcarnitines), factor 2 (long-chain acylcarnitines), factor 4 (polar uncharged (glutamine and asparagine), positively charged (histidine and lysine), and negatively charged (aspartic acid) amino acids), factor 7 (C0, C3, C4 acylcarnitines), factor 11 (C18:2OH and glutamic acid), and factor 13 (arginine) were not significant after adjustment by blood pressure and lipid profile. Factor 3 (Branched-chain amino acids (BCAA) and aromatic amino acids (AAA), factor 5 and 8 (short-chain acylcarnitines), factor 6 (hydroxylated long-chain acylcarnitines), factor 9 and 10 (other amino acids), and factor 12 (Urea cycle amino acids) were associated with the diabetes incidence independent of confounders and have been discussed.
Amino acids
Branched-chain amino acids (BCAA) and aromatic amino acids (AAA)
As the main finding of this study, Factor 3 comprised of tyrosine, valine, leucine, methionine, tryptophan, and phenylalanine was positively associated with diabetes which is consistent with other findings that have previously been published.
According to the earlier studies that evaluating the relation between metabolites and type 2 diabetes (T2D) using high-throughput metabolomics techniques, a sum of or individual BCAAs comprised of isoleucine, leucine, valine, and AAA, including tyrosine, phenylalanine, and tryptophan, were related to a higher risk of T2D8, 10, 12, 14–16, 32. Previous reports have associated the AAAs with an escalated risk of developing type 1 diabetes (T1D). Additional investigations have demonstrated that BCAAs elevate insulin action and signaling procedures, while others have reported that they get worse insulin resistance in individuals with T1D1. Nevertheless, further investigations are needed to elaborate that these amino acid levels are only markers of diabetes or be part of the cause of insulin resistance and etiology of diabetes16, particularly in T1D.
As stated by Libert et al.15, these analytes and ratios increase significantly in T2D and obesity as though about 80% of our study participants were overweight or obese. Observational studies have revealed BMI to be associated with the risk of diabetes17. In this respect, significant alterations in BMI and HbA1c between different ethnic groups have been found18. Furthermore, analyses have identified the differences in AAA and BCAA concentrations between the different ethnic groups14, 19, 20 and suggest the requirement for multiethnic studies to consider these ethnic differences, especially in the Middle East.
Any other way, BCAAs and AAAs (except tyrosine) are essential and dependent on diet. Interestingly, these amino acid patterns are related to the overall dietary pattern rather than the dietary intake21. A suggested biological mechanism concerning increased BCAAs concentration along with insulin resistance and diabetes is an inadequate response of muscle tissue to the anti-catabolic function of insulin. Subsequently, proteolysis of skeletal muscle increases and causes increased BCAAs concentration as the dominant amino acids in this tissue. In another explanation, during a series of enzymatic reactions, BCAAs metabolize to branched-chain keto acids and then oxidize to be used as substrates in the tricarboxylic acid (TCA) cycle. High BCAAs may arise from the defect of these reactions and the accumulation of intermediate compounds involved in diabetes development22.
For the AAAs, phenylalanine is converted into tyrosine in its catabolic pathway. Accordingly, alterations in one of them will possibly affect the other one. It has been suggested that increased levels of phenylalanine and tyrosine may result from decreased tyrosine aminotransferase activity that converts tyrosine to other intermediary compounds22. It has been proposed that tyrosine can inhibit insulin signaling pathways and glucose transport23.
Urea cycle amino acids
More specifically, citrulline and ornithine as components of Factor 12 were reversely associated with the incidence of diabetes. The trend of ornithine in diabetes development was in line with Cao et al.24, which can be referred to as inflammatory conditions. Meanwhile, it can stem from increased depletion of ornithine as a precursor for proline25. Contrary to these findings, in Gunther SH et al.’s study16, the ornithine was positively associated with the risk of diabetes which can be resulted from upregulated arginase activity, an enzyme that takes part in ornithine production.
Other amino acids
We also confirmed several previously reported associations of diabetes and some amino acids, including in Factor 10 (alanine, proline) and Factor 9 (C4DC, serine, glycine, threonine). Taken together, our findings support other reports as higher concentrations of proline and alanine were detected in diabetes than non-diabetes which were associated with a higher risk of T2D. The levels of glycine and serine were lower in diabetes4, 9, 14, 16, 26.
In this class, glycine has the most robust involvement in the pathophysiology of diabetes. Glycine is mainly synthesized from threonine and serine. It is an insulin secretagogue; therefore, a low glycine concentration may decline pancreatic insulin secretion. This decrease of glycine may be due to the increased glycine consumption for the generation of glutathione or related to its role as a neurotransmitter, increased absorption of glycine in insulin-resistant tissues for gluconeogenesis, or the opposite link between glycine and visceral-subcutaneous adipose tissue mass22, 27, 28.
Acylcarnitines
We perceived three factors that were positively associated with diabetes as follows: Factor 5 (C3DC, C5, C5OH, C5:1), factor 8 (C2, C4OH, C8:1), which is mainly composed of short-chain acylcarnitines, and factor 6 (C14OH, C16OH, C18OH, C18:1OH) contains hydroxylated long- chains acylcarnitines.
Acylcarnitines are a form of fatty acids needed to transport into mitochondria and peroxisomes for beta-oxidation, and changes in their abundance may point to a deficiency in fatty acid oxidation, glycolysis, and BCAA metabolism. It is conceivable that the accumulation of these pathways intermediates in the blood may play a key role in insulin action and progression of diabetes29, 30.
Short-chain acylcarnitines
Our study confirmed that levels of various acylcarnitines in patients with T2D had been increased26, 31. An increasing trend of short-chain acylcarnitines has been detected in obesity and T2D15. In a cohort study, the baseline C3DC, C5, C5OH, and C8:1 were related to a higher risk of T2D32. Notably, the short-chain acylcarnitines C3, C4-DC, and C5 derive from different energy sources as well as the BCAAs29. Also, C3-DC is another elevated amino acid—derived acylcarnitine that emphasizes evaluating the association between amino acids and acylcarnitines in disease development33. In contrast to the presented results, Muilwijk et al. demonstrated a negative association between most acylcarnitines especially short-change ones and the risk for T2D10.
Hydroxylated long-chain acylcarnitines
Long-chain acylcarnitines are going above when fatty acid supply surpasses the capacity or demand of mitochondrial oxidation and the TCA cycle29, 34. Additionally, acylcarnitine C16OH was significantly linked to higher diabetes risk14. Similar results were reported about baseline concentrations of C14OH and C18OH32. The remarkable thing about acylcarnitines is that although changes in these metabolites have been studied extensively, in different studies, different types of metabolites reported as significantly changed, which makes it challenging to reach a comprehensive conclusion. Confirms the need for further studies.
Differences according to sex
Sex as an endogenous factor can influence the human metabolome and provide valuable information through precision medicine35. According to sex differences, C5, C5DC and, C8:1 acylcarnitines and leucine, methionine, glycine and, tryptophane amino acids were different between men and women in both study groups. All the mentioned metabolites had higher levels among men, except C8:1 and glycine. These findings were in line with Kirstin Mittel strass et al.'s results36. Regardless of gender differences, just leucine and glycine significantly differed between diabetes and non-diabetes.
In Burcu F. Darst et al.'s study on healthy participants, C5, methionine, tryptophan, glutamate, proline, phenylalanine, and the BCAAs associated with sex and were in higher levels in men, while glycine was found in a lower level in men37. In the following in our study, higher levels of glutamic acid valine and proline amino acids were found in non-diabetic men. For diabetes, higher levels of C3 acylcarnitine along with phenylalanine and citrulline amino acids were observed in men. Just C3, citrulline, and valine changes among diabetes and non-diabetes were significant without consideration of sex.
Consistent with our findings, other studies have confirmed amino acids, particularly BCAAs, as sex-dependent metabolites, and higher concentrations of several amino acids have been reported in men, which can be caused by higher protein intake or larger muscle mass38–40.
Conclusion
This study was performed on participants of a multi-regional cohort in Iran. Participants with diabetes were randomly selected, and the control group was matched with them to improve study efficiency and statistical precision. Along with amino acids, acylcarnitines, as less studied metabolites compared to others, were analyzed to be able to add new data to existing findings.
BCAAs, AAAs, and a wide range of amino acids along with many short- and long-chain acylcarnitines have been strongly associated with the risk of diabetes incidence. Our results displayed that the predictive factors contained specific amino acids and acylcarnitines would be helpful to reflect the metabolic pathway disturbances among diabetes. They might be advantageous for evolving the preventive, diagnostic, and therapeutic strategies for diabetes and its complications. In this field of study, several articles have been published in the population of countries with different races, ethnicities, and environmental conditions. However, according to our knowledge, no study has examined the status of metabolites in the population of diabetics in Iran so far. Although, further multiethnic extensive studies with the valuation of dietary patterns and assessment of probable complications are required to obtain more conclusive results.
Material and methods
Patients and experiments design
A case–control study was set up with 412 subjects (206 non-diabetic and 206 diabetic individuals) that were randomly chosen from participants of the Surveillance of Risk Factors of NCDs in Iran Study (STEPS 2016). STEPS is conducted periodically in 30 provinces of Iran to investigate none communicable risk factors41. Gender, age, waist circumference, hip circumference, body mass index (BMI), systolic and diastolic pressure were documented. Biochemical characteristics of patients, including; HbA1c, fasting plasma glucose (FPG), and lipid levels (HDL-C, cholesterol, triglyceride), were measured by Cobas C311 auto analyzer using commercial kits from Roche Company (Roche Diagnostics, Mannheim, Germany).
Study cases were selected randomly from the STEPS, and then each case was then matched to control according to age, sex, and BMI. All patients were diagnosed with diabetes according to the diabetes diagnosis and treatment standards of the American Diabetes Association (ADA)42. The study protocol was approved by the ethics committee of Endocrinology and Metabolism Clinical Sciences Institute, Tehran University of Medical Sciences (IR.TUMS.EMRI.REC. 1395.00141) and performed under the declaration of Helsinki. Also, written informed consent was obtained from all participants.
Detection of metabolites by tandem mass spectrometry
Details of the analytical procedures were described elsewhere43. In brief, fasting plasma samples were derivatized (with 1-butanol and HCL) and analyzed by the API SCIEX 3200 triple quadrupole mass spectrometer system, along with Thermo Scientific Dionex UltiMate 3000 standard HPLC system using positive electrospray ionization mode. A mixture of 75% acetonitrile aqueous solution was used as the mobile phase. The injected volume was five μL. The complete analysis contained 50 metabolites, including 20 amino acids and 30 acylcarnitines. The quantification of different metabolites was undertaken by Multiquant software (AB Sciex) against different isotopes as internal standards. Quality control was accomplished to screen the stability and functionality of the system through instrumental analyses.
Metabolomics study
Data pre-processing
All data involved in this study were analyzed by IBM SPSS Statistics software version 26 (https://www.ibm.com/analytics/spss-statistics-software). Missing values were replaced based on imputation models and data scaled and standardized by Z-transformation to compare values between different data ranges.
Univariate analysis
The results were compared using independent sample T-test or Mann–Whitney U test (after checking the normality by Kolmogorov–Smirnov test), and P values were calculated. The odds ratio (OR) with a 95% confidence interval (CI) (per metabolite) was calculated using binary logistic regression analysis to adjust the results for systolic and diastolic blood pressure and lipid profile (HDL-C, cholesterol, triglyceride) as covariates. The Benjamini–Hochberg false discovery rate (FDR) was calculated to adjust the P value for multiple comparisons. P values < 0.05 were considered significant. Also, metabolites differences among diabetes and non-diabetes were evaluated according to sex differences.
Multivariate data analysis
The correlations of metabolites were calculated based on Pearson correlation coefficient (Supplementary Fig. 2), and then to deal with multiple comparisons, factor analysis was used, and principal component analysis (PCA) was performed by varimax rotation to extract factors, achieve the metabolite patterns and loading matrix. Kaiser–Meyer–Olkin (KMO) and Bartlett sphericity tests were used to evaluate the statistical correlation between variables and sufficiency of sample size. A KMO coefficient around 0.8 took into account as credible. We extracted 13 factors based on scree plot (eigenvalue > 1). Metabolites with the maximum loading (more than 0.4) for a factor were used as relevant components. Factor scores for each of the extracted factors were calculated by summing the concentrations of the metabolites multiplied by loadings. Multivariate logistic regression was used to estimate OR and their 95% CI of the extracted factors to analyze the relationship between metabolite patterns and diabetes incidence. Models were adjusted for blood pressure and lipid profile (HDL-C, cholesterol, triglyceride).
Pathways analyses
Influenced pathways for significant metabolites were plotted. Metaboanalyst software version 5.0 (https://www.metaboanalyst.ca )was implemented for pathway enrichment analysis based on the Kyoto Encyclopedia of Genes and Genomes (KEGG) pathway database.
Acylcarnitines name
Free carnitine (C0), acetylcarnitine (C2), propionylcarnitine (C3), Malonylcarnitine (C3-DC), butyrylcarnitine (C4), Methylmalonyl-/succinylcarnitine (C4-DC), 3-OH-iso-/butyrylcarnitine (C4-OH), isovalerylcarnitine (C5), Tiglylcarnitine (C5:1), 3-OH-isovalerylcarnitine (C5-OH), glutarylcarnitine (C5DC), hexanoylcarnitine (C6), octanoylcarnitine (C8), Octenoylcarnitine (C8:1), decanoylcarnitine (C10), Decenoylcarnitine (C10:1), dodecanoylcarnitine (C12), tetradecanoylcarnitine (C14), Tetradecenoylcarnitine (C14:1), Tetradecadienoylcarnitine (C14:2), 3-OH-tetradecanoylcarnitine (C14-OH), hexadecanoylcarnitine (C16), 3-OH-hexadecanoylcarnitine (C16-OH), 3-OH-hexadecenoylcarnitine (C16:1-OH), Hexadecenoylcarnitine (C16:1), octadecanoylcarnitine (C18), Octadecenoylcarnitine (C18:1), 3-OH-octadecanoylcarnitine (C18-OH), 3-OH-octadecenoylcarnitine (C18:1-OH), Octadecadienoylcarnitine (C18:2).
Supplementary Information
Abbreviations
- NCD
Non-communicable disease
- BMI
Body mass index
- FPG
Fasting plasma glucose
- HDL-C
High-density lipoprotein cholesterol
- ADA
American Diabetes Association
- OR
Odds ratio
- CI
Confidence interval
- KEGG
Kyoto Encyclopedia of Genes and Genomes
- FDR
False discovery rate
- PCA
Principal component analysis
- KMO
Kaiser–Meyer–Olkin
- BCAA
Branched-chain amino acids
- AAA
Aromatic amino acids
- T2D
Type 2 diabetes
- T1D
Type 1 diabetes
- TCA
Tricarboxylic acid
Author contributions
F.R., B.L., E.N, F.F. contributed to the study conception and design. B.A., S.MF., S.AM. provided study patients and monitored data and specimen collection. N.N., A.DM, Sh.H. performed the experiments. R.Gh., F.R., Sh.H. analyzed the data. Sh.H., H.DB. wrote the manuscript. All authors read and approved the final manuscript.
Data availability
The datasets generated during and/or analyzed during the current study are available from the corresponding author on reasonable request.
Competing interests
The authors declare no competing interests.
Footnotes
Publisher's note
Springer Nature remains neutral with regard to jurisdictional claims in published maps and institutional affiliations.
Supplementary Information
The online version contains supplementary material available at 10.1038/s41598-022-11970-7.
References
- 1.Arneth B, Arneth R, Shams M. Metabolomics of type 1 and type 2 diabetes. Int. J. Mol. Sci. 2019;20(10):2467. doi: 10.3390/ijms20102467. [DOI] [PMC free article] [PubMed] [Google Scholar]
- 2.Hosseinkhani S, Dehghanbanadaki H, Aazami H, Pasalar P, Asadi M, Razi F. Association of circulating omega 3, 6 and 9 fatty acids with gestational diabetes mellitus: A systematic review. BMC Endocr. Disord. 2021;21(1):1–9. doi: 10.1186/s12902-021-00783-w. [DOI] [PMC free article] [PubMed] [Google Scholar]
- 3.McKillop AM, Flatt PR. Emerging applications of metabolomic and genomic profiling in diabetic clinical medicine. Diabetes Care. 2011;34(12):2624–2630. doi: 10.2337/dc11-0837. [DOI] [PMC free article] [PubMed] [Google Scholar]
- 4.Long J, Yang Z, Wang L, Han Y, Peng C, Yan C, et al. Metabolite biomarkers of type 2 diabetes mellitus and pre-diabetes: A systematic review and meta-analysis. BMC Endocr. Disord. 2020;20(1):1–17. doi: 10.1186/s12902-020-00653-x. [DOI] [PMC free article] [PubMed] [Google Scholar]
- 5.Guasch-Ferré M, Hruby A, Toledo E, Clish CB, Martínez-González MA, Salas-Salvadó J, et al. Metabolomics in prediabetes and diabetes: A systematic review and meta-analysis. Diabetes Care. 2016;39(5):833–846. doi: 10.2337/dc15-2251. [DOI] [PMC free article] [PubMed] [Google Scholar]
- 6.Lu J, Xie G, Jia W, Jia W. Metabolomics in human type 2 diabetes research. Front. Med. 2013;7(1):4–13. doi: 10.1007/s11684-013-0248-4. [DOI] [PubMed] [Google Scholar]
- 7.Hosseinkhani, S., et al. The trend in application of omics in type 2 diabetes researches: A bibliometric study. Diabetes Metab. Syndr. Clin. Res. Rev.15(5), 102250. 10.1016/j.dsx.2021.102250. (2021). [DOI] [PubMed]
- 8.Li X, Li Y, Liang Y, Hu R, Xu W, Liu Y. Plasma targeted metabolomics analysis for amino acids and acylcarnitines in patients with prediabetes, type 2 diabetes mellitus, and diabetic vascular complications. Diabetes Metab. J. 2021;45(2):195–208. doi: 10.4093/dmj.2019.0209. [DOI] [PMC free article] [PubMed] [Google Scholar]
- 9.Sun Y, Gao H-Y, Fan Z-Y, He Y, Yan Y-X. Metabolomics signatures in type 2 diabetes: A systematic review and integrative analysis. J. Clin. Endocrinol. Metab. 2020;105(4):1000–1008. doi: 10.1210/clinem/dgz240. [DOI] [PubMed] [Google Scholar]
- 10.Muilwijk M, Goorden SM, Celis-Morales C, Hof MH, Ghauharali-van der Vlugt K, Beers-Stet FS, et al. Contributions of amino acid, acylcarnitine and sphingolipid profiles to type 2 diabetes risk among South-Asian Surinamese and Dutch adults. BMJ Open Diabetes Res. Care. 2020;8(1):e001003. doi: 10.1136/bmjdrc-2019-001003. [DOI] [PMC free article] [PubMed] [Google Scholar]
- 11.Park SE, Park C-Y, Sweeney G. Biomarkers of insulin sensitivity and insulin resistance: Past, present and future. Crit. Rev. Clin. Lab. Sci. 2015;52(4):180–190. doi: 10.3109/10408363.2015.1023429. [DOI] [PubMed] [Google Scholar]
- 12.Shi L, Brunius C, Lehtonen M, Auriola S, Bergdahl IA, Rolandsson O, et al. Plasma metabolites associated with type 2 diabetes in a Swedish population: A case–control study nested in a prospective cohort. Diabetologia. 2018;61(4):849–861. doi: 10.1007/s00125-017-4521-y. [DOI] [PMC free article] [PubMed] [Google Scholar]
- 13.Liggi S, Griffin JL. Metabolomics applied to diabetes—lessons from human population studies. Int. J. Biochem. Cell Biol. 2017;93:136–147. doi: 10.1016/j.biocel.2017.10.011. [DOI] [PubMed] [Google Scholar]
- 14.Gunther SH, Khoo CM, Tai E-S, Sim X, Kovalik J-P, Ching J, et al. Serum acylcarnitines and amino acids and risk of type 2 diabetes in a multiethnic Asian population. BMJ Open Diabetes Res. Care. 2020;8(1):e001315. doi: 10.1136/bmjdrc-2020-001315. [DOI] [PMC free article] [PubMed] [Google Scholar]
- 15.Libert DM, Nowacki AS, Natowicz MR. Metabolomic analysis of obesity, metabolic syndrome, and type 2 diabetes: Amino acid and acylcarnitine levels change along a spectrum of metabolic wellness. PeerJ. 2018;6:e5410. doi: 10.7717/peerj.5410. [DOI] [PMC free article] [PubMed] [Google Scholar]
- 16.Bos MM, Noordam R, Bennett K, Beekman M, Mook-Kanamori DO, van Dijk KW, et al. Metabolomics analyses in non-diabetic middle-aged individuals reveal metabolites impacting early glucose disturbances and insulin sensitivity. Metabolomics. 2020;16(3):1–10. doi: 10.1007/s11306-020-01653-7. [DOI] [PMC free article] [PubMed] [Google Scholar]
- 17.Corbin LJ, Richmond RC, Wade KH, Burgess S, Bowden J, Smith GD, et al. BMI as a modifiable risk factor for type 2 diabetes: Refining and understanding causal estimates using Mendelian randomization. Diabetes. 2016;65(10):3002–3007. doi: 10.2337/db16-0418. [DOI] [PMC free article] [PubMed] [Google Scholar]
- 18.Mook-Kanamori MJ, Selim MME-D, Takiddin AH, Al-Homsi H, Al-Mahmoud KA, Al-Obaidli A, et al. Ethnic and gender differences in advanced glycation end products measured by skin auto-fluorescence. Dermato Endocrinol. 2013;5(2):325–330. doi: 10.4161/derm.26046. [DOI] [PMC free article] [PubMed] [Google Scholar]
- 19.Khambule L, Snyman T, Norris SA, Crowther NJ, George JA. Branched-chain and aromatic amino acids and cardiometabolic risk in Black African and Asian Indian populations. Metabolomics. 2020;16(10):1–14. doi: 10.1007/s11306-020-01734-7. [DOI] [PubMed] [Google Scholar]
- 20.Tillin T, Hughes AD, Wang Q, Würtz P, Ala-Korpela M, Sattar N, et al. Diabetes risk and amino acid profiles: Cross-sectional and prospective analyses of ethnicity, amino acids and diabetes in a South Asian and European cohort from the SABRE (Southall And Brent REvisited) Study. Diabetologia. 2015;58(5):968–979. doi: 10.1007/s00125-015-3517-8. [DOI] [PMC free article] [PubMed] [Google Scholar]
- 21.Nagao K, Kimura T. Use of plasma-free amino acids as biomarkers for detecting and predicting disease risk. Nutr. Rev. 2020;78(Supplement_3):79–85. doi: 10.1093/nutrit/nuaa086. [DOI] [PubMed] [Google Scholar]
- 22.Gar C, Rottenkolber M, Prehn C, Adamski J, Seissler J, Lechner A. Serum and plasma amino acids as markers of prediabetes, insulin resistance, and incident diabetes. Crit. Rev. Clin. Lab. Sci. 2018;55(1):21–32. doi: 10.1080/10408363.2017.1414143. [DOI] [PubMed] [Google Scholar]
- 23.Krebs M, Krssak M, Bernroider E, Anderwald C, Brehm A, Meyerspeer M, et al. Mechanism of amino acid-induced skeletal muscle insulin resistance in humans. Diabetes. 2002;51(3):599–605. doi: 10.2337/diabetes.51.3.599. [DOI] [PubMed] [Google Scholar]
- 24.Cao Y-F, Li J, Zhang Z, Liu J, Sun X-Y, Feng X-F, et al. Plasma levels of amino acids related to urea cycle and risk of type 2 diabetes mellitus in Chinese adults. Front. Endocrinol. 2019;10:50. doi: 10.3389/fendo.2019.00050. [DOI] [PMC free article] [PubMed] [Google Scholar]
- 25.Moon J, Kim OY, Jo G, Shin M-J. Alterations in circulating amino acid metabolite ratio associated with arginase activity are potential indicators of metabolic syndrome: The Korean Genome and Epidemiology Study. Nutrients. 2017;9(7):740. doi: 10.3390/nu9070740. [DOI] [PMC free article] [PubMed] [Google Scholar]
- 26.Floegel A, Stefan N, Yu Z, Mühlenbruch K, Drogan D, Joost H-G, et al. Identification of serum metabolites associated with risk of type 2 diabetes using a targeted metabolomic approach. Diabetes. 2013;62(2):639–648. doi: 10.2337/db12-0495. [DOI] [PMC free article] [PubMed] [Google Scholar]
- 27.Anuradha CV. Aminoacid support in the prevention of diabetes and diabetic complications. Curr. Protein Pept. Sci. 2009;10(1):8–17. doi: 10.2174/138920309787315194. [DOI] [PubMed] [Google Scholar]
- 28.Alves A, Bassot A, Bulteau A-L, Pirola L, Morio B. Glycine metabolism and its alterations in obesity and metabolic diseases. Nutrients. 2019;11(6):1356. doi: 10.3390/nu11061356. [DOI] [PMC free article] [PubMed] [Google Scholar]
- 29.McCann MR, George De la Rosa MV, Rosania GR, Stringer KA. L-carnitine and acylcarnitines: Mitochondrial biomarkers for precision medicine. Metabolites. 2021;11(1):51. doi: 10.3390/metabo11010051. [DOI] [PMC free article] [PubMed] [Google Scholar]
- 30.Houten SM, Wanders RJ, Ranea-Robles P. Metabolic interactions between peroxisomes and mitochondria with a special focus on acylcarnitine metabolism. Biochimica Biophysica Acta (BBA) Mol. Basis Dis. 2020;66(5):165720. doi: 10.1016/j.bbadis.2020.165720. [DOI] [PMC free article] [PubMed] [Google Scholar]
- 31.Mihalik SJ, Goodpaster BH, Kelley DE, Chace DH, Vockley J, Toledo FG, et al. Increased levels of plasma acylcarnitines in obesity and type 2 diabetes and identification of a marker of glucolipotoxicity. Obesity. 2010;18(9):1695–1700. doi: 10.1038/oby.2009.510. [DOI] [PMC free article] [PubMed] [Google Scholar]
- 32.Sun L, Liang L, Gao X, Zhang H, Yao P, Hu Y, et al. Early prediction of developing type 2 diabetes by plasma acylcarnitines: A population-based study. Diabetes Care. 2016;39(9):1563–1570. doi: 10.2337/dc16-0232. [DOI] [PubMed] [Google Scholar]
- 33.Liu J-J, Ghosh S, Kovalik J-P, Ching J, Choi HW, Tavintharan S, et al. Profiling of plasma metabolites suggests altered mitochondrial fuel usage and remodeling of sphingolipid metabolism in individuals with type 2 diabetes and kidney disease. Kidney Int. Rep. 2017;2(3):470–480. doi: 10.1016/j.ekir.2016.12.003. [DOI] [PMC free article] [PubMed] [Google Scholar]
- 34.Adams SH, Hoppel CL, Lok KH, Zhao L, Wong SW, Minkler PE, et al. Plasma acylcarnitine profiles suggest incomplete long-chain fatty acid β-oxidation and altered tricarboxylic acid cycle activity in type 2 diabetic African-American women. J. Nutr. 2009;139(6):1073–1081. doi: 10.3945/jn.108.103754. [DOI] [PMC free article] [PubMed] [Google Scholar]
- 35.Di Cesare, F., Luchinat, C., Tenori, L. & Saccenti, E. Age-and sex-dependent changes of free circulating blood metabolite and lipid abundances, correlations, and ratios. J. Gerontol. Ser. A77(5), 918–926 (2021). 10.1093/gerona/glab335 [DOI] [PMC free article] [PubMed]
- 36.Mittelstrass K, Ried JS, Yu Z, Krumsiek J, Gieger C, Prehn C, et al. Discovery of sexual dimorphisms in metabolic and genetic biomarkers. PLoS Genet. 2011;7(8):e1002215. doi: 10.1371/journal.pgen.1002215. [DOI] [PMC free article] [PubMed] [Google Scholar]
- 37.Darst BF, Koscik RL, Hogan KJ, Johnson SC, Engelman CD. Longitudinal plasma metabolomics of aging and sex. Aging (Albany N Y). 2019;11(4):1262. doi: 10.18632/aging.101837. [DOI] [PMC free article] [PubMed] [Google Scholar]
- 38.Rist MJ, Roth A, Frommherz L, Weinert CH, Krüger R, Merz B, et al. Metabolite patterns predicting sex and age in participants of the Karlsruhe Metabolomics and Nutrition (KarMeN) study. PLoS ONE. 2017;12(8):e0183228. doi: 10.1371/journal.pone.0183228. [DOI] [PMC free article] [PubMed] [Google Scholar]
- 39.Krumsiek J, Mittelstrass K, Do KT, Stückler F, Ried J, Adamski J, et al. Gender-specific pathway differences in the human serum metabolome. Metabolomics. 2015;11(6):1815–1833. doi: 10.1007/s11306-015-0829-0. [DOI] [PMC free article] [PubMed] [Google Scholar]
- 40.Xie G, Ma X, Zhao A, Wang C, Zhang Y, Nieman D, et al. The metabolite profiles of the obese population are gender-dependent. J. Proteome Res. 2014;13(9):4062–4073. doi: 10.1021/pr500434s. [DOI] [PMC free article] [PubMed] [Google Scholar]
- 41.Djalalinia, S., et al. Protocol design for large-scale cross-sectional studies of surveillance of risk factors of non-communicable diseases in Iran: STEPs 2016. Arch. Iran. Med.20(9), 608–616 (2017). [PubMed]
- 42.Association AD. 2. Classification and diagnosis of diabetes: Standards of Medical Care in Diabetes—2021. Diabetes Care44(Supplement 1), S15–S33 (2021). [DOI] [PubMed]
- 43.Esmati. P., et al. Mass spectrometry with derivatization method for concurrent measurement of amino acids and acylcarnitines in plasma of diabetic type 2 patients with diabetic nephropathy. J. Diabetes Metab. Disorders20(1), 591–599. 10.1007/s40200-021-00786-3 (2021). [DOI] [PMC free article] [PubMed]
- 44.Lee KS, Rim JH, Lee Y-h, Lee S-G, Lim J-B, Kim J-H. Association of circulating metabolites with incident type 2 diabetes in an obese population from a national cohort. Diabetes Res. Clin. Pract. 2021;180:109077. doi: 10.1016/j.diabres.2021.109077. [DOI] [PubMed] [Google Scholar]
- 45.Duan Y, Sun H, Yao Y, Han L, Chen L. Perturbation of serum metabolome in relation to type 2 diabetes mellitus and urinary levels of phthalate metabolites and bisphenols. Environ. Int. 2021;155:106609. doi: 10.1016/j.envint.2021.106609. [DOI] [PubMed] [Google Scholar]
- 46.Wang L, Zhang Y, Liu X, Zhao X, Ouyang Y, Qiu G, et al. Metabolite triplet in serum improves the diagnostic accuracy of prediabetes and diabetes screening. J. Proteome Res. 2020;20(1):1005–1014. doi: 10.1021/acs.jproteome.0c00786. [DOI] [PubMed] [Google Scholar]
- 47.Al-Aama JY, Al Mahdi HB, Salama MA, Bakur KH, Alhozali A, Mosli HH, et al. Detection of secondary metabolites as biomarkers for the early diagnosis and prevention of type 2 diabetes. Diabetes Metab. Syndr. Obes. Targets Ther. 2019;12:2675. doi: 10.2147/DMSO.S215528. [DOI] [PMC free article] [PubMed] [Google Scholar]
- 48.Guasch-Ferré M, Ruiz-Canela M, Li J, Zheng Y, Bulló M, Wang DD, et al. Plasma acylcarnitines and risk of type 2 diabetes in a Mediterranean population at high cardiovascular risk. J. Clin. Endocrinol. Metab. 2019;104(5):1508–1519. doi: 10.1210/jc.2018-01000. [DOI] [PMC free article] [PubMed] [Google Scholar]
- 49.Lu Y, Wang Y, Liang X, Zou L, Ong CN, Yuan J-M, et al. Serum amino acids in association with prevalent and incident type 2 diabetes in a Chinese population. Metabolites. 2019;9(1):14. doi: 10.3390/metabo9010014. [DOI] [PMC free article] [PubMed] [Google Scholar]
- 50.Rebholz CM, Yu B, Zheng Z, Chang P, Tin A, Köttgen A, et al. Serum metabolomic profile of incident diabetes. Diabetologia. 2018;61(5):1046–1054. doi: 10.1007/s00125-018-4573-7. [DOI] [PMC free article] [PubMed] [Google Scholar]
- 51.Merino J, Leong A, Liu C-T, Porneala B, Walford GA, von Grotthuss M, et al. Metabolomics insights into early type 2 diabetes pathogenesis and detection in individuals with normal fasting glucose. Diabetologia. 2018;61(6):1315–1324. doi: 10.1007/s00125-018-4599-x. [DOI] [PMC free article] [PubMed] [Google Scholar]
- 52.Peddinti G, Cobb J, Yengo L, Froguel P, Kravić J, Balkau B, et al. Early metabolic markers identify potential targets for the prevention of type 2 diabetes. Diabetologia. 2017;60(9):1740–1750. doi: 10.1007/s00125-017-4325-0. [DOI] [PMC free article] [PubMed] [Google Scholar]
- 53.Liu J, Semiz S, van der Lee SJ, van der Spek A, Verhoeven A, van Klinken JB, et al. Metabolomics based markers predict type 2 diabetes in a 14-year follow-up study. Metabolomics. 2017;13(9):1–11. doi: 10.1007/s11306-017-1239-2. [DOI] [PMC free article] [PubMed] [Google Scholar]
- 54.Knebel B, Strassburger K, Szendroedi J, Kotzka J, Scheer M, Nowotny B, et al. Specific metabolic profiles and their relationship to insulin resistance in recent-onset type 1 and type 2 diabetes. J. Clin. Endocrinol. Metab. 2016;101(5):2130–2140. doi: 10.1210/jc.2015-4133. [DOI] [PubMed] [Google Scholar]
- 55.Qiu G, Zheng Y, Wang H, Sun J, Ma H, Xiao Y, et al. Plasma metabolomics identified novel metabolites associated with risk of type 2 diabetes in two prospective cohorts of Chinese adults. Int. J. Epidemiol. 2016;45(5):1507–1516. doi: 10.1093/ije/dyw221. [DOI] [PubMed] [Google Scholar]
- 56.Lu Y, Wang Y, Ong C-N, Subramaniam T, Choi HW, Yuan J-M, et al. Metabolic signatures and risk of type 2 diabetes in a Chinese population: An untargeted metabolomics study using both LC–MS and GC–MS. Diabetologia. 2016;59(11):2349–2359. doi: 10.1007/s00125-016-4069-2. [DOI] [PubMed] [Google Scholar]
- 57.Floegel A, Stefan N, Yu Z, Mühlenbruch K, Drogan D, Joost H-G, et al. Identification of serum metabolites associated with risk of type 2 diabetes using a targeted metabolomic approach. Diabetes. 2013;62(2):639–648. doi: 10.2337/db12-0495. [DOI] [PMC free article] [PubMed] [Google Scholar]
- 58.Menni C, Fauman E, Erte I, Perry JR, Kastenmüller G, Shin S-Y, et al. Biomarkers for type 2 diabetes and impaired fasting glucose using a nontargeted metabolomics approach. Diabetes. 2013;62(12):4270–4276. doi: 10.2337/db13-0570. [DOI] [PMC free article] [PubMed] [Google Scholar]
Associated Data
This section collects any data citations, data availability statements, or supplementary materials included in this article.
Supplementary Materials
Data Availability Statement
The datasets generated during and/or analyzed during the current study are available from the corresponding author on reasonable request.