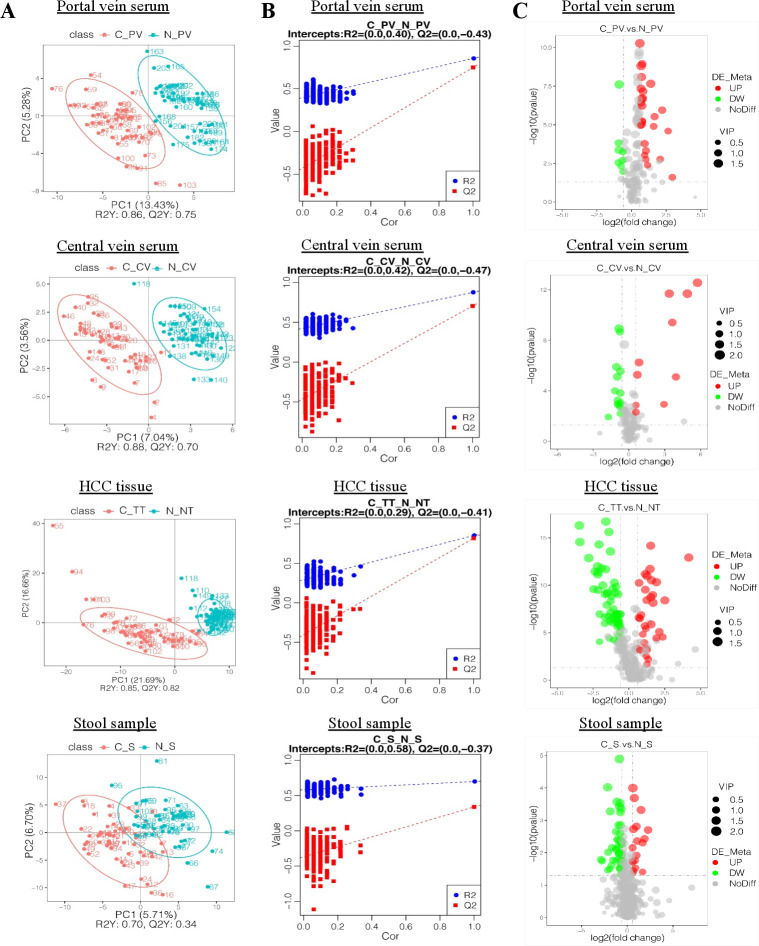
Figure 2.
Metabolic alterations in HCC were found in various samples. (A) PLS-DA score plots for portal and central vein serum, HCC tissues and stool samples in ESI− model. HCC patients are shown in red, and normal controls are shown in blue. X axis and Y axis represent contributions of persons to the first two principal components (PC1 and PC2). (B) Cross-validation plot with a permutation test repeated 200 times. The intercepts of R2= (0.0, 0.4) and Q2= (0.0,–0.43), R2= (0.0, 0.42) and Q2= (0.0,–0.47), R2= (0.0, 0.29) and Q2= (0.0,–0.41) and R2= (0.0, 0.58) and Q2= (0.0,–0.37) suggest that the PLS-DA model is not overfitting. (C) Volcano plots showing the results of pairwise comparisons of metabolites in each HCC sample’s group relative to healthy controls (CP_V/N_PV, C_CV/N_CV, C_TT/N_NT, C_S/N_S, respectively). The vertical dashed lines indicate the threshold for the twofold abundance difference. The horizontal dashed line indicates the p=0.05 threshold. Between-group comparisons were performed using Student’s t test. metabolites with significant changes are presented in red (upregulated) or green (downregulated). C_PV, portal vein of HCC patients; N_PV, portal vein of healthy controls; C_CV, central vein of HCC patients; N_CV, central vein of healthy controls; C_TT, HCC tissue of HCC patients; N_NT, normal tissue of healthy controls; C_S, stool samples of HCC patients; N_S, stool samples of healthy controls. VIP, variable importance in the projection. ESI−, negative electrospray ionisation; HCC, hepatocellular carcinoma; PLS-DA, partial least squares discrimination analysis.

