

Abstract
Coronavirus Disease 2019 (COVID-19) pandemic has shown the need for early diagnosis to manage infectious disease outbreaks. Here, we report a label free electrochemical Fluorine-Doped Tin Oxide (FTO) Immunosensor coupled with gold nanorods (GNRs) as an electron carrier for ultrasensitive detection of the Receptor Binding Domain (RBD) of SARS CoV-2 Spike protein. The RBD gene was cloned, and expressed in-house with confirmed molecular weight of ∼31 kDa via Sodium Dodecyl Sulphate-Polyacrylamide Gel Electrophoresis (SDS-PAGE) and Matrix-Assisted Laser Desorption/Ionization-Time of Flight (MALDI-TOF). RBD antibodies (Ab) were generated to be used as a bioreceptor for sensor fabrication, and characterized using SDS-PAGE, Western Blot, and Enzyme-Linked Immunosorbent Assay (ELISA). GNRs were fabricated on the electrode surface, followed by immobilization of RBD Ab. The conjugation steps were confirmed by UV–Vis Spectroscopy, Dynamic Light Scattering (DLS), Atomic Force Microscopy (AFM), Transmission Electron Microscopy (TEM), Cyclic Voltammetry (CV), and Differential Pulse Voltammetry (DPV). The fabricated electrode was further optimized for maximum efficiency and output. The detection limit of the developed electrode was determined as 0.73 fM for RBD antigen (Ag). Furthermore, the patient nasopharyngeal samples were collected in Viral Transport Media (VTM), and tested on the sensor surface that resulted in detection of SARS CoV-2 within 30 s, which was further validated via Reverse Transcription-Polymerase Chain Reaction (RT-PCR). Moreover, the immunosensor showed good repeatability, storage stability, and minimal cross reactivity against Middle East Respiratory Syndrome (MERS) spike protein. Along with ease of fabrication, the electrodes show future miniaturization potential for extensive and rapid screening of populations for COVID-19.
Keywords: Receptor binding domain, Gold nanorods, Electrochemical, SARS CoV-2, Spike protein, Middle east respiratory syndrome
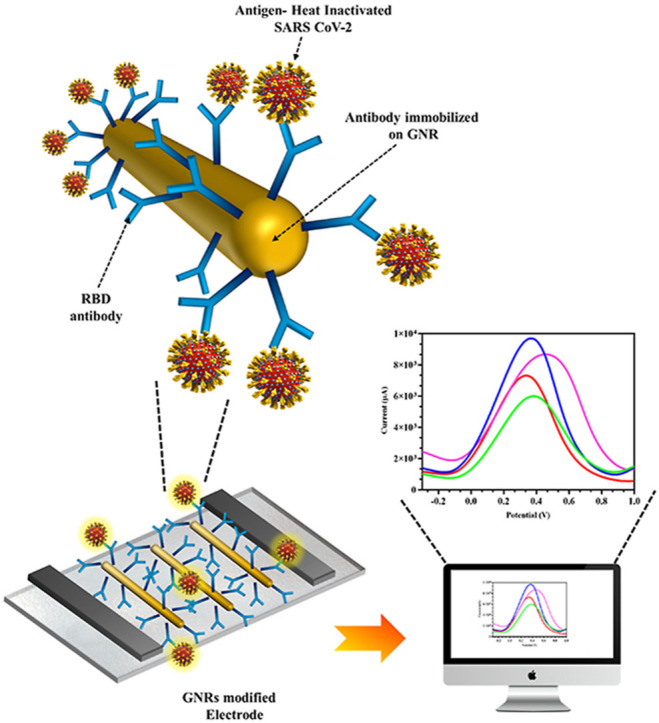
Graphical abstract
Electrochemical detection of Receptor Binding Domain on SARS CoV-2 Spike surface protein in patient nasopharyngeal samples with gold nanorods modified electrode for initial mass screening of COVID-19 patients. (The elements in the schematics are not to scale and for representational purpose only).
1. Introduction
In 2019, Severe Acute Respiratory Syndrome Coronavirus-2 (SARS CoV-2) was identified for the first time in Wuhan, China, and found to easily transmit through human contact (Bai et al., 2020; Xu et al., 2020). Subsequently, the World Health Organization (WHO) declared it as a pandemic in March 2020. More than a year and a half later, on 7th January 2022, more than 300,958,246 cases of COVID-19 have been reported across the world with 5,491,578 fatalities and the numbers continue to increase each day due to recurring waves of the mutating virus variants such as Delta and Omicron. Over the last two decades, two beta-coronavirus species, Severe Acute Respiratory Syndrome Coronavirus (SARS-CoV) and Middle East Respiratory Syndrome Coronavirus (MERS-CoV), have led to epidemic outbreaks (Ding et al., 2020; Xu et al., 2020). The beta-coronavirus, SARS CoV-2, is made up of a single positive strand RNA genome which encodes four structural proteins namely Spike (S), Envelope (E), Matrix (M), and Nucleocapsid (N). Among the structural proteins, homotrimeric Spike glycoprotein made up of two subunits, S1 and S2, which guides viral attachment, fusion, and entry, is the most widely used biomarker for serological antigen based detection assays including biosensors (Roberts et al., 2021b). The S1 subunit comprises of the Receptor Binding Domain (RBD) on the surface, which binds to the Angiotensin-Converting Enzyme (ACE)-2 receptor in lungs at nanomolar range providing viral attachment that is critical for viral entry (Lan et al., 2020).
Currently, real time Reverse Transcription-Polymerase Chain Reaction (RT-PCR)-based tests for viral RNA detection is considered as the gold standard for SARS CoV-2 diagnostics (Sheikhzadeh et al., 2020). However, this molecular technique requires a minimum of 3 h, an extensive laboratory setup, and skilled personnel. Furthermore, the RNA extraction and preparation process may impact the diagnostic accuracy. Hence, for rapid and accurate detection of COVID-19, highly sensitive immunological diagnostic techniques that directly identify viral antigen in clinical samples involving minimum sample preparation procedures are required.
Biosensors are sensitive, portable, show rapid detection time, require minute sample quantity and can be customized for specific analyte detection. By replacing the bioreceptor of the sensor, various biomarkers can be targeted to identify narcotics (Mishra et al., 2018), bacteria (Mahari and Gandhi, 2022), viruses (Ahirwar et al., 2021; Kerry et al., 2019; Kesarwani et al., 2021; Nandi et al., 2020; Roberts et al., 2020, 2021a; Roberts and Gandhi, 2020), diseases (Dey et al., 2022; Roberts et al., 2019; Shahdeo and Gandhi, 2022), pesticides (Talan et al., 2018), and toxins (Shukla et al., 2020). Electrochemical sensors are preferred for infectious disease detection as it show minimum matrix effect due to sample absorbance or turbidity and hence are highly sensitive (Bakker, 2004) to develop SARS CoV-2 diagnosis (Kaushik et al., 2020; Roberts et al., 2021b; Seo et al., 2020; Zhao et al., 2021). FTO electrochemical sensors are considered to be potentially useful in clinical diagnostics due to high conductivity, stability, tolerance for mechanical abrasions, ease of fabrication and economical advantage (Roberts et al., 2022). Moreover, the electrical signal output of these sensors can be enhanced using different conductive nanomaterials such as graphene (Narlawar and Gandhi, 2021; Shahdeo et al., 2020) or gold (Pingarrón et al., 2008). Gold nanorods (GNRs) have proven to be a useful material due its extraordinary properties such as enhanced conductivity, biocompatibility, and ease of conjugation (Alagiri et al., 2017) and have previously been used to develop a glass prism-based plasmonic immunosensor for the detection of SARS CoV-2 Spike protein (Manas Das et al., 2020).
In this study, we have cloned and expressed RBD domain of Spike protein as the diagnostic biomarker. SARS CoV-2 cDNA was reverse transcribed from extracted viral RNA (from nasal swab of Covid-19 patient) and used as a template for amplification of RBD gene with specifically designed primers. The amplified RBD gene was further cloned into pET28a+ vector, expressed in E. coli, purified, and the molecular weight of ∼31 kDa confirmed via Sodium Dodecyl Sulphate-Polyacrylamide Gel Electrophoresis (SDS-PAGE) and Matrix-Assisted Laser Desorption/Ionization-Time of Flight (MALDI-TOF). The purified RBD protein was further used as an immunogen to generate RBD polyclonal antibodies (Ab) and the binding efficiency was confirmed via Western blot and Enzyme-Linked Immunosorbent Assay (ELISA). The advantages of using polyclonal over monoclonal Ab as a bioreceptor on the sensor are lower cost and generation time, ease of immobilization or labelling, higher overall affinity for the target native antigen as it recognizes more than one epitope and hence increases sensitivity of the sensor, quicker binding for faster response time, and the ability to detect small quantities of the target protein in the sample as well as high chances of maintaining affinity for mutating antigens (Haurum, 2006). Further, we developed a Fluorine-Doped Tin Oxide (FTO)-based electrochemical sensor functionalized with gold nanorods (GNR) as signal enhancers conjugated with RBD Ab (FTO/GNR/RBD-Ab) for detection of RBD protein of SARS CoV-2. Each fabrication, conjugation, and interaction steps were characterized using UV–Vis Spectroscopy, Dynamic Light Scattering (DLS), Atomic Force Microscopy (AFM), Transmission Electron Microscopy (TEM), Cyclic Voltammetry (CV) and Differential Pulse Voltammetry (DPV). RBD Ag spiked in buffer within the linear range of 1 μM to 1 fM was tested on the electrode with a detection limit of 0.73 fM and response time within 30 s which was more sensitive and/or gave a quicker result than existing sensors (both electrochemical and lateral flow assay (LFA) based) developed for detection of SARS-CoV-2. The major advantage of the developed sensor over LFA based sensors besides sensitivity and ease of fabrication, is that it can be regenerated and reused up to 5 times after which it can be stripped and the same electrode can be refabricated, unlike one-time-use disposable LFA strips. The electrode also showed negligible cross reactivity with MERS Spike protein, good storage stability, and repeatability. The fabricated immunosensor was further validated with RT-PCR data (clinical samples) and showed 100% true positive results and 60% true negative results. Henceforth, the fabricated electrochemical immunosensor could be a prospective candidate for future miniaturization and application for mass screening of COVID-19 population.
2. Materials and methods
2.1. Apparatus
SARS CoV-2 RBD sequence was amplified using Invitrogen ProFlex™ thermal cycler (Applied Biosystems, Massachusetts, USA). Agarose Gel Electrophoresis, SDS-PAGE and Western Blot analysis were performed using Sub-Cell GT electrophoretic system and Mini-PROTEAN Tetra Vertical Electrophoresis Cell respectively (Bio Rad laboratories, California, USA). Images of protein and DNA gels were acquired via Invitrogen iBright™ CL1500 Imaging System (Applied Biosystems, Massachusetts, United States). UV–Vis spectral analysis was performed in Rayleigh UV–Vis Spectrophotometer (UV 9200, Chennai). The average hydrodynamic diameter was analyzed on a Dynamic Light Scattering (DLS) (Anton Paar Litesizer 500, Graz, Austria). GNR size and structure was observed with a Transmission Electron Microscope (TEM) (JEOL-JEM F 200 kV) on Formvar coated copper grids (Ted Pella Inc., Redding, CA). Topographic characterization of GNR surface was performed using Atomic Force Microscopes (AFM) (Oxford Instruments-MFP-3D origin) with AR 16.25 software. ELISA readings were taken on ThermoFisher Scientific Multiskan™ FC Microplate Photometer (ThermoScientific, USA). CV and DPV measurements were performed using PalmsSens4 (Netherlands) driven by MultiTrace software. The plotting of all graphs and statistical analysis were carried out using Graphpad Prism 8 software. All experiments were carried out at room temperature (RT) and sensor-based experiments were conducted in triplicate sets unless stated otherwise.
2.2. Reagents
Reverse transcription kit for generation of SARS-CoV-2 cDNA was procured from Takara (PrimeScript™ RT Reagent Kit (Perfect Real Time). PCR cloning kit, restriction enzymes (BamHI and HindIII), DH10β and BL21 Competent E. coli cells, and Instant Sticky-end Ligase Master Mix were purchased from New England Biolabs (Beverly, MA). Primers for PCR were synthesized by GCC Biotech (I) Pvt. Ltd. (India). The plasmid extraction kit, PCR cleanup kit, and DNA agarose gel cleanup kit were obtained from Qiagen India Pvt. Ltd. (New Delhi, India). Ni2+-NTA resin was purchased from Thermo-fisher (HisPur™ Ni-NTA Resin-India). Sodium dihydrogen phosphate-1-hydrate (Na2HPO4.H2O), Tween-20 and gold nanorods (GNR) was acquired from Merck (Mumbai, India). Potassium dihydrogen orthophosphate (KH2PO4), sodium carbonate anhydrous (Na2CO3), sodium bicarbonate (NaHCO3), sodium citrate tribasic dehydrate (C6H5Na3O7.2H2O), guanidine-HCl, and isopropyl -D-thiogalactoside (IPTG) were procured from Sisco Research Laboratories (SRL, India). Potassium chloride (KCl) and sodium chloride (NaCl) were obtained from CDH (New Delhi, India). Skimmed milk powder, Freund's complete adjuvant, and Freund's incomplete adjuvant were purchased from Sigma-Aldrich (India). Protein-A Sepharose resin was procured from Cytiva (Marlborough, USA). Sulfuric Acid (H2SO4) and Hydrochloric acid (HCl) were purchased from Fisher Scientific (India). 3,3′,5,5′-Tetramethylbenzidine (TMB) substrate was acquired from G-Biosciences (Noida, India). SARS-CoV-2 Ag (Spike S1 protein) was procured from ProSci (California, USA) while MERS Spike Ag was procured from R & D Systems (Minnesota, USA). Immobilon western chemiluminescent HRP Substrate (ECL) and polyvinylidene difluoride (PVDF) membrane were obtained from Merck Millipore (Darmstadt, Germany). 96-well NUNC microtiter plates for ELISA were bought from Thermo Scientific (Bangalore, India). New Zealand white rabbits were procured from Vyas Labs (Hyderabad, India) and housed at the small animal facility managed by the National Institute of Animal Biotechnology (NIAB, Hyderabad, TN). All chemicals, solvents and reagents used were of high-quality analytical grade unless stated otherwise and all solutions were prepared in double distilled water.
2.3. Amplification and cloning of SARS CoV-2 RBD protein
SARS-CoV-2 RBD gene sequence was obtained from NCBI's GenBank database (accession no: MT416726.2). Primers for cloning of RBD sequence were designed by selection of 18 base-pair hybridization sequences from the ends of RBD coding sequence. Restriction sites for BamHI and HindIII were incorporated into the forward and reverse primers respectively. The primers were designed by taking all the parameters into consideration such as GC content (40–60%), Tm (Melting temperature) for both the primers (difference of 2–4 °C), and lack of hairpin loops, bulge loops, internal loops, and match sites. Further, mock cloning of RBD sequence was performed in-silico in pET28a+ vector using SnapGene tool (Snap Gene®5.3.2) to ensure correct insertion of RBD sequence into pET28a+ vector in line with the reading frame.
SARS-COV-2 RNA was kindly provided by Gandhi hospital, Hyderabad, India and reverse transcribed into cDNA using PrimeScript 1st strand cDNA Synthesis Kit. SARS-CoV-2 RBD sequence was subsequently amplified via PCR, using the following designed primers: Sense primer 5′-CTGAGGATCCAGAGTCCAACCAACAGA-3′ and antisense primer 5′-CGTCAAGCTTACCTGTGCCTGTTAAACC-3′ where the underlined sequences correspond to the recognition site sequences of restriction enzyme BamHI and HindIII, respectively. The PCR consisted of a mixture of 1 X Phusion buffer, 0.5 μM of each primer, 200 μM dNTPs, 250 ng cDNA template, and 1-unit Phusion DNA polymerase. The following parameters were standardized for the PCR: 98 °C for 30 s (initial denaturation), followed by 30 cycles of 98 °C for 10 s, 56 °C for 30 s, and 72 °C for 30 s and an additional 10 min at 72 °C (final extension) before storage at 4 °C. The PCR amplified RBD sequence was then purified using PCR Cleanup kit and examined on 1% Agaorse gel. Upon confirmation of RBD gene size, both the insert and pET28a+ plasmid was restriction digested using BamHI and HindIII and purified. The purified digested insert and vector were further ligated using instant sticky ligase (Instant Sticky-end Ligase Master Mix, NEB) at a molar ratio of 1:3 (vector:insert). The ligated product was then transformed into E. coli DH10β strain. The transformed bacterial colonies were cultured on 2% agar plates containing 50 μg/ml kanamycin and individual colonies were screened for RBD insert via colony PCR and the selected positive clone was further confirmed by restriction digestion.
2.4. Expression, purification, and characterization of RBD protein
Upon confirmation, the positive clone was isolated, and transformed into the expression host E. coli BL21 (DE3). This E. coli strain allows high efficiency protein expression under T7 promoter. A single colony was inoculated in 1 ml Luria-Bertani media (LB media) containing 50 μg/ml kanamycin upon transformation, and incubated overnight at 37 °C under constant shaking (250 rpm). This primary culture was then sub-cultured to higher volume (500 ml) and shaker incubated at 37 °C until OD600 reached approximately 0.6 upon which the expression of SARS-CoV-2 RBD protein was induced by addition of 1 mM isopropyl -D-thiogalactoside (IPTG), and the induction time for maximum protein expression was optimized. After induction, the cells were pelleted out by centrifugation at 10,000 rpm, 4 °C for 20 min and stored at −80 °C until further processing. The bacterial cells were further lysed and the RBD protein was isolated using 6 M guanidine-HCl (Gu-HCl) denaturation cell lysis method (Palmer and Wingfield, 2004; Singh et al., 2015). Cells were resuspended in 6 M Gu-HCl in PBS (pH 7.4), with an additional supplement of 100 mM Phenylmethylsulfonyl fluoride (PMSF), triton X-100 and lysozyme, and incubated on ice for 30 min, followed by addition of DNAase and MgCl2 for another 30 min incubation, and sonicated. The lysed cells were centrifuged at 12,000 rpm, 4 °C for 30 min and the supernatant was collected for purification of RBD protein. Ni2+ chelating resin was equilibrated with 10 ml equilibrium buffer (6 M Gu-HCl and 10 mM imidazole) and supernatant was passed through the packed column, followed by addition of wash buffer (6 M Gu-HCl and 25 mM imidazole). The protein of interest was then eluted using elution buffer (6 M Gu-HCl and 250 mM imidazole) and the collected fractions were analyzed on 12% SDS–PAGE. The fractions containing the RBD protein were then dialyzed for protein renaturation by removal of Gu-HCl against reducing urea concentration. The quality and quantity of the purified RBD protein was analyzed by SDS-PAGE, MALDI-TOF and Bradford assay.
2.5. Immunization, antibody production, and assay development for SARS CoV-2 RBD protein
7-week-old New Zealand white rabbits were immunized subcutaneously at 21-day intervals with 300 μg of RBD protein using complete Freund's adjuvant during the first immunization and 200 μg RBD protein as subsequent booster doses formulated with incomplete Freund's adjuvant. Serum was collected after each booster, and tested for RBD Ab titer via indirect binding ELISA at 1:1000 dilution. The Ab was further purified using Protein-A Sepharose gravity flow column (Protein A-Sepharose® CL-4B Cytiva protocol), followed by dialysis against PBS.
The purity of the Ab was evaluated by 12% SDS-PAGE to check for the distinct light and heavy chains and binding was confirmed by Western blot. For Western blot analysis, the SARS-CoV-2 RBD Ag was run on 12% SDS-PAGE and transferred onto a polyvinylidene difluoride (PVDF) membrane. The membrane was blocked using 5% Bovine Serum Albumin (BSA) for 2 h and washed with 0.2% PBST (PBS with 0.2% Tween 20) to remove any residual blocking agent. Blocked PVDF membrane was further incubated with 1:8000 dilution of purified SARS CoV-2 RBD 1°Ab overnight at 4 °C and subsequently incubated with Horse Radish Peroxidase (HRP) labeled anti-rabbit secondary antibody (2° Ab) at 1:5000 dilution. The membrane was washed 3 times with PBS-T after each incubation step. Finally, enhanced chemiluminescence (ECL) substrate was applied onto the membrane and the image was developed using ChemiDoc.
Indirect binding and competitive ELISA were performed to understand the binding affinity of the in-house generated Ag and Ab. The main objective of the binding ELISA was to determine the optimum concentration of Ab and Ag required for competitive ELISA. ELISA was performed on flat bottom Nunc 96-well microplates. 2.5 μg/ml purified RBD protein prepared in coating buffer (carbonate buffer-0.016 M Na2CO3, 0.034 M NaHCO3 pH 9.6) was plated and incubated overnight at 4 °C. The plates were then washed thrice with 0.02% PBS-T, followed by blocking with 2% Phosphate Buffer Saline-Skimmed milk (PBS-M) at 37 °C for 1 h. The plates were again washed thrice and two-fold RBD Ab dilutions (10 μg/ml to 0.3 ng/ml) prepared in 0.1% PBS-M were added and incubated for 2 h at 37 °C followed by triple washing with 0.02% PBS-T. Goat anti-rabbit HRP-conjugated 2° Ab (1:10,000 dilution in 0.1% PBS-M) was added to the plates and incubated for 1 h at 37 °C. After PBS-T washing, 1:10 TMB substrate was added and incubated for 15 min until blue color developed and the reaction was stopped using 1 N HCl. Readings were taken at 450 nm on an ELISA plate reader. The same experimentation was repeated to check the binding affinity of in-house RBD Ab with SARS CoV-2 and MERS Spike Ag.
The optimal concentration of Ag and Ab was estimated using the indirect binding ELISA, which was then used to carry out competitive ELISA. Initial steps of Ag coating and blocking with 2% PBS-M remained the same, however in the 1° Ab step, different concentrations of Ag mixed with constant concentration of 1°Ab (Ag-1°Ab) complex was added (10 μg/ml of RBD Ab) with (0.078 μg/ml to 19 pg/ml of RBD Ag) and incubated for 2 h at 37 °C. Further addition of 2°Ab, washing, TMB and stop solution steps remained the same as binding ELISA. Readings were measured and graph was plotted to determine the limit of detection of the in-house antigen and antibody immunoassay. The same experiment was carried out to determine the binding affinity of in-house RBD Ab with SARS CoV-2 and MERS Spike Ag.
2.6. Conjugation of RBD antibody with GNR (GNR/Ab) and its characterization
Gold Nanorods are the surface plasmon resonate (SPR) based rod shaped nanoparticles with uniform sized distribution ideal for bioconjugation and signal enhancement for sensor development. For conjugation of RBD Ab with GNR, 1 μg of RBD antibody was added to 50 μl of 0.1 mg/ml GNR and incubated overnight at 4 °C followed by centrifugation at 12,000 rpm for 30 min at 4 °C to remove unbound GNR and Ab. The loose pellet was resuspended in distilled water and the supernatant as well as hard pellet was discarded. Approximately 50 ± 5 nm sized GNR were conjugated with RBD Ab, and further characterized via UV–Vis Spectroscopy, DLS for average hydrodynamic diameter, AFM and TEM to confirm the conjugation, size and uniform distribution. UV–Vis spectroscopy was done in the scan range of 400 nm–900 nm for the confirmation of the shift upon conjugation of RBD Ab with GNR. Average hydrodynamic diameter was measured using Dynamic Light Scattering (DLS) (Anton Paar) equipped with a green laser excitation source operating at 532 nm/50 mW to analyze the average size distribution and surface charge of GNRs and GNR/Ab. AFM was conducted to observe the topological characteristics before and after conjugation by depositing the samples on silicon surfaces i.e. (i) GNR and (ii) GNR/Ab. TEM was performed by drop casting the GNR and GNR/Ab samples onto carbon coated copper TEM grids, which provided final confirmation of successful bioconjugation, monodispersity and size of both GNR and GNR/Ab.
2.7. Analytical performance of fabricated FTO/GNR/RBD-Ab electrode for the detection of SARS CoV-2 RBD Ag
Various parameters were optimized for maximum current output from the electrode, including GNR concentration, Ab concentration, scan rate (0.01–0.1 V/s), temperature (4 °C, RT, 37 °C, 45 °C), and pH (6.0, 6.5, 7.0, 7.5, and 8.0). Subsequently, 1 μg/ml of RBD Ab was immobilized on the GNR pre-coated electrode and incubated overnight at 4 °C. Electrochemical characterization of each fabrication step, and optimization of FTO/GNR/RBD-Ab were performed with working electrode, a platinum wire as the counter electrode, and Ag/AgCl as the reference electrode by sweeping the potential. RBD Ag was prepared in the linear range of 1 fM to 1 μM (in 50 mM Phosphate Buffer, pH 7.4) to determine the limit of detection (LOD) by plotting a calibration curve of the Differential Pulse Voltammogram. After addition of 100 μl of Ag sample, the readings were obtained within 30 s. The specificity of the fabricated electrode was also determined by analyzing the cross-reactivity against MERS Spike Ag. Furthermore, the storage stability was tested over a period of 3 weeks by storing the coated electrodes at 4 °C and analyzing at 7-day intervals. The repeatability of a single electrode was tested by dipping the same electrode repetitively (6 times) in spiked buffer samples, until a noticeable decrease in the current output was observed. After each trial, the electrode was regenerated by removing the bound Ag using low pH chemistry to break the Ab-Ag complex and the same electrode was reused (Azahar Ali et al., 2021).
2.8. Validation of SARS CoV-2 patient samples on the fabricated sensor
The modified electrode was further used to detect the target RBD antigen in COVID-19 patient samples (nasopharyngeal swabs) collected in viral transport media (VTM) from Gandhi Hospital, Hyderabad, India. The virus was heat-killed at 95 °C for 10 min, and 100 μl of the sample was used for detection and allowed to incubate on the electrode for 10 s for Ag-Ab binding, and results were obtained within 30 s. To plot the graph, peak current of each sample after blank subtraction of VTM peak current were plotted along the y axis. The results obtained from immunosensor were correlated with the RT-PCR results of the samples, conducted at Gandhi hospital, Hyderabad, India. All real samples for RT-PCR were handled by trained professionals with appropriate personal protective equipment and biosafety levels at Gandhi hospital, Hyderabad and the virus in the samples were heat-killed thereafter before testing on the electrode.
3. Results and discussion
3.1. PCR amplification and cloning of SARS CoV-2 RBD gene
Viral RNA was extracted from Covid positive patient nasopharyngeal swab at Gandhi hospital, Hyderabad, India, and reverse transcribed into cDNA template sequence from which the RBD insert was successfully PCR amplified and cloned into pET28a+ plasmid, which was visualized via Snapgene (Fig. S1a). The optimum annealing temperature for maximum amplification of 669 bp RBD insert from the full-length cDNA for PCR reaction was standardized as 56 °C. Table S1 shows the PCR thermocycling conditions for RBD amplification and the amplified RBD band was observed at 669 bp (Fig. S1b). Following restriction digestion/ligation of RBD insert and pET28a+ plasmid, and subsequent transformation, the positive colony showing amplified RBD insert in Lane 5 of Fig. S1c upon colony PCR screening was selected. For further confirmation, the plasmid was isolated, restriction digested, and visualized on agarose gel along with RBD insert, pET28a+ plasmid, and digested pET28a+ plasmid as controls (Fig. S1d). An upward shift in the bands was observed between the positive colony (selected plasmid-Lane 5) and control pET28a+ plasmid (Lane 3). After digestion of the positive plasmid, two distinct bands were observed (Lane 6) in line with digested pET28a+ plasmid (Lane 4), and RBD insert (Lane 2) controls which confirmed successful cloning of RBD insert into pET28a+ plasmid for further transformation for expression.
3.2. Expression, purification and characterization of recombinant SARS CoV-2 RBD protein
The positive cloned plasmid was transformed into expression E. coli BL21(DE3) and the RBD protein was expressed by inducing isopropyl-D- thiogalactoside (IPTG), and purified using Ni2+ -NTA resin as shown in Fig. S2a. The expressed RBD protein was observed in the induced pellet at ∼31 kDa (Lane 2) on SDS-PAGE gel (Fig. S2b), and further in the supernatant (Lane 4) after denatured lysis, and centrifugation. After Ni2+-NTA column purification, the purified denatured RBD protein band was observed in the elutes (Lane 2 to 7) in Fig. S2c, which confirmed selective affinity purification of the RBD protein due to the attached His-tag. After renatured dialysis of the pooled elutes containing the RBD protein, the purified renatured RBD protein band (Lane 2) was observed at ∼31 kDa (Fig. S2d) which was confirmed by a single peak at 31.208 kDa in MALDI-TOF results (Fig. S2e).
3.3. Generation of RBD antibody, its characterization, and immunoassay development
Fig. 1a shows the schematic of polyclonal antibody generation with in-house purified RBD protein followed by antibody purification from the extracted rabbit serum collected using protein-A Sepharose column. The characteristic heavy (∼50 kDa) and light (∼25 kDa) chains of the purified Ab (Lane 2) due to denaturation by SDS were observed in SDS-PAGE (Fig. 1b), confirmed the purification of the RBD IgG antibody. Furthermore, the binding of in-house generated RBD Ab with RBD Ag transferred on PVDF membrane at ∼31 kDa was confirmed via Western blot (Fig. 1c). After each booster, the Ab titre in the rabbit serum was evaluated via binding ELISA (Fig. 1d) and the titre was observed to reduce at booster 5 at which point the experiment was terminated. Furthermore, the RBD Ab in the serum showed minimal cross reactivity with MERS Spike Ag in comparison with SARS-CoV-2 and no Ab titre was observed in pre-immune sera. 2.5 μg/ml RBD Ag for coating and 10 μg/ml RBD Ab was selected from the binding ELISA as the optimum concentrations required for competitive ELISA and the generated RBD Ab showed negligible binding with MERS Spike Ag (Fig. 1e). The limit of detection (LOD) for RBD Ag was determined as 0.30 ng/ml in the range 0.078 μg/ml to 19 pg/ml via competitive ELISA (Fig. 1f). The above study confirmed that the in-house developed RBD Ab is highly sensitive, and specific for SARS CoV-2 Spike Ag and can be used as a bioreceptor for fabrication of an immunosensor.
Fig. 1.

Purification and characterization of in-house SARS CoV-2 RBD Ab: (a) Schematic showing the stepwise procedure of immunization of purified RBD Ag to generate RBD Ab (The elements in the schematics are not to scale and for representational purpose only); (b) SDS-PAGE depicting the heavy (∼50 kDa) and light (∼25 kDa) chain bands of in-house developed RBD Ab; (c) Western blot of RBD Ab with its RBD Ag (∼31 kDa); (d) ELISA of booster doses of SARS CoV-2 RBD Ab at different boosters, pre-immune sera, and cross-reactivity with MERS Spike Ag; (e) Binding assay showing 2.5 μg/ml Ag and 10 μg/ml Ab as the optimum concentration for competitive ELISA further with negligible specificity for MERS Spike Ag; (f) Competitive ELISA of in-house developed RBD Ab showed an LOD of 0.30 ng/ml for RBD Ag of SARS CoV-2. (Error bars are very small and invisible at certain points as values were very close).
3.4. Conjugation of GNR with SARS CoV-2 RBD Ab and its characterization
Characterization of bare GNR and GNR-Ab bioconjugate was carried out to confirm the immobilization of RBD Ab on the surface of GNR primarily by physisorption mechanism as the Ab directly gets adsorbed onto the positively charged cetyl trimethyl ammonium bromide (CTAB) coated GNR (Xu et al., 2013). The red shift in UV–Vis spectra from 525 nm (GNR) to 530 nm (GNR-Ab) depicted in Fig. 2 a was due to the binding of RBD Ab around GNR which results in an increase in size and aggregation. The extra peak at 675 nm observed in bare GNR was because of a small number of gold nanotriangles synthesized laterally with GNR. Similarly, the increase in average hydrodynamic diameter was observed from 132 nm (bare GNR) (Fig. 2b–i) to 133 nm (GNR-Ab) (Fig. 2b–ii) which further confirmed increase in size upon conjugation of RBD Ab on the surface of GNR and the dual peaks correspond to the lateral and transverse lengths of GNR. Further morphology study of GNR and GNR-Ab conjugate via TEM, showed monodispersed GNR with an average size of 50 ± 5 nm (Fig. 2c–i), while in the case of GNR-Ab, a proteinaceous substance (RBD-Ab) was seen deposited on the GNR surface (Fig. 2c–ii). Topology and structural analysis of GNR (Fig. 2d–i) and GNR-Ab (Fig. 2d–ii) via AFM revealed increased signal intensity due to increase in surface roughness upon Ab modification of GNR surface, which further confirmed the bioconjugation.
Fig. 2.

Characterization of GNR and GNR/RBD Ab: (a) UV–Vis spectra showed red shift from 525 nm (GNR) to 530 (GNR/Ab); (b) Average hydrodynamic diameter increased from 132 nm (bare GNR) to 133 nm in GNR/Ab conjugate; (c) TEM: (i) monodispersed GNR with an average size of 50 ± 5 nm and (ii) a proteinaceous deposition of RBD Ab around the GNR; (d) AFM topological analysis of: (i) bare GNR surface (ii) RBD Ab conjugated with GNR.
3.5. Fabrication and optimization of FTO/GNR/RBD-Ab for RBD protein sensing
The fabricated bare electrode was coupled with GNR and RBD Ab for the detection of SARS CoV-2 RBD protein as displayed in the schematic Fig. 3 a. The mechanism of sensing and fabrication of the developed immunosensor was governed by GNR, which acted as a signal enhancer for amplification of the electrochemical output (Aamri et al., 2020). Addition of RBD Ag on the GNR/RBD Ab modified electrode (Fig. 3b) led to a change in electrical current by inducing variation in the redox potential of redox buffer. A major phenomenon that determines flow of electrons i.e. the orientation and polarity of protein molecules, played a critical role in electron transport from the electrode surface (Zhou and Pang, 2018). The developed immunosensor successfully combined the characteristics of the FTO electrode, GNR, and the highly specific immunological interaction between RBD Ab and target RBD Ag, which allowed a rapid and effective response. CV (Fig. 3c–i) and DPV (Fig. 3c–ii) were carried out to confirm each fabrication step of electrode. An increase in the signal was observed when GNR was coated onto bare electrode due to the conductive properties of GNR which increased electron transfer at the electrode surface along with an increase in the conductive surface area. Ab immobilization on GNR as well as further Ag capture stages resulted in current decrease due to protein masking effect by decrease in conductive surface area for electron transfer.
Fig. 3.

Fabrication of FTO electrode: (a) Electrode fabrication steps schematic; (b) Ag capture by fabricated electrode coupled with GNR-RBD-Ab schematic; (c-i and c-ii) CV and DPV of Bare, GNR coated electrode, RBD-Ab immobilized with electrode and interaction with Ag. (The elements in the schematics are not to scale and for representational purpose only).
For efficient analytical performance, various testing parameters for the modified GNR/RBD-Ab electrode were optimized. For optimum performance, 0.1 mg/ml GNR drop casted on the bare electrode (Fig. 4 a) gave highest current signal as observed in the inset bar graph of GNR concentration and peak current due to saturation of binding sites on the bare electrode surface.
Fig. 4.

Optimization of testing parameters for the fabricated FTO/GNR/RBD-Ab electrode: (a) DPV at different concentrations of GNR (0.02, 0.04, 0.06, 0.08, 0.1 mg/ml) with highest current output at 0.1 mg/ml (Inset: Bar graph of GNR concentration vs peak current); (b) DPV at various concentrations of RBD Ab (1.5, 1, 0.5, 0.25 μg/ml) immobilized with maximum current output at 1 μg/ml (Inset: Bar graph of Ab concentration vs peak current); (c) Variable temperatures (4 °C, RT, 37 °C, 45 °C) showed maximum current output at RT (25 °C) (Inset: Bar graph of temperature vs peak current); (d) Different pH (6, 6.5, 7, 7.5, 8) where pH 7.5 showed highest current output (Inset: Bar graph of pH vs peak current); (e) Scan rates ranging from A-0.01 to J-0.1 V/s showed increase in current output with increase in scan rate; (f) Linear regression of scan rate vs peak current.
Similarly, 1 μg/ml RBD Ab immobilized on GNR (Fig. 4b) resulted in maximum current output, since all binding sites on GNR were saturated beyond this concentration as shown in the inset bar graph of Ab concentration and peak current. For external environmental factor standardization, the electrodes were tested under different temperatures and pH. The most efficient signal was obtained at room temperature i.e., 25 °C (Fig. 4c) and pH 7.5 (Fig. 4d) as seen in the inset peak current bar graphs of both, which is ideal for physiological samples and at which the Ab activity is most efficient and Ab does not degrade. The scan rate tested in the range 0.01 V/s to 0.1 V/s (Fig. 4e) showed an increase in peak current with increasing scan rate which was confirmed by the plotted linear regression line (Fig. 4f) with a significant p-value <0.0001 and R2 = 0.9357. Hence, the optimized parameters selected for fabrication and testing of Ag on the developed electrode were 0.1 mg/ml GNR, 1 μg/ml RBD Ab, room temperature i.e., 25 °C, and pH 7.5.
3.6. Analytical performance of fabricated FTO/GNR/RBD-Ab immunosensor for detection of RBD Ag
The RBD Ag synthesis and testing on electrode has been elucidated in the schematic shown in Fig. 5 a and results were obtained within 30 s of sample addition. To test the analytical performance of the fabricated immunosensor the dynamic response was measured via DPV, as illustrated in Fig. 5b, where it was observed that with increasing Ag concentration (1 fM to 1 μM) in buffer, the current decreased since addition of a protein layer on the electrode increased protein masking effect that effectively reduced electron transfer from the reduced electrode conductive surface.
Fig. 5.

Analytical performance of fabricated FTO/GNR/RBD-Ab electrode: (a) Scheme displaying the RNA sample collection, RBD synthesis, and testing steps (The elements in the schematics are not to scale and for representational purpose only); (b) DPV showed decrease in current peak with increasing RBD Ag concentration in buffer (A-1 fM to J-1 μM); (c) Standard linear calibration curve of DPV spectra for Ag testing; (d) Specificity and cross reactivity studies against SARS-CoV-2 RBD Ag and MERS Spike Ag; (e) Storage stability of fabricated electrode tested over a period of 3 weeks at 7-day intervals; (f) Repeatability of individual electrodes tested up to 6 times.
The standard linear calibration curve for the same was plotted (Fig. 5c) using I/I0 = peak current/blank current vs log of Ag concentration, with a significant p-value <0.0001, slope = -0.02015, intercept = 0.7443 and R2 = 0.9888 using which the LOD was determined as 0.73 fM using the formula 3 (Sy/S), where signal/noise ratio = 3, Sy = standard deviation of the response and S = slope of the calibration curve. The LOD was found to be much more sensitive than the ELISA carried out earlier in Section 3.3. Furthermore, the developed GNR based electrochemical immunosensor showed more sensitivity and/or quicker response time as compared to other sensors developed for SARS CoV-2 diagnostics as can be observed in the comparative Table S2. Cross reactivity studies were performed to evaluate the non-specific binding of MERS Spike Ag with the fabricated electrode and a decrease in current was observed with SARS CoV-2 RBD Ag whereas no change was observed with MERS Spike Ag with respect to the blank electrode (Fig. 5d) when both Ags tested with a significant p-value <0.0001. This confirmed high specificity of RBD Ab towards SARS CoV-2 RBD antigen. Furthermore, the stability of FTO/GNR/RBD Ab fabricated electrode was observed on the 1st, 7th, 14th and 21st day of its fabrication while stored at 4 °C and the modified FTO/GNR/RBD-Ab electrode provided stable readings for 21 days (Fig. 5e) with a significant p-value <0.0001 when tested over a period of 3 weeks without any compromise in results as the Ab activity wasn't affected when stored as 4 °C. The repeatability parameter of each electrode was carried out by testing individual electrodes up to 6 times, and it was inferred that the modified FTO/GNR/RBD-Ab electrodes may be reused up to 5 times (Fig. 5f) with a significant p-value <0.0001, without any substantial changes in peak current as neither the GNR nor the Ab immobilized were affected upon regeneration of the electrode up to 5 times.
3.7. Detection and validation of SARS-CoV-2 Virus from clinical samples
The various stages involved in fabrication of the immunosensor for testing of heat-inactivated real COVID-19 patient samples (5 positive, 5 negative) is shown in Fig. 6 a. From the clinical sample results using the developed FTO electrode (Fig. 6b) with a significant p-value 0.0063, and compared with RT-PCR (Fig. 6c), it was observed that all the COVID-19 positive samples showed a negative peak current, due to decrease in current output upon addition of RBD present in SARS CoV-2 Spike protein present in the clinical samples.
Fig. 6.

Detection and validation of SARS CoV-2 virus from COVID-19 patient nasopharyngeal samples: (a) Schematic diagram showed the stepwise procedure for detection of SARS CoV-2 virus (The elements in the schematics are not to scale and for representational purpose only); (b,c) Comparison of response signal between negative and positive patient samples by fabricated sensor and RT-PCR; (d) Correlation table of the fabricated electrode and RT-PCR results of the COVID-19 patient samples.
However, 3/5 COVID-19 negative real samples showed a positive peak current due to absence of target RBD Ag whilst 2/5 showed a negative peak current which were determined as false positive results. This proves that whilst the fabricated electrode was able to clearly discriminate between infected and normal patient samples by detecting the targeted RBD of the Spike protein present on the surface of heat killed SARS CoV-2 and showed 100% results in the case of positive samples, in the case of negative samples it showed 60% results with 40% false positive results with respect to RT-PCR results (Fig. 6d). This may be either due to the background noise of other components present in the nasopharyngeal swab or very early stage of the infection where the titer level may have been too low to be detected via RT-PCR (Arevalo-Rodriguez et al., 2020; Kanji et al., 2021; Woloshin et al., 2020) resulting in false negative results but may have been detected by the developed sensor. In conclusion, the fabricated COVID-19 FTO sensor may be developed into a potential diagnostic candidate for rapid detection of SARS-CoV-2 virus from clinical samples without complicated sample processing steps.
4. Conclusion
In this work, we have successfully cloned and expressed SARS CoV-2 RBD Ag for the generation of SARS CoV-2 RBD Ab. The Ag and Ab were developed in-house and thoroughly characterized and validated by ELISA, Western blot and RT-PCR. The Ag and Ab were further used to fabricate FTO/GNR/RBDAb electrode for the early detection of SARS CoV-2 RBD Ag due to its high sensitivity with LOD of 0.73 fM in standard buffer that is highly sensitive for ultra-low-level detection of the virus. The fabricated electrode showed minimal cross reactivity with other MERS Ag, storage stability of 3 weeks and repeatability up to 5 times without affecting the sensor performance. Also, we have demonstrated the application of the immunosensor on COVID-19 patient samples for the detection of SARS CoV-2 RBD protein within 30 s and the clinical sample data was corroborated with RT-PCR data. Therefore, the developed FTO/GNR/RBD-Ab electrode could potentially be miniaturized as a robust platform for sensing of low concentrations of SARS CoV-2 that could aid in the initial rapid mass screening of COVID-19 infection in the population.
Author contribution statement
Sonu Gandhi: Conceptualization, Supervision, Visualization, Writing–original draft, review & editing, Funding acquisition, Project administration. G J Archana: Experimentation, Analysis. K Nagamani: Experimentation, Analysis. Deepshikha Shahdeo: Writing, Experimentation, Investigation, Analysis. Akanksha Roberts: Writing, Experimentation, Investigation, Analysis. Subhasis Mahari: Writing, Experimentation, Investigation, Analysis. Narlawar Sagar Shrikrishna: Writing, Data presentation.
Ethics approval
All cloning and biosafety work was carried out at National Institute of Animal Biotechnology (NIAB), Hyderabad after due approval from the Institutional Biosafety Committee (IBSC-IBSC/May2020/NIAB/SG-01). All animal experimentations were conducted at Small Animal Facility, NIAB, Hyderabad after due approval from the Institutional Animal Ethics Committee (IAEC-IAEC/2020/NIAB/04/SG). The COVID-19 patient sample related experiments were conducted at Gandhi hospital, Hyderabad, Telangana, India after due approval (IEC/GMC/2020/05/06).
Declaration of competing interest
The authors declare that they have no known competing financial interests or personal relationships that could have appeared to influence the work reported in this paper.
Acknowledgement
The authors would like to thank Dr. Jayant Hole for providing support during animal experimentation. S.G. is grateful for the research endowment under the Intensification of Research in High Priority Area (IRHPA) program from Science and Engineering Research Board, New Delhi (Grant Number IPA/2020/000069). A.R. would like to acknowledge DST-INSPIRE fellowship (IF180729) sponsored by the Department of Science and Technology (DST), New Delhi, S.M. would like to acknowledge CSIR Fellowship (09/1150(0013)/2019/EMR-I) provided by the Council of Scientific & Industrial Research, New Delhi. N.S.S would like to acknowledge Indian Council of Medical Research, New Delhi for Research fellowship (No: 3/1/3/JRF-2018/HRD (LS)).
Footnotes
Supplementary data to this article can be found online at https://doi.org/10.1016/j.bios.2022.114406.
Appendix A. Supplementary data
The following is the Supplementary data to this article:
References
- Aamri M. El, Yammouri G., Mohammadi H., Amine A., Korri-Youssoufi H. Biosens. 2020;10:186. doi: 10.3390/BIOS10110186. [DOI] [PMC free article] [PubMed] [Google Scholar]
- Ahirwar R., Gandhi S., Komal K., Dhaniya G., Tripathi P.P., Shingatgeri V.M., Kumar K., Sharma J.G., Kumar S. Biosci. Rep. 2021;41 doi: 10.1042/BSR20211238. BSR20211238. [DOI] [PMC free article] [PubMed] [Google Scholar]
- Alagiri M., Rameshkumar P., Pandikumar A. Microchim. Acta. 2017;184:3069–3092. doi: 10.1007/S00604-017-2418-6/FIGURES/2. [DOI] [Google Scholar]
- Arevalo-Rodriguez I., Buitrago-Garcia D., Simancas-Racines D., Zambrano-Achig P., Campo R. Del, Ciapponi A., Sued O., Martinez-García L., Rutjes A.W., Low N., Bossuyt P.M., Perez-Molina J.A., Zamora J. PLoS One. 2020;15 doi: 10.1371/JOURNAL.PONE.0242958. [DOI] [PMC free article] [PubMed] [Google Scholar]
- Azahar Ali M., Hu Chunshan, Jahan Sanjida, Yuan Bin, Sadeq Saleh M., Ju Enguo, Gao S.-J., Panat Rahul, Ali M.A., Hu C., Jahan S., Yuan B., Saleh M.S., Panat R., Ju E., Gao Cancer Virology Program S. Adv. Mater. 2021;33 doi: 10.1002/ADMA.202006647. [DOI] [PMC free article] [PubMed] [Google Scholar]
- Bai H., Cai X., Zhang X. OSF Preprints. 2020 doi: 10.31219/osf.io/6eagn. [DOI] [Google Scholar]
- Bakker E. Anal. Chem. 2004;76:3285–3298. doi: 10.1021/AC049580Z. [DOI] [PubMed] [Google Scholar]
- Dey J., Roberts A., Mahari S., Gandhi S., Tripathi P.P. Front. Bioeng. Biotechnol. 2022;10 doi: 10.3389/FBIOE.2022.873811. [DOI] [PMC free article] [PubMed] [Google Scholar]
- Ding X., Yin K., Li Z., Lalla R.V., Ballesteros E., Sfeir M.M., Liu C. Nat. Commun. 2020;11:4711. doi: 10.1038/s41467-020-18575-6. [DOI] [PMC free article] [PubMed] [Google Scholar]
- Haurum J.S. Drug Discov. Today. 2006;11:655–660. doi: 10.1016/J.DRUDIS.2006.05.009. [DOI] [PubMed] [Google Scholar]
- Kanji J.N., Zelyas N., MacDonald C., Pabbaraju K., Khan M.N., Prasad A., Hu J., Diggle M., Berenger B.M., Tipples G. Virol. J. 2021;18:13. doi: 10.1186/S12985-021-01489-0. [DOI] [PMC free article] [PubMed] [Google Scholar]
- Kaushik A.K., Dhau J.S., Gohel H., Mishra Y.K., Kateb B., Kim N.Y., Goswami D.Y. ACS Appl. Bio Mater. 2020;3:7306–7325. doi: 10.1021/ACSABM.0C01004. [DOI] [PubMed] [Google Scholar]
- Kerry R.G., Malik S., Redda Y.T., Sahoo S., Patra J.K., Majhi S. Nanomed. Nanotechnol. Biol. Med. 2019;18:196–220. doi: 10.1016/j.nano.2019.03.004. [DOI] [PMC free article] [PubMed] [Google Scholar]
- Kesarwani V., Gupta R., Vetukuri R.R., Kushwaha S.K., Gandhi S. Front. Immunol. 2021;12 doi: 10.3389/fimmu.2021.725240. [DOI] [PMC free article] [PubMed] [Google Scholar]
- Lan J., Ge J., Yu J., Shan S., Zhou H., Fan S., Zhang Q., Shi X., Wang Q., Zhang L., Wang X. Nat. 2020;581:215–220. doi: 10.1038/s41586-020-2180-5. [DOI] [PubMed] [Google Scholar]
- Mahari S., Gandhi S. Bioelectrochemistry. 2022;144 doi: 10.1016/J.BIOELECHEM.2021.108036. [DOI] [PubMed] [Google Scholar]
- Manas Das C., Guo Yan, Yang Guang, Kang Lixing, Xu Gaixia, Ho H.-P., Yong K.-T., Das C.M., Yang G., Kang L., Yong K., Guo Y., Xu G., Ho H. Adv. Theory Simulations. 2020;3 doi: 10.1002/ADTS.202000185. [DOI] [PMC free article] [PubMed] [Google Scholar]
- Mishra P., Banga I., Tyagi R., Munjal T., Goel A., Capalash N., Sharma P., Suri C.R., Gandhi S. RSC Adv. 2018;8:23163–23170. doi: 10.1039/C8RA02018C. [DOI] [PMC free article] [PubMed] [Google Scholar]
- Nandi S., Mondal A., Roberts A., Gandhi S. Advances in Clinical Chemistry. Elsevier B.V.; 2020. Biosensor platforms for rapid HIV detection; pp. 1–34. [DOI] [PubMed] [Google Scholar]
- Narlawar S.S., Gandhi S. Mater. Today Adv. 2021;12 doi: 10.1016/J.MTADV.2021.100174. [DOI] [Google Scholar]
- Palmer I., Wingfield P.T. Curr. Protein Pept. Sci. 2004 doi: 10.1002/0471140864.PS0603S38. [DOI] [Google Scholar]
- Pingarrón J.M., Yáñez-Sedeño P., González-Cortés A. Electrochim. Acta. 2008;53:5848–5866. doi: 10.1016/j.electacta.2008.03.005. [DOI] [Google Scholar]
- Roberts A., Chauhan N., Islam S., Mahari S., Ghawri B., Gandham R.K., Majumdar S.S., Ghosh A., Gandhi S. Sci. Rep. 2020;10:1–12. doi: 10.1038/s41598-020-71591-w. [DOI] [PMC free article] [PubMed] [Google Scholar]
- Roberts A., Chouhan R.S., Shahdeo D., Shrikrishna N.S., Kesarwani V., Horvat M., Gandhi S. Front. Immunol. 2021:5316. doi: 10.3389/FIMMU.2021.732756. 0. [DOI] [PMC free article] [PubMed] [Google Scholar]
- Roberts A., Gandhi S. Front. Biosci. - Landmark. 2020;25:1872–1890. doi: 10.2741/4882. [DOI] [PubMed] [Google Scholar]
- Roberts A., Kesarwani V., Gupta R., Gandhi S. Biosens. Bioelectron. 2022;198 doi: 10.1016/J.BIOS.2021.113837. [DOI] [PubMed] [Google Scholar]
- Roberts A., Mahari S., Shahdeo D., Gandhi S. Anal. Chim. Acta. 2021;1188 doi: 10.1016/J.ACA.2021.339207. [DOI] [PMC free article] [PubMed] [Google Scholar]
- Roberts A., Tripathi P.P., Gandhi S. Biosens. Bioelectron. 2019;141:111398. doi: 10.1016/J.BIOS.2019.111398. [DOI] [PubMed] [Google Scholar]
- Seo G., Lee G., Kim M.J., Baek S.-H., Choi M., Ku K.B., Lee C.-S., Jun S., Park D., Kim H.G., Kim S.-J., Lee J.-O., Kim B.T., Park E.C., Kim S. Il. ACS Nano. 2020;14:5135–5142. doi: 10.1021/acsnano.0c02823. [DOI] [PubMed] [Google Scholar]
- Shahdeo D., Gandhi S. Biosensor Based Advanced Cancer Diagnostics. Elsevier B.V.; 2022. Next generation biosensors as a cancer diagnostic tool; pp. 179–196. [DOI] [Google Scholar]
- Shahdeo D., Roberts A., Abbineni N., Gandhi S. Comprehensive Analytical Chemistry. Elsevier B.V.; 2020. Graphene based sensors; pp. 175–199. [DOI] [Google Scholar]
- Sheikhzadeh E., Eissa S., Ismail A., Zourob M. Talanta. 2020;220 doi: 10.1016/j.talanta.2020.121392. [DOI] [PMC free article] [PubMed] [Google Scholar]
- Shukla S., Haldorai Y., Khan I., Kang S.M., Kwak C.H., Gandhi S., Bajpai V.K., Huh Y.S., Han Y.K. Mater. Sci. Eng. C. 2020;113 doi: 10.1016/j.msec.2020.110916. [DOI] [PubMed] [Google Scholar]
- Singh A., Upadhyay V., Upadhyay A.K., Singh S.M., Panda A.K. Microb. Cell Factories. 2015;14:1–10. doi: 10.1186/S12934-015-0222-8. [DOI] [PMC free article] [PubMed] [Google Scholar]
- Talan A., Mishra A., Eremin S.A., Narang J., Kumar A., Gandhi S. Biosens. Bioelectron. 2018;105:14–21. doi: 10.1016/j.bios.2018.01.013. [DOI] [PubMed] [Google Scholar]
- Woloshin S., Patel N., Kesselheim A.S. N. Engl. J. Med. 2020;383:e38. doi: 10.1056/NEJMP2015897. [DOI] [PubMed] [Google Scholar]
- Xu L., Li D., Ramadan S., Li Y., Klein N. Biosens. Bioelectron. 2020;170 doi: 10.1016/j.bios.2020.112673. [DOI] [PMC free article] [PubMed] [Google Scholar]
- Xu X., Liu X., Li Y., Ying Y. Biosens. Bioelectron. 2013;47:361–367. doi: 10.1016/j.bios.2013.03.048. [DOI] [PubMed] [Google Scholar]
- Zhao H., Liu F., Xie W., Zhou T.C., OuYang J., Jin L., Li H., Zhao C.Y., Zhang L., Wei J., Zhang Y.P., Li C.P. Sensor. Actuator. B Chem. 2021;327 doi: 10.1016/J.SNB.2020.128899. [DOI] [PMC free article] [PubMed] [Google Scholar]
- Zhou H.-X., Pang X. Chem. Rev. 2018;118:1691–1741. doi: 10.1021/ACS.CHEMREV.7B00305. [DOI] [PMC free article] [PubMed] [Google Scholar]
Associated Data
This section collects any data citations, data availability statements, or supplementary materials included in this article.