

Abstract
The present review discusses the current status and difficulties of the analytical methods used to evaluate size and surface modifications of nanoparticle-based pharmaceutical products (NPs) such as liposomal drugs and new SARS-CoV-2 vaccines. We identified the challenges in the development of methods for (1) measurement of a wide range of solid-state NPs, (2) evaluation of the sizes of polydisperse NPs, and (3) measurement of non-spherical NPs. Although a few methods have been established to analyze surface modifications of NPs, the feasibility of their application to NPs is unknown. The present review also examined the trends in standardization required to validate the size and surface measurements of NPs. It was determined that there is a lack of available reference materials and it is difficult to select appropriate ones for modified NP surface characterization. Research and development are in progress on innovative surface-modified NP-based cancer and gene therapies targeting cells, tissues, and organs. Next-generation nanomedicine should compile studies on the practice and standardization of the measurement methods for NPs to design surface modifications and ensure the quality of NPs.
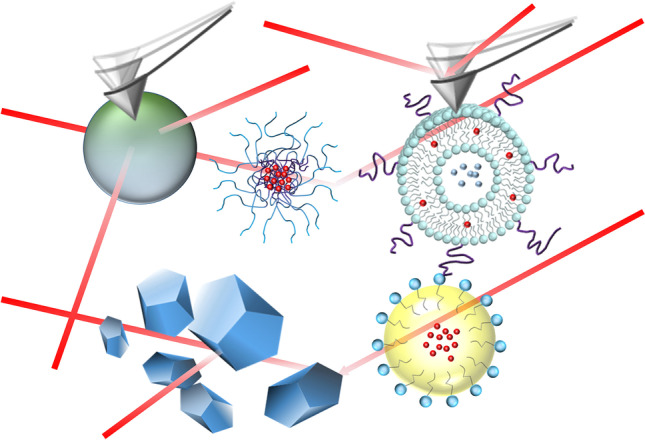
Graphical Abstract
KEY WORDS: nanoparticle, size, surface chemistry, nanomedicine, standardization
INTRODUCTION
Physicochemical properties of nanoparticle-based pharmaceutical products (NPs), such as liposomal drugs and new SARS-CoV-2 vaccines, are vital for their clinical performance (1, 2). Thus, the development and standardization of methods evaluating the quality of NPs are crucial in research and development. Pharmacopoeias, administrative and standardization documents issued by regulatory and harmonization bodies are useful tools. Although the advantages and utility of various methods for evaluating the characteristics of NPs have been extensively reported, there is a paucity of literature discussing the current status and challenges associated with these evaluation methods. It is, therefore, important to summarize the present situation to clarify the advantages and disadvantages of various NP evaluation methods and identify specific issues (3–7). The present review analyzes methods for evaluating NP size and surface modification, in which these physicochemical properties critically affect efficacy- and safety-related drug dissolution behavior and pharmacokinetics (2). This review also explores the current status and challenges associated with the analytical methods used to evaluate these properties.
METHODS
Target NPs
This review examined the applicability and usefulness of evaluation methods pertaining to representative NPs under clinical development, those marketed to date, and those submitted for approval by the US Food and Drug Administration (FDA) between 2010 and 2015 (8–11). The target products were liposomes, nanocrystals derived from small-molecule active pharmaceutical ingredients (APIs), and lipid, polymeric, and inorganic metal/metal oxide NPs. We discussed the applicability of the various evaluation methods to each material.
Data Collection
Information on the various evaluation methods was collected from Google, Google Scholar, and MEDLINE (US National Library of Medicine) using the search terms “nanoparticle AND size” and “nanoparticle AND modified surface OR surface chemistry.” The results of this search are summarized in Tables I and II using the research from published books (12–14); academic papers in the references; websites of international standardization organizations, including the International Organization for Standardization (ISO), the American Society for Testing and Materials (ASTM) International, the International Committee for Standardization (CEN), the International Electrotechnical Commission (IEC); and companies supplying analytical and fabrication equipment. Based on the organized information, the current status and issues related to NP “size” and “modified surface” analytical methods were extracted and discussed.
Table I.
Principles, Advantages, and Disadvantages of Size Evaluation Methods
| Method | Principle | Advantage | Disadvantage | References |
|---|---|---|---|---|
| Direct method (visualizes/observes individual particles and obtains the number-particle size distribution by microscopic image analysis) | ||||
| Electron microscopy (EM) | Gives an image with contrast based on the intensity of the scattered/transmitted electron beam |
–Visualizes nanoparticles at sub-nanometer resolution –Measures the number-particle size distribution |
–Complicated instrument and sample operations –The sample must be frozen or dried –Low throughput –Expensive to install and high maintenance costs |
(12–14, 16, 17, 19, 20) |
| Atomic force microscopy (AFM) | Gives an image with contrast based on the height of sample surface traced with a nanosized probe |
–Visualizes nanoparticles at nanometer resolution –Applicable in both air and liquid –Measures the number-particle size distribution –Easy to install compared to EM |
–Sample dilution and particle immobilization –Low throughput |
(12, 13, 103) |
| Indirect method (measures physical quantities related to particle size and deduces the particle size distribution by theoretical analysis) | ||||
| Light scattering method | ||||
| Small-angle X-ray scattering (SAXS) | Analyzes the angular dependence of the X-ray intensity scattered from particles at small angles (generally less than 10°) |
–Applicable in both air and liquid –Applicable to samples with a smaller particle size distribution ranging from 1 nm to ~ 200 nm –Can give information on morphology/structure of the subject –Applicable to a wide range of materials, including powders, gels, liquids, suspensions, crystals, and amorphous materials –Does not require sample dilution –Can measure highly viscous solutions that do not exhibit Brownian motion, which is required for DLS |
–Sample preparation and the theoretical model for size measurement must be validated –Expensive to install, and accurate measurements usually require a large synchrotron radiation system –Particles larger than 200 nm are difficult to analyze –Difficult to apply to polydisperse samples |
(13, 24–27) |
| Laser diffraction method (LD) | Analyzes the diffraction pattern of laser scattered from the particles |
–As it measures the angular dependence of scattering intensity, it is less susceptible to artifacts caused by the presence of large particles than DLS –Can detect a wide range of particle sizes (~ 150 nm to 20 µm) in a single measurement –Applicable in both air and liquid |
–Sample dilution –Requires complex algorithms –Requires the refractive index of the particle –Difficult to measure particles of less than ~ 150 nm –Requires a large amount of sample volume –Difficult to apply to polydisperse samples |
(16, 41–44) |
| Dynamic light scattering (DLS) | Analyzes the time decay of the intensity of scattered light from particles |
–Convenient: the measurement can be done in a few minutes and shows good reproducibility for monodisperse samples –Gives information on the polydispersity of the sample: polydispersity index (PDI) < 0.1, monodisperse; 0.1 < PDI < 0.4, moderately polydisperse; 0.4 < PDI, polydisperse |
–Sample dilution in liquid –The strong scattering light from large particles makes it difficult to observe the scattering light from small particles, biasing the size distribution –Difficult to apply to polydisperse samples |
(12, 13, 18–20, 35) |
| Multi-angle light scattering (MALS) | Analyzes the intensities at multi angles of scattered light from particles |
–Can determine the mass-averaged root mean square radius from 10 nm to several hundred nanometers of macromolecular colloids such as polymers –Combined use with FFF and DLS allows accurate size measurement, and is even applicable to polydisperse samples –The shape of nanoparticles is reflected in the MALS measurement |
–Single use of MALS is typically difficult to measure the size of molecular assemblies such as liposomes and micelles –Sample dilution in liquid |
(13, 18, 19, 23, 40) |
| MALS-DLS combined with Field-flow fractionation (FFF) | Separates nanoparticles by size, while controlling the hydrodynamic force field and laminar flow, followed by MALS-DLS measurement |
–Applicable to a wide size range from several nm to several µm –No stationary phase, less affecting particle separation –Could be an alternative to SEC-MALS size measurement, when nanoparticles are not eluted or disintegrate during SEC elution –Performs accurate size measurement, and is even applicable to polydisperse samples |
–Requires complicated condition settings, such as injection sample concentration, dispersing solvent, flow rate, cross flow rate, channel selection –The nanoparticles could interact with the FFF channel wall –Sample dilution in liquid |
(13, 18, 19, 39, 47–52) |
| MALS or MALS-DLS combined with size-exclusion chromatography/gel (filtration) chromatography (SEC) | Separates nanoparticles by size through interaction with a carrier, such as a gel packed in a column, followed by MALS or MALS-DLS measurement | –Performs accurate size measurement of macromolecular colloids, such as polymers |
–The separation size range of nanoparticles is limited by the choice of carrier –Nanoparticles may not be eluted or may disintegrate during elution due to interaction with the carrier/gel in the column |
(23, 38) |
| Nanoparticle tracking analysis (NTA) | Analyzes the Brownian motion of individual particles in a liquid by tracking scattered light |
–Conveniently measures the number-particle size distribution –Applicable to polydisperse samples |
–Sample dilution in liquid –For particles with a refractive index similar to that of the medium, detection may not be possible (e.g., silica nanoparticles of 50 nm are difficult to detect) –Could bias the size distribution as DLS does |
(12–14, 19, 20) |
| Other method | ||||
| Analytical centrifugation: analytical ultracentrifugation/differential centrifugal sedimentation/disk centrifugation |
–The ultracentrifugation analyzes a sedimentation profile of the particles when a constant centrifugal force is applied –The differential or disk centrifugation analyzes a sedimentation profile of the particles in a solvent typically loaded with a sucrose solution |
–Applicable to a wide size range from ~ 2 nm to ~ 40 µm –Performs accurate particle size measurement as well as the Coulter counter method –Applicable to polydisperse samples |
–Requires the refractive index and density of the particle –Low throughput (typically more than 30 min/run) |
(13, 19, 20, 53–55) |
| Acoustic spectroscopy/ultrasound attenuation spectroscopy | The attenuation of the ultrasonic waves irradiated on the sample is analyzed to obtain the particle size distribution |
–Does not require sample dilution (a particle volume concentration of about 50% can be measured) –Applicable to a wide size range from ~ 5 nm to ~ 1000 µm –Applicable to colored samples that are difficult to measure by light scattering methods, including DLS –Not sensitive to biased light scattering and multiple scattering |
–Requires a large amount of sample volume –Requires parameters, such as thermal expansion coefficient, heat capacity, and thermal conductivity, of particles |
(13, 28) |
| Coulter counter method/electrical sensing zone method/tunable resistive pulse sensing | Analyzes an electrical resistance pulse generated each time an individual nanoparticle passes through the detection electrode hole |
–Measures the number-particle size distribution –Applicable to polydisperse samples –High accuracy and precision |
–The nanoparticles need to be dispersed in an electrolyte solution –The electrode pores of the detection unit are delicate, and handling is complicated –Necessary to select aperture diameters in the restricted size range (e.g., Izon Science's NP80 aperture detects from 40 to 230 nm) |
(12, 13, 16, 19, 20, 36) |
| Resonant mass measurement/suspended microchannel resonator/resonant mass spectrometry | Monitors the number and amount of the resonant frequency changes of a cantilever with a built-in microfluidic channel that occur when particles pass through the channel |
–Measures the number-particle size distribution –Conveniently distinguishes agglomerated particles and foreign particles generated in nano pharmaceutical formulations –The required sample volume is small (approximately 150 nL) |
–The detectable particle size is more than ~ 150 nm –The sampling size (particles counted) is small, which may bias the size distribution –Particle density is required for size determination |
(41, 72) |
| Focused beam reflectance measurement/convergent beam reflection measurement |
–Monitors the beam reflectance at a certain focal point and analyzes the duration and number of times –The reflectance decreases according to the size of the particle as it passes through |
–Measures the number-particle size distribution –Can distinguish agglomerated particles and foreign particles in nanopharmaceutical preparations –Can be performed with a highly flexible handy-type measurement probe and monitors the status of particle manufacturing processes |
–The detectable particle size is more than ~ 500 nm –Measurement parameters, such as the contact angle of the probe, the stirring speed, and the scanning speed of the beam, affect the results –Large variation in the conversion process from the duration of the beam reflectance to the size |
(69) |
Table II.
Principles, Advantages, and Disadvantages of Evaluation Methods for Surface Chemistries
| Method | Principle | Advantage | Disadvantage | References |
|---|---|---|---|---|
| Direct method (the obtained information is in principle about the surface of the particle) | ||||
| Cryo-electron microscopy (cryo-EM) |
–The sample is frozen for EM observation –To visualize the surface-modified polymer of the nanoparticles, cesium ions with high atomic mass are added to contrast the polymer chains and the solvent environment |
–Directly visualizes the surface structure of nanoparticles modified with polyelectrolytes, at sub-nanometer resolution |
–Requires addition of cesium to contrast polyelectrolytes with the core nanoparticle –Expected to be limited to only the surfaces modified with polyelectrolytes: polymer chains without dissociating groups, such as PEG chains, have not been reported –The same points as described in the EM section of Table I |
(14, 97, 98) |
| Tip-enhanced Raman spectroscopy (TERS) | Analyzes tip-enhanced Raman spectra of the surface of a nanoparticle, while simultaneously observing the nanoparticle by AFM |
–Obtains Raman spectra for the modified surface of each particle at a lateral resolution of several nanometers –The same points as described in the AFM section of Table I |
–The substrate for particle immobilization is limited to a transparent substrate, such as glass, in order to irradiate excitation light for Raman scattering from underneath the sample –Emerging method; the application to nanoparticles has not been well established –The same points as described in the AFM section of Table I |
(81–84, 96) |
| X-ray photoelectron spectroscopy (XPS) | Analyzes the distribution of atoms of the sample surface in a depth region of ~ 1–5 nm by measuring the kinetic energy of photoelectrons emitted from atoms of the sample irradiated by X-ray |
–Detects almost all atoms (except for hydrogen and helium) constituting the sample surface –The electronic state of the detected atoms is reflected in the measured photoelectron energy; additional information such as the oxidation state can be determined –In comparison with AES, the irradiated X-rays are less damaging to the sample due to the lower energy of the X-rays |
–Must be performed in a dry state in a high vacuum: application is typically limited to metallic nanoparticles –The solvent must be salt-free before sample drying –Requires particle immobilization on a flat solid substrate –Complicated sample preparation –Difficult to distinguish the sample carbon from contaminated carbon compound –Synchrotron radiation is basically necessary for high resolution –Low lateral resolution (~ 10 µm); a model and its validity for quantitative analysis must be established –When the nanoparticle is an insulator, charge-up occurs during measurement, and reproducibility is poor |
(13, 75, 76, 78) |
| Auger electron spectroscopy (AES) | Analyzes the distribution of atoms on the sample surface in a depth region of ~ 1–10 nm by measuring the kinetic energy of Auger electrons emitted from the sample irradiated with a beam of electrons |
–Lateral resolution is ~ 10 nm, higher resolution than XPS –Detects almost all atoms (except for hydrogen and helium) constituting the sample surface ––The electronic state of the detected atoms is reflected in the measured photoelectron energy; additional information such as the oxidation state can be determined –Combined use with EM simultaneously visualizes the sample surface at a three-dimensional resolution of 10 nm × 10 nm × 10 nm |
–The same points as described in the XPS section of Table II –The energy of the irradiated electron beam is typically high: damage to the sample is large compared with XPS –The resolution in the surface depth direction is lower than that of XPS –a model and its validity for quantitative analysis must be established |
(13, 77, 79) |
| Time-of-flight secondary ion mass spectrometry (TOF–SIMS) |
–Molecular ions (called secondary ions) are generated by irradiating the sample with an ion beam –Measures the secondary ions from the sample surface with a TOF mass spectrometer to obtain information on the distribution of molecules on the sample surface |
–The measured secondary ions originate from the sample surface in a depth region of angstrom to 5 nm –Compared to XPS and AES, it can measure closer to the surface of the sample –The information obtained is more direct and easier to interpret than that by XPS and AES –The distribution of molecules on the particle surface could be obtained while scanning in the depth direction |
–Must be performed in a dry state in a high vacuum: application is typically limited to metallic nanoparticles –Requires particle immobilization on a flat solid substrate –The solvent must be salt-free before sample drying –The amount of secondary ions emitted depends on the matrix of the sample (matrix effect), making quantitative analysis complicated –Low lateral resolution (~ 50 nm) |
(13, 76, 80) |
| Indirect method (the obtained information is about the whole particle or particle population) | ||||
| Spectroscopic method | ||||
| Atomic force microscopy-infrared spectroscopy (AFM-IR) | –Obtains IR spectra of the sample surface while performing AFM observation |
–Can obtain IR spectra for individual nanoparticles with a lateral resolution of ~ 10 nm –The spectral matches provide chemical information about the identity and consistency of the nanoparticle |
–The same points as described in the AFM section of Table I –The choice of solid substrates is limited to a few materials to improve sensitivity –Low sensitivity –Emerging method; the application to nanoparticles has not been well established |
(94–96) |
| Circular dichroism spectroscopy (CD) | Analyzes the circular dichroism reflecting the conformation of optically active molecules |
–Might obtain the conformational information of modified surface molecules of nanoparticles –Applicable to liquid samples –Measurement is convenient |
–The target molecule must be optically active –Low sensitivity; a synchrotron radiation source is even required for conformation analysis of proteins bound to the surface of gold nanoparticles where the sensitivity is enhanced by localized surface plasmons –Light scattering by the nanoparticles distorts the spectra –Difficult to perform quantitative analysis |
(14, 85, 88, 89) |
| Raman spectroscopy | Analyzes Raman scattering light spectra reflecting the molecular structure of the target |
–Provides information on the covalent bonds and intermolecular interactions of the molecules –For gold nanoparticles where surface-enhanced Raman scattering occurs, the surface binding or modified functional groups of molecules might be analyzed –Unlike IR, the presence of water or carbon dioxide does not affect the Raman spectra –Measurement is convenient |
–Low sensitivity –Difficult to perform quantitative analysis |
(12, 13, 89) |
| Infrared spectroscopy (IR) | Analyzes infrared absorption spectra reflecting the molecular structure of the target |
–Provides information on the covalent bonds and intermolecular interactions of the molecules –Measurement is convenient |
–Low sensitivity –Difficult to perform quantitative analysis –Measurement in a water environment is usually impossible; sample drying or use of deuterium oxide is necessary |
(12–14, 89) |
| Other method | ||||
| Small-angle X-ray scattering (SAXS) |
–The principle is the same as the description in the SAXS section of Table I –By analyzing SAXS spectra for the nanoparticles before and after surface modification, the thickness of the modified surface of the nanoparticles is estimated |
–May obtain structural information on modified surfaces at a resolution of nanometers, e.g., the thickness values for polyethylene glycol molecular layers modifying the liposome surface have been reported –The same points as described in the SAXS section of Table I |
–The same points as described in the SAXS section of Table I –Must validate the analytical model –The measurement parameters are complex |
(25, 86, 87) |
| Electroacoustic spectroscopy/Colloid vibration current | By analyzing the pressure difference caused by the colloidal oscillating current or the electric sonic amplification, the electric potential (zeta potential) at the hydrodynamic contact surface between the particle and the solvent is calculated |
–May use the zeta potential to estimate the surface modification with charged molecules –Applicable to a dense sample where particle–particle interactions are significant (may not require sample dilution) |
–Not applicable to dilute systems where the interaction between particles is negligible –Requires the density of the particle –Must validate the calculation/model for the measurement |
(13) |
| Electrophoretic light scattering/laser Doppler electrophoresis/phase analysis light scattering/light scattering electrophoresis | Analyzes the change in the frequency/phase of light scattered by particles under electrophoresis, and the zeta potential is calculated |
–May use the zeta potential to estimate the surface modification with charged molecules –Applicable to a diluted system where the interaction between particles is negligible –Measurement is convenient |
–Not applicable to a dense sample where particle–particle interactions are significant –Must validate the calculation/model for the measurement –Difficult to obtain an accurate zeta potential when the relaxation effect is significant, e.g., the solvent contains no electrolytes –The measurement error is empirically large due to low sensitivity |
(12–14, 19, 35) |
Characterization of Analytical Methods
It was judged whether each analytical method could be readily applied to manufactured NPs. These materials are often developed and administered based on the drug delivery system concept. Thus, it was also necessary to determine whether each evaluation method could be used under experimental conditions simulating the physiological environments to which the NPs would be exposed or targeted.
Assessment of the Degree of Dissemination of Analytical Methods
The next step was to establish whether the degree of dissemination of each analytical method was based on its properties and performance at evaluating NP size and surface modification. This metric was determined using a scatterplot of the number of publications related to a method versus the first year when it was reported. The literature registered in MEDLINE was used for this purpose. The degree of penetration (publications/year) of each analytical method was also determined using the average annual number of registered articles as an indicator.
EVALUATION OF SIZE
Size Measurement Methods
For a systematic examination of the current status and issues of size evaluation methods, we categorized the techniques of obtaining particle size distributions. The analysis of directly observed images of individual particles was called the “direct method.” Obtaining a particle size distribution by measuring particle sizes based on a theory or model was referred to as the “indirect method.” The indirect method was subdivided into “light scattering method” or “other method” based on the method principle for better readability. The principles, advantages, and disadvantages of each approach are summarized in Table I.
Challenges of the Direct Method
Approaches and definitions vary among regulatory authorities. In all cases, however, the NP size is at minimum within the range of 1–1,000 nm (15). The “number-particle size distribution” is the ideal metric obtained using size evaluation methods. It is derived by observing the morphology and measuring the size of each particle within a sample. In this case, the direct method is best for evaluation. Electron microscopy (EM) and atomic force microscopy (AFM) are direct methods applicable to nanopharmaceutical preparations and both are suitable for the foregoing NP size range (Fig. 1). However, the sample sizes required to obtain statistically meaningful results increase from a few hundred to nearly 10,000,000 for narrow and wide size distributions, respectively (16). Moreover, the direct method requires cumbersome and technically difficult manipulations such as freezing and immobilization, which may also alter the sample structure (Fig. 1). Therefore, it is impractical to rely on the direct method alone for NP quality evaluations especially when the objective of the test is to determine whether a batch or lot is fit for shipment. Automation of the instrumental analysis is necessary to ensure that sample preparation, particle observation, and image analyses are conducted consistently. The computer-aided automation process must be understood and validated by comparison with the manual analysis. For example, the recognition and measured sizes of particles are influenced by parameter settings, such as signal threshold and pixel counting, for automated image analysis (17).
Fig. 1.

Size ranges and evaluation methods for nanoparticle-based pharmaceutical products
General Consideration of the Indirect Method
In principle, the indirect method is simple to implement and can sample statistically sufficient particles to determine the particle size distribution. Except for the nanoparticle tracking (NTA) and the Coulter counter methods, however, the indirect method theoretically calculates the particle size distribution according to a physical quantity derived from a group of particles (18, 19). Unlike the direct method, the indirect method does not identify individual particles within a sample. In actual practice, it provides no real number size distribution data. The NTA and Coulter counter methods measure physical quantities derived from individual particles and convert the data into number size distributions. Nevertheless, they do not directly measure particle sizes (20). Therefore, the NP development stage should validate particle size distributions measured using the indirect method by comparing their results against those determined by the direct method (21). Hence, the indirect method may be applied in routine quality evaluations for manufacturing and shipping purposes (22).
The flowchart in Fig. 2 furnishes guidance for the selection of the appropriate indirect method. Currently available indirect methods (Fig. 1) are readily applicable to “liquid type” NPs such as liposomes encapsulating anticancer drugs. In this case, the sample particles are diluted with a suitable dispersant to bring the NP concentration into a detectable range without generating excessive signals (23). Small-angle X-ray scattering (SAXS) and acoustic spectroscopy can be applied without sample dilution. SAXS requires a powerful X-ray source such as accelerated synchrotron radiation. This approach is inconvenient as the armamentarium required has limited accessibility. In addition, SAXS is restricted to NP sizes less than ~ 200 nm in diameter (24–26). Certain newer SAXS instruments may be used on a laboratory scale with a smaller X-ray source. However, this power reduction may also be accompanied by decreases in applicable particle size range and sensitivity. Therefore, further research on the utility of these devices is required (27). Acoustic spectroscopy requires parameters such as the particle thermal expansion coefficient, heat capacity, and thermal conductivity to determine the particle size distribution. As the foregoing parameters are difficult to measure empirically, this method is impractical for NPs (28).
Fig. 2.

Size evaluation method selection based on dosage form, size distribution, and dispersibility of nanoparticle-based pharmaceutical products. AFM, atomic force microscopy; DLS, dynamic light scattering; EM, electron microscopy; FFF, field flow fractionation; LD, laser diffraction; MALS, multi-angle light scattering; NTA, nanoparticle tracking analysis; SAXS, small-angle X-ray scattering; SEC, size-exclusion chromatography
Several considerations are necessary to measure “solid type (solid formulation)” NPs. For example, indirect methods cannot be used for in situ measurements of the sizes of API nanocrystals in tablets. Consequently, the tablets must first be pulverized, and the powder must then be analyzed by dynamic light scattering (DLS) or laser diffraction (LD) (29). An alternative approach is to measure the API crystals by LD and use the measurements to infer the sizes of the nanocrystals in the tablets (27, 30).
It is, therefore, necessary to develop an indirect method that measures NPs in their final fabricated form without any sample manipulation, such as dilution or pulverization. As sample manipulation is inevitable using the currently available technology, dilution factors, size distributions, and all other measurement conditions must be reported. The US FDA researchers recommend to report the X% cumulative size value DX, such as D10, D50, and D90 rather than the mean. Alternatively, the polydispersity indices or particle size histograms obtained from DLS measurements may be presented. Histograms and other plots are required to report particle size distributions (10). For example, according to the assessments by the Japanese and European regulatory bodies (MHLW and EMA), DLS is used for the SARS-CoV-2 vaccine lipid nanoparticles (Comirnaty and COVID-19 Vaccine Moderna), the size and polydispersity of which are set as one of critical quality attributes (31–34).
Issues Regarding NP Size Assessments Using Indirect Methods
We investigated indirect methods while considering actual measurement situations. DLS measures NP samples in the detectable size range of at least ~ 10 nm. The adoption of DLS as a size estimation method could be promoted as it is listed in the USP and JP general information. In principle, the light-scattering intensity measured by DLS is proportional to the sixth power of the particle size. For this reason, the reliability of DLS in measuring polydisperse samples could be unacceptably low (20, 35–37). According to DLS instrument manufacturers, a sample is monodisperse if its polydispersity index (PDI) is less than 0.1, moderately polydisperse if its PDI is 0.1–0.4, and polydisperse if its PDI is greater than 0.4. For NPs with PDI greater than 0.4, it may be necessary to use the direct method to evaluate their particle size distribution. It was reported that the actual particle size distribution is polydisperse even when the PDI is less than 0.2, which is usually judged as monodisperse (18, 19). The challenges of evaluating the particle size distribution of polydisperse samples are discussed in the following section.
The Coulter counter method is used when the particle size distributions are in ranges that fit within specific commercially available aperture diameter ranges such as 40–300 nm or 125–900 nm. These often apply to refined liquids. The Coulter counter method can accurately assess NPs (36). However, they must first be dispersed in ~ 25–100 mM electrolyte solution, which could facilitate the aggregation/agglomeration of NPs. Hence, the sample preparation conditions for the Coulter counter method are more stringent than the simple dilution required to prepare DLS samples.
Multi-angle light scattering (MALS) can estimate the particle sizes of polymeric drugs with molecular colloid dimensions (38). Integration of DLS particle size information into MALS data may reveal particle morphology and the number of molecular aggregates (39). However, it is difficult to perform accurate analyses of MALS on NPs that are molecular assemblies, such as liposomes and micelles, because application of the MALS principle to nanoparticles requires a specific particle concentration that is difficult to determine empirically (40).
DLS application is limited to liquid samples. Hence, an alternative method is needed to measure particle size distributions for solid samples such as nanocrystal formulations. The only exceptions in this case are samples that are stable in liquid suspension form. LD has been described in pharmacopoeias and is simple to apply (Fig. 2). To be able to analyze particle size distributions accurately, however, LD requires refractive indices that are difficult to determine experimentally (41–43). In practice, it is often necessary to calculate and validate particle size distributions by trial and error using various refractive indices and dedicated software. It may be necessary to compare particle size distribution data obtained using LD against those acquired using the direct or DLS method in which the NPs are dispersed in solvents. In this manner, the trial-and-error parameters required for LD input can be established. Nevertheless, this process is complex. Furthermore, measurement reproducibility and robustness must be considered. Certain equipment manufacturers have developed state-of-the-art tools that uniformly create airborne NP powder dispersions. The LD measurement of airborne particles is strongly affected by agglomerates (44, 45). In addition, LD application is restricted to monodisperse particle powders and cannot, therefore, be used to measure NPs in solid formulations, such as tablets with additives. For LD, it is first necessary to measure solid NPs such as nanocrystal formulations at the API crystal stage (see the section “General consideration of the indirect method”). For actual solid NP size characterization, then, the nanocrystal sizes in the tablet form should be estimated.
LD is not applicable to nanocrystal formulations less than 100–150 nm in diameter. When the direct method confirms that the average size of the NP under development is less than 100 nm, SAXS should then be implemented as the indirect method for nanocrystals. SAXS can usually measure NPs in the range of 1–200 nm depending on the source intensity (25, 26). In this case, however, the samples in the SAXS measurement must be in powder form as the LD measurement requires (27, 46). Furthermore, the presence of additives or impurities in the sample may increase the polydispersity of its NP size distribution, affect its scattering intensity profile, and significantly reduce measurement accuracy (27). Considering the NP size measurement ranges of SAXS and LD, neither method sufficiently performs airborne NP size measurements on solid NPs such as nanocrystal formulations. Hence, there is a lack of indirect methods that can easily measure airborne solid NPs such as nanocrystals.
Challenges Related to Polydisperse NP Size Evaluations
When the DLS PDI is high and the direct method reveals a non-normal particle size distribution, the reliability of NP size measurement is significantly reduced for light-scattering methods, including DLS, LD, and SAXS, that assume monodispersity. In that case, it may be possible to make high-resolution liquid sample measurements by MALS-DLS combined with size-exclusion chromatography (SEC) or field flow fractionation (FFF) (18, 39). However, these measurements are based on the assumption that sample separation does not affect the particles of interest. The FFF may be effective when the interaction between SEC and the carrier destabilizes the particles because the former approach requires no filler. Nevertheless, FFF requires complex measurement conditions, and the NPs might interact with the FFF cannel wall or membrane (47–50).
An alternative to SEC- or FFF-MALS-DLS is NTA. It uses scattered light to trace and analyze the Brownian motion of each individual particle and obtain the NP size distributions (20). However, NTA is biased towards detecting NPs with large light scattering intensities. NTA does not easily detect NPs less than 30 nm in diameter. Furthermore, it may generate polydisperse particle size distribution profiles that are less accurate and reliable than those produced by FFF-MALS-DLS (19, 20, 36, 51, 52).
Coulter counting and analytical ultracentrifugation/differential centrifugal sedimentation (referred to as analytical centrifugation in this review) have some of the highest resolutions and most accurate NP measurements of all indirect methods (20, 53, 54). For the Coulter counter method, the particle size distribution must fit within the range of the aperture diameter (see the section “Issues regarding NP size assessments using indirect methods”). The analytical centrifugation requires particle density data to be able to measure NP sizes. Nevertheless, it is difficult to obtain these data empirically (20, 53, 55). Analytical centrifugation is effective for standard products and metal NPs whose densities are known. However, the density of NPs, including liposomes and lipid nanoparticles, is often unknown and it may be necessary to validate it by comparing measured values against those generated by direct and indirect methods. Nevertheless, this process is highly complex. Hence, this approach is unlikely to be used in applications requiring simplicity of operation such as quality control.
It is difficult to measure the size distributions of solid NPs in their natural state even when they are monodisperse. Thus, it is even more challenging to determine the sizes of polydisperse solid formulations.
Particle Size Evaluation Methods Suitable for Liquids Simulating Physiological Environments
Size characteristics that contribute to NP efficacy and safety are correlated with their values under conditions mimicking biological environments. Hence, it is also important to characterize NP size stability in biological fluids containing serum proteins (19, 52, 56–58). No prior studies have used direct methods to evaluate NP size distributions in physiological fluids. Sample freezing required for EM may adversely affect NPs and serum proteins. AFM requires stable sample particle immobilization, which may change the properties of NPs and/or enable serum proteins to inhibit their immobilization.
Nanoparticle tracking, analytical centrifugation, or Coulter counting can effectively determine NP size distributions in biological media. By contrast, FFF and MALS-DLS must be combined in order to do so (19, 52, 55, 56). FFF-MALS-DLS successfully measured quantum dot model NPs in cell culture media containing 10% (v/v) bovine serum (57). However, these indirect methods might face difficulty when the NP size is close to that of the components in biological media. For example, the major component protein albumin in serum is ~ 7–14 nm as determined by DLS (59), and even with separation techniques, including FFF, the NP population may not be resolved from albumin. Moreover, the biologically relevant concentration of albumin is 35–50 mg/mL (60) and considerably higher than those of NP components in dilution conditions required for the indirect methods. In those cases, washing of the excess proteins unbound or loosely bound to NPs may allow the size determination (61). Proteomics experiment to identify the biomolecular corona composed of proteins bound to NPs may also help establish the appropriate conditions to determine the NP size and predict the behavior of NPs in vivo (62).
Other Challenges
EM and AFM can simultaneously measure and observe the morphology of non-spherical particles (63). By contrast, indirect methods are generally used to measure particles assumed to be spherical (64). To our knowledge, indirect methods are rarely used to measure non-spherical particles. Hence, the validity and reliability of indirect methods for this application must be established while comparing the results with those obtained by EM or AFM (65, 66). Indeed, development of innovative non-spherical polymeric or gold NPs is in progress (67, 68).
The demand for methods to evaluate NP size for continuous manufacturing and production/process analysis technology (PAT) are expected to grow (69, 70). The NPs produced by microfluidic technologies have become the focus of research attention in recent years. Computerized feedback control and PAT should help ensure stable NP production using these methods (71). Thus, it is essential to improve the convenience of NP measurement methods. Resonant mass and convergent beam reflectometry are limited in terms of the particle size ranges they can measure. They are nonetheless effective for in situ, real-time size measurement methods and provide instrumentation flexibility (69, 72).
Degree of Dissemination of Various NP Size Evaluation Methods
According to the scatterplot of the number of hits per evaluation method in the first report year (Fig. 3), EM and AFM (direct methods) and SAXS and DLS (indirect methods) are the most widely used in the scientific community. As EM, AFM, and SAXS are also used for structural analysis, DLS might, therefore, be the most frequently used NP size measurement method. As the annual number of reports related to NTA is greater than 100, this method is also popular. Thus, there is a high demand for methods that easily determine number-particle size distributions for NPs and are highly flexible in terms of solvent selection. FFF, analytical centrifugation, and Coulter counting are useful in academic applications. Nevertheless, these methods are not widely used in manufacturing, QA/QC, and certain other operations possibly because they can be inconvenient (11). Thus, it is believed that convenience strongly influences the selection and popularity of indirect NP size evaluation methods.
Fig. 3.
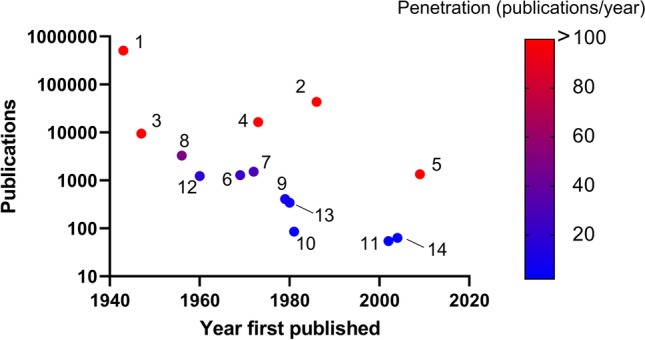
Plot of publications vs. year of first report on size evaluation methods. 1, electron microscopy; 2, atomic force microscopy; 3, small-angle X-ray scattering; 4, dynamic light scattering; 5, nanoparticle tracking analysis; 6, laser diffraction; 7, field flow fractionation; 8, analytical ultracentrifugation; 9, multi-angle light scattering; 10, acoustic spectroscopy; 11, differential centrifugal sedimentation/disc centrifugation; 12, Coulter counter; 13, focused beam reflection measurement; 14, resonant mass measurement/suspended microchannel resonator. Search word was set to exact match with legend. Publications as of December 3, 2021
EVALUATION OF SURFACE MODIFICATION
Surface Modification Evaluation Methods
In advanced medical nanotechnology, appropriate surface chemistry is vital as it targets NPs to cells and tissues and improves NP stability. Polyethylene glycol-modified NPs have enhanced blood stability and particle dispersibility and are typical commercialized products. NPs modified with molecules that bind target lesions are currently being developed (73, 74).
Here, the “direct method” was defined as an analytical method in which the observation target is the NP surface. The “indirect method” was defined as an analytical method in which the state of the surface modification was inferred and characterized by using information reflecting the physicochemical properties of the NP population (Table II). The indirect method was subdivided into “spectroscopic method” or “other method” based on the method principle for better readability. The indirect methods include electroacoustics and light-scattering electrophoresis as they measure the zeta potential and infer qualitative molecular information with regards to the NP surface.
Current Status and Issues in Methods for Evaluating Modified NP Surfaces
Only five methods are available for the direct evaluation of modified NP surfaces. Hence, a more direct method is required to evaluate the surface modification and ensure the quality of these NPs. Cryo-EM is a direct method that has been applied under limited experimental conditions. Polyelectrolytes with modified particle surfaces can be visualized by adding cesium ions. Measurements by X-ray photoelectron spectroscopy (XPS), Auger electron spectroscopy (AES), and time-of-flight secondary ion mass spectrometry (TOF–SIMS) require sample desiccation and evacuation (13). Thus, only metal NP formulations and others that are stable in air are applicable in this case (Table II). To the best of our knowledge, tip-enhanced Raman scattering (TERS) is the only direct method applicable both to airborne and liquid samples (Table II).
XPS is less damaging to the sample than AES; however, it only has a lateral resolution of more than 1 µm. This deficiency complicates data interpretation (75, 76). AES has a lateral resolution of 10 nm. It can be integrated into an electron microscope, observe NPs, and measure surface atomic distributions to 5 nm depth (77). XPS and AES observe quantum phenomena such as photoelectrons and Auger electron emissions, but they do not detect surface molecules. However, the studies that applied the foregoing techniques to metal NP surfaces were conducted only very recently. Hence, further research is required to validate the utility of XPS and AES for these purposes (77–79).
TOF–SIMS detects molecular ions on sample surfaces. Thus, its results are easier to interpret than those generated by XPS or AES. Nevertheless, the lateral resolution of TOF–SIMS is currently ~ 80 nm at best (80), whereas many NPs are nearly less than 100–300 nm in diameter (11). For this reason, TOF–SIMS might not be appropriate for NP surface characterization.
TERS is used in combination with AFM to characterize the molecular structures associated with the surfaces of modified NPs in solution (81, 82). However, TERS has been applied mainly to the surfaces of NPs composed of gold or silver possibly to maximize the surface-enhanced Raman effect. Hence, further research is required to verify the versatility of TERS and determine whether it can also be applied to non-metallic NPs (83, 84).
The indirect methods used to characterize modified NP surfaces are listed in Table II. They do not directly provide information regarding the modified NP surfaces as the physical quantities that must be measured are derived from the properties of the entire particle. However, direct methods have not been fully established for this application. Thus, it is necessary to assess the applicability of indirect methods towards evaluating NP surface modifications despite the complexity of measuring and interpreting the data generated by these techniques. A possible strategy is to first confirm that only the NP surface has been modified and then apply SAXS and spectroscopic methods, such as circular dichroism (CD) (25, 85). SAXS has been successful in characterizing the thickness of the surface layer of liposomes modified with polyethylene glycol (25, 86). However, SAXS measures only the electron density difference in the sample and requires a complicated fitting model to determine an object’s size, shape, and surface geometrical structure (87). The SAXS analysis must be validated in a case-by-case manner. Spectroscopic methods, including CD, provide information on the chemical structure of molecules. However, the spectroscopic indirect methods are usually difficult to use in order to perform quantitative evaluations on modified NP surfaces because the presence of nanoparticles and other additives distorts the spectroscopic signals (88, 89). Applying sum frequency generation/scattering in nonlinear optics to infrared spectroscopy (IR) could identify the surface molecular specificity of NPs (90). However, the analyses are laborious and their application to NP surface modification evaluation is uncommon (91). The foregoing spectroscopic indirect methods might have the greatest applicability to noble metal NPs, such as gold nanoparticles, as their localized surface plasmon resonances can improve sensitivity (92, 93). In AFM-IR, the chemical bond vibrations associated with the entire volume of each particle are reflected in the AFM-IR spectral data (94, 95). A combination of AFM-IR and TERS might be able to extract high-resolution molecular information for modified NP surfaces (96).
Degree of Dissemination of Various Surface Modification Evaluation Methods
The scatterplot of publications versus year of first report on each analytical method (Fig. 4) reveals that more than 10,000 and 100 research and annual reports, respectively, were related to the general spectroscopic methods IR, Raman spectroscopy, and CD. According to the foregoing surveys, only XPS and cryo-EM are the widely used direct methods. To our knowledge, however, cryo-EM has only been used to characterize modified NP surfaces in a few studies (97) (Table II). This discrepancy may be explained by the fact that cryo-EM is used mainly for other purposes such as morphological observations and crystal structure analyses (98). Moreover, XPS can only be used in vacuo and is applicable only to metal NPs that are stable in a dry state (75, 76). By contrast, TERS is emerging and growing in popularity as it can be used on NPs that are airborne and in liquid media. Nevertheless, its market penetration is slow (Fig. 4). Thus, the adoption of direct methods that can characterize modified NP surfaces has been substantially delayed despite the importance of this type of analysis. Hence, the development and expansion of novel, dependable methods for analyzing the surface of NPs are urgently needed. There is no previous information on the analysis of the surface characteristics of the clinically used SARS-CoV-2 vaccines. With the current surface evaluation methods, only zeta potential measurement can readily be carried out for such lipid nanoparticles encapsulating mRNA (99). Although cryo-EM has provided images for the model lipid nanoparticles, their complete structure is still unelucidated (100).
Fig. 4.
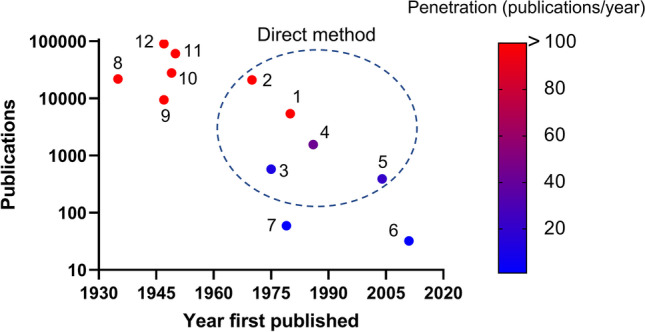
Plot of publications vs. year of first report on surface chemistry evaluation methods. 1, cryo-electron microscopy; 2, X-ray photoelectron spectroscopy; 3, Auger electron spectroscopy; 4, time-of-flight secondary ion mass spectroscopy; 5, tip-enhanced Raman spectroscopy; 6, atomic force microscopy-infrared spectroscopy; 7, electroacoustic spectroscopy/colloid vibration current/electric sonic amplitude; 8, electrophoretic light scattering/laser Doppler electrophoresis/phase analysis light scattering/zeta potential; 9, small-angle X-ray scattering; 10, Raman spectroscopy; 11, infrared spectroscopy; 12, circular dichroism. Direct methods are enclosed by circle. Search word was set to exact match with legend. Publications as of December 10, 2021
STANDARDIZATION TRENDS
ISO, CEN, IEC, and ASTM International are major organizations developing nanotechnology standards. They have established committees that are dedicated to nanotechnology and are collaborating with approximately 40 countries and research institutes to standardize and document NP size and surface modification evaluation methods (13, 101, 102). The ISO document (ISO/TR 18,196:2016) systematizes the methods currently available to measure nanomaterial size, morphology, surface area, and other parameters. ISO and ASTM International have issued standardization documents corresponding to all methods listed in Tables I and II except TERS and AFM-IR. The terms “TERS” and “AFM-IR” were introduced in ISO 18115–2:2013.
Reference materials must be established to validate assessment methods and data traceability. According to ISO GUIDE 30:2015, a certified reference material is preferable as it is metrologically validated and accompanied by a document stating its physical properties, uncertainty, and traceability. If it is difficult to establish a certified reference material, a non-certified reference material is permissible provided that its target properties are uniform and stable enough to meet the measurement objective.
Internet databases may be used to search reference materials. Appropriate information sources include NIST (https://www.nist.gov/srm), COMAR (https://rrr.bam.de/RRR/Navigation/EN/Home/home.html) and the Joint Research Centre in Europe (https://ec.europa.eu/jrc/en/scientific-tool/jrc-nanomaterials-repository).
Several different metal or polystyrene nanoparticles with various size distributions are available from NIST, the Japan Metrology Institute, and others for use as reference materials in size measurements. These agencies furnish metal nanoparticles with average sizes of 10, 30, and 60 nm and polystyrene nanoparticles with average sizes of 120 nm, and so on. Reference materials are usually optionally available as accessories when certain measuring devices are purchased.
Certified inorganic surface reference materials are available to validate TOF–SIMS, AES, and XPS as surface chemistry assessment methods (BAM-L200; https://rrr.bam.de/RRR/Content/EN/Downloads/RM-Certificates/RM-cert-layer-and-surface/bam_l200.html). However, Halamoda-Kenzaoui et al. stated that only a few reference materials are actually relevant to NP surface modifications whereas more than 10 are available for NP size evaluation (102). The establishment of suitable standards remains a challenge as target NPs have original surfaces and organic molecular structures.
CONCLUSION
The “size” and “modified surface/surface chemistry” properties of NPs are recognized as important quality characteristics. Here, we discussed the advantages and disadvantages of the various methods currently available to measure these properties. We explored the development of indirect methods that: (i) measure a wide range of solid-state NP drug products, (ii) evaluate the sizes of polydisperse NPs, and (iii) measure non-spherical NPs. Regarding (i) and (iii), it might be possible to design a technique integrating both direct and indirect methods as previously reported (103). For (ii), the application of FFF-MALS-DLS, NTA, coulter counting, or analytical centrifugation should be considered. Nevertheless, we should acknowledge that each analytical method has its own shortcomings, and an “absolute” and “true” size distribution is impossible to determine since the measured NP size varies depending on the evaluation method used (20, 104–107). Therefore, it is important to comprehensively evaluate the size of NPs in a method-defined or operation-defined manner, while rationally explaining the data obtained by multiple methods in light of the measurement principles. Only a few methods can be used to analyze modified NP surfaces and their practical applicability to NPs has not been fully established. Therefore, the utility of methods such as TERS and AFM-IR must be assessed through case studies.
We also examined the trends in standardization that are necessary to validate the size and surface measurements of NPs. We might have overlooked emerging powerful analytical methods as our data collection relied mainly on Internet search engines. Nonetheless, it is difficult to select appropriate reference materials for modified NP surface evaluations due to lack of available reference materials. As nanoscience continues to evolve rapidly, the development and implementation of information technology and artificial intelligence in Web data mining will be invaluable in the discovery of promising technological innovations to evaluate NP size and surface modification (108, 109). Large-scale subject data have been used to confirm the efficacy and safety of lipid NP formulations integrated into the new SARS-CoV-2 vaccines. Research and developments are in progress on innovative surface-modified NP-based cancer and gene therapies targeting cells, tissues, and organs (110–112). To design and validate assessments of the surface modifications for ensuring the quality of NPs, next-generation nanomedicine should compile studies on the application and standardization of NP measurement methods.
Acknowledgements
We thank Dr. Takeshi Nakanishi for helpful discussions that stimulated and facilitated our study. The authors also thank Editage [http://www.editage.com] for English language editing and reviewing this manuscript.
Author Contributions
Y.T-H. investigated the analytical methods used for evaluating NP size and surface modification. Y.T-H., T.O., Y.D., H.S., K.I., and K.S-K. discussed the advantages and disadvantages and identified the issues and challenges associated with the analytical methods. Y.T-H. and K.S-K. designed the study. Y.T-H. wrote the paper. All authors reviewed the final version of the manuscript.
Funding
This study was supported in part by JSPS KAKENHI (Grant No. JP20K15982; to Y.T-H.) from Japan Society for the Promotion of Science and the Research on Development of New Drugs (21ak0101074j0805; to Y.T-H., 21ak0101074h2205; to K.S-K.) from Japan Agency for Medical Research and Development, AMED.
Declarations
Conflict of Interest
The authors declare no competing interests.
Footnotes
Publisher's Note
Springer Nature remains neutral with regard to jurisdictional claims in published maps and institutional affiliations.
Contributor Information
Yuki Takechi-Haraya, Email: haraya@nihs.go.jp.
Kumiko Sakai-Kato, Email: katok@pharm.kitasato-u.ac.jp.
References
- 1.Chan WCW. Nanomedicine 2.0. Acc Chem Res. 2017;50:627–32. 10.1021/acs.accounts.6b00629. [DOI] [PubMed]
- 2.Li B, Lane LA. Probing the biological obstacles of nanomedicine with gold nanoparticles. Wiley Interdiscip Rev Nanomed Nanobiotechnology. 2019;11:e1542. doi: 10.1002/wnan.1542. [DOI] [PMC free article] [PubMed] [Google Scholar]
- 3.Wacker MG, Proykova A, Santos GML. Dealing with nanosafety around the globe-Regulation vs. innovation. Int J Pharm. 2016;509:95–106. 10.1016/j.ijpharm.2016.05.015 [DOI] [PubMed]
- 4.Bremer-Hoffmann S, Halamoda-Kenzaoui B, Borgos SE. Identification of regulatory needs for nanomedicines. J Interdiscip Nanomed. 2018;3:4–15. doi: 10.1002/jin2.34. [DOI] [Google Scholar]
- 5.Soares S, Sousa J, Pais A, Vitorino C. Nanomedicine: principles, properties, and regulatory issues. Front Chem. 2018;6:360. doi: 10.3389/fchem.2018.00360. [DOI] [PMC free article] [PubMed] [Google Scholar]
- 6.Sainz V, Conniot J, Matos AI, Peres C, Zupancic E, Moura L, et al. Regulatory aspects on nanomedicines. Biochem Biophys Res Commun. 2015;468:504–510. doi: 10.1016/j.bbrc.2015.08.023. [DOI] [PubMed] [Google Scholar]
- 7.Zheng N, Sun DD, Zou P, Jiang W. Scientific and regulatory considerations for generic complex drug products containing nanomaterials. AAPS J. 2017;19:619–631. doi: 10.1208/s12248-017-0044-1. [DOI] [PubMed] [Google Scholar]
- 8.Choi YH, Han HK. Nanomedicines: current status and future perspectives in aspect of drug delivery and pharmacokinetics. J Pharm Investig. 2018;48:43–60. doi: 10.1007/s40005-017-0370-4. [DOI] [PMC free article] [PubMed] [Google Scholar]
- 9.He H, Liu L, Morin EE, Liu M, Schwendeman A. Survey of clinical translation of cancer nanomedicines-lessons learned from successes and failures. Acc Chem Res. 2019;52:2445–2461. doi: 10.1021/acs.accounts.9b00228. [DOI] [PubMed] [Google Scholar]
- 10.Chen ML, John M, Lee SL, Tyner KM. Development considerations for nanocrystal drug products. AAPS J. 2017;19:642–651. doi: 10.1208/s12248-017-0064-x. [DOI] [PubMed] [Google Scholar]
- 11.D’Mello SR, Cruz CN, Chen ML, Kapoor M, Lee SL, Tyner KM. The evolving landscape of drug products containing nanomaterials in the United States. Nat Nanotechnol. 2017;12:523–529. doi: 10.1038/nnano.2017.67. [DOI] [PubMed] [Google Scholar]
- 12.Grumezescu AM. Nanoscale fabrication, optimization, scale-up and biological aspects of pharmaceutical nanotechnology. William Andrew Publishing; 2017
- 13.Hodoroaba V-D, Unger W, Shard A. Characterization of nanoparticles: measurement processes for nanoparticles. Elsevier; 2019
- 14.Ferrari E, Soloviev M. Nanoparticles in biology and medicine. Methods Protoc. 2020. Springer
- 15.Tinkle S, McNeil SE, Mühlebach S, Bawa R, Borchard G, Barenholz YC, et al. Nanomedicines: addressing the scientific and regulatory gap. Ann N Y Acad Sci. 2014;1313:35–56. doi: 10.1111/nyas.12403. [DOI] [PubMed] [Google Scholar]
- 16.Shekunov BY, Chattopadhyay P, Tong HH, Chow AH. Particle size analysis in pharmaceutics: principles, methods and applications. Pharm Res. 2007;24:203–227. doi: 10.1007/s11095-006-9146-7. [DOI] [PubMed] [Google Scholar]
- 17.Ilett M, Wills J, Rees P, Sharma S, Micklethwaite S, Brown A, et al. Application of automated electron microscopy imaging and machine learning to characterise and quantify nanoparticle dispersion in aqueous media. J Microsc. 2020;279:177–184. doi: 10.1111/jmi.12853. [DOI] [PMC free article] [PubMed] [Google Scholar]
- 18.Hansen M, Smith MC, Crist RM, Clogston JD, McNeil SE. Analyzing the influence of PEG molecular weight on the separation of pegylated gold nanoparticles by asymmetric-flow field-flow fractionation. Anal Bioanal Chem. 2015;407:8661–8672. doi: 10.1007/s00216-015-9056-9. [DOI] [PubMed] [Google Scholar]
- 19.Caputo F, Clogston J, Calzolai L, Rösslein M, Prina-Mello A. Measuring particle size distribution of nanoparticle enabled medicinal products, the joint view of EUNCL and NCI-NCL. A step by step approach combining orthogonal measurements with increasing complexity. J Control Release. 2019;299:31–43. 10.1016/j.jconrel.2019.02.030 [DOI] [PubMed]
- 20.Anderson W, Kozak D, Coleman VA, Jämting ÅK, Trau M. A comparative study of submicron particle sizing platforms: accuracy, precision and resolution analysis of polydisperse particle size distributions. J Colloid Interface Sci. 2013;405:322–330. doi: 10.1016/j.jcis.2013.02.030. [DOI] [PubMed] [Google Scholar]
- 21.Dieckmann Y, Cölfen H, Hofmann H, Petri-Fink A. Particle size distribution measurements of manganese-doped ZnS nanoparticles. Anal Chem. 2009;81:3889–95. 10.1021/ac900043y. [DOI] [PubMed]
- 22.Barenholz YC. Doxil®—the first FDA-approved nano-drug: lessons learned. J Control Release. 2012;160:117–134. doi: 10.1016/j.jconrel.2012.03.020. [DOI] [PubMed] [Google Scholar]
- 23.Zölls S, Tantipolphan R, Wiggenhorn M, Winter G, Jiskoot W, Friess W, et al. Particles in therapeutic protein formulations, Part 1: overview of analytical methods. J Pharm Sci. 2012;101:914–935. doi: 10.1002/jps.23001. [DOI] [PubMed] [Google Scholar]
- 24.Krumrey M, Garcia-Diez R, Gollwitzer C, Langner S. Size determination of nanoparticles with small-angle X-ray scattering. PTB-Mitteilungen S. 2014;124:53–56. [Google Scholar]
- 25.Varga Z, Wacha A, Vainio U, Gummel J, Bóta A. Characterization of the PEG layer of sterically stabilized liposomes: a SAXS study. Chem Phys Lipids. 2012;165:387–392. doi: 10.1016/j.chemphyslip.2011.12.011. [DOI] [PubMed] [Google Scholar]
- 26.Rauscher H, Mech A, Gaillard C, Stintz M, Wohlleben W, Weigel S, et al. Recommendations on a Revision of the EC Definition of Nanomaterial Based on Analytical Possibilities; updated. NanoDefine Technical Report D7.11. The NanoDefine Consortium, 2017.
- 27.Bouzakher-Ghomrasni N, Taché O, Leroy J, Feltin N, Testard F, Chivas-Joly C. Dimensional measurement of TiO2 (Nano) particles by SAXS and SEM in powder form. Talanta. 2021;234:122619. doi: 10.1016/j.talanta.2021.122619. [DOI] [PubMed] [Google Scholar]
- 28.Guerin M, Seaman JC. Characterizing clay mineral suspensions using acoustic and electroacoustic spectroscopy - a review. Clays Clay Miner. 2004;52:145–157. doi: 10.1346/CCMN.2004.0520201. [DOI] [Google Scholar]
- 29.Ige PP, Baria RK, Gattani SG. Fabrication of fenofibrate nanocrystals by probe sonication method for enhancement of dissolution rate and oral bioavailability. Colloids Surf B Biointerfaces. 2013;108:366–373. doi: 10.1016/j.colsurfb.2013.02.043. [DOI] [PubMed] [Google Scholar]
- 30.Tanaka Y, Inkyo M, Yumoto R, Nagai J, Takano M, Nagata S. Nanoparticulation of poorly water soluble drugs using a wet-mill process and physicochemical properties of the nanopowders. Chem Pharm Bull (Tokyo) 2009;57:1050–1057. doi: 10.1248/cpb.57.1050. [DOI] [PubMed] [Google Scholar]
- 31.EMA. Assessment report. Comirnaty. Procedure No. EMEA/H/C/005735/0000. EMA/707383/2020. February 19, 2021.
- 32.EMA. Assessment report. COVID-19 Vaccine Moderna. Procedure No. EMEA/H/C/005791/0000. EMA/15689/2021. March 11, 2021.
- 33.MHLW. Report on special approval for emergency. Comirnaty Intramuscular Injection. February 12, 2021.
- 34.MHLW. Report on special approval for emergency. COVID-19 Vaccine Moderna Intramuscular Injection. May 10, 2021.
- 35.Bhattacharjee S. DLS and zeta potential – What they are and what they are not? J Control Release. 2016;235:337–351. doi: 10.1016/j.jconrel.2016.06.017. [DOI] [PubMed] [Google Scholar]
- 36.Grabarek AD, Weinbuch D, Jiskoot W, Hawe A. Critical evaluation of microfluidic resistive pulse sensing for quantification and sizing of nanometer- and micrometer-sized particles in biopharmaceutical products. J Pharm Sci. 2019;108:563–573. doi: 10.1016/j.xphs.2018.08.020. [DOI] [PubMed] [Google Scholar]
- 37.Fischer K, Schmidt M. Pitfalls and novel applications of particle sizing by dynamic light scattering. Biomaterials. 2016;98:79–91. doi: 10.1016/j.biomaterials.2016.05.003. [DOI] [PubMed] [Google Scholar]
- 38.Ono Y, Isogai A. Analysis of celluloses, plant holocelluloses, and wood pulps by size-exclusion chromatography/multi-angle laser-light scattering. Carbohydr Polym. 2021;251:117045. doi: 10.1016/j.carbpol.2020.117045. [DOI] [PubMed] [Google Scholar]
- 39.Klein M, Menta M, Dacoba TG, Crecente-Campo J, Alonso MJ, Dupin D, et al. Advanced nanomedicine characterization by DLS and AF4-UV-MALS: application to a HIV nanovaccine. J Pharm Biomed Anal. 2020;179:113017. doi: 10.1016/j.jpba.2019.113017. [DOI] [PubMed] [Google Scholar]
- 40.Wyatt PJ. Light scattering and the absolute characterization of macromolecules. Anal Chim Acta. 1993;272:1–40. doi: 10.1016/0003-2670(93)80373-S. [DOI] [Google Scholar]
- 41.Yoneda S, Niederleitner B, Wiggenhorn M, Koga H, Totoki S, Krayukhina E, et al. Quantitative laser diffraction for quantification of protein aggregates: comparison with resonant mass measurement, nanoparticle tracking analysis, flow imaging, and light obscuration. J Pharm Sci. 2019;108:755–762. doi: 10.1016/j.xphs.2018.09.004. [DOI] [PubMed] [Google Scholar]
- 42.Di Stefano C, Ferro V, Mirabile S. Comparison between grain-size analyses using laser diffraction and sedimentation methods. Biosyst Eng. 2010;106:205–215. doi: 10.1016/j.biosystemseng.2010.03.013. [DOI] [Google Scholar]
- 43.de Boer GBJ, de Weerd C, Thoenes D, Goossens HWJ. Laser diffraction spectrometry: Fraunhofer diffraction versus Mie scattering. Part Part Syst Charact. 1987;4:14–19. doi: 10.1002/ppsc.19870040104. [DOI] [Google Scholar]
- 44.Jaffari S, Forbes B, Collins E, Barlow DJ, Martin GP, Murnane D. Rapid characterisation of the inherent dispersibility of respirable powders using dry dispersion laser diffraction. Int J Pharm. 2013;447:124–131. doi: 10.1016/j.ijpharm.2013.02.034. [DOI] [PMC free article] [PubMed] [Google Scholar]
- 45.Stevens N, Shrimpton J, Palmer M, Prime D, Johal B. Accuracy assessments for laser diffraction measurements of pharmaceutical lactose. Meas Sci Technol. 2007;18:3697–3706. doi: 10.1088/0957-0233/18/12/004. [DOI] [Google Scholar]
- 46.Jensen H, Pedersen JH, J⊘rgensen JE, Pedersen JS, Joensen KD, Iversen SB, et al. Determination of size distributions in nanosized powders by TEM, XRD, and SAXS. J Exp Nanosci. 2006;1:355–73. 10.1080/17458080600752482
- 47.Hupfeld S, Ausbacher D, Brandl M. Asymmetric flow field-flow fractionation of liposomes: optimization of fractionation variables. J Sep Sci. 2009;32:1465–1470. doi: 10.1002/jssc.200800626. [DOI] [PubMed] [Google Scholar]
- 48.Zhang H, Lyden D. Asymmetric-flow field-flow fractionation technology for exomere and small extracellular vesicle separation and characterization. Nat Protoc. 2019;14:1027–1053. doi: 10.1038/s41596-019-0126-x. [DOI] [PMC free article] [PubMed] [Google Scholar]
- 49.Contado C. Field flow fractionation techniques to explore the “nano-world”. Anal Bioanal Chem. 2017;409:2501–2518. doi: 10.1007/s00216-017-0180-6. [DOI] [PubMed] [Google Scholar]
- 50.Parot J, Caputo F, Mehn D, Hackley VA, Calzolai L. Physical characterization of liposomal drug formulations using multi-detector asymmetrical-flow field flow fractionation. J Control Release. 2020;320:495–510. doi: 10.1016/j.jconrel.2020.01.049. [DOI] [PMC free article] [PubMed] [Google Scholar]
- 51.Caputo F, Vogel R, Savage J, Vella G, Law A, Della Camera G, et al. Measuring particle size distribution and mass concentration of nanoplastics and microplastics: addressing some analytical challenges in the sub-micron size range. J Colloid Interface Sci. 2021;588:401–417. doi: 10.1016/j.jcis.2020.12.039. [DOI] [PubMed] [Google Scholar]
- 52.Caputo F, Arnould A, Bacia M, Ling WL, Rustique E, Texier I, et al. Measuring particle size distribution by asymmetric flow field flow fractionation: A powerful method for the preclinical characterization of lipid-based nanoparticles. Mol Pharm. 2019;16:756–767. doi: 10.1021/acs.molpharmaceut.8b01033. [DOI] [PMC free article] [PubMed] [Google Scholar]
- 53.Ullmann C, Babick F, Koeber R, Stintz M. Performance of analytical centrifugation for the particle size analysis of real-world materials. Powder Technol. 2017;319:261–270. doi: 10.1016/j.powtec.2017.06.057. [DOI] [Google Scholar]
- 54.Zook JM, Rastogi V, MacCuspie RI, Keene AM, Fagan J. Measuring agglomerate size distribution and dependence of localized surface plasmon resonance absorbance on gold nanoparticle agglomerate size using analytical ultracentrifugation. ACS Nano. 2011;5:8070–8079. doi: 10.1021/nn202645b. [DOI] [PubMed] [Google Scholar]
- 55.Davidson AM, Brust M, Cooper DL, Volk M. Sensitive analysis of protein adsorption to colloidal gold by differential centrifugal sedimentation. Anal Chem. 2017;89:6807–6814. doi: 10.1021/acs.analchem.7b01229. [DOI] [PMC free article] [PubMed] [Google Scholar]
- 56.Monopoli MP, Walczyk D, Campbell A, Elia G, Lynch I, Bombelli FB, et al. Physical-chemical aspects of protein corona: relevance to in vitro and in vivo biological impacts of nanoparticles. J Am Chem Soc. 2011;133:2525–2534. doi: 10.1021/ja107583h. [DOI] [PubMed] [Google Scholar]
- 57.Moquin A, Neibert KD, Maysinger D, Winnik FM. Quantum dot agglomerates in biological media and their characterization by asymmetrical flow field-flow fractionation. Eur J Pharm Biopharm. 2015;89:290–299. doi: 10.1016/j.ejpb.2014.12.019. [DOI] [PubMed] [Google Scholar]
- 58.Pyrgiotakis G, Blattmann CO, Pratsinis S, Demokritou P. Nanoparticle–nanoparticle interactions in biological media by atomic force microscopy. Langmuir. 2013;29:11385–11395. doi: 10.1021/la4019585. [DOI] [PMC free article] [PubMed] [Google Scholar]
- 59.Li Y, Yang G, Mei Z. Spectroscopic and dynamic light scattering studies of the interaction between pterodontic acid and bovine serum albumin. Acta Pharm Sin B. 2012;2:53–59. doi: 10.1016/j.apsb.2011.12.001. [DOI] [Google Scholar]
- 60.Arasteh A, Farahi S, Habibi-Rezaei M, Moosavi-Movahedi AA. Glycated albumin: an overview of the in vitro models of an in vivo potential disease marker. J Diabetes Metab Disord. 2014;13:49. doi: 10.1186/2251-6581-13-49. [DOI] [PMC free article] [PubMed] [Google Scholar]
- 61.Walczyk D, Bombelli FB, Monopoli MP, Lynch I, Dawson KA. What the cell “sees” in bionanoscience. J Am Chem Soc. 2010;132:5761–5768. doi: 10.1021/ja910675v. [DOI] [PubMed] [Google Scholar]
- 62.Pozzi D, Caracciolo G, Digiacomo L, Colapicchioni V, Palchetti S, Capriotti AL, et al. The biomolecular corona of nanoparticles in circulating biological media. Nanoscale. 2015;7:13958–13966. doi: 10.1039/c5nr03701h. [DOI] [PubMed] [Google Scholar]
- 63.Rühle B, Krumrey JF, Hodoroaba VD. Workflow towards automated segmentation of agglomerated, non-spherical particles from electron microscopy images using artificial neural networks. Sci Rep. 2021;11:4942. doi: 10.1038/s41598-021-84287-6. [DOI] [PMC free article] [PubMed] [Google Scholar]
- 64.Borchert H, Shevchenko EV, Robert A, Mekis I, Kornowski A, Grübel G, et al. Determination of nanocrystal sizes: a comparison of TEM, SAXS, and XRD studies of highly monodisperse CoPt3 particles. Langmuir. 2005;21:1931–1936. doi: 10.1021/la0477183. [DOI] [PubMed] [Google Scholar]
- 65.Li M, Wilkinson D. Determination of non-spherical particle size distribution from chord length measurements. Part 1: Theoretical analysis. Chem Eng Sci. 2005;60:3251–65. 10.1016/j.ces.2005.01.008
- 66.Li M, Wilkinson D, Patchigolla K. Determination of non-spherical particle size distribution from chord length measurements. Part 2: Experimental validation. Chem Eng Sci. 2005;60:4992–5003. 10.1016/j.ces.2005.04.019
- 67.Xu L, Wang X, Wang W, Sun M, Choi WJ, Kim JY, et al. Enantiomer-dependent immunological response to chiral nanoparticles. Nature. 2022;601:366–373. doi: 10.1038/s41586-021-04243-2. [DOI] [PubMed] [Google Scholar]
- 68.Haryadi BM, Hafner D, Amin I, Schubel R, Jordan R, Winter G, et al. Nonspherical nanoparticle shape stability is affected by complex manufacturing aspects: its implications for drug delivery and targeting. Adv Healthc Mater. 2019;8:e1900352. doi: 10.1002/adhm.201900352. [DOI] [PubMed] [Google Scholar]
- 69.Kumar V, Taylor MK, Mehrotra A, Stagner WC. Real-time particle size analysis using focused beam reflectance measurement as a process analytical technology tool for a continuous granulation–drying–milling process. AAPS PharmSciTech. 2013;14:523–530. doi: 10.1208/s12249-013-9934-4. [DOI] [PMC free article] [PubMed] [Google Scholar]
- 70.Fernández-Castané A, Li H, Joseph S, Ebeler M, Franzreb M, Bracewell DG, et al. Nanoparticle tracking analysis as a process analytical tool for characterising magnetosome preparations. Food Bioprod Process. 2021;127:426–434. doi: 10.1016/j.fbp.2021.03.013. [DOI] [Google Scholar]
- 71.Colombo S, Beck-Broichsitter M, Bøtker JP, Malmsten M, Rantanen J, Bohr A. Transforming nanomedicine manufacturing toward Quality by Design and microfluidics. Adv Drug Deliv Rev. 2018;128:115–131. doi: 10.1016/j.addr.2018.04.004. [DOI] [PubMed] [Google Scholar]
- 72.São Pedro MN, Klijn ME, Eppink MH, Ottens M. Process analytical technique (PAT) miniaturization for monoclonal antibody aggregate detection in continuous downstream processing. J Chem Technol Biotechnol. 2021 doi: 10.1002/jctb.6920. [DOI] [Google Scholar]
- 73.Alkilany AM, Zhu L, Weller H, Mews A, Parak WJ, Barz M, et al. Ligand density on nanoparticles: A parameter with critical impact on nanomedicine. Adv Drug Deliv Rev. 2019;143:22–36. doi: 10.1016/j.addr.2019.05.010. [DOI] [PubMed] [Google Scholar]
- 74.Tran S, DeGiovanni PJ, Piel B, Rai P. Cancer nanomedicine: a review of recent success in drug delivery. Clin Transl Med. 2017;6:44. doi: 10.1186/s40169-017-0175-0. [DOI] [PMC free article] [PubMed] [Google Scholar]
- 75.Grenha A, Seijo B, Serra C, Remuñán-López C. Surface characterization of lipid/chitosan nanoparticles assemblies, using X-ray photoelectron spectroscopy and time-of-flight secondary ion mass spectrometry. J Nanosci Nanotechnol. 2008;8:358–365. doi: 10.1166/jnn.2008.18140. [DOI] [PubMed] [Google Scholar]
- 76.Bennet F, Müller A, Radnik J, Hachenberger Y, Jungnickel H, Laux P, et al. Preparation of nanoparticles for ToF-SIMS and XPS analysis. J Vis Exp. 2020;163:e61758. doi: 10.3791/61758. [DOI] [PubMed] [Google Scholar]
- 77.Koh AL, Shachaf CM, Elchuri S, Nolan GP, Sinclair R. Electron microscopy localization and characterization of functionalized composite organic–inorganic SERS nanoparticles on leukemia cells. Ultramicroscopy. 2008;109:111–121. doi: 10.1016/j.ultramic.2008.09.004. [DOI] [PMC free article] [PubMed] [Google Scholar]
- 78.Rades S, Borghetti P, Ortel E, Wirth T, Blanco M, Gómez E, et al. Control of functionalization of supports for subsequent assembly of t itania nanoparticle films. Surf Interface Anal. 2018;50:1200–1206. doi: 10.1002/sia.6398. [DOI] [Google Scholar]
- 79.Kuchibhatla SV, Karakoti AS, Baer DR, Samudrala S, Engelhard MH, Amonette JE, et al. Influence of aging and environment on nanoparticle chemistry: implication to confinement effects in nanoceria. J Phys Chem C Nanomater Interfaces. 2012;116:14108–14114. doi: 10.1021/jp300725s. [DOI] [PMC free article] [PubMed] [Google Scholar]
- 80.Kim YP, Shon HK, Shin SK, Lee TG. Probing nanoparticles and nanoparticle-conjugated biomolecules using time-of-flight secondary ion mass spectrometry. Mass Spectrom Rev. 2015;34:237–247. doi: 10.1002/mas.21437. [DOI] [PubMed] [Google Scholar]
- 81.Zhang Z, Sheng S, Wang R, Sun M. Tip-enhanced Raman spectroscopy. Anal Chem. 2016;88:9328–9346. doi: 10.1021/acs.analchem.6b02093. [DOI] [PubMed] [Google Scholar]
- 82.Bailo E, Deckert V. Tip-enhanced Raman scattering. Chem Soc Rev. 2008;37:921–930. doi: 10.1039/b705967c. [DOI] [PubMed] [Google Scholar]
- 83.Bhattarai A, Novikova IV, El-Khoury PZ. Tip-enhanced Raman nanographs of plasmonic silver nanoparticles. J Phys Chem C. 2019;123:27765–27769. doi: 10.1021/acs.jpcc.9b07811. [DOI] [Google Scholar]
- 84.Bhattarai A, Cheng Z, Joly AG, Novikova IV, Evans JE, Schultz ZD, et al. Tip-enhanced Raman nanospectroscopy of smooth spherical gold nanoparticles. J Phys Chem Lett. 2020;11:1795–1801. doi: 10.1021/acs.jpclett.0c00217. [DOI] [PubMed] [Google Scholar]
- 85.Laera S, Ceccone G, Rossi F, Gilliland D, Hussain R, Siligardi G, et al. Measuring protein structure and stability of protein–nanoparticle systems with synchrotron radiation circular dichroism. Nano Lett. 2011;11:4480–4484. doi: 10.1021/nl202909s. [DOI] [PubMed] [Google Scholar]
- 86.Schilt Y, Berman T, Wei X, Barenholz Y, Raviv U. Using solution X-ray scattering to determine the high-resolution structure and morphology of pegylated liposomal doxorubicin nanodrugs. Biochim Biophys Acta. 2016;1860:108–119. doi: 10.1016/j.bbagen.2015.09.012. [DOI] [PubMed] [Google Scholar]
- 87.Li T, Senesi AJ, Lee B. Small angle X-ray scattering for nanoparticle research. Chem Rev. 2016;116:11128–11180. doi: 10.1021/acs.chemrev.5b00690. [DOI] [PubMed] [Google Scholar]
- 88.Mao D, Wallace BA. Differential light scattering and absorption flattening optical effects are minimal in the circular dichroism spectra of small unilamellar vesicles. Biochemistry. 1984;23:2667–2673. doi: 10.1021/bi00307a020. [DOI] [PubMed] [Google Scholar]
- 89.Bustamante C, Maestre MF. Statistical effects in the absorption and optical activity of particulate suspensions. Proc Natl Acad Sci U S A. 1988;85:8482–8486. doi: 10.1073/pnas.85.22.8482. [DOI] [PMC free article] [PubMed] [Google Scholar]
- 90.Roke S, Gonella G. Nonlinear light scattering and spectroscopy of particles and droplets in liquids. Annu Rev Phys Chem. 2012;63:353–378. doi: 10.1146/annurev-physchem-032511-143748. [DOI] [PubMed] [Google Scholar]
- 91.Johansson PK, Schmüser L, Castner DG. Nonlinear optical methods for characterization of molecular structure and surface chemistry. Top Catal. 2018;61:1101–1124. doi: 10.1007/s11244-018-0924-3. [DOI] [PMC free article] [PubMed] [Google Scholar]
- 92.Burrows ND, Lin W, Hinman JG, Dennison JM, Vartanian AM, Abadeer NS, et al. Surface chemistry of gold nanorods. Langmuir. 2016;32:9905–9921. doi: 10.1021/acs.langmuir.6b02706. [DOI] [PubMed] [Google Scholar]
- 93.Weeraman C, Yatawara AK, Bordenyuk AN, Benderskii AV. Effect of nanoscale geometry on molecular conformation: vibrational sum-frequency generation of alkanethiols on gold nanoparticles. J Am Chem Soc. 2006;128:14244–14245. doi: 10.1021/ja065756y. [DOI] [PubMed] [Google Scholar]
- 94.Mathurin J, Pancani E, Deniset-Besseau A, Kjoller K, Prater CB, Gref R, et al. How to unravel the chemical structure and component localization of individual drug-loaded polymeric nanoparticles by using tapping AFM-IR. Analyst. 2018;143:5940–5949. doi: 10.1039/c8an01239c. [DOI] [PubMed] [Google Scholar]
- 95.Ramer G, Ruggeri FS, Levin A, Knowles TPJ, Centrone A. Determination of polypeptide conformation with nanoscale resolution in water. ACS Nano. 2018;12:6612–6619. doi: 10.1021/acsnano.8b01425. [DOI] [PMC free article] [PubMed] [Google Scholar]
- 96.Dou T, Li Z, Zhang J, Evilevitch A, Kurouski D. Nanoscale structural characterization of individual viral particles using atomic force microscopy infrared spectroscopy (AFM-IR) and tip-enhanced Raman spectroscopy (TERS) Anal Chem. 2020;92:11297–11304. doi: 10.1021/acs.analchem.0c01971. [DOI] [PubMed] [Google Scholar]
- 97.Wittemann A, Drechsler M, Talmon Y, Ballauff M. High elongation of polyelectrolyte chains in the osmotic limit of spherical polyelectrolyte brushes: a study by cryogenic transmission electron microscopy. J Am Chem Soc. 2005;127:9688–9689. doi: 10.1021/ja0513234. [DOI] [PubMed] [Google Scholar]
- 98.Saibil HR. Cryo-EM in molecular and cellular biology. Mol Cell. 2022;82:274–284. doi: 10.1016/j.molcel.2021.12.016. [DOI] [PubMed] [Google Scholar]
- 99.Brader ML, Williams SJ, Banks JM, Hui WH, Zhou ZH, Jin L. Encapsulation state of messenger RNA inside lipid nanoparticles. Biophys J. 2021;120:2766–2770. doi: 10.1016/j.bpj.2021.03.012. [DOI] [PMC free article] [PubMed] [Google Scholar]
- 100.Schoenmaker L, Witzigmann D, Kulkarni JA, Verbeke R, Kersten G, Jiskoot W, Crommelin DJA. mRNA-lipid nanoparticle COVID-19 vaccines: structure and stability. Int J Pharm. 2021;601:120586. doi: 10.1016/j.ijpharm.2021.120586. [DOI] [PMC free article] [PubMed] [Google Scholar]
- 101.Mansfield E, Kaiser DL, Fujita D, Van de Voorde M. Metrology and standardization for nanotechnology: protocols and industrial innovations. John Wiley & Sons; 2017
- 102.Halamoda-Kenzaoui B, Holzwarth U, Roebben G, Bogni A, Bremer-Hoffmann S. Mapping of the available standards against the regulatory needs for nanomedicines. Wiley Interdiscip Rev Nanomed Nanobiotechnol. 2019;11:e1531. doi: 10.1002/wnan.1531. [DOI] [PMC free article] [PubMed] [Google Scholar]
- 103.Sakai-Kato K, Nanjo K, Takechi-Haraya Y, Goda Y, Okuda H, Izutsu KI. Detailed morphological characterization of nanocrystalline active ingredients in solid oral dosage forms using atomic force microscopy. AAPS PharmSciTech. 2019;20:70. doi: 10.1208/s12249-018-1259-x. [DOI] [PubMed] [Google Scholar]
- 104.Lamberty A, Franks K, Braun A, Kestens V, Roebben G, Linsinger TPJ. Interlaboratory comparison for the measurement of particle size and zeta potential of silica nanoparticles in an aqueous suspension. J Nanopart Res. 2011;13:7317–7329. doi: 10.1007/s11051-011-0624-4. [DOI] [Google Scholar]
- 105.Bell NC, Minelli C, Tompkins J, Stevens MM, Shard AG. Emerging techniques for submicrometer particle sizing applied to Stober silica. Langmuir. 2012;28:10860–10872. doi: 10.1021/la301351k. [DOI] [PubMed] [Google Scholar]
- 106.Baalousha M, Lead JR. Rationalizing nanomaterial sizes measured by atomic force microscopy, flow field-flow fractionation, and dynamic light scattering: sample preparation, polydispersity, and particle structure. Environ Sci Technol. 2012;46:6134–6142. doi: 10.1021/es301167x. [DOI] [PubMed] [Google Scholar]
- 107.Brinkmann A, Chen M, Couillard M, Jakubek ZJ, Leng T, Johnston LJ. Correlating cellulose nanocrystal particle size and surface area. Langmuir. 2016;32:6105–6114. doi: 10.1021/acs.langmuir.6b01376. [DOI] [PubMed] [Google Scholar]
- 108.Iandolo F, Loia F, Fulco I, Nespoli C, Caputo F. Combining big data and artificial intelligence for managing collective knowledge in unpredictable environment—insights from the Chinese case in facing COVID-19. J Knowl Econ. 2021;12:1982–1996. doi: 10.1007/s13132-020-00703-8. [DOI] [Google Scholar]
- 109.Mughal MJH. Data mining: Web data mining techniques, tools and algorithms: an overview. Int J Adv Comput Sci Appl. 2018;9:208–15. 10.14569/IJACSA.2018.090630
- 110.Hou X, Zaks T, Langer R, Dong Y. Lipid nanoparticles for mRNA delivery. Nat Rev Mater. 2021;6:1078–1094. doi: 10.1038/s41578-021-00358-0. [DOI] [PMC free article] [PubMed] [Google Scholar]
- 111.Witzigmann D, Kulkarni JA, Leung J, Chen S, Cullis PR, van der Meel R. Lipid nanoparticle technology for therapeutic gene regulation in the liver. Adv Drug Deliv Rev. 2020;159:344–363. doi: 10.1016/j.addr.2020.06.026. [DOI] [PMC free article] [PubMed] [Google Scholar]
- 112.Duan L, Ouyang K, Xu X, Xu L, Wen C, Zhou X, et al. Nanoparticle delivery of CRISPR/Cas9 for genome editing. Front Genet. 2021;12:673286. doi: 10.3389/fgene.2021.673286. [DOI] [PMC free article] [PubMed] [Google Scholar]