

Summary
Background:
Idiopathic aplastic anemia is a potentially lethal disease, characterized by T-cell mediated autoimmune attack of bone marrow hematopoietic stem cells. Standard of care therapies (stem cell transplantation or immunosuppression) are effective but associated with a risk of serious toxicities.
Methods:
An 18-year-old man presented with aplastic anemia in the context of a germline gain-of-function variant in STAT1. Treatment with the JAK1 inhibitor itacitinib resulted in a rapid resolution of aplastic anemia and a sustained recovery of hematopoiesis. Peripheral blood and bone marrow samples were compared before and after JAK1 inhibitor therapy.
Findings:
Following therapy, samples showed a decrease in the plasma concentration of interferon-γ, a decrease in PD1-positive exhausted CD8+ T cells population, and a decrease in an interferon responsive myeloid population. Single cell analysis of chromatin accessibility showed decreased accessibility of STAT1 across CD4+ and CD8+ T cells, as well as CD14+ monocytes. To query whether other cases of aplastic anemia share a similar STAT1-mediated pathophysiology, we examined a cohort of patients with idiopathic aplastic anemia. Bone marrow from six of nine patients also displayed abnormal STAT1 hyper-activation.
Conclusions:
These findings raise the possibility that STAT1-hyperactivition defines a subset of idiopathic aplastic anemia patients for whom JAK inhibition may be an efficacious therapy.
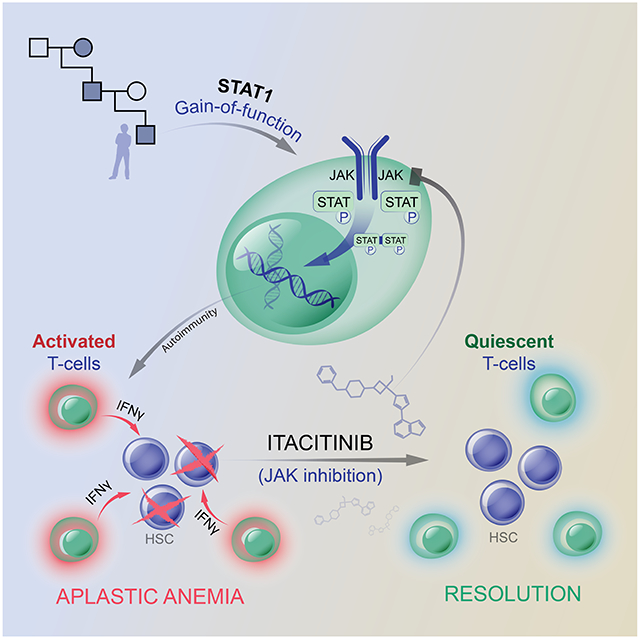
Graphical Abstract
eTOC blurb
Rosenberg et al. conduct a successful single patient trial of JAK inhibition in a patient with aplastic anemia in the setting of a gain-of-function STAT1 variant. They identify JAK/STAT activation in other aplastic anemia cases, suggesting the possibility that JAK inhibitors could have efficacy in patients with idiopathic aplastic anemia.
INTRODUCTION
Aplastic anemia is a potentially lethal disorder characterized by pancytopenia due to bone marrow failure. Patients typically present with fatigue, bleeding, or infection, from failures of erythropoiesis, thrombopoiesis, or leukopoiesis, respectively. Bone marrow failure can be caused by direct damage (e.g., toxins or radiation), rare genetic syndromes, infection, or, most commonly, idiopathic autoimmune T cell attack of hematopoietic stem cells.1 Evidence supporting an autoimmune etiology of aplastic anemia include the observation of bone marrow T cell infiltrates, increased frequencies of peripheral stem-like memory CD8+ T cells, and the observation of successful clinical responses to immunosuppression.1,2 Standard-of-care therapy includes allogeneic hematopoietic stem cell transplantation (HSCT) or intensive immunosuppression, however each of these modalities include significant risk of toxicities including graft versus host disease in HSCT and increased infection risk with immunosuppression.
STAT1 is a transcription factor downstream of Janus Kinase (JAK) signaling and involved in pathways critical to hematopoiesis, immunity, and development.3 More than 50 cytokines and growth factors, including interferons, signal through this pathway by binding to cognate receptors to effect surface receptor dimerization. Dimerization activates receptor-bound JAKs, which then phosphorylate and activate their target STAT proteins. STATs form either homo- or hetero-dimers, translocate into the nucleus, bind specific DNA sequences, and activate transcriptional programs.
Gain of function (GOF) variants in STAT1 cause an autosomal dominant syndrome with a wide spectrum of autoimmune features.4-6 Nearly all patients have chronic mucocutaneous candidiasis (CMC), and severe aphthous ulcers are frequent. More than 400 patients with more than 100 different STAT1 GOF variants have been reported, including p.Ala267Val, the variant that was ultimately identified in our patient.4,7-9 Aplastic anemia is not common but has been described as associated with STAT1 GOF, as have numerous autoimmune cytopenias.4,7,10,11 In addition, there are historical case reports (prior to the advent of personalized genetic sequencing methods) describing CMC associated with aplastic anemia.8,12,13 Given that STAT1 GOF accounts for more than half of genetic cases of CMC, one could speculate that these patients may have had undiagnosed STAT1 GOF variants.
The immunologic mechanism underlying susceptibility to CMC in STAT1 GOF has been attributed to increased TH1 activity and to defects in TH17 immunity; STAT1 GOF patients have increased frequencies of TH1 and decreased frequencies of TH17 T cells14,15. Increased STAT1 signaling biases T cell differentiation towards the TH1 phenotype, which is characterized by secretion of interferon-γ. At the same time, TH1 differentiation biases naïve T cells away from STAT3-mediated TH17 differentiation, resulting in the loss of those TH17 cells responsible for the secretion of IL-17A and other cytokines critical for immunity to mucocutaneous Candida species.15,16 Recently in a mouse model of Autoimmune Polyendocrine Syndrome 1 (APS-1), CD4+ and CD8+ T cells have been shown to secrete excessive levels of interferon-γ but normal levels of IL-17, leading to a STAT1-mediated disruption of the epithelial barrier, and increasing susceptibility of the mice to mucocutaneous candidiasis.17 This suggests that excessive interferon-γ responses and epithelial barrier damage may also contribute to CMC. Thus, the pathogenesis of CMC in STAT1 GOF disease may be multifactorial, due to both increased TH1 interferon-γ activity and decreased TH17 activity.
How STAT1 variants lead to GOF activity has been extensively investigated, but the precise mechanism remains controversial. STAT1 GOF variants clearly demonstrate increased phosphorylation in response to stimulation, leading to increased STAT1-dependent transcription.8,18-20 Clinically identified variants and site-directed mutagenesis studies have shown that GOF variants localize predominantly to the coiled-coil and DNA-binding domains, at the interface of the antiparallel homodimer of STAT1, likely destabilizing the inactive conformation.19 A decreased rate of STAT1 dephosphorylation may also contribute to the GOF phenotype, and studies report both normal and impaired dephosphorylation.8,14,21-23 Taken together, multiple studies have reproducibly shown that many discrete mutations in STAT1 can lead to a GOF phenotype.
Here, we describe a patient with a STAT1 GOF variant who presented with aplastic anemia. Given that the off-label use of JAK inhibitors have been successful in the treatment of many autoimmune manifestations of STAT1 GOF disease, our patient began therapy in the context of a trial with the JAK1-selective inhibitor itacitinib while preparing for HSCT.10,24-29 The patient had a rapid and remarkable recovery of hematopoiesis after initiation of itacitinib. In comparing pre-treatment and post-treatment samples, an exhausted CD8+ T cell population was identified that correlated with disease activity. This led us to query whether a similar pattern of STAT1 hyperactivation might be present in other cases of idiopathic aplastic anemia which were not associated with a congenital STAT1 GOF variant. Indeed the majority (6 out of 9) of idiopathic aplastic anemia cases displayed increased STAT1 activity by phospho-STAT1 staining of bone marrow core sections. These findings raise the clinical question of whether patients with idiopathic aplastic anemia who display STAT1 hyperactivation may similarly benefit from JAK inhibitor therapy, a question which should be addressed in the context of a randomized trial. This case demonstrates how the careful study of patients with rare inborn errors of immunity can lead to pathophysiologic insights and to potential therapies which may be more broadly applicable.30
RESULTS
Case presentation and aplastic anemia diagnosis
An 18-year-old man presented with 3 weeks of pallor, weakness, and dyspnea. On exam, he was pale but well appearing with a body mass index of 17. He had painful oral ulcers and chronic mucocutaneous candidiasis (CMC) on the soft palate. His peripheral blood laboratory values were notable for pancytopenia with a hemoglobin level of 3.9 g/dL (reference range 12-16 g/dL) without signs of hemolysis, a white blood cell count nadir of 350 cells/μl (reference range 4,500-11,000 cells/μl), an absolute neutrophil count nadir of 210 cells/μl (reference range 1,800-7,700 cells/μl), and a platelet count of 118,000/μl (reference range 140,000-430,000 platelets/μl). He was urgently transfused red blood cells, and a bone marrow biopsy demonstrated hypocellularity (20-30% cellularity) with a myeloid predominance, absent erythroid precursors, and decreased megakaryocytes. An extensive infectious and rheumatologic workup was unrevealing (Fig. S1). Testing for paroxysmal nocturnal hemoglobinuria, Fanconi anemia, and telomere shortening diseases were all negative. Bone marrow panel mutational testing, karyotypic analysis, and T-cell receptor spectrotyping were normal. Bone marrow flow cytometry demonstrated that CD3+ T cells were 26% of bone marrow cells, and the CD4:CD8 ratio was 1 (normal). Though his platelet count remained relatively preserved, criteria of peripheral neutrophils <500/mL, reticulocytes < 1%, and bone marrow hypocellularity, confirmed a diagnosis of severe aplastic anemia.31
His past medical history was notable for recurrent severe oral aphthous ulcers since childhood, for which he had taken prednisone 10 mg daily on an as needed basis during flares for years. He also suffered from oral CMC since childhood. This caused him only mild discomfort, and he was prescribed nystatin oral suspension.
The patient and his family were of Puerto Rican descent. His family history was remarkable in that his father, paternal grandmother, paternal uncle, and at least 2 half-siblings on his paternal side from 2 different mothers also suffered from recurrent oral aphthous ulcers since early childhood. Construction of a pedigree suggested an autosomal dominant pattern of inheritance for the phenotype of severe oral ulcers (Fig. 1A). The patient’s father also suffered from CMC, but we were unable to contact other family members to confirm or exclude CMC in these individuals. No other family members were known to have had aplastic anemia. The patient’s paternal grandmother did pass away at a young age in Puerto Rico from what was described as a spontaneous “brain bleed”.
Figure 1: Clinical presentation and response to treatment with itacitinib.

A. Family pedigree. The phenotype of severe oral ulcers is denoted by shaded symbols (males = squares, females = circles). The patient (red arrow) and his father (blue arrow) are both heterozygous for the A267V mutation.
B. Schematic of STAT1 protein domains and its tyrosine phosphorylation site (pY). Black bars represent known STAT1 GOF mutations, the red bar represents the patient’s mutation, and confirmatory Sanger sequencing of the mutation is shown.
C. Peripheral blood laboratory values including hematocrit, % reticulocytes, white blood cell count (WBC) and absolute neutrophil count (ANC) are plotted before and after treatment with itacitinib. The Green arrow at day 0 indicates the initiation of itacitinib.
D. Bone marrow hematoxylin and eosin (H&E) and phosphorylated STAT1 (pSTAT1) immunohistochemical staining are shown for a healthy donor (left) and the patient (right), both before and after initiation of itacitinib.
Identification of a pathogenic STAT1 gain-of-function variant
Given the autosomal dominant inheritance pattern of the patient’s aphthous lesions and unclear etiology of his aplastic anemia, whole exome sequencing of the patient and his father was performed. A heterozygous variant (c.800C>T, p.Ala267Val) in the coiled-coil domain of STAT1 was identified in both patient and father and was confirmed by Sanger sequencing (Fig. 1B).
Rigorous criteria have been established to determine the causality of a genotype for a given phenotype in single patient studies.32 The p.Ala267Val variant identified in our patient has been classified as pathogenic because it is 1) absent from large population databases, 2) has been identified in more than 10 individuals from multiple families with chronic mucocutaneous candidiasis, and 3) has been shown in vitro to have GOF activity.7,22 Thus p.Ala267Val was taken to be causal for the patient’s oral ulcers and CMC. An extensive workup of the patient’s aplastic anemia ruled out toxin-mediated, hematologic, rheumatologic, and infectious etiologies. Given that aplastic anemia has been associated with STAT1 GOF, the patient’s p.Ala267Val variant was deemed to be causal for the patient’s aplastic anemia as well, though it is impossible to exclude the possibility that aplastic anemia developed coincidentally in the setting of our patient’s STAT1 GOF mutation.4,7,10,11
Treatment with itacitinib leads to resolution of the patient’s aplastic anemia
The patient remained dependent on weekly red blood cell transfusions, and he was thrice admitted to the hospital for febrile neutropenia. Preparations were made for hematopoietic stem cell transplantation, a standard of care treatment modality, and his younger brother was identified as a matched donor. However, the patient was hesitant to consent and did not wish to move forward with the recommended HSCT.
As STAT1 activation is heavily dependent on JAK signaling, the JAK inhibitors ruxolitinib and tofacitinib have been attempted as therapies in STAT1 GOF patients. Successful and unsuccessful cases have been reported for the treatment of STAT1 GOF-associated alopecia, diabetes, CMC, fungal infections, and autoimmune cytopenias.10,24-29 Ruxolitinib and tofacitinib inhibit both JAK1 and JAK2 family members. As an unwanted side-effect, JAK2 inhibition has the potential to cause anemia and thrombocytopenia, since JAK2 is downstream of the erythropoietin and thrombopoietin receptors. In considering a JAK inhibitor, we thus sought to target JAK1 inhibition while avoiding JAK2 inhibition. The investigational drug itacitinib is a potent JAK1 inhibitor with an IC50 of 3.2 nM and selectivity for JAK1.33 Itacitinib has been studied in myeloproliferative neoplasms, graft-versus-host disease, and autoimmune disorders.34
We designed and enrolled the patient in a single patient expanded use trial of itacitinib (https://clinicaltrials.gov/ct2/show/NCT03906318). We did not recommend a delay of standard of care treatment for an experimental therapy, but rather given the patient’s complex social circumstances and hesitancy to proceed with HSCT, a therapeutic trial of itacitinib was initiated while preparing for HSCT.
On day 169 after presentation, our patient received his weekly red blood cell transfusion and initiated itacitinib at a dose of 300 mg daily. The following week, and for all subsequent visits after the initiation of itacitinib, laboratory values demonstrated resolution of neutropenia and anemia, and the patient became red blood cell transfusion independent (Fig. 1C). A repeat bone marrow biopsy demonstrated a return of trilineage hematopoiesis. Increased bone marrow STAT1 signaling, as measured by immunostaining for the activated phospho-STAT1 (pSTAT1), was present at the time of diagnosis but resolved after treatment with itacitinib (Fig. 1D). The patient’s CMC and oral ulcers persisted but were less frequent and less severe. Clinically, fatigue and weight loss resolved, and he successfully graduated from high school. He completed 20 months of itacitinib therapy without any adverse events at which point he self-discontinued itacitinib and was temporarily lost to follow up despite multiple attempts to reach the patient. After 4 months, we successfully contacted the patient who reported an increased frequency of oral ulcers, though his hematologic parameters remained stable. Aplastic anemia has not recurred, now 3 years since his initial presentation and approximately 12 months off of itacitinib therapy.
Immunophenotyping reveals an exhausted population of CD8+ T-cells
Extensive immunophenotyping was performed to understand the cellular mechanisms involved in the pathogenesis and resolution of the patient’s aplastic anemia. To confirm the previously described GOF activity of the STAT1 p.Ala267Val variant, we used phospho-CyTOF to measure phospho-STAT1 in peripheral blood mononuclear cells following stimulation with interferon-γ at 4 timepoints before and after initiation of itacitinib. At all timepoints, patient monocytes displayed higher levels of pSTAT1 than the healthy control. Following the initiation of treatment with itacitinib, pSTAT1 levels decreased, though not to the level of healthy controls (Fig. 2A).
Figure 2: Immunophenotyping.

A. Phospho-CyTOF histograms of pSTAT1 after in vitro stimulation with interferon-γ. Shown are pSTAT1 levels in monocytes from a healthy control and from the patient before (2 time points) and after (2 time points) initiation of itacitinib treatment.
B. Plasma cytokine levels measured in units of mean fluorescent intensity (MFI) from the patient at six time points (specified in c.) pre- and post-itacitinib.
C. Intracellular IFN-γ following in vitro stimulation in CD4+ memory T cells (CD45RO+) shown both as histograms and as gated percent of cells.
D. Intracellular IFN-γ following in vitro stimulation in CD8+ memory T cells (CD45RO+) shown both as histograms and as gated percent of cells.
E. Programmed Death 1 (PD-1) expression levels on CD8+ T cells shown both as histograms and as the gated percent of cells.
(c.– e.) N = 4 distinct healthy donors were tested. Patient samples were tested from n = 6 distinct time points, with the specified number of weeks before or after initiation of itacitinib.
(c.– d.) PBMCs were stimulated in vitro with PMA/ionomycin.
(b.- e.) Statistical analyses performed using unpaired t-test.
It has been hypothesized that JAK inhibition may restore the balance between TH1 and TH17 differentiation by dampening the degree of STAT1 signaling.10 We interrogated the TH1 and TH17 pathways in our patient by comparing plasma cytokine levels pre- and post- treatment with itacitinib at 6 time-points. This identified significant decreases in the TH1 cytokines interferon-γ and IL-12p40 following therapy, but no significant shifts in the TH17 cytokines IL-17A or IL-17F (Fig. 2B). Of note, elevations in serum interferon-γ have been described in patients with idiopathic aplastic anemia.35
Peripheral blood CD4+ T cells were interrogated by intracellular cytokine staining. The frequency of IL-17A-producing CD4+ T cells (TH17) was decreased in the patient compared to healthy controls, consistent with prior reports;14 these frequencies did not change after treatment with itacitinib (Fig. S2B). The frequency of interferon-γ-producing CD4+ T cells (TH1) did not differ between healthy controls and the patient pre-itacitinib or post-itacitinib (Fig. 2C). Thus, in our patient, itacitinib did not appear to restore the balance between STAT1-mediated CD4+ TH1 cells and STAT3-mediated TH17 cells.
We also observed other abnormalities in peripheral blood mononuclear cells (PBMC) including a near absence of Treg cells, elevated frequencies of memory CD4+ and CD8+ T cells, and reduced frequencies of T follicular helper (TFH) cells in the patient compared to healthy controls (Fig. S2A); none of these frequencies changed significantly after itacitinib treatment. Regarding the low frequency of Treg seen in our patient both before and after treatment, the majority of publications have described normal frequencies of Treg in STAT1 GOF patients, but patients with decreased frequencies have also been reported.36-38 Decreased frequencies of Treg have more consistently been described in association with aplastic anemia, so we would speculate that our patient’s decreased Treg frequencies may more likely be secondary to his aplastic anemia process than his STAT1 variant.39
We found that the patient’s pre-treatment CD8+ T cells produced significantly less interferon-γ upon stimulation in vitro than healthy controls, but following treatment with itacitinib, CD8+ T cell interferon-γ production normalized (Fig. 2D). The patient’s pre-itacitinib memory CD8+ T cell population also displayed a striking increase in surface expression of the activation and exhaustion marker Programmed Death 1 (PD-1), and PD-1 levels decreased after itacitinib treatment (Fig. 2E). In the setting of chronic infection or autoimmunity, expression of activation markers like PD-1, as well as failure to secrete cytokine upon in vitro stimulation, are features of exhausted T cells,40 and exhausted T cells have been described in the setting of aplastic anemia.2 Given the patient’s CD8+ T cells expressed high levels of PD-1, lost effector function in vitro, and correlated with the patient’s chronic autoimmune disease (aplastic anemia), we classified these cells as exhausted CD8+ T cells. We then characterized their transcriptional signature to confirm and further define their exhausted phenotype.
Single-cell RNA-seq demonstrates a peripheral CD8+ T cell population expressing interferon-γ and an interferon-γ stimulated myeloid population
To evaluate the transcriptional changes governing our patient’s aplastic anemia, we performed single-cell transcriptomic analysis (scRNA-Seq), comparing PBMCs from healthy controls and our patient at 6 timepoints before and after the initiation of itacitinib. Cells were thawed and processed in parallel on the same day to decrease the potential for batch effects. Unsupervised clustering demonstrated known cell types. Healthy, pre-itacitinib, and post-itacitinib cells clustered closely within the same condition (Fig. 3A). T cell and myeloid populations were sub-clustered for further analysis.
Figure 3: Single-cell transcriptional and epigenetic profiling.

A. Unsupervised clustering of all cells by scRNA-Seq expression profiling in Uniform Manifold Approximation and Projection (UMAP) space. Cells are colored by sample (left) or cell type (middle). n=4 different healthy control samples, n=3 pre-itacitinib time points, and n=3 post-itacitinib time points. Stacked bar plot shows cell proportions by condition (right). “Myeloid” includes CD14+ monocytes, CD16+ monocytes, and type 2 conventional dendritic cells (cDC2). “Other” cells include plasma cells, platelet-like cells, progenitor-like cells, and proliferating cells.
B. Sub-clustering of T cell-containing populations (top left). The CD8+ T cell population (olive green) was scored for exhaustion, cytotoxicity, and cytokine effector function.
C. Sub-clustering of myeloid populations (top left). Each myeloid cell was scored (top right) by its Type I interferon score (x-axis) and Type II interferon score (y-axis). Histograms of these scores by condition are shown on the plot edge. Each myeloid cell was then displayed by condition and colored by its Type II interferon score (bottom figures).
D. scATAC-seq accessibility peaks at the PD-1 locus in healthy control PBMC and the patient’s PBMC at n = 5 time points. Red box highlights peak differences between samples.
E. scATAC-seq genome-wide accessibility at STAT1 binding motif sites. Each cell was scored by STAT1 accessibility across cell types and conditions. Patient PBMC were scored at the same n = 5 time points as listed in (d).
b.-e. P values calculated using Wilcoxon rank-sum test using each cell as an individual observation.
The T cell cluster from the patient and healthy controls subclustered into CD8+ T, NK, memory T, and naïve T cell populations (Figs. 3B, SM1). Given the activated but dysfunctional state of our patient’s CD8+ T cells in vitro, cells in the CD8+ T subcluster were scored for cytotoxicity (including GZMK, GNLY, CCL5), cytokine effector function (including IFNG, CCL3, TNF) and exhaustion (including PDCD1, LAG3, CCL5) (the full list of genes can be found in Table S1).41 Each of these scores were elevated in the patient’s pre-itacitinib cells compared to healthy controls, confirming their cytotoxic and exhausted phenotype. Following treatment with itacitinib, exhaustion and cytokine effector scores significantly decreased (Fig. 3B). Mean cytotoxicity scores decreased but this did not reach statistical significance, which could be due to inadequate sample size or true biology where cytotoxicity does not decrease following JAK inhibition. We would note that though cytotoxic, effector, and exhausted CD8+ T cells have been defined by unique functions, these cells can exist upon a spectrum in transcriptomic space and can express overlapping patterns of gene expression.42,43 We determined statistical significance by performing a Wilcoxon rank-sum test of all individual cells between groups.
Our finding of increased expression of effector cytokines in the patient’s pre-treatment CD8+ T cells supports but does not prove the hypothesis that CD8+ T cells are the source of the patient’s elevated plasma interferon-γ (Fig. 2B), and that due to their exhausted phenotype, these cells have become poor secretors of interferon-γ upon stimulation in vitro. Specifically interrogating the expression of interferon-γ in CD8+ T cell cells, both the frequency of interferon-γ-secreting cells and the mean interferon-γ transcript levels were higher in pre-itacitinib samples than in healthy controls (Fig. S3). This suggests that in our patient, the mechanism of exhausted CD8+ T cell failure to secrete interferon-γ upon stimulation in vitro is a post-transcriptional defect. Failure to secrete cytokine in vitro despite robust transcription of that cytokine’s transcript has been described in T cell exhaustion.42
Subclustering of myeloid cells identified five distinct populations (Fig. 3C). Activated CD14+ monocytes and C1Q+ monocytes were found almost exclusively in the patient samples and not in healthy controls. Notably, both of these patient-specific subclusters expressed STAT1-inducible genes including the interferon-inducible genes FAM26F and GBP1 and complement genes C1QC, C1QB, C1QA, respectively (Fig. SM1). Type I interferons (α, β, and others) and Type II interferon (only γ) induce overlapping but distinct transcriptional signatures.44,45 To query whether the interferon signature observed in monocytes was driven primarily by Type I or Type II interferon, we scored each myeloid cell for Type I and II interferon scores (Table S1). Both scores were higher in pre-treatment monocytes than healthy controls, and both scores decreased significantly post-itacitinib, though not down to the level of healthy controls. This pattern suggests that our patient’s STAT1 activity was elevated even in the setting of JAK1 inhibition. A higher dose of itacitinib may be able to further inhibit STAT1 signaling and may be of interest in future clinical trials.
Comparing the magnitude of monocyte Type I versus Type II interferon scores, Type II scores were significantly higher, suggesting that monocytes were responding more to Type II (γ) than Type I interferon (p<10−10, Wilcoxon rank-sum) (Fig. 3C). This points to a model whereby an activated and exhausted CD8+ memory T cell population activates peripheral blood myeloid populations via interferon-γ.
Monocytes that respond to interferon-γ can release the cytokines CXCL9 and CXCL10 to instruct T cells to further secrete interferon-γ.46 Indeed, CXCL10 transcription was increased in pre-itacitinib samples, and enriched within the activated CD14+ monocyte cluster (Fig. S3E). This suggests a positive feedback loop where monocyte-secreted CXCL10 stimulates T cells to further secrete interferon-γ. To test this, we also measured levels of soluble CXCL9 and CXCL10 in plasma but detected no significant difference between pre- and post-treatment (Fig. S3F&G). This discrepancy between our transcriptional and plasma protein results could be due to 1) lack of sensitivity of our plasma protein assay 2) lack of statistical power in plasma samples 3) differences in protein concentrations in plasma versus tissue, or 4) differences only at the mRNA and not protein level.
Since the patient’s STAT1 GOF variant is germline and present in both CD8+ T cells and monocytes, the threshold for STAT1 activation is likely lower in both cell types, and our transcriptional data support such a model.46
STAT1 chromatin accessibility is reversed with itacitinib treatment
To understand the epigenetic changes driven by the STAT1 GOF variant and then by treatment with itacitinib, we performed single-cell Assay for Transposase-Accessible Chromatin with Sequencing (scATAC-seq). The expected clusters of known cell types were generated, within which we were able to query cell-type specific epigenetic changes. With a focus on effector CD8+ T cells, we observed increased accessibility at the PDCD1 (PD-1) locus, which has been observed in human and mouse ATAC-seq profiling of exhausted T cells.47 Increased PDCD1 accessibility correlated with increased transcription and increased surface protein expression of PD-1 (Fig. 2E), both of which decreased after treatment (Fig. 3D and SM2B). This suggests either that PDCD1 accessibility in CD8+ T cells was reversed following treatment with itacitinib, or that the peripheral CD8+ T cell population was replenished with non-exhausted CD8+ T cells with decreased PDCD1 accessibility. In a murine model of chronic infection, blockade of PD-L1 was unable to reverse exhaustion and PDCD1 accessibility.48 Our finding of exhaustion reversal after itacitib raises the possibility that JAK inhibitors may also be useful adjunctive therapy in reversing T cell exhaustion in instances where checkpoint blockade is inadequate.
Genome-wide, STAT1 motif accessibility was increased in pre-itacitinib samples when compared to healthy controls and post-itacitinib samples (Fig. 3E). These findings were observed across populations of CD8+ T cells as well as CD4+ T cells and monocytes. Overall, these data show that STAT1 GOF-mediated epigenetic changes were widespread, and that changes in chromatin accessibility were reversible following treatment with itacitinib.
Bone marrow STAT1 activity is upregulated in patients with idiopathic aplastic anemia
To determine whether a similar pattern of STAT1 dysregulation exists in patients with idiopathic (non-STAT1-mutated) aplastic anemia, we reviewed pre-treatment bone marrow tissue sections from a series of aplastic anemia cases. Nine patients were identified that met criteria for idiopathic aplastic anemia after extensive laboratory and genetic work-up. Compared to healthy donor bone marrow sections in which no phospho-STAT1 (pSTAT1) staining was detected, 6 out of the 9 marrows exhibited increased pSTAT1 staining (Fig. 4). This suggests that, for a significant subset of idiopathic aplastic anemias, STAT1 activation is a more generalizable feature. This raises the exciting possibility that bone marrow pSTAT1 could be a biomarker for a subgroup within idiopathic aplastic anemia. This subgroup of patients would be ideal candidates for larger trials of JAK inhibitor therapy.
Figure 4: Bone marrow STAT1 activation in historical aplastic anemia cases.

a. Bone marrow hematoxylin and eosin (H&E) stains and phosphorylated STAT1 (pSTAT1) immunostains are shown for n = 4 distinct healthy controls and
b. n = 9 distinct patients with idiopathic aplastic anemia (AA) at the time of diagnosis. Blinded hematopathologic interpretation of pSTAT1 (positive or negative) is denoted below each image. Note that HC 1 is also shown in Fig 1.
DISCUSSION
Here we present a patient with a history of chronic mucocutaneous candidiasis and oral ulcers inherited in an autosomal dominant pattern who developed severe aplastic anemia. Exome sequencing identified a pathogenic GOF variant in STAT1. Given that JAK inhibitors have been successfully used as treatment in patients with STAT1 GOF for other autoimmune sequelae, we initiated treatment with the JAK1-inhibitor itacitinib. Itacitinib treatment was followed by prompt resolution of the patient’s aplastic anemia.
Prospectively collected samples (unperturbed by confounding immunosuppressive therapy) provided an opportunity for immunophenotyping and other analyses. This revealed an increase in plasma levels of interferon-γ as well as an expanded, activated, cytolytic, and exhausted memory CD8+ T cell population. Both findings correlated with disease activity and were decreased following treatment with itacitinib. Consistent with our results, elevated frequencies of PD-1 high CD8+ T effector memory cells have been reported in mouse and human models of aplastic anemia.2,49 This suggests a model whereby the patient’s inherited STAT1 GOF mutation increased his risk for aplastic anemia by triggering a positive feedback loop between CD8+ T cells secreting interferon-γ and interferon-responsive monocyte populations that in return secreted cytokines including CXCL10, further activating the CD8+ T cell attack on the patient’s hematopoietic stem cells.
Limitations of Study
This case raises two important clinical questions. First, was the patient’s STAT1 GOF variant causal for his aplastic anemia? Our clinical impression is that the patient’s STAT1 GOF variant was causal for his aplastic anemia based on the fact that A) an extensive work-up ruled out toxin-mediated, rheumatologic, and infectious etiologies, and B) prior reports of aplastic anemia have been associated with STAT1 GOF variants.4,7,10,11 Though it remains possible that the patient’s aplastic anemia was idiopathic and unrelated to his STAT1 variant, even if this were the case, that would strengthen the rationale for the potential utility of JAK inhibitor therapy in other cases of idiopathic aplastic anemia. Second, was itacitinib responsible for the patient’s aplastic anemia remission? Establishing the causality of a therapy in an n-of-1 trial is challenging, but guidelines exist to help weigh the level of evidence.32,50 Multiple lines of evidence support the hypothesis that treatment with itacitinib was responsible for our patient’s disease remission. After 6 months of transfusion-dependence, it would be unlikely for spontaneous remission of aplastic anemia to fortuitously coincide with the initiation of itacitinib. Historical reports of aplastic anemia also suggest a low expected rate of spontaneous recovery, particularly after such a long duration of cytopenias.1 Arguing against itacitinib being causal for disease remission is the rapidity of our patient’s disease resolution; typically in cases of standard immunosuppressive therapy for aplastic anemia, a therapeutic effect occurs weeks later, after abatement of T cell attack of the marrow and a repopulation of the hematopoietic lineage. Ultimately, randomized controlled trials are needed to determine the efficacy of JAK inhibition in aplastic anemia, but we find this patient’s response compelling and hope these results spur such trials.
Conclusions
To our knowledge, this represents the first report of a targeted therapy for the treatment of autoimmune aplastic anemia. While STAT1 GOF is a rare condition, aplastic anemia is more common. While we designed this trial of itacitinib with our patient’s STAT1 GOF mutation in mind, we found strikingly that 6 of 9 cases in a cohort of idiopathic aplastic anemia also demonstrated increased pSTAT1 on bone marrow immunostaining, suggesting similar pathways of STAT1 dysregulation. In support of the centrality of the STAT1 pathway in aplastic anemia, CD8+ T cell somatic mutations enriched for functions within the JAK-STAT signaling pathway in have been reported.51 Our patient’s immunophenotypic similarities to historical cases of aplastic anemia raise the possibility of an unexpected shared downstream pathophysiology for which JAK inhibitor therapy could be effective, and pSTAT1 bone marrow staining may be a useful biomarker to identify candidate patients. Our case highlights how targeted therapies for single patients with inborn errors of immunity can shed light on fundamental disease processes and raise avenues of investigation for more common diseases.
STAR Methods
RESOURCE AVAILABILITY
Lead contact
Further information and requests for resources and reagents should be directed to and will be fulfilled by the lead contact, Jacob Rosenberg (JRosenberg2@mgh.harvard.edu).
Materials availability
This study did not generate new unique reagents.
Data and code availability
Single-cell RNA-seq data have been deposited at Zenodo and are publicly available as of the date of publication. Accession numbers are listed in the key resources table. The DOI is listed in the key resources table.
All original code has been deposited at Zenodo and is publicly available as of the date of publication. DOIs are listed in the key resources table.
Any additional information required to reanalyze the data reported in this paper is available from the lead contact upon request.
KEY RESOURCES TABLE
| REAGENT or RESOURCE | SOURCE | IDENTIFIER |
|---|---|---|
| Antibodies | ||
| Phospho-STAT1 antibody | Cell Signaling Technology | Cat No. 9167 |
| PD1 | BD | 745619 |
| CXCR3 | BioLegend | 353716 |
| viability | BD | 564907 |
| CD45RA | eBioscience | 11-0458-42 |
| CCR6 | BD | 551773 |
| CXCR5 | BD | 558113 |
| CD127 | BD | 560551 |
| CD8 | Biolegend | 300920 |
| CD4 | BD | 341095 |
| CD25 | BD | 557741 |
| IL17 | biolegend | 512333 |
| IFNg | BioLegend | 506525 |
| CD3 | BioLegend | 300427 |
| CD4 | biolegend | 300508 |
| CD8 | BD | 563795 |
| CD45RO | BD | 560608 |
| CD45RA | BD | 561882 |
| Chemicals, peptides, and recombinant proteins | ||
| interferon-γ | BD Biosciences | 554617 |
| Critical commercial assays | ||
| 62-plex Procarta | Luminex | EPXTL650-10065-901 |
| Deposited data | ||
| Single cell transcriptional and ATAC seq raw data and code | This paper | 10.5281/zenodo.5747633 |
| Oligonucleotides | ||
| STAT1 variant was performed by Sanger sequencing with the following primer sequences. Forward primer: CCTCCACAAACTCTCTTGCC. Reverse primer: TTAAACCCTTGTAAATCATCTGAA | This paper | N/A |
| Software and algorithms | ||
| Seurat v3.0 | https://www.sciencedirect.com/science/article/pii/S0092867419305598#sec4 | https://github.com/satijalab/seurat |
| R | R Core | https://www.r-project.org/ |
| Harmony v0.1.0 | https://pubmed.ncbi.nlm.nih.gov/31740819/ | https://github.com/immunogenomics/harmony |
| Igraph v1.2.6 | https://github.com/igraph/igraphdata | https://github.com/igraph/igraphdata |
| Drop-seq tools v2.0.0 | McCarroll Lab | https://github.com/broadinstitute/Drop-seq |
| Signac | https://www.nature.com/articles/s41592-021-01282-5?proof=tr | https://github.com/timoast/signac |
| chromVAR | https://www.nature.com/articles/nmeth.4401 | https://github.com/GreenleafLab/chromVAR |
| CellRanger-ATAC v1.2 | 10X Genomics | https://support.10xgenomics.com/single-cell-atac/software/overview/welcome |
| FlowJo | www.flowjo.com | |
| Prism | https://www.graphpad.com/scientific-software/prism/ | |
| Biorender | www.biorender.com | |
| Other | ||
EXPERIMENTAL MODEL AND SUBJECT DETAILS
The patient described was an 18 year-old man at the time of presentation. The patient provided informed consent. Sample collection, genetic sequencing, and bone marrow pathology were approved by our institutional review board (IRB), protocols #2017P000108, #2014P000460/BWH, 2020P001858. Itacitinib treatment was also approved by our IRB protocol #18-326, www.clinicaltrials.gov NCT03906318, and the U.S. Food and Drug Administration (F.D.A.).
METHOD DETAILS
Panel Mutation Genotyping
A clinically validated next-generation sequencing–based multiplex mutation screening assay (SNaPshot) of bone marrow specimens was performed as previously described.52 This assay tests for mutations in 104 genes associated with myeloid and lymphoid neoplasms.
Exome Sequencing
Peripheral blood DNA extraction, library preparation, exome capture, and sequencing were performed by the Genomics Platform of the Broad Institute of Harvard and MIT (Cambridge, MA). Sequencing covered 96% of exome targets with 20X coverage or higher. Reads were aligned to the human reference sequence (GRCh37) using the Burrows-Wheeler Aligner (BWA), and variant calls were made using the Genomic Analysis Tool Kit (GATK). Variants were filtered for: (1) variants classified as disease causing mutations in public databases that have a minor allele frequency <5.0% in the Genome Aggregation Database (gnomAD, http://gnomadexac.broadinstitute.org/); (2) nonsense, frameshift, and +/−1,2 splice-site variants in disease-associated genes with a minor allele frequency ≤1.0% in gnomAD; and, (3) variants with a minor allele frequency ≤1.0% in gnomAD in a phenotype-driven gene list.
Sanger Sequencing
Clinical confirmation of the STAT1 variant was performed by Sanger sequencing with the following primer sequences. Forward primer: CCTCCACAAACTCTCTTGCC. Reverse primer: TTAAACCCTTGTAAATCATCTGAA.
Cryopreservation of Peripheral Blood Mononuclear Cells
Samples were aliquoted into 50ml falcon tubes and centrifuged at 500g for 15 min. Plasma was pipetted off and aliquoted/saved. Buffy coat with 5mL PBS was layered onto 5mL of Ficoll in a fresh 15mL Falcon tube. Tubes were spun for 25min at 400g. Buffy coat was washed in PBS, resuspended in RPMI media and added in equal volume to 20% DMSO and 80% FBS, and cryopreserved in liquid nitrogen for subsequent analysis via flow cytometry and single cell genomics.
Single-cell RNA-Sequencing
Single-cell mRNA sequencing was performed using the Seq-Well platform.53 Ten samples were analyzed: 4 samples from 4 distinct healthy controls, 3 samples from the patient pre-itacitinib treatment, and 3 samples from the patient post-itacitinib treatment. Each patient sample was from a separate blood draw separated by at least 1 week. For each sample, 20,000 cells were applied to a Seq-Well device pre-loaded with mRNA capture beads, as previously described. Following cell loading, devices were reversibly sealed, cells were lysed, and mRNA was hybridized to bead-bound capture oligos. Beads were removed from arrays and reverse transcription was performed along with randomly templated second-strand synthesis. Following PCR amplification, sequencing libraries were prepared using the Illumina Nextera system, and sequencing was performed on an Illumina NextSeq using 75 cycle v2 sequencing kits. Demultiplexed sequencing reads were aligned to the hg19 assembly of the human genome using DropseqTools v2.0.
Single-cell mRNA-sequencing data was analyzed using Seurat v3.0. UMI counts were normalized to total UMIs in each cell and represented as transcripts-per-10,000 (TP10K). We then took log(1+TP10K), scaled, and centered for input into PCA. PCA was performed on the top 3,000 variable genes. Downstream PCA dimensions were determined using translated Poisson distributions (R package intrinsicDimension). The reduced PCA cell embeddings matrix (1:18 PCs) were corrected for array-specific effects using Harmony (R package Harmony).54 The batch-corrected embeddings were utilized to generate a shared nearest-neighbor graph for clustering (k-NN = 20, R package Seurat). Cells were then clustered with the walktrap algorithm (R package igraph, steps = 4). UMAP visualizations were generated on both original and batch-corrected PCA embeddings. Gene list scores were generated for each cell by averaging the expression of all genes in the list and then subtracting the average expression of 30 control genes matched by expression level bin per gene in the gene list. Differentially-expressed genes were identified using the Wilcoxon Rank-Sum test and logistic regression model with batch as a latent covariate and likelihood ratio test (R package Seurat).
Single-cell Assay for Transposase-Accessible Chromatin with Sequencing
Single-cell Assay for Transposase-Accessible Chromatin with Sequencing (scATAC-seq) libraries were prepared using 10x Genomics and processed with CellRanger-ATAC v1.2. A healthy control PBMC library (10k v1) was downloaded from www.10xgenomics.com. and was used as a reference. For all libraries, cells were defined as high-quality barcodes that captured at least 1,000 unique nuclear fragments and had a percent reads in peaks exceeding 40%. Dimensionality reduction, clustering, and cell state label transfer was performed using Seurat v3.0 and Signac using default parameters.55 Transcription factor scoring was performed using chromVAR with default parameters using a combination of all libraries to compute background peaks.56
PBMCs from the patient at 3 separate time points before treatment were used as pre-treatment samples. PBMCs from the patient at 2 separate time points after treatment were used as post-treatment samples. All samples were separated in time by at least 1 week. To compare to healthy control PBMCs, we utilized a public dataset of 10,000 PBMCs from a healthy donor.57
Phospho-STAT1 Bone Marrow Staining
Immunohistochemistry on bone marrow specimens was performed on Ventana Discovery ULTRA (Cat No. 750-601). Phospho-STAT1 antibody (Cell Signaling Technology; Cat No. 9167) was used at 1:600 dilution for 28 minutes. Epitope retrieval was performed with CC2 solution for 32 minutes.
Flow Cytometry Immunophenotyping
Peripheral blood mononuclear cells were thawed. Flow cytometry was performed using a BD FACSAria III, collected using BD FACSDiva v8, and analyzed using FlowJo v10. Antibodies are listed in Key Resources.
Flow Cytometry Intracellular Cytokine Staining
Peripheral blood mononuclear cells were thawed, incubated with PMA/ionomycin (ThermoFisher #00-4970-93 and protein transport inhibitor (ThermoFisher #00-4980-93), and fixed and permeabilized (BD #554714) all per protocol. Flow cytometry was performed using a BD FACSAria III, collected using BD FACSDiva v8, and analyzed using FlowJo v10. Antibodies are listed in Key Resources.
Phosphoflow CyTOF
This assay was performed by the Human Immune Monitoring Center at Stanford University. PBMC were thawed in warm media and stimulated by adding 50 ul (25ug) of interferon-γ (BD Biosciences, 554617) or left unstimulated and incubated at 37°C for 15 minutes. Cells were then fixed with paraformaldehyde, washed twice with CyFACS buffer (PBS supplemented with 2% BSA, 2 mM EDTA, and 0.1% sodium azide) and stained for 30 min at room temperature with 20 mL of surface antibody cocktail. Cells were permeabilized with 100% methanol, washed with CyFACS buffer, and resuspended in intracellular antibody cocktail in CyFACS for 30 minutes before washing twice in CyFACS. Cells were resuspended in 100 mL iridium-containing DNA intercalator (1:2000 dilution in 2% PFA in PBS) and incubated at room temperature for 20 min. Cells were washed and acquired on CyTOF. Data analysis was performed using FlowJo v10 by gating on intact cells based on the iridium isotopes from the intercalator, then on singlets by Ir191 vs cell length followed by cell subset-specific gating. Monocytes were gated based on DNA content for live singlets and CD14 expression.
Plasma Cytokine Levels
This assay was performed by the Human Immune Monitoring Center at Stanford University. Luminex magnetic bead human 62-plex Procarta kits were purchased from eBiosciences/Affymetrix/Thermo Fisher, Santa Clara, California, USA, and used according to the manufacturer’s recommendations. Plates were read using a Luminex 200.
Figures
The JAK/STAT schematic (Fig. S1D) was created using www.Biorender.com.
QUANTIFICATION AND STATISTICAL ANALYSIS
Statistical differences in flow cytometry cell subset frequencies and cytokine measurements were assessed by unpaired t-test. scRNA-Seq and scATAC-Seq statistical differences were calculated using a Wilcoxon rank-sum test.
ADDITIONAL RESOURCES
Trial registration can be found at https://clinicaltrials.gov/ct2/show/NCT03906318.
Supplementary Material
Supplemental Table 1
Gene lists used to generate CD8+ T cell module scores for exhaustion, cytotoxicity, and cytokine effector function, and gene lists used to score myeloid cells for Type I and II interferon.
Highlights.
A patient with a germline STAT1 GOF variant presented with aplastic anemia.
Aplastic anemia resolved following treatment with itacitinib, a JAK1 inhibitor.
An exhausted CD8+ T cell population correlated with disease activity.
Bone marrow STAT1 activation was also found in other idiopathic aplastic anemia cases.
Context and Significance Paragraph.
Aplastic anemia is a potentially lethal autoimmune disease where the immune system erroneously targets and destroys bone marrow stem cells. Treatments such as immunosuppression or bone marrow transplantation are effective but have serious side effects. A patient presented to our hospital with aplastic anemia due to a mutation in STAT1, a gene involved in immune system function. Patients with other conditions caused by STAT1 mutations have been successfully treated with JAK inhibitors - a class of medications associated with fewer side effects. Our patient was treated with the JAK inhibitor itacitinib, which resulted in resolution of his aplastic anemia. Our data suggests that other patients with aplastic anemia also have STAT1 activation and may also benefit from JAK inhibitor treatment.
Acknowledgements
General:
We thank Katrina Armstrong, Mark Fishman, Victor Fedorov, Lauren Zeitels, Rajesh Ranganathan, Alex Soltoff, AbdulRasheed Alabi, and Giovanna Manzano for their contributions and support as part of the MGH Pathways Program, Mike Waring, Maris Handley, Patricia Grace, Fred Preffer, and David Dombkowski for assistance with flow cytometry, Robert Hasserjian for historical aplastic anemia cases, and Candice Del Rio for clinical research assistance. We thank the Stanford Human Immune Monitoring Core for assistance in measuring plasma cytokine levels and phospho-CyTOF analysis.
Funding:
Funding was provided by the Massachusetts General Hospital Department of Medicine Pathways program and NIH T32 AI007387 through the Divisions of Infectious Diseases at MGH and Brigham and Women’s Hospital.
Footnotes
Competing Interests
Y.B.C. reports consulting fees from Incyte. A.K.S. reports compensation for consulting and/or SAB membership from Merck, Honeycomb Biotechnologies, Cellarity, Repertoire Immune Medicines, Hovione, Third Rock Ventures, Ochre Bio, Relation Therapeutics and Dahlia Biosciences. J.M.R. reports consulting fees from Third Rock Ventures. D.B.S. is a co-founder and holds equity in Clear Creek Bio, is a consultant and holds equity in SAFI Biosolutions, and is a consultant for Keros Therapeutics. A.R. is an advisory board member of Med, a founder and equity holder of Celsius Therapeutics, an equity holder in Immunitas Therapeutics and, until 31 August 2020, was an SAB member of Syros Pharmaceuticals, Neogene Therapeutics, Asimov and Thermo Fisher Scientific. From 1 August 2020, A.R. is an employee of Genentech. All other authors declare no competing interests.
Data and materials availability:
All data are in the process of being uploaded to the NIH Gene Expression Omnibus: https://www.ncbi.nlm.nih.gov/geo/
Publisher's Disclaimer: This is a PDF file of an unedited manuscript that has been accepted for publication. As a service to our customers we are providing this early version of the manuscript. The manuscript will undergo copyediting, typesetting, and review of the resulting proof before it is published in its final form. Please note that during the production process errors may be discovered which could affect the content, and all legal disclaimers that apply to the journal pertain.
References:
- 1.Young NS (2018). Aplastic Anemia. N. Engl. J. Med 379, 1643–1656. [DOI] [PMC free article] [PubMed] [Google Scholar]
- 2.Hosokawa K, Muranski P, Feng X, Townsley DM, Liu B, Knickelbein J, Keyvanfar K, Dumitriu B, Ito S, Kajigaya S, et al. (2016). Memory Stem T Cells in Autoimmune Disease: High Frequency of Circulating CD8+ Memory Stem Cells in Acquired Aplastic Anemia. J. Immunol 196, 1568–1578. [DOI] [PMC free article] [PubMed] [Google Scholar]
- 3.Morris R, Kershaw NJ, and Babon JJ (2018). The molecular details of cytokine signaling via the JAK/STAT pathway. Protein Sci. Publ. Protein Soc 27, 1984–2009. [DOI] [PMC free article] [PubMed] [Google Scholar]
- 4.Toubiana J, Okada S, Hiller J, Oleastro M, Lagos Gomez M, Aldave Becerra JC, Ouachée-Chardin M, Fouyssac F, Girisha KM, Etzioni A, et al. (2016). Heterozygous STAT1 gain-of-function mutations underlie an unexpectedly broad clinical phenotype. Blood 127, 3154–3164. [DOI] [PMC free article] [PubMed] [Google Scholar]
- 5.van de Veerdonk FL, Plantinga TS, Hoischen A, Smeekens SP, Joosten LAB, Gilissen C, Arts P, Rosentul DC, Carmichael AJ, Smits-van der Graaf CAA, et al. (2011). STAT1 Mutations in Autosomal Dominant Chronic Mucocutaneous Candidiasis. N. Engl. J. Med 365, 54–61. [DOI] [PubMed] [Google Scholar]
- 6.Zhang W, Chen X, Gao G, Xing S, Zhou L, Tang X, Zhao X, and An Y (2021). Clinical Relevance of Gain- and Loss-of-Function Germline Mutations in STAT1: A Systematic Review. Front. Immunol 12, 654406. [DOI] [PMC free article] [PubMed] [Google Scholar]
- 7.Depner M, Fuchs S, Raabe J, Frede N, Glocker C, Doffinger R, Gkrania-Klotsas E, Kumararatne D, Atkinson TP, Schroeder HW, et al. (2016). The Extended Clinical Phenotype of 26 Patients with Chronic Mucocutaneous Candidiasis due to Gain-of-Function Mutations in STAT1 J. Clin. Immunol 36, 73–84. [DOI] [PMC free article] [PubMed] [Google Scholar]
- 8.Okada S, Asano T, Moriya K, Boisson-Dupuis S, Kobayashi M, Casanova J-L, and Puel A (2020). Human STAT1 Gain-of-Function Heterozygous Mutations: Chronic Mucocutaneous Candidiasis and Type I Interferonopathy. J. Clin. Immunol 40, 1065–1081. [DOI] [PMC free article] [PubMed] [Google Scholar]
- 9.Mizoguchi Y, and Okada S (2021). Inborn errors of STAT1 immunity. Curr. Opin. Immunol 72, 59–64. [DOI] [PubMed] [Google Scholar]
- 10.Weinacht KG, Charbonnier L-M, Alroqi F, Plant A, Qiao Q, Wu H, Ma C, Torgerson TR, Rosenzweig SD, Fleisher TA, et al. (2017). Ruxolitinib reverses dysregulated T helper cell responses and controls autoimmunity caused by a novel signal transducer and activator of transcription 1 (STAT1) gain-of-function mutation. J. Allergy Clin. Immunol 139, 1629–1640.e2. [DOI] [PMC free article] [PubMed] [Google Scholar]
- 11.Leiding JW, Okada S, Hagin D, Abinun M, Shcherbina A, Balashov DN, Kim VHD, Ovadia A, Guthery SL, Pulsipher M, et al. (2018). Hematopoietic stem cell transplantation in patients with gain-of-function signal transducer and activator of transcription 1 mutations. J. Allergy Clin. Immunol 141, 704–717.e5. [DOI] [PMC free article] [PubMed] [Google Scholar]
- 12.Deeg HJ, Lum LG, Sanders J, Levy GJ, Sullivan KM, Beatty P, Thomas ED, and Storb R (1986). Severe aplastic anemia associated with chronic mucocutaneous candidiasis. Immunologic and hematologic reconstitution after allogeneic bone marrow transplantation. Transplantation 41, 583–586. [DOI] [PubMed] [Google Scholar]
- 13.Twomey JJ, Waddell CC, Krantz S, O’reilly R, L’esperance P, and Good RA (1975). Chronic mucocutaneous candidiasis with macrophage dysfunction, a plasma inhibitor, and co-existent aplastic anemia. J. Lab. Clin. Med 85, 968–977. [PubMed] [Google Scholar]
- 14.Liu L, Okada S, Kong X-F, Kreins AY, Cypowyj S, Abhyankar A, Toubiana J, Itan Y, Audry M, Nitschke P, et al. (2011). Gain-of-function human STAT1 mutations impair IL-17 immunity and underlie chronic mucocutaneous candidiasis. J. Exp. Med 208, 1635–1648. [DOI] [PMC free article] [PubMed] [Google Scholar]
- 15.Zheng J, Veerdonk FL van de, Crossland KL, Smeekens SP, Chan CM, Shehri TA, Abinun M, Gennery AR, Mann J, Lendrem DW, et al. (2015). Gain-of-function STAT1 mutations impair STAT3 activity in patients with chronic mucocutaneous candidiasis (CMC). Eur. J. Immunol 45, 2834–2846. [DOI] [PubMed] [Google Scholar]
- 16.Wan C-K, Andraski AB, Spolski R, Li P, Kazemian M, Oh J, Samsel L, Swanson PA, McGavern DB, Sampaio EP, et al. (2015). Opposing roles of STAT1 and STAT3 in IL-21 function in CD4+ T cells. Proc. Natl. Acad. Sci. U. S. A 112, 9394–9399. [DOI] [PMC free article] [PubMed] [Google Scholar]
- 17.Break TJ, Oikonomou V, Dutzan N, Desai JV, Swidergall M, Freiwald T, Chauss D, Harrison OJ, Alejo J, Williams DW, et al. (2021). Aberrant type 1 immunity drives susceptibility to mucosal fungal infections. Science 371. [DOI] [PMC free article] [PubMed] [Google Scholar]
- 18.Fujiki R, Hijikata A, Shirai T, Okada S, Kobayashi M, and Ohara O (2017). Molecular mechanism and structural basis of gain-of-function of STAT1 caused by pathogenic R274Q mutation. J. Biol. Chem 292, 6240–6254. [DOI] [PMC free article] [PubMed] [Google Scholar]
- 19.Kagawa R, Fujiki R, Tsumura M, Sakata S, Nishimura S, Itan Y, Kong X-F, Kato Z, Ohnishi H, Hirata O, et al. (2017). Alanine-scanning mutagenesis of human STAT1 to estimate loss- or gain-of-function variants. J. Allergy Clin. Immunol 140, 232–241. [DOI] [PMC free article] [PubMed] [Google Scholar]
- 20.Giovannozzi S, Demeulemeester J, Schrijvers R, and Gijsbers R (2021). Transcriptional Profiling of STAT1 Gain-of-Function Reveals Common and Mutation-Specific Fingerprints. Front. Immunol 12, 632997. [DOI] [PMC free article] [PubMed] [Google Scholar]
- 21.Kaleviste E, Saare M, Leahy TR, Bondet V, Duffy D, Mogensen TH, Jørgensen SE, Nurm H, Ip W, Davies EG, et al. (2019). Interferon signature in patients with STAT1 gain-of-function mutation is epigenetically determined. Eur. J. Immunol 49, 790–800. [DOI] [PubMed] [Google Scholar]
- 22.Zimmerman O, Olbrich P, Freeman AF, Rosen LB, Uzel G, Zerbe CS, Rosenzweig SD, Kuehn HS, Holmes KL, Stephany D, et al. (2019). STAT1 Gain-of-Function Mutations Cause High Total STAT1 Levels With Normal Dephosphorylation. Front. Immunol 10, 1433. [DOI] [PMC free article] [PubMed] [Google Scholar]
- 23.Giovannozzi S, Lemmens V, Hendrix J, Gijsbers R, and Schrijvers R (2020). Live Cell Imaging Demonstrates Multiple Routes Toward a STAT1 Gain-of-Function Phenotype. Front. Immunol 11, 1114. [DOI] [PMC free article] [PubMed] [Google Scholar]
- 24.Bloomfield M, Kanderová V, Paračková Z, Vrabcová P, Svatoň M, Froňková E, Fejtková M, Zachová R, Rataj M, Zentsová I, et al. (2018). Utility of Ruxolitinib in a Child with Chronic Mucocutaneous Candidiasis Caused by a Novel STAT1 Gain-of-Function Mutation. J. Clin. Immunol 38, 589–601. [DOI] [PubMed] [Google Scholar]
- 25.Forbes LR, Vogel TP, Cooper MA, Castro-Wagner J, Schussler E, Weinacht KG, Plant AS, Su HC, Allenspach EJ, Slatter M, et al. (2018). Jakinibs for the treatment of immune dysregulation in patients with gain-of-function signal transducer and activator of transcription 1 (STAT1) or STAT3 mutations. J. Allergy Clin. Immunol 142, 1665–1669. [DOI] [PMC free article] [PubMed] [Google Scholar]
- 26.Higgins E, Shehri TA, McAleer MA, Conlon N, Feighery C, Lilic D, and Irvine AD (2015). Use of ruxolitinib to successfully treat chronic mucocutaneous candidiasis caused by gain-of-function signal transducer and activator of transcription 1 (STAT1) mutation. J. Allergy Clin. Immunol 135, 551–553.e3. [DOI] [PubMed] [Google Scholar]
- 27.Mössner R, Diering N, Bader O, Forkel S, Overbeck T, Gross U, Grimbacher B, Schön MP, and Buhl T (2016). Ruxolitinib Induces Interleukin 17 and Ameliorates Chronic Mucocutaneous Candidiasis Caused by STAT1 Gain-of-Function Mutation. Clin. Infect. Dis 62, 951–953. [DOI] [PubMed] [Google Scholar]
- 28.Chaimowitz NS, Ebenezer SJ, Hanson IC, Anderson M, and Forbes LR (2020). STAT1 Gain of Function, Type 1 Diabetes, and Reversal with JAK Inhibition. N. Engl. J. Med 383, 1494–1496. [DOI] [PubMed] [Google Scholar]
- 29.Zimmerman O, Rösler B, Zerbe CS, Rosen LB, Hsu AP, Uzel G, Freeman AF, Sampaio EP, Rosenzweig SD, Kuehn HS, et al. (2017). Risks of Ruxolitinib in STAT1 Gain-of-Function-Associated Severe Fungal Disease. Open Forum Infect. Dis 4, ofx202. [DOI] [PMC free article] [PubMed] [Google Scholar]
- 30.Notarangelo LD, Bacchetta R, Casanova J-L, and Su HC (2020). Human inborn errors of immunity: An expanding universe. Sci. Immunol 5. [DOI] [PMC free article] [PubMed] [Google Scholar]
- 31.Camitta BM, Storb R, and Thomas ED (1982). Aplastic Anemia. N. Engl. J. Med 306, 712–718. [DOI] [PubMed] [Google Scholar]
- 32.Casanova J-L, Conley ME, Seligman SJ, Abel L, and Notarangelo LD (2014). Guidelines for genetic studies in single patients: lessons from primary immunodeficiencies. J. Exp. Med 211, 2137–2149. [DOI] [PMC free article] [PubMed] [Google Scholar]
- 33.Kettle JG, Åstrand A, Catley M, Grimster NP, Nilsson M, Su Q, and Woessner R (2017). Inhibitors of JAK-family kinases: an update on the patent literature 2013-2015, part 1. Expert Opin. Ther. Pat 27, 127–143. [DOI] [PubMed] [Google Scholar]
- 34.Covington M, He X, Scuron M, Li J, Collins R, Juvekar A, Shin N, Favata M, Gallagher K, Sarah S, et al. (2020). Preclinical characterization of itacitinib (INCB039110), a novel selective inhibitor of JAK1, for the treatment of inflammatory diseases. Eur. J. Pharmacol 885, 173505. [DOI] [PubMed] [Google Scholar]
- 35.Zoumbos NC, Gascon P, Djeu JY, and Young NS (1985). Interferon is a mediator of hematopoietic suppression in aplastic anemia in vitro and possibly in vivo. Proc. Natl. Acad. Sci 82, 188–192. [DOI] [PMC free article] [PubMed] [Google Scholar]
- 36.Chen X, Xu Q, Li X, Wang L, Yang L, Chen Z, Zeng T, Xue X, Xu T, Wang Y, et al. (2020). Molecular and Phenotypic Characterization of Nine Patients with STAT1 GOF Mutations in China. J. Clin. Immunol 40, 82–95. [DOI] [PubMed] [Google Scholar]
- 37.Kobbe R, Kolster M, Fuchs S, Schulze-Sturm U, Jenderny J, Kochhan L, Staab J, Tolosa E, Grimbacher B, and Meyer T (2016). Common variable immunodeficiency, impaired neurological development and reduced numbers of T regulatory cells in a 10-year-old boy with a STAT1 gain-of-function mutation. Gene 586, 234–238. [DOI] [PubMed] [Google Scholar]
- 38.Caldirola MS, Martínez MP, Bezrodnik L, Zwirner NW, and Gaillard MI (2020). Immune Monitoring of Patients With Primary Immune Regulation Disorders Unravels Higher Frequencies of Follicular T Cells With Different Profiles That Associate With Alterations in B Cell Subsets. Front. Immunol 11, 576724. [DOI] [PMC free article] [PubMed] [Google Scholar]
- 39.Kordasti S, Marsh J, Al-Khan S, Jiang J, Smith A, Mohamedali A, Abellan PP, Veen C, Costantini B, Kulasekararaj AG, et al. (2012). Functional characterization of CD4+ T cells in aplastic anemia. Blood 119, 2033–2043. [DOI] [PubMed] [Google Scholar]
- 40.McLane LM, Abdel-Hakeem MS, and Wherry EJ (2019). CD8 T Cell Exhaustion During Chronic Viral Infection and Cancer. Annu. Rev. Immunol 37, 457–495. [DOI] [PubMed] [Google Scholar]
- 41.Szabo PA, Levitin HM, Miron M, Snyder ME, Senda T, Yuan J, Cheng YL, Bush EC, Dogra P, Thapa P, et al. (2019). Single-cell transcriptomics of human T cells reveals tissue and activation signatures in health and disease. Nat. Commun 10, 4706. [DOI] [PMC free article] [PubMed] [Google Scholar]
- 42.Li H, van der Leun AM, Yofe I, Lubling Y, Gelbard-Solodkin D, van Akkooi ACJ, van den Braber M, Rozeman EA, Haanen JBAG, Blank CU, et al. (2019). Dysfunctional CD8 T Cells Form a Proliferative, Dynamically Regulated Compartment within Human Melanoma. Cell 176, 775–789.e18. [DOI] [PMC free article] [PubMed] [Google Scholar]
- 43.Zemmour D, Kiner E, and Benoist C (2020). CD4+ teff cell heterogeneity: the perspective from single-cell transcriptomics. Curr. Opin. Immunol 63, 61–67. [DOI] [PMC free article] [PubMed] [Google Scholar]
- 44.Mostafavi S, Yoshida H, Moodley D, LeBoité H, Rothamel K, Raj T, Ye CJ, Chevrier N, Zhang S-Y, Feng T, et al. (2016). Parsing the Interferon Transcriptional Network and Its Disease Associations. Cell 164, 564–578. [DOI] [PMC free article] [PubMed] [Google Scholar]
- 45.Satoh J, and Tabunoki H (2013). A Comprehensive Profile of ChIP-Seq-Based STAT1 Target Genes Suggests the Complexity of STAT1-Mediated Gene Regulatory Mechanisms. Gene Regul. Syst. Biol 7, GRSB.S11433. [DOI] [PMC free article] [PubMed] [Google Scholar]
- 46.Goldberg MF, Roeske EK, Ward LN, Pengo T, Dileepan T, Kotov DI, and Jenkins MK (2018). Salmonella Persist in Activated Macrophages in T Cell-Sparse Granulomas but Are Contained by Surrounding CXCR3 Ligand-Positioned Th1 Cells. Immunity 49, 1090–1102.e7. [DOI] [PMC free article] [PubMed] [Google Scholar]
- 47.Sen DR, Kaminski J, Barnitz RA, Kurachi M, Gerdemann U, Yates KB, Tsao H-W, Godec J, LaFleur MW, Brown FD, et al. (2016). The epigenetic landscape of T cell exhaustion. Science 354, 1165–1169. [DOI] [PMC free article] [PubMed] [Google Scholar]
- 48.Pauken KE, Sammons MA, Odorizzi PM, Manne S, Godec J, Khan O, Drake AM, Chen Z, Sen DR, Kurachi M, et al. (2016). Epigenetic stability of exhausted T cells limits durability of reinvigoration by PD-1 blockade. Science 354, 1160–1165. [DOI] [PMC free article] [PubMed] [Google Scholar]
- 49.Smith JNP, Kanwar VS, and MacNamara KC (2016). Hematopoietic Stem Cell Regulation by Type I and II Interferons in the Pathogenesis of Acquired Aplastic Anemia. Front. Immunol 7, 330. [DOI] [PMC free article] [PubMed] [Google Scholar]
- 50.Vohra S, Shamseer L, Sampson M, Bukutu C, Schmid CH, Tate R, Nikles J, Zucker DR, Kravitz R, Guyatt G, et al. (2015). CONSORT extension for reporting N-of-1 trials (CENT) 2015 Statement. BMJ 350, h1738. [DOI] [PubMed] [Google Scholar]
- 51.Lundgren S, Keränen MAI, Kankainen M, Huuhtanen J, Walldin G, Kerr CM, Clemente M, Ebeling F, Rajala H, Brück O, et al. (2021). Somatic mutations in lymphocytes in patients with immune-mediated aplastic anemia. Leukemia 35, 1365–1379. [DOI] [PMC free article] [PubMed] [Google Scholar]
- 52.O’Donnell E, Mahindra A, Yee AJ, Nardi V, Birrer N, Horick N, Borger D, Finkelstein D, Iafrate JA, and Raje N (2015). Clinical Grade “SNaPshot” Genetic Mutation Profiling in Multiple Myeloma. EBioMedicine 2, 71–73. [DOI] [PMC free article] [PubMed] [Google Scholar]
- 53.Hughes TK, Wadsworth MH, Gierahn TM, Do T, Weiss D, Andrade PR, Ma F, de Andrade Silva BJ, Shao S, Tsoi LC, et al. (2020). Second-Strand Synthesis-Based Massively Parallel scRNA-Seq Reveals Cellular States and Molecular Features of Human Inflammatory Skin Pathologies. Immunity 53, 878–894.e7. [DOI] [PMC free article] [PubMed] [Google Scholar]
- 54.Korsunsky I, Millard N, Fan J, Slowikowski K, Zhang F, Wei K, Baglaenko Y, Brenner M, Loh P, and Raychaudhuri S (2019). Fast, sensitive and accurate integration of single-cell data with Harmony. Nat. Methods 16, 1289–1296. [DOI] [PMC free article] [PubMed] [Google Scholar]
- 55.Stuart T, Butler A, Hoffman P, Hafemeister C, Papalexi E, Mauck WM, Hao Y, Stoeckius M, Smibert P, and Satija R (2019). Comprehensive Integration of Single-Cell Data. Cell 177, 1888–1902.e21. [DOI] [PMC free article] [PubMed] [Google Scholar]
- 56.Schep AN, Wu B, Buenrostro JD, and Greenleaf WJ (2017). chromVAR: inferring transcription-factor-associated accessibility from single-cell epigenomic data. Nat. Methods 14, 975–978. [DOI] [PMC free article] [PubMed] [Google Scholar]
- 57.Satpathy AT, Granja JM, Yost KE, Qi Y, Meschi F, McDermott GP, Olsen BN, Mumbach MR, Pierce SE, Corces MR, et al. (2019). Massively parallel single-cell chromatin landscapes of human immune cell development and intratumoral T cell exhaustion. Nat. Biotechnol 37, 925–936. [DOI] [PMC free article] [PubMed] [Google Scholar]
Associated Data
This section collects any data citations, data availability statements, or supplementary materials included in this article.
Supplementary Materials
Supplemental Table 1
Gene lists used to generate CD8+ T cell module scores for exhaustion, cytotoxicity, and cytokine effector function, and gene lists used to score myeloid cells for Type I and II interferon.
Data Availability Statement
Single-cell RNA-seq data have been deposited at Zenodo and are publicly available as of the date of publication. Accession numbers are listed in the key resources table. The DOI is listed in the key resources table.
All original code has been deposited at Zenodo and is publicly available as of the date of publication. DOIs are listed in the key resources table.
Any additional information required to reanalyze the data reported in this paper is available from the lead contact upon request.
KEY RESOURCES TABLE
| REAGENT or RESOURCE | SOURCE | IDENTIFIER |
|---|---|---|
| Antibodies | ||
| Phospho-STAT1 antibody | Cell Signaling Technology | Cat No. 9167 |
| PD1 | BD | 745619 |
| CXCR3 | BioLegend | 353716 |
| viability | BD | 564907 |
| CD45RA | eBioscience | 11-0458-42 |
| CCR6 | BD | 551773 |
| CXCR5 | BD | 558113 |
| CD127 | BD | 560551 |
| CD8 | Biolegend | 300920 |
| CD4 | BD | 341095 |
| CD25 | BD | 557741 |
| IL17 | biolegend | 512333 |
| IFNg | BioLegend | 506525 |
| CD3 | BioLegend | 300427 |
| CD4 | biolegend | 300508 |
| CD8 | BD | 563795 |
| CD45RO | BD | 560608 |
| CD45RA | BD | 561882 |
| Chemicals, peptides, and recombinant proteins | ||
| interferon-γ | BD Biosciences | 554617 |
| Critical commercial assays | ||
| 62-plex Procarta | Luminex | EPXTL650-10065-901 |
| Deposited data | ||
| Single cell transcriptional and ATAC seq raw data and code | This paper | 10.5281/zenodo.5747633 |
| Oligonucleotides | ||
| STAT1 variant was performed by Sanger sequencing with the following primer sequences. Forward primer: CCTCCACAAACTCTCTTGCC. Reverse primer: TTAAACCCTTGTAAATCATCTGAA | This paper | N/A |
| Software and algorithms | ||
| Seurat v3.0 | https://www.sciencedirect.com/science/article/pii/S0092867419305598#sec4 | https://github.com/satijalab/seurat |
| R | R Core | https://www.r-project.org/ |
| Harmony v0.1.0 | https://pubmed.ncbi.nlm.nih.gov/31740819/ | https://github.com/immunogenomics/harmony |
| Igraph v1.2.6 | https://github.com/igraph/igraphdata | https://github.com/igraph/igraphdata |
| Drop-seq tools v2.0.0 | McCarroll Lab | https://github.com/broadinstitute/Drop-seq |
| Signac | https://www.nature.com/articles/s41592-021-01282-5?proof=tr | https://github.com/timoast/signac |
| chromVAR | https://www.nature.com/articles/nmeth.4401 | https://github.com/GreenleafLab/chromVAR |
| CellRanger-ATAC v1.2 | 10X Genomics | https://support.10xgenomics.com/single-cell-atac/software/overview/welcome |
| FlowJo | www.flowjo.com | |
| Prism | https://www.graphpad.com/scientific-software/prism/ | |
| Biorender | www.biorender.com | |
| Other | ||