Abstract
Objective
To create neonatal reference intervals for the MicroR and HYPO-He complete blood count (CBC) parameters and to test whether these parameters are sensitive early markers of disease at early stages of microcytic/hypochromic disorders while the CBC indices are still normal.
Study design
We retrospectively collected the CBC parameters MicroR and HYPO-He, along with the standard CBC parameters, from infants aged 0–90 days at Intermountain Healthcare hospitals using Sysmex hematology analyzers. We created reference intervals for these parameters by excluding values from neonates with proven microcytic disorders (ie, iron deficiency or alpha thalassemia) from the dataset.
Result
From >11 000 CBCs analyzed, we created reference intervals for MicroR and HYPO-He in neonates aged 0–90 days. The upper intervals are considerably higher in neonates than in adults, validating increased anisocytosis and polychromasia among neonates. Overall, 52% of neonates with iron deficiency (defined by reticulocyte hemoglobin equivalent <25 pg) had a MicroR >90% upper interval (relative risk, 4.14; 95% CI, 3.80–4.53; P < .001), and 68% had an HYPO-He >90% upper interval (relative risk, 6.64; 95% CI, 6.03–7.32; P < .001). These 2 new parameters were more sensitive than the red blood cell (RBC) indices (P < .001) in identifying 24 neonates with iron deficiency at birth.
Conclusions
We created neonatal reference intervals for MicroR and HYPO-He. Although Sysmex currently designates these as research use only in the US, they can be measured as part of a neonate’s CBC with no additional phlebotomy volume or run time and can identify microcytic and hypochromic disorders even when the RBC indices are normal.
When a complete blood count (CBC) is run on certain clinical laboratory analyzers, the diagnostic parameters MicroR and HYPO-He can be measured with no additional blood required and no prolongation of the run time.1–3 MicroR is a unique means of assessing microcytosis that is defined by the analyzer manufacturer as the percentage of red blood cells (RBCs) with a mean corpuscular volume (MCV) <60 fL (MCV reference interval for adults, 80–96 fL).4,5 The MicroR in healthy adults is typically <1%.1–3 HYPO-He, a metric of hypohemoglobinized RBCs, is defined as the percentage of RBCs that have a mean corpuscular hemoglobin (MCH) <17 pg (MCH reference interval for adults, 26–32 pg).4,5 The HYPO-He in healthy adults is typically <1%.1–3
The National Kidney Disease Outcome Quality Initiative and the European Best Practice Guidelines recommend using MicroR and HYPO-He to identify patients with iron deficiency.6 Although written primarily for adult patients, this recommendation is based on the fact that patients with relatively early iron deficiency, at a time when the indices have not yet fallen to the point where they are recognized as abnormal, will have elevated MicroR and HYPO-He values. These elevations reveal the microcytic and hypochromic characteristics of iron-limited erythropoiesis. In addition, these 2 new parameters might be useful for identifying infants with alpha thalassemia, because in older children and adult patients with alpha thalassemia trait or hemoglobin H disease, the MicroR is typically elevated, but the HYPO-He is less elevated than in iron deficiency.7−10
We are not aware of any studies of the MicroR and HYPO-He parameters in neonates either establishing reference intervals or evaluating neonates with microcytic/hypochromic disorders. Therefore, we performed the present study to establish neonatal reference intervals for these parameters and to assess their usefulness in a population of neonatal patients.
Methods
The study protocol was approved by the Intermountain Healthcare Institutional Review Board. Intermountain Healthcare is a not-for-profit healthcare system operating 18 hospitals with labor and delivery units in Utah and Idaho. For this study, CBC results, including MicroR and HYPO-He values, were manually downloaded from Sysmex XN or XE hematology analyzers (Sysmex America) to delimited text files. The combined dataset for this study included results from 2 hospital laboratories from 2018–2020: Primary Children’s Hospital in Salt Lake City, with a level IV neonatal intensive care unit and no delivery service, and Utah Valley Hospital in Provo, which has the largest level III neonatal intensive care unit in the Intermountain Healthcare system.
Data from the hematology analyzers were linked to deidentified patient information in the Intermountain Healthcare Enterprise Data Warehouse to obtain patient demographic data, including age at sample collection, gestational age, sex, and newborn hemoglobinopathy screening information. Only values from infants between birth and day of life 90 were retained for our analysis. Data on infants with MicroR and HYPO-He ≥10% were transferred into REDCap for further investigation and analysis. All blood cell counts were determined using the Sysmex analyzers.
All blood tests were performed in accordance with Intermountain Healthcare Laboratory Services standard operating procedures and manufacturer’s instructions. The Sysmex quality control procedures were performed daily as recommended by the manufacturer. Sysmex currently designates the MicroR and the HYPO-He as research use only in the US.
We constructed the MicroR and the HYPO-He reference range datasets from all values obtained, minus those from neonates with diagnoses known to be associated with microcytosis or hypochromia. Thus, values were excluded if any of the following 4 were identified: (1) reticulocyte hemoglobin equivalent (RET-He) ≤28 pg (a biomarker for iron deficiency),11–13 (2) fractionated red cell count >200 000/μL (a biomarker for schistocytosis, ie, disseminated intravascular coagulation, necrotizing enterocolitis, sepsis),14–16 (3) hemoglobin Barts identified on the state newborn screen (a marker for alpha thalassemia),17 or (4) diagnosis of hereditary spherocytosis (which can present in neonates with a MCV below the reference interval).18
Reference intervals by postnatal age (in days) were created by separating the MicroR and HYPO-He measurements into time epochs ranging from 1 day up to 20 days. We then nonparametrically estimated the median, 5th percentile, and 90th percentile within each epoch and used cubic spline functions to estimate the upper, lower, and median reference values by day for the first 90 days after birth. We used the McNemar test to evaluate agreement between the MicroR and MCV and between HYPO-He and MCH and their ability to detect iron-limited erythropoiesis in nonanemic neonates. All statistical analyses and data manipulation were done using the R statistical language and environment (R Foundation for Statistical Computing).
Results
The frequency distribution of all 11 104 MicroR values is shown in Figure 1, A. Ninety-five percent of the values had a MicroR <8.3%, 17.0% were >5%, 2.5% were >10%, and 0.3% were >15%. The frequency distribution of HYPO-He values from the same 11 104 CBCs is shown in Figure 1, B. Ninety-five percent of the values had a HYPO-He <13.2%, 23.3% were >5%, 10.0% were >10%, and 3.2% were >15%.
Figure 1.
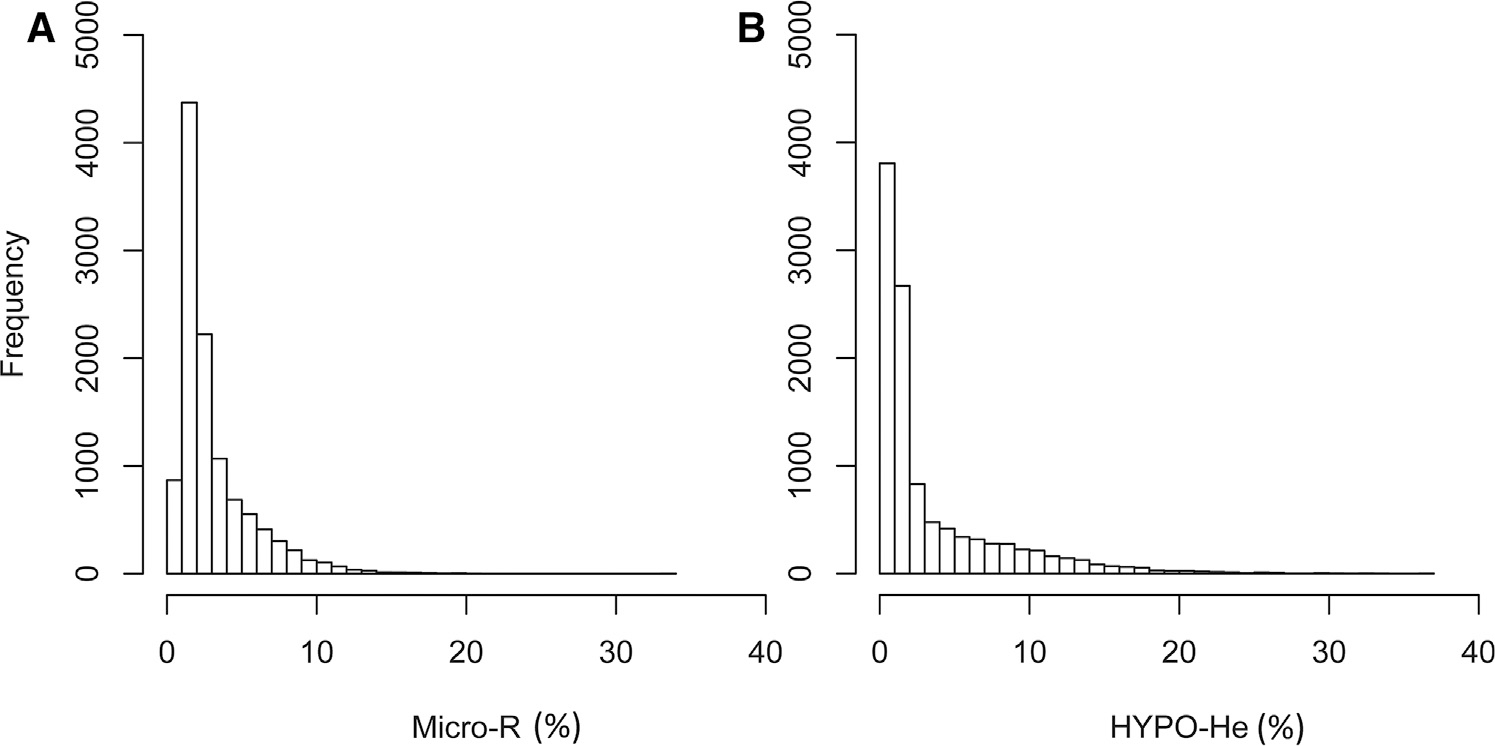
Frequency distribution of A, MicroR% and B, HYPO-He% in 11 104 measurements during the first 90 days after birth.
Figure 2, A displays a scatterplot of all simultaneous paired measurements of MCV (fL) and MicroR (%). Figure 2, B displays a scatterplot with simultaneous paired MCH (pg) and HYPO-HE (%) measurements. In both plots, it can be seen that some neonates with a “normal” MCV had a very high MicroR value, and, similarly, some neonates with a “normal” MCH had a very high HYPO-He value.
Figure 2.
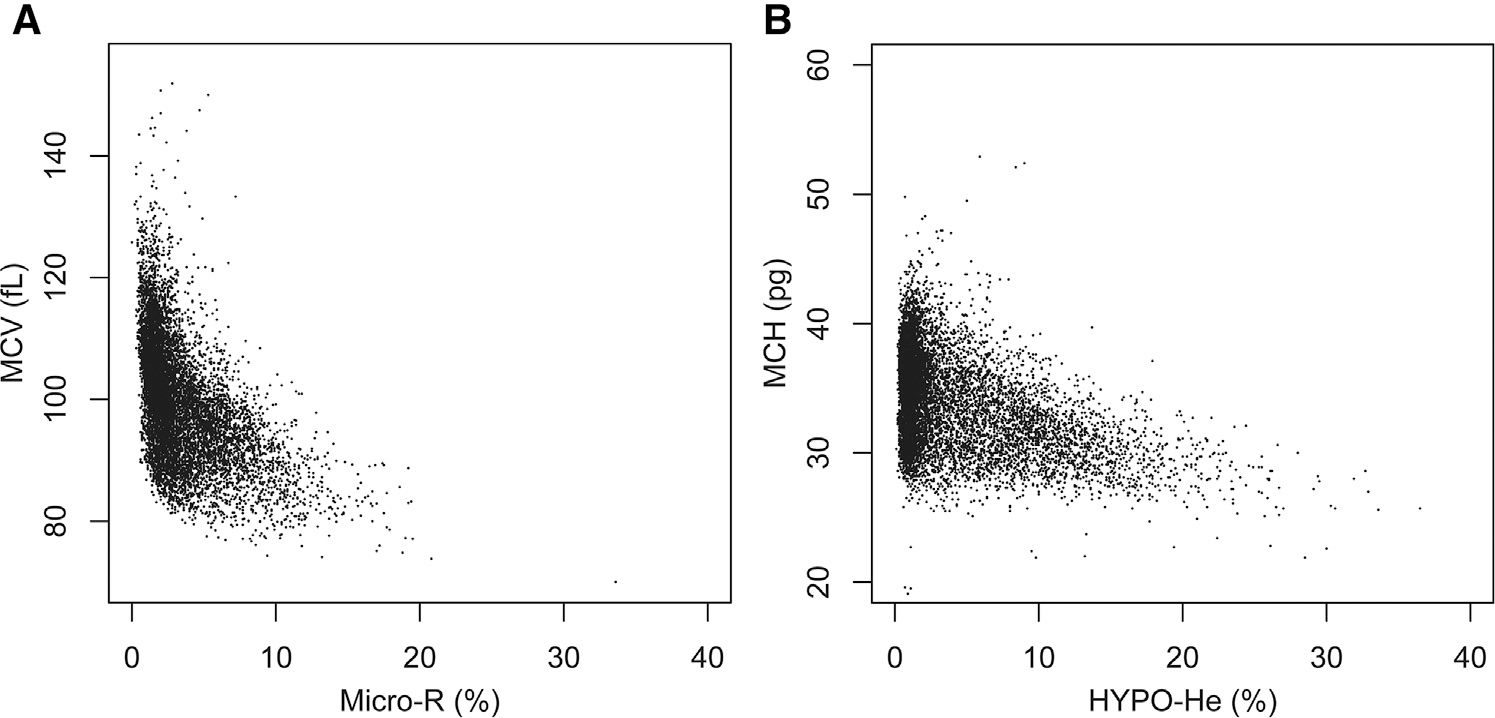
Scatterplot of simultaneous paired measurements of A, MCV (fL) and MicroR (%) and B, MCH and HYPO-HE, among all 11 104 simultaneous paired measurements.
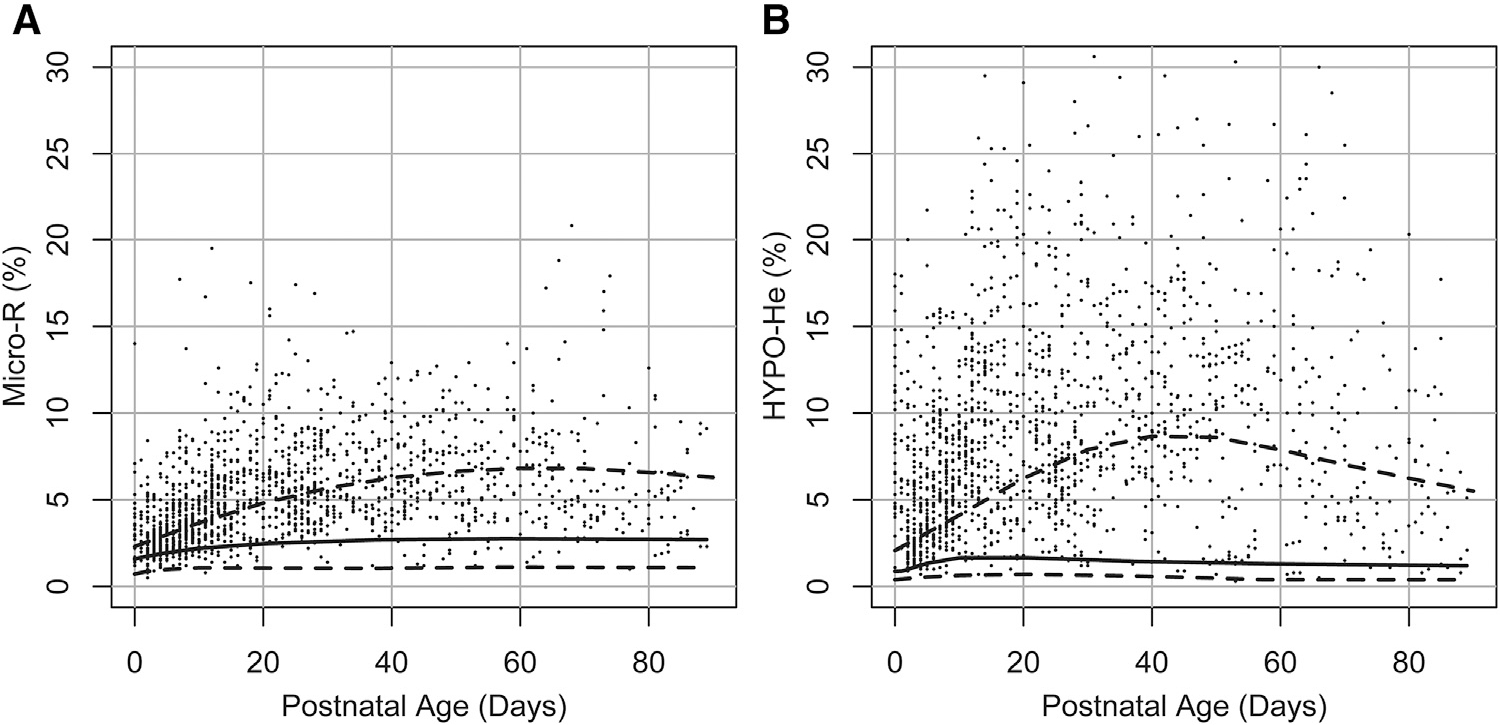
The reference interval for MicroR (%) over the first 90 days following birth is shown in Figure 3, A, and the reference range for HYPO-He (%) over the first 90 days is shown in Figure 3, B. Scatterplots showing the relationship between RET-He (pg) and MicroR (%) and between RET-He (pg) and HYPO-He (%) are shown in Figure 4 (available at www.jpeds.com). In addition, of the neonates in our dataset with laboratory evidence of iron deficiency (defined by RET-He <25 pg; n = 1554), 52% had a MicroR >90% upper interval (relative risk vs neonates with RET-He ≥25, 4.14; 95% CI, 3.80–4.53; P < .001), and 68% had an HYPO-He >90% (relative risk vs neonates with RET-He ≥25, 6.64; 95% CI, 6.03–7.32; P < .001) (Figure 5).
Figure 3.
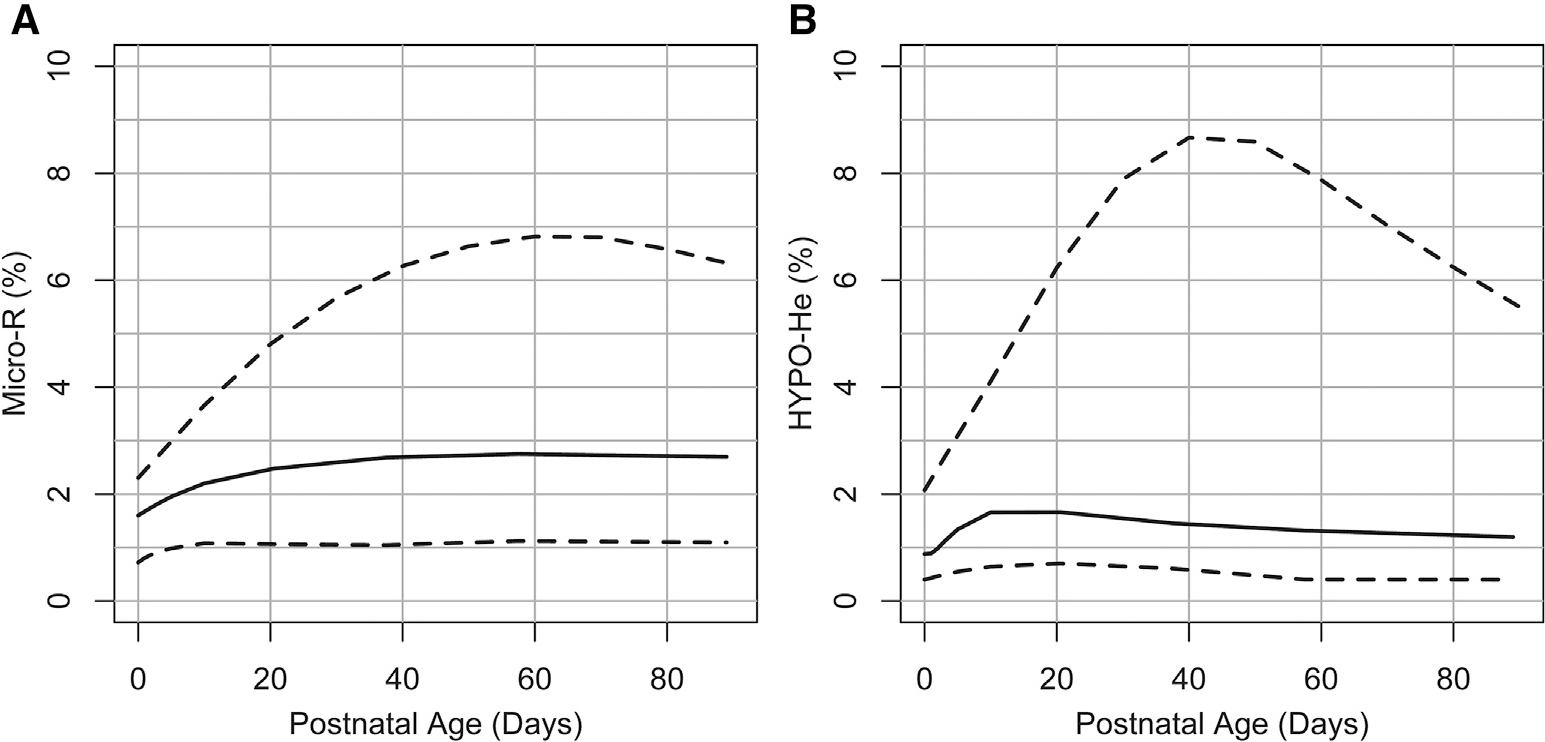
Neonatal reference interval for A, MicroR and B, HYPO-He during the first 90 days following birth. The lower dashed line shows the 5th percentile lower reference interval, the solid line shows the median, and the upper dashed line represents the 90th percent upper reference interval.
Figure 4.
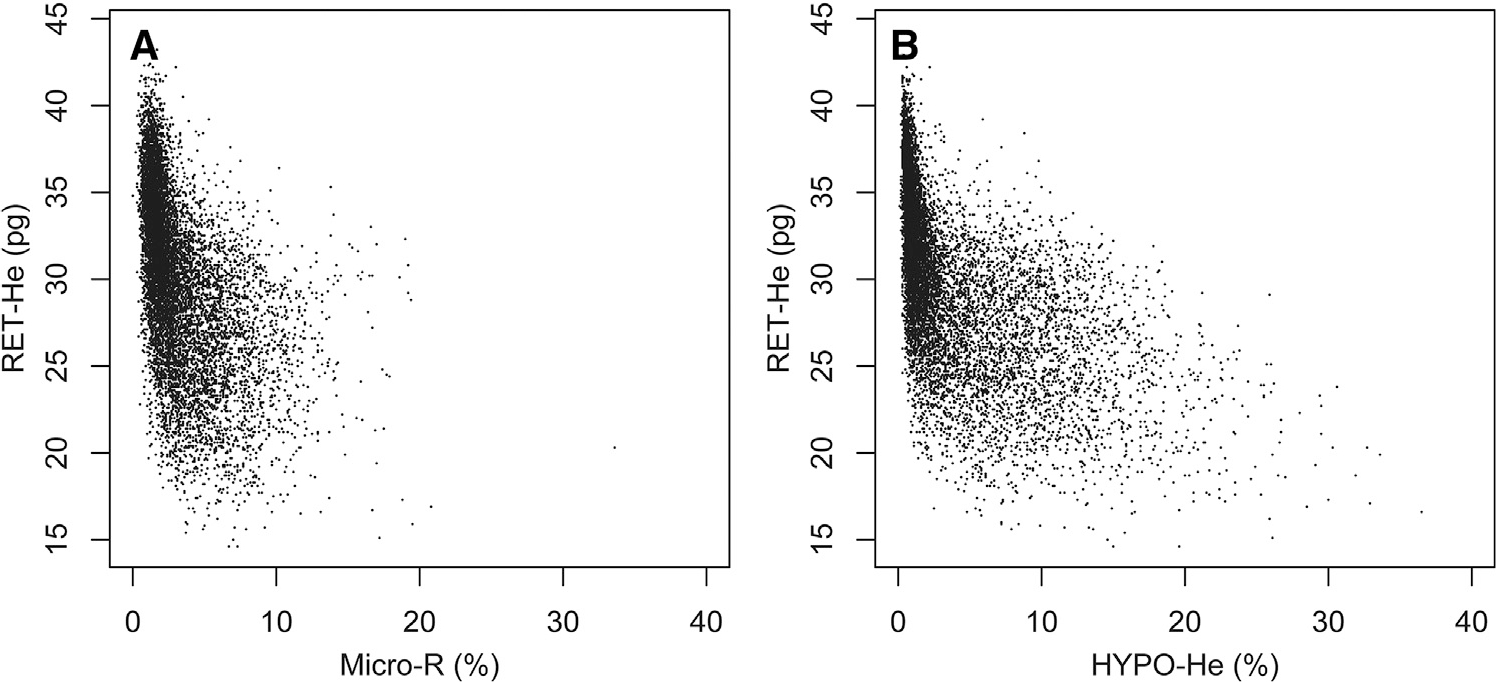
Scatterplot of simultaneous paired measurements of A, RET-He and MicroR and B, RET-HE and HYPO-HE, among 11 104 simultaneous paired measurements.
Figure 5.
Neonatal reference intervals for A, MicroR and B, HYPO-He during the first 90 days following birth (dashed and solid lines), with a superimposed dot-plot showing individual MicroR and HYPO-He values from neonates with iron deficiency (defined as RET-He<25 pg; n = 1554).
We identified 4 neonates who had iron deficiency anemia at birth. Each of the 7 CBCs obtained from these 4 neonates within their first 48 hours after birth are shown in Table I (available at www.jpeds.com). Two of the 4 neonates with congenital iron deficiency anemia were born to mothers with diabetes. The other 2 were twins with a unique combination of iron deficiency (RET-He ≤25 pg,),11,12 a mother with obesity (BMI >40),19–21 and alpha thalassemia trait (hemoglobin Barts and a 3-bp duplication in the alpha globin gene [c.364_366dupGTG]).22 In all 7 CBCs from these 4 neonates, microcytosis was identified by a MCV below the lower reference interval for gestational age,23,24 and hypohemoglobinized cells were recognized by a MCH below the lower reference interval for gestational age.23,24 In addition, all CBCs from these 4 neonates had MicroR and HYPO-He values far above the upper reference intervals for the first 2 days after birth (compare with Figure 3).
Table I.
Seven CBCs drawn within the first 48 hours of birth from 4 neonates with congenital iron deficiency anemia
| Patient | GA, wk | BW, g | IDM, Y/N | SGA, Y/N | Mother’s BMI | HCT, % | Ret-He, pg | MicroR, % | MCV, fL | HYPO-HE, % | MCH, pg |
|---|---|---|---|---|---|---|---|---|---|---|---|
|
| |||||||||||
| 1 | 39 | 4486 | Y | N | 27.4 | 41.4 | 18.9 | 8.4 | 90.1 | 14.1 | 28.9 |
| 41.4 | 20.4 | 7.3 | 93.0 | 16.9 | 28.5 | ||||||
| 2 | 34* | 2070 | N | N | 40.2 | 32.5 | 24.3 | 14 | 92.7 | 14.8 | 30.1 |
| 32.5 | 25.0 | 13.6 | 91.2 | 18.3 | 30.5 | ||||||
| 3 | 28 | 1000 | Y | N | 41.0 | 33.4 | 27.2 | 8.3 | 86.8 | 11.6 | 26.5 |
| 4 | 34* | 2060 | N | N | 40.2 | 33.7 | 24.8 | 7.7 | 94.1 | 10.6 | 31.0 |
| 33.7 | 25.0 | 7.0 | 92.7 | 13.0 | 31.0 | ||||||
GA, gestational age; BW, birth weight; IDM, infant of mother with diabetes; Y, yes; N, no; BMI, body mass index; HCT, hematocrit.
Bolded values indicate a laboratory parameter outside the reference interval for gestational and postnatal age.24
Twins with alpha thalassemia trait (hemoglobin Barts, plus a 3-bp duplication in the alpha globin gene [c.364_366dupGTG]).22
We identified 22 CBCs drawn from 20 neonates within their first 48 hours of birth who had iron-limited erythropoiesis but a normal hematocrit (Table II; available at www.jpeds.com). In these CBCs, the new parameters MicroR and HYPO-He were more sensitive in detecting iron deficiency compared with MCV and MCH. Among the 22 CBCs, MicroR was abnormal in 19 (86.4%), whereas the MCV was abnormal in only 7 (31.8%) (P = .001). The HYPO-He was abnormal in all 22 CBCs (100%), whereas the MCH was abnormal in only 15 (68.2%) (P = .023).
Table II.
Twenty-two CBCs drawn within the first 48 hours of birth from 20 neonates with congenital iron-deficient erythropoiesis but not anemia
| Patient | GA, wk | BW, g | IDM, Y/N | SGA, Y/N | Mother’s BMI | HCT, % | Ret-He, pg | MicroR, % | MCV, fL | HYPO-HE, % | MCH, Pg |
|---|---|---|---|---|---|---|---|---|---|---|---|
|
| |||||||||||
| 1 | 40 | 4111 | N | N | 38.1 | 49.5 | 25.7 | 10.5 | 82.0 | 5.7 | 27.8 |
| 2 | 36 | 3860 | Y | N | 37.1 | 48.2 | 20.3 | 5.8 | 91.8 | 14.8 | 29.3 |
| 3 | 33 | 3232 | Y | N | 37.1 | 54.4 | 21.0 | 5.3 | 89.8 | 17.3 | 28.9 |
| 4 | 27 | 455 | ? | Y | 30.0 | 36.4 | 23.4 | 5.2 | 113.8 | 10.3 | 37.2 |
| 5 | 32 | 2590 | Y | N | 35.5 | 54.6 | 20.2 | 4.9 | 92.7 | 12.4 | 29.4 |
| 6 | 33 | 1320 | ? | Y | 52.5 | 45.4 | 20.6 | 4.8 | 104.4 | 12.7 | 32.2 |
| 7 | 33 | 1985 | Y | N | 36.6 | 45.0 | 21.5 | 4.5 | 95.7 | 10.2 | 29.1 |
| 8 | 38 | 4850 | Y | N | 34.1 | 53.4 | 23.9 | 4.3 | 112.5 | 10.7 | 37.3 |
| 53.4 | 24.4 | 4.2 | 112.5 | 11.2 | 37.5 | ||||||
| 9 | 35 | 2660 | Y | N | 45.0 | 52.5 | 22.8 | 4.1 | 101.4 | 12.3 | 32.6 |
| 26.0 | 4.0 | 103.1 | 10.1 | 32.9 | |||||||
| 10 | 36 | 3485 | Y | N | 38.7 | 52.1 | 20.6 | 4.0 | 96.5 | 13.2 | 30.4 |
| 11 | 38 | 4850 | Y | N | 34.1 | 46.8 | 20.4 | 3.9 | 113.5 | 17.9 | 37.1 |
| 12 | 28 | 780 | Y | Y | 33.0 | 41.1 | 20.8 | 3.7 | 114.2 | 10.5 | 34.7 |
| 13 | 30 | 2275 | Y | N | 25.0 | 62.5 | 23.9 | 3.5 | 99.7 | 11.6 | 30.9 |
| 14 | 36 | 4545 | Y | N | 36.0 | 53.2 | 21.7 | 3.5 | 102.5 | 18.0 | 31.6 |
| 15 | 35 | 3240 | Y | N | 26.9 | 57.5 | 20.1 | 3.3 | 100.0 | 13.9 | 30.4 |
| 16 | 30 | 1050 | ? | Y | 55.8 | 55.5 | 25.3 | 2.9 | 114.4 | 13.0 | 34.0 |
| 17 | 38 | 4128 | Y | N | 29.3 | 52.0 | 22.7 | 2.9 | 109.5 | 11.3 | 34.7 |
| 18 | 30 | 1165 | N | N | 23.0 | 48.7 | 22.6 | 2.4 | 105.0 | 11.4 | 31.9 |
| 19 | 36 | 3486 | ? | N | 24.0 | 45.5 | 25.6 | 2.1 | 102.2 | 11.2 | 34.8 |
| 20 | 38 | 4610 | Y | N | 40.2 | 61.3 | 19.9 | 1.6 | 123.8 | 15.9 | 32.5 |
?, undocumented.
All patients had normal hemoglobin (FA) on state metabolic screen. Bolded values indicate a laboratory parameter that is outside the reference interval for gestational and postnatal age.24
Discussion
In 1929, Dr Maxwell M. Wintrobe published a method for accurately measuring the percentage of blood comprised of RBCs—the hematocrit.25 The following year, he reported a method for measuring the volume of the average circulating red cell, in femtoliters (fL; 10−15 L), which could be used to judge whether the cells were on average of normal size or smaller or larger than normal.26 He also reported a method to determine the average hemoglobin content of a red cell, in picograms (pg; 10−12 g), to judge whether the average red cell contained a normal, small, or large amount of hemoglobin. Finally, he described a measurement of the hemoglobin concentration in the average red cell (g/dL of blood) as the mean corpuscular hemoglobin concentration.26
The hematocrit and the 3 measurements that Dr Wintrobe termed the red cell “indices” formulated the basis of his classification of anemias as microcytic, normocytic, or macrocytic, and for judging whether or not erythrocytes were hypochromic.5 Although the methods for performing the measurements he described have improved through advanced technology, Dr Wintrobe’s classification has remained the standard approach for the past 90 years.4
Iron deficiency is a common, yet surely underdiagnosed problem in neonatology.27–30 The importance of recognizing neonatal iron deficiency derives from observations that when a neonate is iron-deficient, lasting adverse neurodevelopmental deficiencies can occur.29,30 Consequently, much effort is needed to diagnose and effectively treat iron deficiency in neonates.
Previous studies by our group indicate that iron deficiency can be present at birth, and that women at greater risk for delivering a baby with iron deficiency include those with obesity, diabetes, or giving birth prematurely.31,32 The gold standard for diagnosing iron-deficient erythropoiesis consists of a battery of tests, including soluble transferrin receptor, zinc protoporphyrin-to-heme ratio, serum iron, iron-binding capacity, transferrin saturation, serum ferritin, and RET-He.31 However, the amount of blood required for this battery generally prevents the routine use of this battery in newborn infants. Thus, in neonatology practice, screening tests, such as hematocrit or hemoglobin, are sometimes used to assess for iron deficiency. However, decreases in the these values occur late in iron deficiency, so using them as a screen will miss neonates who are iron deficient but not yet anemic. Low values for the RBC indices MCV and MCH can support the diagnosis of iron-deficient erythropoiesis, but these indices represent average values for erythrocyte size and hemoglobin content and do not precisely quantify the microcytic or hypochromic erythrocyte populations. Moreover, these RBC indices are not specific for iron-limited erythropoiesis; they also can be low in neonates with alpha thalassemia.17
A simple and cost-effective alternative method for recognizing iron deficiency, and perhaps alpha thalassemia, can be performed as part of a routine CBC with no additional phlebotomy, run time, or expense.1–3,7–10 This consists of 2 measurements, one that quantifies microcytic erythrocytes, MicroR, and another that quantifies hypohemoglobinized erythrocytes, HYPO-He. We devised the present study to construct reference intervals for these 2 parameters in neonates.
We found that at birth and over the next 90 days, the upper reference intervals for MicroR and HYPO-He were much higher than those reported in adults. This was somewhat surprising, because erythrocytes of neonates are typically much larger and contain more hemoglobin compared with those of adults.24 However, the widespread variability in RBC size in neonates, defining an increase in anisocytosis, is consistent with their higher red cell distribution width, a metric of anisocytosis.24
After creating these reference intervals, we found that a high MicroR% and HYPO-He% were more sensitive markers of iron-deficient neonates compared with the standard RBC indices. Specifically, neonates born with iron-deficiency anemia had abnormalities of the MCV and MCH, as well as of MicroR and HYPO-He values. However, neonates with lesser degrees of iron deficiency that had not yet progressed to anemia were better identified by abnormal MicroR and HYPO-He values.
We recognize several shortcomings of our study. First, as with other reference interval studies of neonates, our database was derived not from healthy volunteers, but rather from CBCs ordered by clinicians.24 We attempted to scrub the database of abnormal values (eliminating those with a diagnosis of iron deficiency, thalassemia, or hereditary spherocytosis). However, we recognize that this is an imperfect process; thus, an unknown proportion of our data surely included abnormal subjects. We speculate that unknown microcytic pathology may be responsible for the higher 90th percentile upper reference interval in our data. Second, we used only one type of hematology analyzer (Sysmex), but other devices with this capacity include the CELL-DYN Sapphire analyzer (Abbott) and the ADVIA 120 (Siemens Healthineers). Sysmex hematology analyzers are available in many children’s hospitals in the US. We are uncertain whether other instruments would generate reference intervals identical to ours. Wang et al and Ma1ecka et al directly compared values generated by Sysmex hematology analyzers against values generated by analyzers from other manufacturers and found general consistency; however, those comparisons used adult subjects, not neonates.33,34 Third, we recognize that our information is preliminary and that we need to test more neonatal patients in other hospitals to validate its usefulness.
With the new neonatal reference intervals for MicroR and HYPO-He, we have what we judge to be a better means of quantifying microcytosis and hypochromia in neonates. Among newborn infants with iron-deficiency anemia, the MCV and MCH perform very well as indicators, but for those with subtler forms of iron deficiency in whom anemia has not yet developed but which nonetheless might result in neurodevelopmental delays, the MicroR and HYPO-He parameters are better biomarkers.
Acknowledgments
Supported in part by the National Institute of Diabetes and Digestive and Kidney Diseases Cooperative Centers of Excellence in Hematology (U54DK110858 [to R.C.]). The authors declare no conflicts of interest.
We thank Dr Kendell R. German, University of Washington, for reviewing the manuscript and Ryan Wilcox and Jennifer Sorensen, Intermountain Healthcare Laboratory Services, for assistance in procuring CBC data. We also thank Molly Adams of the Intermountain Healthcare Women and Newborns Research Department for assistance with Institutional Review Board application and communication.
Glossary
- CBC
Complete blood count
- MCH
Mean corpuscular hemoglobin
- MCV
Mean corpuscular volume
- RBC
Red blood cell
- RET-He
Reticulocyte hemoglobin equivalent
References
- 1.Urrechaga E, Borque L, Escanero JF. Potential utility of the new Sysmex XE 5000 red blood cell extended parameters in the study of disorders of iron metabolism. Clin Chem Lab Med 2009;47:1411–6. [DOI] [PubMed] [Google Scholar]
- 2.Urrechaga E, Borque L, Escanero JF. Percentage of hypochromic erythrocytes as a potential marker of iron availability. Clin Chem Lab Med 2011;50:685–7. [DOI] [PubMed] [Google Scholar]
- 3.Urrechaga E, Boveda O, Aguayo FJ, de la Hera P, Muñoz RI, Gallardo I, et al. Percentage of hypochromic erythrocytes and reticulocyte hemoglobin equivalent predictors of response to intravenous iron in hemodialysis patients. Int J Lab Hematol 2016;38:360–5. [DOI] [PubMed] [Google Scholar]
- 4.Smock KJ. Examination of the blood and bone marrow. In: Greer JP, Rodgers GM, Glader B, Arber DA, Means RT Jr., List AF, et al. , eds. Wintrobe’s clinical hematology. 14th ed. Philadelphia: Wolters Kluwer; 2019. p. 1–16. [Google Scholar]
- 5.Wintrobe MM. Classification of the anemias on the basis of differences in the size and hemoglobin content of the red corpuscles. Proc Soc Exp Biol Med 1930;27:1071–3. [Google Scholar]
- 6.Buttarello M, Pajola R, Novello E, Rebeschini M, Cantaro S, Oliosi F, et al. Diagnosis of iron deficiency in patients undergoing hemodialysis. Am J Clin Pathol 2010;133:949–54. [DOI] [PubMed] [Google Scholar]
- 7.Urrechaga E, Borque L, Escanero JF. The role of automated measurement of RBC subpopulations in differential diagnosis of microcytic anemia and β-thalassemia screening. Am J Clin Pathol 2011;135:374–9. [DOI] [PubMed] [Google Scholar]
- 8.Urrechaga E Red blood cell microcytosis and hypochromia in the differential diagnosis of iron deficiency and beta-thalassaemia trait. Int J Lab Hematol 2009;31:528–34. [DOI] [PubMed] [Google Scholar]
- 9.Urrechaga E Discriminant value of % microcytic/% hypochromic ratio in the differential diagnosis of microcytic anemia. Clin Chem Lab Med 2008;46:1752–8. [DOI] [PubMed] [Google Scholar]
- 10.Urrechaga E, Borque L, Escanero JF. Erythrocyte and reticulocyte parameters in iron deficiency and thalassemia. J Clin Lab Anal 2011;25:223–8. [DOI] [PMC free article] [PubMed] [Google Scholar]
- 11.German K, Vu PT, Irvine JD, Juul SE. Trends in reticulocyte hemoglobin equivalent values in critically ill neonates, stratified by gestational age. J Perinatol 2019;39:1268–74. [DOI] [PubMed] [Google Scholar]
- 12.Bahr TM, Baer VL, Ohls RK, Christensen TR, Ward DM, Bennett ST, et al. Reconciling markedly discordant values of serum ferritin versus reticulocyte hemoglobin content. J Perinatol 2021;41:319–26. [DOI] [PubMed] [Google Scholar]
- 13.Gerday E, Brereton JB, Bahr TM, Elmont JO, Fullmer S, Middleton BA, et al. Urinary ferritin; a potential noninvasive way to screen NICU patients for iron deficiency. J Perinatol 2021;41:1419–25. [DOI] [PubMed] [Google Scholar]
- 14.Judkins AJ, MacQueen BC, Christensen RD, Henry E, Snow GL, Bennett ST. Automated quantification of fragmented red blood cells: neonatal reference intervals and clinical disorders of neonatal intensive care unit patients with high values. Neonatology 2019;115:5–12. [DOI] [PubMed] [Google Scholar]
- 15.Bahr TM, Judkins AJ, Christensen RD, Baer VL, Henry E, Minton SD, et al. Neonates with suspected microangiopathic disorders: performance of standard manual schistocyte enumeration vs. the automated fragmented red cell count. J Perinatol 2019;39:1555–61. [DOI] [PubMed] [Google Scholar]
- 16.Bahr TM, Judkins AJ, Baer VL, Henry E, Grubb PH, Hulse W, et al. The fragmented red cell count can support the diagnosis of a microangiopathic neonatal condition. J Perinatol 2020;40:354–5. [DOI] [PubMed] [Google Scholar]
- 17.Chui DH. Alpha-thalassemia: Hb H disease and Hb Barts hydrops fetalis. Ann N Y Acad Sci 2005;1054:25–32. [DOI] [PubMed] [Google Scholar]
- 18.Christensen RD, Yaish HM, Gallagher PG. A pediatrician’s practical guide to diagnosing and treating hereditary spherocytosis in neonates. Pediatrics 2015;135:1107–14. [DOI] [PMC free article] [PubMed] [Google Scholar]
- 19.Phillips AK, Roy SC, Lundberg R, Guilbert TW, Auger AP, Blohowiak SE, et al. Neonatal iron status is impaired by maternal obesity and excessive weight gain during pregnancy. J Perinatol 2014;34:513–8. [DOI] [PMC free article] [PubMed] [Google Scholar]
- 20.Jones AD, Zhao G, Jiang YP, Zhou M, Xu G, Kaciroti N, et al. Maternal obesity during pregnancy is negatively associated with maternal and neonatal iron status. Eur J Clin Nutr 2016;70:918–24. [DOI] [PMC free article] [PubMed] [Google Scholar]
- 21.Bahr TM, Benson AE, Kling PJ, Ohls RK, Ward DM, Christensen RD. Maternal obesity and impaired offspring neurodevelopment: could fetal iron deficiency be a pathogenic link? J Perinatol 2021;41:1199–200. [DOI] [PMC free article] [PubMed] [Google Scholar]
- 22.Bahr TM, Lozano-Chinga M, Agarwal AM, Meznarich JA, Gerday E, Smoot JL, et al. Dizygotic twins with prolonged jaundice and microcytic, hypochromic, hemolytic anemia with pyropoikilocytosis. Blood Cells Mol Dis 2020;85:102462. [DOI] [PubMed] [Google Scholar]
- 23.Christensen RD, Jopling J, Henry E, Wiedmeier SE. The erythrocyte indices of neonates, defined using data from over 12,000 patients in a multihospital health care system. J Perinatol 2008;28:24–8. [DOI] [PubMed] [Google Scholar]
- 24.Henry E, Christensen RD. Reference intervals in neonatal hematology. Clin Perinatol 2015;42:483–97. [DOI] [PubMed] [Google Scholar]
- 25.Wintrobe MM. A simple and accurate hematocrit. J Lab Clin Med 1929;15:287–9. [Google Scholar]
- 26.Wintrobe MM. The volume and hemoglobin content of the red blood corpuscle: simple method of calculation, normal findings, and value of such calculations in the anemias. Am J Med Sci 1929;177:513–23. [Google Scholar]
- 27.Georgieff MK. Iron deficiency in pregnancy. Am J Obstet Gynecol 2020;223:516–24. [DOI] [PMC free article] [PubMed] [Google Scholar]
- 28.Siddappa AM, Olson RM, Spector M, Northrop E, Zamora T, Brearley AM, et al. High prevalence of iron deficiency despite standardized high-dose iron supplementation during recombinant erythropoietin therapy in extremely low gestational age newborns. J Pediatr 2020;222:98–105.e3. [DOI] [PMC free article] [PubMed] [Google Scholar]
- 29.Cusick SE, Georgieff MK, Rao R. Approaches for reducing the risk of early-life iron deficiency-induced brain dysfunction in children. Nutrients 2018;10:227. [DOI] [PMC free article] [PubMed] [Google Scholar]
- 30.Zamora TG, Guiang SF 3rd, Widness JA, Georgieff MK. Iron is prioritized to red blood cells over the brain in phlebotomized anemic newborn lambs. Pediatr Res 2016;79:922–8. [DOI] [PMC free article] [PubMed] [Google Scholar]
- 31.MacQueen BC, Christensen RD, Ward DM, Bennett ST, O’Brien EA, Sheffield MJ, et al. The iron status at birth of neonates with risk factors for developing iron deficiency: a pilot study. J Perinatol 2017;37:436–40. [DOI] [PMC free article] [PubMed] [Google Scholar]
- 32.MacQueen BC, Christensen RD, Baer VL, Ward DM, Snow GL. Screening umbilical cord blood for congenital iron deficiency. Blood Cells Mol Dis 2019;77:95–100. [DOI] [PMC free article] [PubMed] [Google Scholar]
- 33.Wang J, Zhao S, Su Z, Liu X. Analytical comparison between two hematological analyzer systems: Mindray BC-5180 vs Sysmex XN-1000. J Clin Lab Anal 2019;33:e22955. [DOI] [PMC free article] [PubMed] [Google Scholar]
- 34.Małecka M, Ciepiela O. A comparison of Sysmex-XN 2000 and Yumizen H2500 automated hematology analyzers. Pract Lab Med 2020;22:e00186. [DOI] [PMC free article] [PubMed] [Google Scholar]


