

Abstract
Background:
Induction of labor (IOL) has been studied as a strategy to reduce rates of cesarean birth (CB). Midwifery care models are also associated with lower CB rates, even considering that midwives perform fewer IOLs. In this study, we examined childbirth outcomes among individuals undergoing IOL in certified nurse-midwifery (CNM) care as compared to two categories of expectant management (EM).
Methods:
Data were from two CNM practices in the United States (2007–2018). The sample was limited to term nulliparous, nondiabetic, singleton, vertex pregnancies. Individuals having an IOL in each week of gestation (37th, 38th, etc) were compared with those having EM. Two methods for defining EM were considered as each method when used alone limits interpretation. Inclusive EM included all births starting in the same week as IOL. The exclusive EM group was comprised of all births occurring in the next gestational age week relative to the IOL cases (ie, 39th week IOL versus all births occurring at 40 weeks or later). Adjusted regression models were used to examine differences in CB by IOL versus EM (inclusive or exclusive) at each week of gestation.
Results:
Among 4057 CNM-attended pregnancies, the overall rate of IOL was 28.9% (95% CI 27.5%−30.3%) and CB was 19.4% (95% CI 18.1%−20.6%). Most IOLs involved obstetric indications. CB rates did not differ by IOL versus inclusive EM when performed between 37 and 40 weeks, though post hoc power calculations indicate these comparisons were low-powered. In multivarable models, IOL in the 40th week was associated with lower odds for CB versus exclusive EM definition (ie, births occurring at 41 0/7 weeks or later, OR (95% CI) = 0.57 (0.36–0.90)). This finding is explained by the large increase in CB rates after IOL during the 41st week (34.3%, up from 21.9% in the 40th week). Furthermore, the adjusted odds for CB in the 41st week were 55% higher relative to inclusive EM (all labors 41st week and later), OR (95% CI) = 1.55(1.11–2.15). Neonatal outcomes (aside from macrosomia) did not differ by IOL/EM at any gestational age.
Discussion:
Outcomes for nulliparous individuals having IOL or EM in the context of a midwifery model of care include low overall use of CB and low frequency of IOL before 41 weeks. In this model, IOL in the 40th week may lower CB odds, especially in comparison to those who do not have spontaneous labor and later undergo an IOL in the 41st week.
Keywords: labor induction, cesarean birth, midwifery
1 |. INTRODUCTION
Historically, outcomes for pregnant individuals undergoing induction of labor (IOL) have been reported in comparison with those in spontaneous labor.1 Recently, this approach has been critiqued.2–4 Authors note that spontaneous labor is not a management decision; thus, the more accurate comparison group for IOL is expectant management (EM). People having EM will proceed to either spontaneous labor, IOL, or unlabored cesarean birth (CB). Many studies have found that IOL versus EM is associated with lower CB rates; however, many of these studies examined elective IOL.5–8
Outcomes for families cared for by certified nurse-midwives (CNM) have also been a focus of study in recent years.9 People may choose midwifery care because they value limiting intervention in otherwise healthy pregnancy and labor.10–14 In a midwifery care model, IOL is generally performed for medical indications or in the setting of prolonged pregnancy (41 weeks or greater weeks of gestation); thus, data on elective IOL in midwifery care are less available.15 Researchers have demonstrated that low-risk individuals receiving midwifery care (compared with physician care) experience lower rates of CB and other obstetric interventions, including fewer IOLs, less augmentation with oxytocin, and less neuraxial analgesia.16–19 For these reasons, midwifery models of care offer an alternative to early elective IOL (as has occurred in response to the ARRIVE trial7) for reducing CB rates. No studies have specifically compared EM versus IOL in a sample of people cared for by midwives. The primary purpose of this study was to examine the occurrence of CB and other birth outcomes after IOL or EM within a sample of nulliparous individuals who received nurse-midwifery care in the United States using two different definitions of EM.
2 |. METHODS
2.1 |. Design
This was an observational cohort study using prospectively collected data from two large, university-based, academic certified nurse-midwifery (CNM) practices in the United States. The Institutional Review Board at the Oregon Health and Science University approved this protocol, and standard data use agreements were signed before merging de-identified data. Data collection was initiated as part of a repository for purposes of quality assessment, and a waiver of consent processes was granted.
2.2 |. Setting
The academic settings are located in Oregon and Michigan, with each practice caring for approximately 500 and 700 individuals each year, respectively. Births occurred in the hospital setting with midwives rotating shifts for inpatient care (rather than a continuity of care model). Midwife groups consist of more than 10 regular staff midwives at each site with several additional occasional staff as well. Routine data collection with current variables capturing practice processes and outcomes has been ongoing since 2012 in Oregon and 2007 in Michigan. The demographic composition of the samples used for this research reflects the suburban/urban communities served by these practices. Data from these practices, and the methods used to collect the data, are published elsewhere.20,21 Briefly, the data collection occurs at the time of entry to care by the midwife who conducts the first prenatal visit and again at delivery by the attending midwife. Data are entered into secure, encrypted systems for database management. Data cleaning steps occurred at both sites for validating confusing/missing data before analysis.
Both academic center settings in this study have a similar approach to the care of spontaneously laboring, low-risk people. This approach is characterized by helping individuals manage latent labor at home, welcoming doula involvement, and offering strategies for coping during labor that include: water immersion, water birth, and more recently nitrous oxide. In addition, both practices utilize intermittent auscultation and/or telemetry fetal monitoring for appropriate patients and provide as much hands-on support by nurse-midwives as possible during labor, in partnership with nursing staff. Furthermore, both practices educate nurse-midwives; thus, births frequently involve a student midwife in each setting.
For labor induction, both CNM practices offered IOL starting at 41 0/7 weeks unless there was an earlier indication for IOL based on medical or obstetric need, and rarely, because of social circumstances (eg, distance to hospital, partner involvement). While elective IOL before 41 weeks did occur during the time period of focus for this study, it was not routine. Antenatal testing for fetal surveillance (nonstress test and amniotic fluid assessments) was initiated at 41 0/7 weeks (unless indicated earlier) and repeated at 41 3/7 or 41 4/7 weeks. CNMs in these practices supported EM until 42 0/7 weeks’ gestation per patient preference, and recommended IOL at that gestational age. Rarely, the recommendation for IOL at 42 weeks was declined.
2.3 |. Sample
Data were collected from 2007 to 2018 (Michigan) and 2012 to 2018 (Oregon) for a total initial sample of 11,367. We excluded multiparous individuals (as this group has the lowest rate of cesarean overall), those with preterm birth (birth at less than 37 0/7 weeks), breech presentation, fetal anomalies if noted prenatally or at birth, planned CB (ie, indicated for placenta previa), and gestational diabetes (diet or medication control). We restricted the sample to those who had practice-affiliated CNM care during both the antenatal and intrapartum periods [eg, we excluded people transferring into care during the intrapartum period (ie, home birth transfer)]. We also excluded cases missing information on gestational age, mode of labor onset, or mode of delivery (Figure 1). A composite variable for hypertensive disorders was generated based on any hypertensive diagnosis [gestational hypertension, preeclampsia, or eclampsia] denoted either before labor onset (antepartum diagnosis) or during intrapartum.
FIGURE 1.
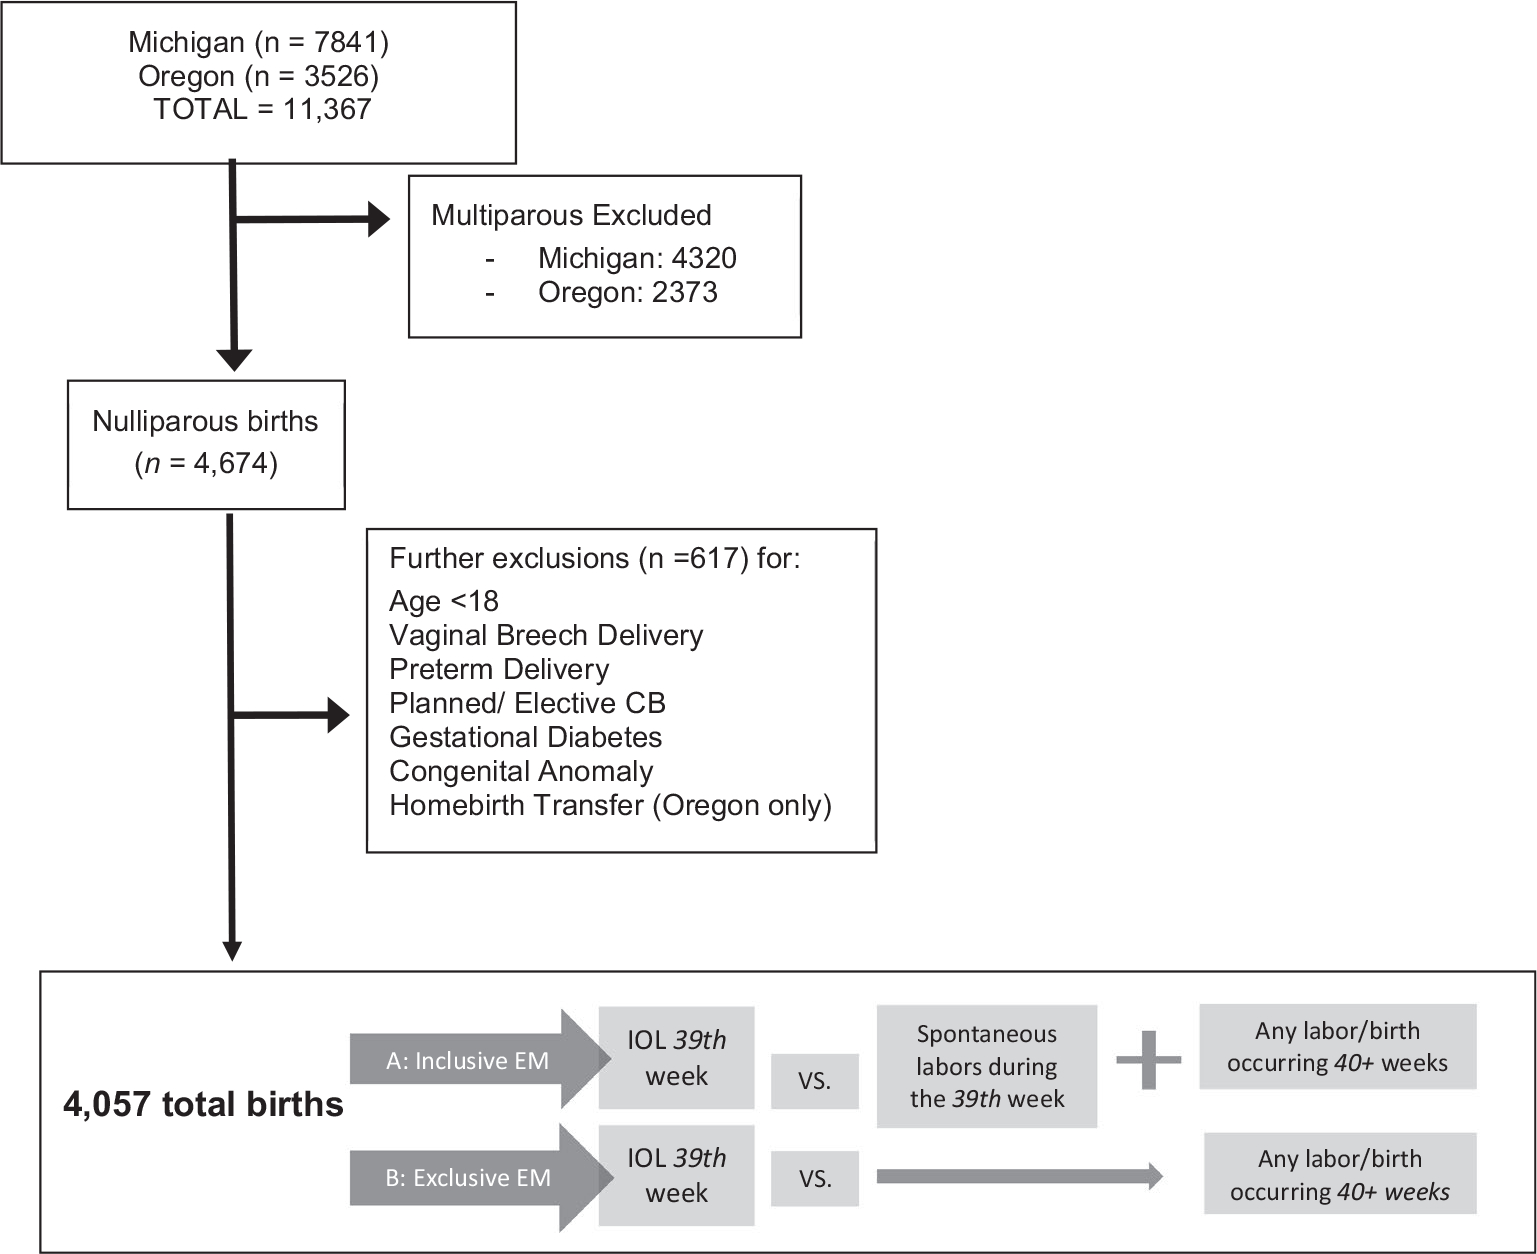
Sample flowchart and diagram of the two expectant management definitions
2.4 |. Exposure
2.4.1 |. Induction of labor and expectant management (inclusive or exclusive)
The exposure was IOL occurring within the 37th (37 + 0–6 days), 38th, 39th, 40th week, or the 41st week. Individuals not undergoing IOL during the index gestational age week were considered to be undergoing EM. There is variation in how EM has been defined in the literature.22 Figure 1 illustrates the difference between these two most common approaches. 1) The “inclusive” method retains all spontaneous labors in the EM group during the same week as the IOL, in addition to any birth occurring after the exposure IOL week regardless of the mode of labor onset [Figure 1, see a.]. 2) The “exclusive” EM method excludes spontaneous labors in the IOL exposure week, including only births occurring n + 1 week or later (eg, 40th-week IOL versus any birth in the 41st week or later [Figure 1, see b.]). Both of these methods introduce different biases. The inclusive method biases estimates toward lower cesarean rates in the EM group because it includes spontaneous labors occurring during the same week that IOL occurred, and spontaneous labor is associated with lower CB rates. The exclusive method biases estimates toward lower cesarean rates in the IOL group because it excludes these spontaneous labors. Given evidence of bias with either approach to defining EM, we chose to examine results using both definitions. We also characterized the indications for IOL as reported by the midwife at the time of birth. IOL indications were categorized by the following: (a) prelabor rupture of membranes (PROM); (b) medical risk factors (ie, oligohydramnios, IUGR, hypertension); (c) advanced maternal age (35 years or older); (d) 41 0/7 weeks or greater gestation; and (e) social factors / other reasons including elective inductions.
2.5 |. Outcomes
The primary outcome for this study was the occurrence of unplanned CB. In addition, we examined frequency of obstetric events /procedures between IOL and EM groups including the following: diagnosis or treatment for hypertension, postpartum hemorrhage (1000mL or higher blood loss), blood transfusion, labor augmentation in spontaneous labor, episiotomy, 3rd-degree and 4th-degree perineal injury, suspected intra-amniotic infection, instrument-assisted vaginal birth, shoulder dystocia, NICU admission, and a composite adverse neonatal outcome (including any of the following: NICU admission, meconium aspiration, stillbirth, or perinatal death).
2.6 |. Statistical analyses
We conducted descriptive analyses using bivariate parametric and nonparametric tests, as appropriate, to examine differences between sites by maternal demographic, pregnancy, and birth outcomes. Using logistic regression modeling, we estimated odds ratios for CB after IOL compared with EM separately by gestational week [37th, 38th, 39th, 40th, and 41st weeks]. We examined how the variation in the definition of EM might change the study findings by repeating the analyses for both IOL versus inclusive/exclusive EM. Covariable selection was informed by published studies.5,8 In the main model, we included maternal age, prepregnancy body mass index (BMI), neonatal weight in grams at birth, hypertension, and exceeding gestational weight gain recommendations (per the Institute of Medicine guidelines) as covariates in the regression models. Additional models were used to examine practice patterns including the site and year of delivery. We examined the primary outcome in an adjusted model with and without neuraxial analgesia use, as the individuals seeking midwifery care in this sample were largely seeking low-intervention birth, ambulation during labor, and/or water immersion and would therefore often require more hands-on midwifery and nursing care.
Differences in secondary outcomes were tested using the chi-square, Fisher exact, or Spearman rank, as indicated. Missing data were handled by listwise deletion in regression models. Stata 15.1 (College Station, TX) was used for the analysis, and Microsoft Excel was used to generate figures. We hypothesized that EM would be associated with higher rates of CB in regression analyses compared with IOL.
3 |. RESULTS
The final analytic sample consisted of 4057 nulliparous people who gave birth at 37 weeks or beyond (2803 Michigan, 1254 Oregon). Sample characteristics by site are shown in Table 1. Overall, the mean age was 28.9 (SD 5.3) years, 17% were 35 or older, and 56% had a normal prepregnancy BMI (>19.0 and <25.0 kg/m2). Individuals in Oregon were slightly older (30 years vs 28.3 years) with lower rates of overweight and obesity compared with those in Michigan. Each site recorded race/ethnicity variables slightly differently, but the majority of the sample was identified (either by the midwife or through self-report) as white (80%) with a more racially diverse sample from the Michigan site. Race/ethnicity has been used as a covariate in other studies; however, this variable was not related to use of IOL or CB outcomes in our sample and was therefore not used in our analyses.
TABLE 1.
Demographic and clinical sample characteristics of 4057 nulliparous women in two tertiary care academic nurse-midwifery practices
| Variable | Sample | Michigan | Oregon | P-value |
|---|---|---|---|---|
| Total n | 4057 | 2803 | 1253 | |
| Maternal age | 0.000 | |||
| Mean (SD) | 28.9 (5.3) | 28.3 (5.4) | 30.0 (5.0) | |
| ≥35 y | 643 (16.9) | 291 (10.5) | 227 (18.9) | |
| Race/ethnicity | <0.001 | |||
| White | 3188 (80.2) | 2093 (76.1) | 1096 (89.2) | |
| Black | 350 | 325 (11.8) | 25 (2.0) | |
| Hispanic/Latina | 219 | 108 (3.92) | 111 (9.0) | |
| Asian | 193 | 123 (4.5) | 70 (5.6) | |
| Native American/Alaska Native | 14 | 9 (0.3) | 5 (0.4) | |
| Native Hawaiian or Pacific Islander | 10 | n/a | 10 (0.8) | |
| Middle Eastern | 88 | 88 (3.2) | n/a | |
| Identified by two or more/other | 26 | 3 (0.1) | 23 (1.9) | |
| Pre-pregnancy BMI | ||||
| Normal | 2038 (55.9) | 1251 (52.0) | 787 (63.5) | <0.001 |
| Underweight | 126 (3.5) | 83 (3.5) | 43 (3.5) | |
| Overweight | 920 (25.2) | 658 (27.3) | 262 (21.2) | |
| Obese | 561 (15.4) | 413 (17.2) | 148 (12.0) | |
| Gestational age at birth (weeks +days) | ||||
| 37 + 0–37 + 6 | 175 (4.3) | 122 (4.4) | 53 (4.2) | |
| 38 + 0–38 + 6 | 430 (10.6) | 317 (11.3) | 113 (9.0) | |
| 39 + 0–39 + 6 | 988 (24.4) | 721 (25.7) | 267 (21.3) | |
| 40 + 0–40 + 6 | 1303 (32.2) | 887 (31.7) | 416 (33.2) | <0.001 |
| 41 + 0–41 + 6 | 962 (23.7) | 632 (22.6) | 330 (26.3) | |
| 42 + weeks | 199 (4.9) | 124 (4.4) | 75 (5.9) | |
| Delivery year | ||||
| 2007–2011 | 1007 | 1007 | 0 | <0.001 |
| 2012–2018 | 3050 | 1796 | 1254 | |
| Reasons for labor induction | 0.39 | |||
| Labor induction | 1172 (28.9) | 821 (29.3) | 351 (27.9) | |
| Prelabor rupture of membranes | 246 (20.9) | 151 (18.3) | 95 (27.1) | |
| Elective postdates | 205 (17.5) | 168 (20.4) | 37 (10.5) | |
| Medical or obstetric risks/conditions | 531 (45.3) | 364 (44.3) | 167 (47.6) | |
| Social/other elective | 46 (3.4) | 30 (3.6) | 16 (4.5) | |
| Advanced maternal age | 32 (2.7) | n/a | 32 (9.1) | |
| Augmentation (spontaneous labors) | 1087 (37.6) | 704 (35.3) | 383 (42.8) | <0.001 |
| Neuroaxial analgesia | 2118 (60.1) | 1405 (61.8) | 712 (57.0) | 0.006 |
| Hydrotherapy | 2032 (54.9) | 1414 (57.3) | 618 (50.1) | <0.001 |
| Intra-amniotic infection | 197 (6.3) | 94 (5.1) | 103 (8.2) | <0.001 |
| Hypertensive disorder | 352 (8.8) | 233 (8.4) | 119 (9.5) | 0.26 |
| Cesarean birth | 787 (19.4) | 558 (19.9) | 229 (18.3) | 0.22 |
| Instrument-assisted vaginal birth | 136 (3.9) | 81 (3.6) | 55 (5.4) | 0.25 |
| 3rd/4th-degree perineal laceration | 214 (6.5) | 133 (5.9) | 81 (7.9) | 0.03 |
| Episiotomy | 146 (4.5) | 82 (3.7) | 64 (6.1) | 0.002 |
| Postpartum hemorrhage (>/=1000 mL) | 316 (8.5) | 204 (8.3) | 112 (8.9) | 0.46 |
| Vaginal birth | 100 (3.2) | 45 (2.1) | 55 (5.4) | |
| Cesarean birth | 216 (39.9) | 159 (48.2) | 57 (25.3) | |
| Blood transfusion | 44 (1.2) | 14 (0.6) | 30 (2.4) | <0.001 |
| Infant weight, mean(SD), grams | 3463.6 (448.7) | 3454.2 (453.4) | 3484.34 (437.5) | 0.04 |
| Macrosomia (>/=4000 g) | 507 (12.5) | 363 (13.0) | 144 (11.5) | 0.19 |
| 5-minute APGAR <7 | 94 (2.3) | 61 (2.2) | 33 (2.6) | 0.37 |
| Neonatal composite outcome (any of the following outcomes) | 190 (4.7) | 71 (2.5) | 119 (9.5) | <0.001 |
| NICU Admissiona | 181 (4.5) | 64 (2.3) | 117 (9.4) | <0.001 |
| Meconium aspiration | 19 (0.5) | 10 (0.4) | 9 (0.7) | 0.19 |
| Stillbirth or perinatal death | 5 (0.1) | 3 (0.1) | 2 (0.2) | 0.66 |
NICU admission also includes protocol-driven observation periods at Oregon site with return to general recovery after 4 h.
The rate of IOL overall was 28.9% and was similar between sites. Differences were noted by site in terms of the gestational age at delivery, with births among Oregonians occurring later in gestation, despite a similar rate of labor induction. Use of neuraxial analgesia overall was 60.1% and was slightly lower in the Oregon site (57% vs 61.8% Michigan, P = 0.006). Rates of IOL ranged by gestational age week from a low of 16.4% (40th week) to a high of 68.8% (42nd week or beyond). The majority of individuals in the sample gave birth at 40 weeks or later gestation (60.8%, n = 2464), and 199 (4.9%) births occurred at 42 weeks or greater. Most IOLs were indicated for medical or obstetric concerns or prelabor rupture of membranes without labor (66.2%). The greatest proportion of births occurring after IOL were during late-term gestation23 (41 0/7 weeks to 41 6/7) regardless of indication (Table 2).
TABLE 2.
Frequency of IOL and EM by gestational age. Frequency of CB by each labor management approach and by gestational age, comparison to IOL
| Induction of Labor |
Inclusive expectant management |
Exclusive expectant management |
|||||||
|---|---|---|---|---|---|---|---|---|---|
| n (% GA week) | Cesarean birth |
n (% GA week) | Cesarean birth |
n (% GA week) | Cesarean birth |
||||
| n | % (CI) | n | % (CI) | n | %(CI) | ||||
| 37th week | 68 (1.7) | 13 | 19.1 (11.4–30.2) | 3989 (98.3) | 774 | 19.4 (18.2–20.6) | 3882 (98.3) | 762 | 19.6 (18.3–20.9) |
| 38th week | 115 (2.9) | 29 | 25.2 (18.1–33.9) | 3767 (97.0) | 733 | 19.5 (18.2–20.8) | 3452 (96.8) | 707 | 20.5 (19.1–21.8) |
| 39th week | 186 (5.4) | 43 | 23.1 (17.6–29.7) | 3266 (94.6) | 664 | 20.3 (18.9–21.7) | 2464 (92.9) | 568 | 23.1 (21.4–24.7) |
| 40th week | 214 (8.7) | 47 | 21.9 (16.9–28.0) | 2250 (91.3) | 521 | 23.2 (21.5–24.9) | 1161 (15.6) | 348 | 29.9 (27.3–32.6)* |
| 41st week | 452 (38.9) | 155 | 34.3 (30.1–38.8) | 709 (61.1) | 193 | 27.2(24.1–30.6)** | 199 (30.6) | 78 | 39.2 (32.4–46.0) |
| 42nd week + | 137 (68.8) | 60 | 43.8 (35.7–52.3) | 62 (31.2) | 18 | 29.0(19.1–41.5)* | 62 (31.2) | 18 | 29.0 (17.4–40.7)* |
Note: Definitions: Inclusive EM includes all labors within and beyond the week when IOL was performed. Exclusive EM excludes spontaneous labors during the index week and counts all labors after the week IOL was performed.
Abbreviations: CI, confidence interval; EM, expectant management; IOL, induction of labor; OR, odds ratio.
Post hoc power calculation (IOL vs inclusive EM): 37th week = 2.8%, 38th week = 34.1%, 39th week = 15.9%, 40th week = 6% power, 41st week = 72.8%. (IOL vs exclusive EM): 37th week = 3%, 38th week = 24.6%, 39th week = 2.6%, 40th week = 67.4% power, 41st week = 22.6%, 42nd week = 50.9%.
P-value <0.05 (IOL vs EM).
P-value <0.01 (IOL vs EM).
3.1 |. Cesarean birth rates by expectant management definition
In Table 2, we list the numbers of births coded as inclusive versus exclusive that occurred at each week of gestation, along with the percent of births by cesarean. The overall CB rate was 19.4% (n = 787) and did not differ by practice location (P = 0.22). Regardless of gestational age at birth, individuals undergoing IOL had a CB rate of 29.6%, and people with spontaneous labor had a CB rate of 15.3%. The median gestational age for those designated EM from 39 weeks was 40.6 weeks with an interquartile range (IQR) of 40.0–41.1 weeks. Multivariable model findings are presented in Table 3.
TABLE 3.
Odds and adjusted odds for CB with induction of labor compared with expectant management (inclusive or exclusive) in two midwifery practices in the United States
| OR (95% CI) for CB if IOL versus inclusive EM |
OR (95% CI) for CB if IOL versus exclusive EM |
|||||
|---|---|---|---|---|---|---|
| OR (95% CI) for CB with IOL vs EM | (1) aOR (95% CI) | (2) aOR (95% CI) | OR (95% CI) for CB with IOL vs EM | (1) aOR (95% CI) | (2) aOR (95% CI) | |
| 37th week | 0.98 (0.53–1.80) | 1.49 (0.75–2.94) | 1.05 (0.49–2.25) | 0.96 (0.53–1.78) | 1.45 (0.73–2.87) | 1.04 (0.49 –2.22) |
| 38th week | 1.39 (0.91–2.14) | 1.67 (1.01–2.78)* | 1.63 (0.91–2.90) | 1.31 (0.85–2.01) | 1.59 (0.96–2.64) | 1.54 (0.86–2.76) |
| 39th week | 1.17 (0.83–1.67) | 1.05 (0.68–1.63) | 0.98 (0.61–1.58) | 1.00 (0.70–1.43) | 0.98 (0.63–1.53) | 0.93 (0.58–1.51) |
| 40th week | 0.93 (0.66–1.30) | 0.82 (0.55–1.22) | 0.70 (0.44–1.09) | 0.66 (0.46–0.93)* | 0.65 (0.43–0.98)* | 0.57 (0.36 –0.90)* |
| 41st week | 1.39 (1.08–1.80)** | 1.53 (1.14–2.05)** | 1.55 (1.11–2.15)** | 0.81 (0.57–1.14) | 1.00 (0.67–1.51) | 1.06 (0.68–1.64) |
| 42nd week + | n/a | n/a | ||||
Note: (1) Adjusted for age, pre pregnancy BMI, HTN/preeclampsia, gestational weight gain, neonatal weight at birth.
(2) Adjusted for same covariates as first model plus neuraxial analgesia
Abbreviations: confidence interval; expectant management, OR; induction of labor, EM; IOL; odds ratio, CI.
Definitions: Inclusive EM includes all labors within and beyond the week when IOL was performed. Exclusive EM excludes spontaneous labors during the index week and counts all labors after the week IOL was performed.
P-value <0.05 (IOL vs EM).
P-value <0.01 (IOL vs EM).
Notably, the sample for the exclusive EM group is smaller than the inclusive EM, as spontaneous labors from the index week are excluded. For example, in the 39th week the sample size decreased 24% between inclusive and exclusive and 51% in the 40th week. From the bivariate analyses, CB occurred more frequently when IOL was performed in the 41st week (34.3%) compared to those having-inclusive EM (27.2%) with a post hoc power calculation of 72.8% (p <0.01). However, induction of labor in the 40th week ended in CB in 21.9% (CI 16.9%−28.0%) of pregnancies compared with 29.9% (CI 27.3%−32.6%) of EM (exclusive, those not giving birth until the 41st week) with a post hoc power calculation of 67.4%. Approximately 76% of these inductions during the 40th week were for PROM, for medical/obstetric indications or for advanced maternal age, and not elective IOL (Table 4). Figure 2 illustrates the differences in rates of CB by EM definition, and the comparison with spontaneous labor alone, and IOL.
TABLE 4.
Frequency of obstetric/neonatal events for nulliparous individuals who experienced IOL versus EM (inclusive) in two academic midwifery settings
| 39 weeks |
40 weeks |
41 weeks |
||||
|---|---|---|---|---|---|---|
| IOL |
EM 39 |
IOL |
EM 40 |
IOL |
EM 41 |
|
| n = 186 | n = 3266 | n = 214 | n = 2250 | n = 452 | n = 709 | |
| Rationale for labor induction (may have more than one rationale) | ||||||
| Prelabor rupture of membranes | 63 (33.8) | 119 (3.6) | 63 (29.4) | 56 (2.5) | 50 (11.1) | 6 (0.8) |
| Elective postdates | 0 (0.0) | 208 (6.3) | 8 (3.7) | 200 (8.9) | 153 (33.8) | 47 (6.6) |
| Medical or obstetric risks/conditions | 88 (47.3) | 356 (10.9) | 90 (42.1) | 266 (11.8) | 189 (41.8) | 77 (10.9) |
| Advanced maternal age | 3 (1.6) | 28 (0.9) | 10 (4.7) | 18 (0.8) | 12 (0.4) | 6 (0.8) |
| Social/other | 12 (6.4) | 24 (0.7) | 15 (7.0) | 9 (0.4) | 9 (1.9) | 0 (0.0) |
| None of the above/missing rationale | 34 (18.2) | 2772 (84.8) | 55 (25.7) | 1915 (85.1) | 55 (12.2) | 49 (6.9) |
| Neuraxial analgesia | 120 (71.9) | 1710 (60.4)* | 135 (75.8) | 1226 (62.0)* | 291 (75.7) | 397 (62.2)* |
| HTN disorders | 63 (34.4) | 209 (6.4)* | 47 (23.2) | 123 (5.5)* | 51 (11.3) | 35 (4.9)* |
| Suspected IAI | 11 (8.5) | 169 (6.7) | 13 (8.3) | 132 (7.5) | 33 (9.8) | 53 (9.2) |
| Augmentation of spontaneous labor | n/a | 956 (39.1) | n/a | 689 (41.8) | n/a | 268 (47.4) |
| Instrument-assisted vaginal birtha | 5 (3.5) | 115 (4.4) | 8 (4.8) | 80 (4.6) | 14 (4.7) | 26 (5.0) |
| Episiotomya | 6 (4.2) | 123 (4.7) | 5 (3.0) | 93 (5.4) | 17 (5.7) | 32 (6.2) |
| 3rd/4th-degree lacerationa | 3 (2.1) | 182 (7.0)* | 11 (6.3) | 129 (7.5) | 21 (7.1) | 37 (7.2) |
| Postpartum hemorrhageb | 16 (9.5) | 267 (8.9) | 14 (7.1) | 211 (10.3) | 51 (13.0) | 90 (14.1) |
| Blood transfusion | 4 (2.6) | 35 (1.2) | 4 (2.3) | 27 (1.3) | 4 (1.0) | 11 (1.7) |
| Macrosomiac | 13 (6.9) | 479 (14.7)* | 29 (13.6) | 402 (17.8) | 97 (21.5) | 161 (22.7) |
| Shoulder dystociaa | 3 (2.1) | 65 (2.5) | 6 (3.9) | 46 (2.7) | 13 (4.4) | 15 (2.9) |
| NICU admission | 8 (4.4) | 151 (4.7) | 10 (4.8) | 114 (5.1) | 24 (5.4) | 40 (5.7) |
| Composite neonatal outcome | 8 (4.3) | 157 (4.8) | 14 (5.1) | 119 (5.3) | 25 (5.5) | 43 (6.1) |
Note: Composite outcome =any of the following NICU admission, meconium aspiration, stillbirth, perinatal death.
Suspected IAI =diagnosis of maternal fever during or after labor or intra-amniotic infection during labor.
Abbreviations: HTN, hypertensive; IAI, intra-amniotic infection; NICU, neonatal intensive care unit.
Missing data: 535 on epidural variable.
Limited to vaginal birth.
Defined as 1000 mL or higher blood loss. Data for exclusive EM rates versus IOL were significant in the 40th and the 41st weeks (13.7% and 20.7%, respectively, P = 0.01).
Data for macrosomia with exclusive EM were significant at 39th week = 17.4%, P < 0.001; at 40th week = 22.2%, P < 0.004; and at 41st week = 32.7%, P = 0.002.
sig < 0.05.
FIGURE 2.
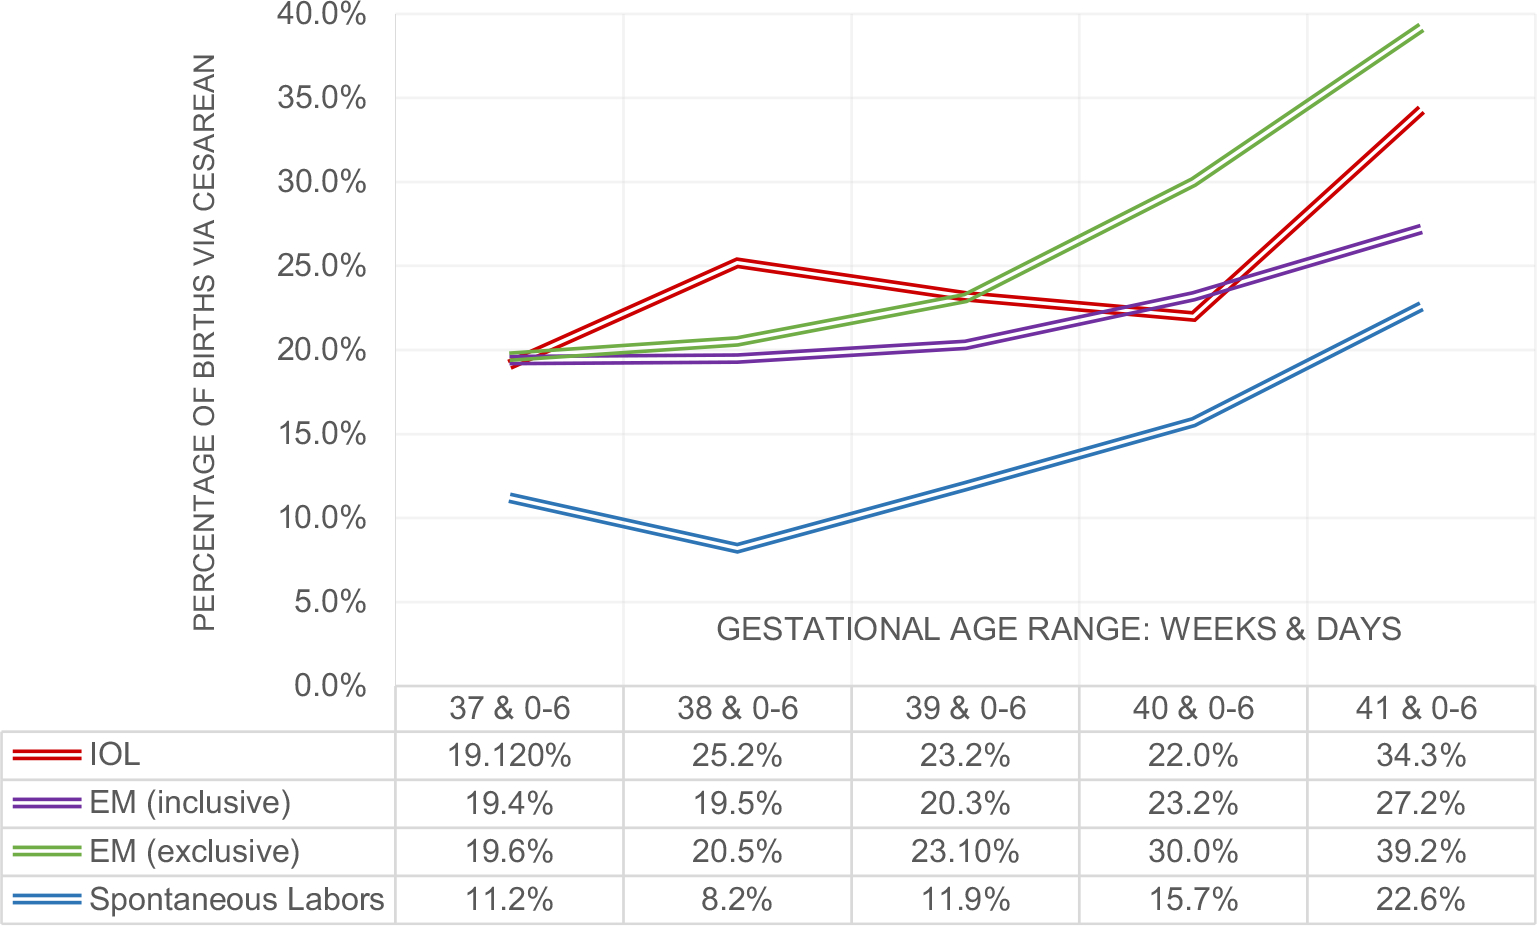
Percentage of cesarean births within each gestational age range and by IOL/EM groups. Cesarean births after spontaneous labors are included in inclusive EM group frequencies and graphed separately in gray
Because the other comparisons by week of gestation were not statistically different, post hoc power calculations for the incidence of CB between IOL and EM were performed. Importantly, most comparisons were underpowered. Using the inclusive EM definition, the power to detect differences in CB rates were 2.8%, 34.1%, 15.9%, 6% and 72.8% for 37–41st week, respectively. For the exclusive EM definition, the power was 3%, 24.6%, 2.6%, 67.4%, and 22.6% for each week 37–41. Larger overall samples of midwife-led care would be required to fully appreciate a true difference in CB rates when the magnitude of the difference between CB rates is small.
3.2 |. Induction of labor during the 37th-39th weeks of gestation
Very few IOLs occurred during the 37th and 38th weeks of gestation (15.5%, n = 183). Both IOL and EM groups had similar CB rates in the 37th week (IOL =19.1%, inclusive EM =19.4%, exclusive EM = 19.6%). In the 38th week, people with IOL had a CB rate of 25.2% compared with 19.5% for those with inclusive EM and exclusive EM of 20.5%. Most IOLs during these weeks were indicated for hypertensive diagnoses and/or PROM. Labor induction in the 38th week was associated with increased odds of CB compared with inclusive EM (Table 3); however, this was not significant after controlling for neuraxial analgesia. In the 39th week, the frequency of CB among people undergoing IOL or inclusive EM was similar (IOL 23.1% vs EM 20.3%, P = 0.36), and also similar to exclusive EM (EM 23.1%).
3.3 |. Induction of labor during the 40th week of gestation
During the 40th week, CB rates for people having an IOL were 21.9% versus 23.2% for those with inclusive EM (P = 0.69). When using the exclusive EM definition, the CB rate was significantly higher (29.9%, P = 0.04). Regression models demonstrated that IOL was not significantly associated with different odds for CB compared with inclusive EM in weeks 37, 39, or 40 regardless of neuraxial analgesia use. For the exclusive method, the odds for CB in the 40th week were significant in the adjusted regression models, regardless of neuraxial analgesia use. Using the adjusted regression model, IOL in the 40th week was associated with about 43% reduced likelihood of CB (aOR 0.57; 95% CI 0.36–0.90) compared with exclusive EM (adjusted for age, prepregnancy BMI, hypertensive disorder/preeclampsia, gestational weight gain, neuraxial analgesia, and neonatal weight).
3.4 |. Induction of labor during the 41st week of gestation
In the 41st week, individuals having an IOL (n = 452, 11% of the sample) experienced CB more frequently (n = 155, 34.3%) compared with people with inclusive EM (27.2%, χ2, P = 0.01). People with IOL in the 41st week had 53% higher CB odds in the adjusted model (aOR 1.53, 95% CI, 1.14–2.05) compared with inclusive EM. Including use of neuraxial analgesia in the model did not change this association. The post hoc power calculation for this comparison of CB rates was 72.8%, with a 0.05 alpha. Using the exclusive EM method, IOL in 41st week was not associated with CB in the adjusted models.
3.5 |. Induction of labor during the 42nd week of gestation and later
Only 4.9% of the sample (n = 199) gave birth during the 42nd week or later (n = 8 in the 43rd week). Of those who had IOL in the 42nd week or later (n = 137), the CB rate was 43.8% compared with 29.0% for those in spontaneous labor (P = 0.04). IOL vs EM comparisons beyond gestational age in the 42nd week were not conducted because only eight pregnancies continued into the 43rd week.
Among the covariates in the regression models, factors that were significantly related to higher CB odds across all gestational ages were higher maternal age, BMI, birthweight of newborn, and use of neuraxial analgesia. Additional models controlling for the study site or year of delivery (among the whole sample) did not substantively change the outcome nor did these variables associate with CB directly (data not presented).
3.6 |. Other Obstetric Events/Procedures
Additional outcomes are listed in Table 4. IOL at 39 weeks versus inclusive EM was associated with fewer anal sphincter injuries (2.2%, n = 3) compared with 7.0% (n = 182) among those with EM (a 2-sided Fisher exact test, P = 0.02). Frequencies of hypertensive disorders among the EM groups were similar across the gestational age groups (6.4% EM at 39 weeks, 5.5% EM at 40 weeks, and 4.9% EM at 41 weeks). Importantly, while macrosomia was higher in EM at 39 weeks versus IOL, rates of shoulder dystocia were not different between IOL/EM groups regardless of gestational age. No other secondary outcomes were associated with IOL compared with inclusive EM including the neonatal composite outcome.
Using the exclusive EM definition, rates of postpartum hemorrhage were higher for EM than for IOL in the 40th week and 41st week; however, rates of blood transfusion use did not differ. Macrosomia rates in the exclusive EM group were also higher than in the IOL in the 39th week, 40th week, and 41st week, yet shoulder dystocia, neonatal intensive care admission, or the composite neonatal outcome did not differ (data included in footnote of Table 4). No other comparisons were statistically different using the exclusive EM method (data not presented).
4 |. DISCUSSION
The purpose of this study was to examine the role of IOL versus EM on mode of birth and other secondary birth outcomes among nulliparous individuals using a data set recording outcomes of births attended by CNMs in two United States tertiary academic settings.
Our primary findings are, first, IOL during the 39th week among those receiving CNM care was not significantly related to CB. However, IOL performed in the 40th week was associated with lower CB odds compared with exclusive EM, which assumes pregnancies lasted until the 41st week or later. This finding is explained by higher CB among people who remained pregnant until 41 0/7 weeks who needed or elected IOL between 41 0/7 and 41 6/7 weeks. Taken together, IOL appears “protective” of CB depending on how the comparison group for EM is defined in the midwifery model of care. Specifically, when spontaneous labors that happened during the same gestational week as the IOL are excluded, the results favor earlier IOL. In addition, use of neuraxial analgesia was associated with both use of IOL at any gestational age (compared with EM) and CB regardless of the choice for IOL/EM.
4.1 |. Labor induction and cesarean birth in context of midwifery model of care
In light of the ARRIVE trial findings,7 one important question is whether or not nurse-midwives’ clients would have lower CB rates if all individuals who reach 41 weeks’ gestation (ie, 28.6% of all labors) had instead received elective IOL earlier in gestation. This is not easily answerable using our data because most of the IOLs in this sample were not performed electively. Before 41 weeks, IOL was largely indicated by medical or obstetric conditions.
Rather, these results suggest positive overall outcomes and rates of CB when individuals receive midwifery-led care, which largely reserves induction for medical/obstetric indications. For purposes of comparison, in a large meta-analysis of 6 cohort studies, Grobman and colleagues recently reported that elective IOL at 39 weeks in a nulliparous sample was associated with CB rate of 26.4% (vs 29.1% among those having EM).8 In our study, the CB rate was 23% for people undergoing EM at 39 weeks (n = 2464), using the same exclusive EM definition as Grobman et al. Thus, restricted use of IOL among nulliparas receiving midwife-led care resulted in lower rates of CB overall than elective IOL as reported in this meta-analysis.
In the ARRIVE trial, 18.6% of those randomized to IOL in the 39th week (n = 3062) had CB, versus 22.2% among those having EM (n = 3044). In contrast to our study, the ARRIVE trial participants had a lower overall maternal age, higher BMI, and higher rates of hypertension in the EM group (14.1%). These factors may have influenced CB rates, especially if more individuals randomized to EM required a medically necessary IOL after 39 weeks. The median gestational age of the EM group in ARRIVE was 40.0 weeks with an IQR of 39.3–4 0.7. In comparison, the 39-week EM group in our study remained pregnant much longer (median 40.6, IQR 40–41.1). This indicates that the ARRIVE trial’s EM subgroup underwent either a spontaneous labor or an IOL for some other indication much earlier than in our sample. Indeed, in a recently published secondary analysis of the ARRIVE EM arm, authors reported that the prevalence of medically indicated delivery was 44.4% in the 40th week of gestation and 80.3% in those who were pregnant between 41 and 42 weeks.24 By contrast, in our sample, 8.7% of the 40th-week labors were induced and only 50.7% of people remaining pregnant between 41 and 42 weeks were induced. These midwifery-led practices used IOL sparingly for their caseloads, indicating generally healthy clients in their care and likely reflecting preferences for EM among the clientele as well (though this was not measured directly). As such, our study highlights the possibility that a policy of elective IOL at 39 weeks for low-risk patients may not be advantageous within midwifery-led practice environments. Because of these practice pattern and client differences, our study findings may provide useful insight into the relationship between IOL versus EM and CB for women receiving CNM care.
It is also important to note that 74% of those invited to participate in the ARRIVE trial either declined or dropped out of the study. In an analysis of reasons given why individuals declined to consent to ARRIVE protocol, researchers found that “preference for EM” was reported most often among those who gave a reason for declining enrollment.25 By contrast, our study included routinely collected data and, for this reason, may offer information with higher external validity for women seeking CNM care. Furthermore, the precise management of spontaneous labor in the EM group was not reported in the ARRIVE trial (ie, need for labor augmentation, use of social support, and/or pharmacologic pain management). Given all these differences, the outcomes of the ARRIVE study and our study are difficult to compare, not only because of pregnancy/labor management differences but also because of the characteristics of the sample. However, importantly, the low overall rates of CB reported in this sample receiving midwifery care indicate that using IOL selectively rather than routinely as a strategy to achieve appropriate CB rates should be further investigated.
Future research might examine the components of midwifery model of care that increase odds of vaginal birth during EM and spontaneous labor, and the components of a medical model of care, which might increase the odds of vaginal birth after IOL. The midwifery approach may have particular strengths for achieving safe vaginal birth during EM and spontaneous labor, and the medical approach may have particular strengths for achieving safe vaginal birth during IOL.15,16,26 This signals an opportunity for interdisciplinary communication and that learning should support respect for differing care models and adoption of best care practices.27,28
For instance, we found that CB rates after IOL in the 41st week were significantly higher (34.3%) than at earlier gestations, and higher than those reported in the ARRIVE trial for EM at 39 weeks. For comparison, we considered other studies reporting CB rates for nulliparous people induced at 41 weeks. One study of midwifery care in Canada reported a rate of CB of 44%,29 and 40% in German sample (with physician care).30 A recent study that compared length of IOL found that people cared for by physicians had a mean labor induction to delivery interval that was about 4 hours shorter than for people cared for by midwives.18 While the duration of IOL was not measured in our study, some researchers have found that a longer IOL process is associated with higher rates of intrapartum complications and CB.31
However, while a shorter IOL process is generally considered favorable, a longer IOL process may be valuable if it helps achieve more thorough cervical ripening before starting oxytocin administration. To that end, newer guidelines encourage cervical ripening for nulliparous individuals until a Bishop’s score of 8 or higher is reached to help reduce CB for failed IOL,32 which would likely increase the duration of the overall admission for IOL unless outpatient cervical ripening is used. Early amniotomy, in an effort to expedite IOL, has not been shown to reduce the risk of CB according to a recently published meta-analysis,33 despite shortening the interval from admission to delivery. As practice changes occur that may increase elective IOL at earlier gestation, this study may serve as a point of comparison, and also prompt midwifery practices to examine their CB rates for late-term IOL and EM and work toward lowering CB rates through IOL management optimization as needed. Considered together, these findings can help inform the shared decision-making process that providers undergo when discussing EM versus IOL with their clients, including rates of CB within the midwifery care model at various gestational ages.
4.2 |. Supportive care during labor and labor outcomes
Individuals undergoing unmedicated labor and birth often desire or need more hands-on support, and prior studies have shown that continuous labor support is associated with reduced odds for CB.34 The low epidural rate among this nulliparous sample suggests that midwives provided a high level of non-pharmacologic care, albeit not measured directly, which may have contributed to the lower rates of CB seen in this study compared with others. Labor support and the labor environment have been discussed in the literature as an important tool for addressing CB rates by promoting physiologic labor progress.35,36 Future studies should consider use of labor support techniques in addition to pharmacologic labor coping methods.
4.3 |. Research implications: definition of expectant management influences findings
There are a variety of ways EM is defined in the literature. Some researchers have defined EM as all spontaneous labors in the given gestational age range in addition to any birth occurring after the exposure week.22,30,37,38 Others have defined EM to exclude spontaneous labors in the exposure week (eg, IOL at 40 weeks compared with EM starting at 41 week).5,8,39 Each of these methods has its limitations and concerns for generalizability. Our findings are consistent with various published works that used different methods to define the EM groups. Studies by Zhao,38 Rydahl,22 and Glantz,37 for example, all used the inclusive method and found that IOL was associated with higher risk for CB than for EM. Conversely, studies using exclusive EM found that IOL was associated with lower CB rates.5,8,39 Reporting findings using both EM methods, inclusive versus exclusive, is recommended for increasing transparency in future research.
4.4 |. Areas for future research
More research should address processes of care among people undergoing IOL or EM. This is important to help define which practices maximize safe vaginal birth in the context of how labor initiates, regardless of care provider. The processes of IOL and EM are heterogeneous by nature, as they are tailored to individual circumstances and desires. Practices are further shaped by provider practice style, clinical guidelines, and institutional standards. Midwifery care in the United States is also likely highly variable, but this approach does generally adhere to principles set forth by the American College of Nurse Midwives Philosophy of Care, which places emphasis on physiologic onset of labor and physiologic birth.10 Optimal processes behind “expectant management” are also important and require more research. Variations in prenatal care during late gestation include fetal assessment type and frequency, non-pharmacologic cervical ripening, stress/anxiety management (anticipatory guidance), and latent labor self-management recommendations. Furthermore, research is needed to help describe the process of shared decision-making and associated outcomes for people seeking low-intervention models of care with respect to labor induction.40
5 |. STRENGTHS AND LIMITATIONS
The strengths of this analysis include the similarities between the nurse-midwifery practices’ approach to labor management (induction and EM) and the prospective, detailed, and shared variable definitions across practices for data collection. These data provide a unique window into the processes and outcomes for people having nurse-midwifery care in academic hospital environments. Limitations include inherent errors in data recording, with some missing data on analgesia in particular. In addition, cross-sectional data cannot be used to determine causality—for example, the temporal order of labor analgesia within the labor course was not available in this data. We recognize the small number of IOLs performed, particularly before 41 weeks, limits the power to detect a true difference, or conversely, to have confidence in null findings. A larger database of midwifery-led care would be useful in future work. Finally, the academic settings described here also may not be generalizable to other populations.
6 |. CONCLUSION
Expectant management of nulliparous individuals and use of labor induction when medically indicated results in largely similar CB outcomes within a midwifery model of care, regardless of gestational age. Decreased likelihood of CB with labor induction occurred in the 40th week, but only when compared to people who remained pregnant until 41 weeks or later, when labor induction was associated with higher CB rates. Methods to optimize IOL in late-term or individualizing IOL recommendations based on particular risk factors or desires may be useful for promoting optimal outcomes for every individual.
ACKNOWLEDGMENTS
We are grateful to Dr Judith Baggs, Professor Emeritus Oregon Health and Science University, Michele Megregian CNM and Dr. Marit Bovbjerg of Oregon State University for assisting in the editing of this manuscript. We also acknowlege and thank the CNMs at the partnering practices for their efforts in recording pregnancy and birth information.
Funding information
Dr Elise Erickson was supported as a scholar in the Oregon BIRCWH K12 Program funded by Eunice Kennedy Shriver National Institute of Child Health and Human Development, National Institutes of Health (NIH), under Award Number K12HD043488. Dr Nicole Carlson was supported by the National Institute of Nursing Research of the NIH under Award Number K01NR016984 during research reported in this publication. The content is solely the responsibility of the authors and does not necessarily represent the official views of the National Institutes of Health
DATA AVAILABILITY STATEMENT
Data used for this study can be made available via request to the repository guardians at the partner institutions, assuming data use agreements and IRB approval are in place.
REFERENCES
- 1.Battista L, Chung JH, Lagrew DC, Wing DA. Complications of labor induction among multiparous women in a community-based hospital system. Am J Obstet Gynecol. 2007;197(3):241.e1–241.e7. 10.1016/j.ajog.2006.12.027 [DOI] [PubMed] [Google Scholar]
- 2.Little SE, Caughey AB. Induction of labor and cesarean: What is the true relationship? Clin Obstet Gynecol. 2015;58(2):269–281. 10.1097/GRF.0000000000000112 [DOI] [PubMed] [Google Scholar]
- 3.Darney BG, Caughey AB. Elective induction of labor symposium: nomenclature, research methodological issues, and outcomes. Clin Obstet Gynecol. 2014;57(2):343–362. [DOI] [PubMed] [Google Scholar]
- 4.Kaimal A, Nicholson J, Cheng Y, Lyell D, Washington A, Caughey A. Induction of labor: Maternal and neonatal complications by gestational age. Am J Obs Gynecol. 2007;197(6):S91. [Google Scholar]
- 5.Caughey AB, Nicholson JM, Cheng YW, Lyell DJ, Washington AE. Induction of labor and cesarean delivery by gestational age. Am J Obstet Gynecol. 2006;195(3):700–705. 10.1016/j.ajog.2006.07.003 [DOI] [PubMed] [Google Scholar]
- 6.Vries BS, Gordon A. Induction of labour at 39 weeks should be routinely offered to low-risk women. Aust New Zeal J Obstet Gynaecol. 2019;59(5):739–742. 10.1111/ajo.12980 [DOI] [PubMed] [Google Scholar]
- 7.Grobman WA, Rice MM, Reddy UM, et al. Labor induction versus expectant management in low-risk nulliparous women. N Engl J Med. 2018;379(6):513–523. 10.1056/NEJMoa1800566 [DOI] [PMC free article] [PubMed] [Google Scholar]
- 8.Grobman WA, Caughey AB. Elective induction of labor at 39 weeks compared with expectant management: a meta-analysis of cohort studies. Am J Obstet Gynecol. 2019;221(4):304–310. 10.1016/j.ajog.2019.02.046 [DOI] [PubMed] [Google Scholar]
- 9.Attanasio L, Kozhimannil KB. Relationship between hospital-level percentage of midwife-attended births and obstetric procedure utilization. J Midwifery Women’s Heal. 2018;63(1):14–22. 10.1111/jmwh.12702 [DOI] [PubMed] [Google Scholar]
- 10.American College of Nurse-Midwives. Supporting healthy and normal physiologic childbirth: A consensus statement by the american college of nurse-midwives, midwives alliance of north America, and the national association of certified professional midwives. J Midwifery Women’s Heal. 2012;57(5):529–532. 10.1111/j.1542-2011.2012.00218.x [DOI] [PubMed] [Google Scholar]
- 11.Stoll K, Fairbrother N, Thordarson DS. Childbirth fear: relation to birth and care provider preferences. J Midwifery Women’s Heal. 2018;63(1):58–67. 10.1111/jmwh.12675 [DOI] [PubMed] [Google Scholar]
- 12.Avery MD, Neerland CE, Saftner MA. Women’s perceptions of prenatal influences on maternal confidence for physiologic birth. J Midwifery Women’s Heal. 2018;64(2):201–208. 10.1111/jmwh.12897 [DOI] [PubMed] [Google Scholar]
- 13.Avery MD, Saftner MA, Larson B, Weinfurter EV . A systematic review of maternal confidence for physiologic birth: characteristics of prenatal care and confidence measurement. J Midwifery Womens Health. 2014;59(6):586–595. 10.1111/jmwh.12269 [DOI] [PubMed] [Google Scholar]
- 14.Practice C on O. ACOG Committee Opinion No. 687: Approaches to limit intervention during labor and birth. Obstet Gynecol. 2017;129(2):e20–e28. [DOI] [PubMed] [Google Scholar]
- 15.Smith DC, Phillippi JC, Lowe NK, et al. Using the Robson 10-Group classification system to compare cesarean birth utilization between US centers with and without midwives. J Midwifery Women’s Heal. 2020;65(1):10–21. 10.1111/jmwh.13035 [DOI] [PMC free article] [PubMed] [Google Scholar]
- 16.Neal JL, Carlson NS, Phillippi JC, et al. Midwifery presence in United States medical centers and labor care and birth outcomes among low-risk nulliparous women: A Consortium on Safe Labor study. Birth. Published November 11, 2018. Accessed August 20, 2019. [DOI] [PMC free article] [PubMed] [Google Scholar]
- 17.Carlson NS, Corwin EJ, Hernandez TL, Holt E, Lowe NK, Hurt KJ. Association between provider type and cesarean birth in healthy nulliparous laboring women: A retrospective cohort study. Birth. 2018;65(Suppl):1–10. 10.1111/birt.12334 [DOI] [PMC free article] [PubMed] [Google Scholar]
- 18.Souter V, Nethery E, Lou KM, Wurz H, Sitcov K, Caughey AB. Comparison of midwifery and obstetric care in low-risk hospital births. Obstet Gynecol. 2019;134(5):1056–1065. 10.1097/AOG.0000000000003521 [DOI] [PubMed] [Google Scholar]
- 19.Sandall J, Soltani H, Gates S, Shennan A, Devane D. Midwife-led continuity models versus other models of care for childbearing women. Sandall J, ed. Cochrane Database Syst Rev. 2016;4(11):CD004667–75. 10.1002/14651858.CD004667.pub5 [DOI] [PMC free article] [PubMed] [Google Scholar]
- 20.Tilden EL, Phillippi JC, Ahlberg M, et al. Describing latent phase duration and associated characteristics among 1281 low-risk women in spontaneous labor. Birth. 2019;46(4):592–601. 10.1111/birt.12428 [DOI] [PMC free article] [PubMed] [Google Scholar]
- 21.Erickson EN, Lee CS, Grose E, Emeis C. Physiologic childbirth and active management of the third stage of labor: A latent class model of risk for postpartum hemorrhage. Birth. 2019;46(1):69–79. 10.1111/birt.12384 [DOI] [PMC free article] [PubMed] [Google Scholar]
- 22.Rydahl E, Eriksen L, Juhl M. Effects of induction of labor prior to post-term in low-risk pregnancies: a systematic review. JBI Database Syst Rev Implement Reports. 2019;17(2):170–208. 10.11124/JBISRIR-2017-003587 [DOI] [PMC free article] [PubMed] [Google Scholar]
- 23.American College of Obstetricians and Gynecologists. Management of late-term and postterm pregnancies. Obstet Gynecol. 2014;124(2):390–396. 10.1097/01.AOG.0000452744.06088.48 [DOI] [PubMed] [Google Scholar]
- 24.Tita ATN, Doherty L, Grobman WA, et al. Maternal and perinatal outcomes of expectant management of full-term, low-risk, nulliparous patients. Obstet Gynecol. 2021;137(2):250–257. 10.1097/AOG.0000000000004230 [DOI] [PMC free article] [PubMed] [Google Scholar]
- 25.Mallett G, Hill K, de Voest J, et al. Characteristics associated with consent and reasons for declining in a randomized trial in pregnancy. Obstet Gynecol. 2020;136(4):731–737. 10.1097/AOG.0000000000003998 [DOI] [PMC free article] [PubMed] [Google Scholar]
- 26.Carlson NS, Neal JL, Tilden EL, et al. Influence of midwifery presence in United States centers on labor care and outcomes of low-risk parous women: A Consortium on Safe Labor study. Birth. Published November 9, 2018. Accessed August 20, 2019. [DOI] [PMC free article] [PubMed] [Google Scholar]
- 27.Caughey AB. Midwife and obstetrician collaborative care: the whole is better than the parts. J Midwifery Women’s Heal. 2015;60(2):120–121. 10.1111/jmwh.12302 [DOI] [PubMed] [Google Scholar]
- 28.Smith DC. Midwife-physician collaboration: a conceptual framework for interprofessional collaborative practice. J Midwifery Women’s Heal. 2015;60(2):128–139. 10.1111/jmwh.12204 [DOI] [PubMed] [Google Scholar]
- 29.Elderhorst E, Ahmed RJ, Hutton EK, Darling EK. Birth outcomes for midwifery clients who begin postdates induction of labour under midwifery care compared with those who are transferred to obstetrical care. J Obstet Gynaecol Canada. 2019;41(10):1444–1452. 10.1016/j.jogc.2018.11.024 [DOI] [PubMed] [Google Scholar]
- 30.Thangarajah F, Scheufen P, Kirn V, Mallmann P. Induction of labour in late and postterm pregnancies and its impact on maternal and neonatal outcome. Geburtshilfe Frauenheilkd. 2016;76(7):793–798. 10.1055/s-0042-107672 [DOI] [PMC free article] [PubMed] [Google Scholar]
- 31.Triebwasser JE, Vanartsdalen J, Kobernik EK, Seiler K, Langen ES. Assessing maternal and fetal risks associated with prolonged induction of labor. Am J Perinatol. 2019;36(05):455–459. 10.1055/s-0038-1675642 [DOI] [PubMed] [Google Scholar]
- 32.Appendix R. Induction of Labor Algorithm | California Maternal Quality Care Collaborative. Induction of Labor Algorithm: California Maternal Quality Care Collaborative. https://www.cmqcc.org/resource/appendix-induction-labor-algorithm. Published 2019. Accessed April 15, 2020. [Google Scholar]
- 33.De Vivo V, Carbone L, Saccone G, et al. Early amniotomy after cervical ripening for induction of labor: a systematic review and meta-analysis of randomized controlled trials. Am J Obstet Gynecol. 2020;222(4):320–329. 10.1016/j.ajog.2019.07.049 [DOI] [PubMed] [Google Scholar]
- 34.Bohren MA, Hofmeyr GJ, Sakala C, Fukuzawa RK, Cuthbert A. Continuous support for women during childbirth. Cochrane Database Syst Rev. 2017. 10.1002/14651858.CD003766.pub6 [DOI] [PMC free article] [PubMed] [Google Scholar]
- 35.Romano A, Lothian J. Promoting, protecting, and supporting normal birth: A look at the evidence. Jognn-Journal Obstet Gynecol Neonatal Nurs. 2008;37(1):94–105. [DOI] [PubMed] [Google Scholar]
- 36.Stark MA, Remynse M, Zwelling E. Importance of the birth environment to support physiologic birth. J Obstet Gynecol Neonatal Nurs. 2016;45(2):285–294. [DOI] [PubMed] [Google Scholar]
- 37.Glantz JC. Term labor induction compared with expectant management. Obstet Gynecol. 2010;115(1):70–76. 10.1097/AOG.0b013e3181c4ef96 [DOI] [PubMed] [Google Scholar]
- 38.Zhao Y, Flatley C, Kumar S. Intrapartum intervention rates and perinatal outcomes following induction of labour compared to expectant management at term from an Australian perinatal centre. Aust N Z J Obstet Gynaecol. 2017;57(1):40–48. 10.1111/ajo.12576 [DOI] [PubMed] [Google Scholar]
- 39.Gibson KS, Waters TP, Bailit JL. Maternal and neonatal outcomes in electively induced low-risk term pregnancies. Am J Obstet Gynecol. 2014;211(3):249.e1–249.e16. [DOI] [PubMed] [Google Scholar]
- 40.Megregian M, Emeis CL, Nieuwenhuijze M. The impact of shared decision making in perinatal care, a scoping review. J Midwifery Women’s Heal. 2020;65(6):777–788. [DOI] [PubMed] [Google Scholar]
Associated Data
This section collects any data citations, data availability statements, or supplementary materials included in this article.
Data Availability Statement
Data used for this study can be made available via request to the repository guardians at the partner institutions, assuming data use agreements and IRB approval are in place.