Abstract
This study investigates the mechanical response of antibacterial PA12/TiO2 nanocomposite 3D printed specimens by varying the TiO2 loading in the filament, raster deposition angle, and nozzle temperature. The prediction of the antibacterial and mechanical performance of such nanocomposites is a challenging field, especially nowadays with the covid-19 pandemic dilemma. The experimental work in this study utilizes a fully factorial design approach to analyze the effect of three parameters on the mechanical response of 3D printed components. Therefore, all combinations of these three parameters were tested, resulting in twenty-seven independent experiments, in which each combination was repeated three times (a total of eighty-one experiments). The antibacterial performance of the fabricated PA12/TiO2 nanocomposite materials was confirmed, and regression and arithmetic artificial neural network (ANN) models were developed and validated for mechanical response prediction. The analysis of the results showed that an increase in the TiO2% loading decreased the mechanical responses but increased the antibacterial performance of the nanocomposites. In addition, higher nozzle temperatures and zero deposition angles optimize the mechanical performance of all TiO2% nanocomposites. Independent experiments evaluated the proposed models with mean absolute percentage errors (MAPE) similar to the ANN models. These findings and the interaction charts show a strong interaction between the studied parameters. Therefore, the authors propose the improvement of predictions by utilizing artificial neural network models and genetic algorithms as future work and the spreading of the experimental area with extra variable parameters and levels.
Keywords: Fused filament fabrication (FFF), 3D printing, Polyamide 12 (PA12), Titanium dioxide (TiO2), Antibacterial, Artificial neural networks (ANN)
Introduction
Additive manufacturing (AM) has gained interest during the last decade [1–4], with this interest further increased during the SARS-Cov-2 pandemic situation [5–9]. AM, to which 3D printing technologies belong, consists of a wide range of techniques with sufficient similarities and differences. The most popular techniques, either commercially or academically, are fused filament fabrication (FFF) [10–12], stereolithography (SLA) [13–15], selective laser sintering (SLS) [16–18], MultiJet Fusion (MJF) [19–21], selective laser melting (SLM) [22–24], and wire arc additive manufacturing (WAAM) [25–27], among others. Their differences are related to their operating principle and raw materials’ form, but according to the ISO/ASTM 52,900–15 [28] standard, all these techniques are described through the “process of joining material to make parts from 3D model data, usually layer upon layer, as opposed to subtractive manufacturing and formative manufacturing methodologies”.
Among AM techniques, owing to its low operational and material costs [3, 29], FFF is the most widely utilized, accounting for 96% of global 3D printer sales in 2016 [30]. FFF is a material extrusion method, for thermoplastic polymers and composite materials in a melted state [31]. The FFF with the sudden pandemic situation developed in the spring of 2020 has exhibited mass-scale production potential [5, 32–34]. In a social solidarity framework and by the utilization of a huge 3D printing community network globally [35, 36], a very high number of face shields have been manufactured by individuals or professionals worldwide. Despite the disadvantages of FFF build parts, that is, anisotropic behavior [37] and increased porosity [38, 39], face shields have become popular even in hospital environments. This situation indicated the unreadiness of the manufacturing sector regarding AM techniques since specifications for the use of FFF as a manufacturing technique for medical purposes were not clearly formed.
The anisotropy of FFF 3D printed components and high porosity are attributed to low-level interfacial fusion between the extruded layers [40–42]. Generally, FFF 3D printing parameters could be plausible reasons for variations in the mechanical [43], thermal [44], and antibacterial [45] performance of 3D printed components. The effects of FFF 3D printing parameters have been thoroughly studied, aiming to optimize the process [46]. To this end, tools, such as neural networks [47] and machine learning [48, 49], have been employed. Popescu et al. [50] categorized 3D printing parameters into slicing, manufacturing orientation, and temperature settings. Indicative settings are the infill density, extrusion orientation (also known as raster deposition angle), and nozzle temperature, which have a significant impact on the mechanical and other performances of 3D printed parts. In medical implementations, the parts’ accuracy, consistency, and repeatability should be seriously considered by manufacturers [51–53]. 3D printing parameters along with the selected material could develop a high potential for 3D printing implementations in medical applications or, on the contrary, create serious concerns if not carefully selected for each studied case.
Polyamide 12 (PA12) is a semi-crystalline material of the polyamide family and is widely known for its high toughness and good chemical resistance [54, 55]. PA12 is utilized in SLS, MJF, and other powder bed/fed AM techniques [56], while it is less common, but has high prospects for implementation with the FFF technique [40, 44]. Its mechanical properties in FFF 3D printing have been investigated experimentally and with statistical modeling tools and artificial neural networks. Overall, it has superior mechanical performance, compared to other 3D printed polymers; still, the 3D printing parameters affect its strength [57]. For example, the PA12 grade used in this work (Rilsamid AESNO TL) has a nominal tensile strength of 50 MPa, while Stratasys fused deposition modeling (FDM) thermoplastic polyurethane has a tensile strength of 15.6 MPa, and Ineos Styrolution Terluran GP-22 acrylonitrile butadiene styrene (ABS) has 45 MPa, according to the materials’ datasheet. 3D printing affects the mechanical response of the materials differently, with the 3D printed PA12 of the current study achieving about 37 MPa, while ABS maximum tensile strength was measured 31 MPa in the corresponding test [4].
PA12 is a polymer that is usually employed in medical applications, among others [58, 59]. Evolution in the research on the FFF technique throughout the past years has created the necessary conditions for the development and use of composites as raw materials with this technique [1]. Such composites have been developed to enhance the mechanical [60], thermal [61], and other properties of the built parts, with nanotechnology having a great impact on this direction. For the preparation of nanocomposite filaments for FFF 3D printing, the addition of nanoparticles in polymer matrices has shown that, under specific circumstances, enhances or enables properties without compromising processing conditions [62–64]. Such nanocomposites are used in specific applications, in which enhanced mechanical, thermal, or antibacterial performance is required. Titanium dioxide (TiO2) is a mineral material widely used in industrial applications, mainly as a coloring filler [65–68]. In addition to its coloring properties, titanium dioxide has been thoroughly studied for its mechanical [45, 69], UV shielding [70], antibacterial [71], and other properties.
In this work, a high-strength biomedical grade polymer (PA12) was used as a matrix material for the development of nanocomposites that will expand the fields of use of the material. This polymer is neutral in the development of bacteria on its surface. It is also bio-tolerable, so it is suitable for applications requiring skin contact with the patient. Such applications include the manufacturing of shells for devices for example. In medical environments, such as surgeries, apart from these properties, more enhanced performance is required from the materials. A biocidal performance is desirable, and for this reason, it was chosen to introduce an additive to this specific matrix material, with known antibacterial performance, to induce its properties to the prepared nanocomposites. This study investigates the influence of three variable parameters, that is, the TiO2 filler percentage (TiO2%) on PA12 pure material, the raster deposition angle (RDA), and the nozzle temperature (NT), on the mechanical properties of FFF 3D printed parts exhibiting antibacterial performance. Nanocomposite materials were prepared in filament form and 3D printed using the FFF process with various parameters. Their mechanical and antibacterial performances were investigated experimentally. Mechanical test results were exploited for the development of mathematical models, regression, and artificial neural network (ANN) models to predict the mechanical response according to the TiO2 percentage. This work aimed to determine the effect on the mechanical and antibacterial performance of TiO2 as a filler in the PA12 matrix and to optimize the mechanical response of FFF 3D printed nanocomposites exhibiting antibacterial performance, which was also verified on the nanocomposites by the experiments conducted in this work. The mechanical response optimization was achieved by selecting the appropriate values of significant 3D printing parameters, such as the nozzle temperature and raster deposition angle, which affect the mechanical response of the 3D printed parts. To the best of our knowledge, no similar work with such mathematical models exists in the literature. It was found that increasing the filler loading at loadings higher than 2 wt.% decreases the mechanical response of the nanocomposites, although the antibacterial performance continues to increase. Regarding the 3D parameters, higher nozzle temperatures and zero deposition angles optimize the mechanical performance of all TiO2% nanocomposites.
Experimental
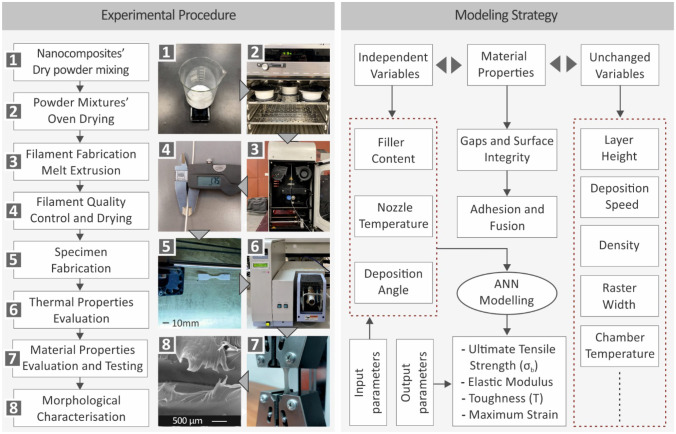
Figure 1 on the left side summarizes the experimental process followed for filament fabrication, the manufacturing of the specimens with FFF 3D printing, and the characterization method followed. The right side of Fig. 1 shows graphically as well as the modeling strategy for the 3D printed parameters studied in the current work.
Fig. 1.
Graphical presentation of the experimental processing (left side) and the modeling strategy (right side) followed during the current study
Materials
PA12 was selected as the matrix material for nanocomposite fabrication. PA12 was procured from Arkema (Arkema SA, Colombes, France). More specifically, the procured polyamide was Rilsamid AESNO TL. According to the manufacturer’s technical data sheet, the material’s density is 1.01 g/cm3, and its melt volume-flow rate (MVR) is 8.0 cm3/10 min; both are fine characteristics for extrusion processing, and necessary for filaments fabrication. The Vicat softening and melting temperatures were set at 142 °C and 180 °C. The filler selected for the nanocomposite preparation was TiO2 procured from Degussa Evonik (Evonik SA, Essen, Germany) at a nanoscale particle size. The nanoparticles were spherical in shape, with diameters ranging from 25 to 50 nm.
Nanocomposites preparation and specimens fabrication
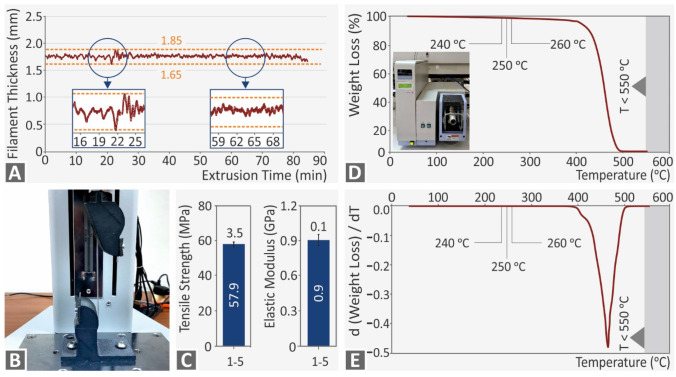
The PA12 matrix material was initially dried at 50 °C for 24 h, and it was afterward mixed with TiO2 nanoparticles using a dry mixing procedure with a laboratory high shear forcing mixer. The mixed materials were then placed inside a single-screw extruder. Specifically, a 3D Evo Composer 450 extruder (3D Evo, Maastricht, Netherlands) was used for filament fabrication. The extruder was equipped with a specially designed screw to optimize the melt-mixing procedure and four heating zones. For all fabricated materials, temperatures were set for the heating zone closer to the hopper (zone 4) at 185 °C, while the remaining heating zones up to the extruder nozzle (zone 1) were set at 245 °C. The screw rotational speed was set at 3.5 rpm (the extruder’s operational rotational speed ranges from 2.5 to 15 rpm), and built-in cooling fans were set to 20%. The 3D Evo Composer 450 comes with a built-in real-time produced filament diameter measuring system that automatically adjusts the filament production speed to maintain the produced filament within acceptable deviations. Figure 5A shows a typical graph for the produced filament diameter, indicating that the parameters used in the extrusion process were suitable for producing filaments with diameters within the 3D printing process specifications.
Fig. 5.
A Real-time recording of filament diameter from extruder’s built-in sensor, B Typical setup of the tensile test of the extruded filament, C Tensile strength and tensile modulus of elasticity calculated for the prepared pure PA12 filaments. D TGA graph of PA12/TiO2 2.0 wt.% weight (%) to temperature (°C), E DTGA graph of PA12-TiO2 2.0 wt.% d(weight)/dT to temperature (°C)
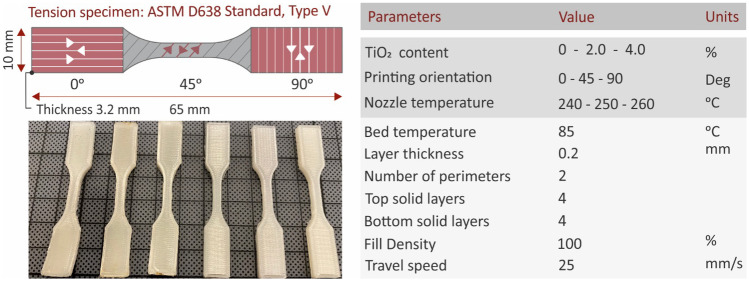
To fabricate the specimens, a Craftbot Plus (Craftbot SA, Budapest, Hungary) FFF 3D printer was employed. Figure 2 presents a summary of fundamental 3D printing settings. All other settings were set according to their prefix values for the PA material in Craftware (version 1.21) software utilized for slicing. Nozzle fans were closed during the entire 3D printing procedure to eliminate wrapping on the specimens. All 3D printing parameters were experimentally determined for the materials of the study prior to their use for this study.
Fig. 2.
Summary (right side) of the fundamental FFF 3D printing settings employed for specimens’ fabrication. Tensile specimens, 3D printed according to the corresponding international standard for this work, and a sketch explaining the selected 3D printing orientation are presented on the left side of the figure
Mechanical properties testing methods
Tensile tests were conducted on 3D printed specimens. An Imada MX2 (Imada Inc., Northbrook, IL, USA) tensile apparatus with standardized grips was utilized. The International Standard of American Society for Testing and Material (ASTM) D638-02a was followed for tensile testing, and Type V specimens were 3D printed for each material. Six (6) specimens were fabricated and tested for each material under ambient conditions (23 °C, 50% RH). The test speed was set at 10 mm/min. Prior to the 3D printing, the prepared filament from the pure PA12 polymer was also tested under tensile loading on the same apparatus to evaluate the mechanical strength of the bulk material and the effect of the 3D printing process on the mechanical strength of the material. Tensile tests on the filament (Fig. 5B) were conducted as a screening process because they do not follow an international standard, and their results cannot be directly compared with the 3D printed specimen tensile test results.
Morphological, thermal, and antibacterial analysis
Thermal decomposition analysis was conducted using thermogravimetric analysis (TGA) in the temperature range of 40–550 °C under a nitrogen (N2) supply and a temperature ramp of 10 °C/min. A Perkin Elmer Diamond TGA/DTGA (Perkin Elmer, Waltham, MA, USA) was used for the measurements. To investigate the fracture mechanism, a morphology analysis was conducted using scanning electron microscopy (SEM) images of the fracture area of the specimens. A Jeol JSM 6362LV electron microscope (Jeol Ltd., Peabody MA, USA) was used, with a 20 kV acceleration voltage in high vacuum mode. The samples were formerly gold coated. Images were acquired at two magnifications. The antibacterial properties of the fabricated nanocomposites were evaluated by screening against S. aureus and E. coli. Cylindrical specimens with a diameter of 12 mm and height of 5 mm were 3D printed and tested using the agar diffusion method in a microbiological laboratory under a constant environmental temperature of 37 °C. Petri dishes of 85 mm diameter with bacteria and bacteria growth material MC.2, C.010066 for E. coli, and C.010068 for S. aureus were utilized for the cultures. Bacterial growth was optically measured after 24 h, and inhibition zones were measured and compared.
Design of experiments
The full factorial experimental design was selected to investigate the influence of the TiO2 percentage, NT, and RDA on the mechanical response of the prepared 3D printed nanocomposites [72–74]. The loading of the filler in the nanocomposite was chosen to be studied, since one of the main aims of the work, was to determine the effect of the filler loading on the antibacterial properties and the mechanical response of the prepared nanocomposites. So, preparing and studying nanocomposites with different filler loadings was essential for this work.
The RDA and NT have also been considered since they have been proved important in the literature for the mechanical strength of the FFF 3D printed parts [11]. So, various parameter values were studied in the work. For ‘line’ type infill structures, the zero RDA increases the UTS, but the variability is different for each working filament. Also, for the nozzle temperature, the effects depend on the composite matrix material and filler content wt% [11]. Therefore, twenty-seven (27) combinations of the three independent parameters with three discrete values each (levels; see Table 1) were tested three (3) times each, resulting in eighty-one experiments (Table 2).
Table 1.
Parameters with levels
| Variables | Units | Levels | ||
|---|---|---|---|---|
| 1 | 2 | 3 | ||
| PA12 vs TiO2 | (%) TiO2 | 0 | 2 | 4 |
| Raster deposition angle (RDA) | (Degrees) | 0 | 45 | 90 |
| Nozzle temperature (NT) | (°C) | 240 | 250 | 260 |
Table 2.
Experiments
| Νo | Input parameters | Output parameters | |||||||||||||
|---|---|---|---|---|---|---|---|---|---|---|---|---|---|---|---|
| ε (mm/mm) | σB (MPa) | E (MPa) | T (MJ/m3) | ||||||||||||
| TiO2 (%) | RDA (o) | NT (°C) | Min | Med | Max | Min | Med | Max | Min | Med | Max | Min | Med | Max | |
| 1–3 | 0 | 0 | 240 | 2.3 | 2.4 | 2.4 | 33.9 | 34.6 | 34.8 | 121.3 | 124.3 | 127.7 | 78.0 | 81.0 | 83.0 |
| 4–6 | 0 | 0 | 250 | 2.7 | 2.8 | 2.8 | 33.8 | 33.9 | 34.2 | 117.0 | 130.8 | 137.3 | 90.0 | 90.5 | 90.7 |
| 7–9 | 0 | 0 | 260 | 3.0 | 3.0 | 3.1 | 33.1 | 33.1 | 33.5 | 112.5 | 118.3 | 119.6 | 92.6 | 94.4 | 95.5 |
| 10–2 | 0 | 45 | 240 | 0.5 | 0.5 | 0.5 | 31.5 | 32.8 | 33.0 | 117.8 | 123.8 | 136.7 | 46.6 | 52.5 | 58.0 |
| 13–5 | 0 | 45 | 250 | 3.5 | 3.5 | 3.8 | 37.3 | 37.3 | 37.5 | 123.5 | 134.8 | 142.4 | 116.1 | 117.8 | 125.6 |
| 16–8 | 0 | 45 | 260 | 4.0 | 5.1 | 5.2 | 40.8 | 43.2 | 45.7 | 132.3 | 138.0 | 140.6 | 140.8 | 182.3 | 191.3 |
| 19–21 | 0 | 90 | 240 | 2.8 | 3.3 | 4.0 | 33.9 | 37.5 | 37.8 | 108.9 | 134.7 | 136.8 | 102.0 | 121.1 | 141.8 |
| 22–4 | 0 | 90 | 250 | 3.5 | 4.1 | 4.3 | 35.8 | 38.2 | 41.0 | 131.5 | 139.2 | 144.4 | 121.4 | 139.4 | 152.9 |
| 25–7 | 0 | 90 | 260 | 3.6 | 4.8 | 5.3 | 39.0 | 39.9 | 44.5 | 121.8 | 128.4 | 146.1 | 130.5 | 170.5 | 199.4 |
| 28–30 | 2 | 0 | 240 | 2.9 | 3.0 | 3.1 | 33.0 | 33.9 | 33.9 | 126.8 | 128.8 | 135.1 | 89.6 | 93.5 | 96.2 |
| 31–3 | 2 | 0 | 250 | 2.7 | 2.8 | 3.2 | 31.2 | 32.4 | 33.0 | 117.3 | 130.8 | 136.3 | 85.9 | 89.7 | 110.1 |
| 34–6 | 2 | 0 | 260 | 2.5 | 2.8 | 3.0 | 28.6 | 31.0 | 32.6 | 118.8 | 122.7 | 130.7 | 80.6 | 87.3 | 92.6 |
| 37–9 | 2 | 45 | 240 | 0.4 | 0.5 | 0.5 | 25.8 | 29.4 | 32.1 | 107.5 | 121.5 | 122.7 | 18.8 | 18.9 | 25.0 |
| 40–2 | 2 | 45 | 250 | 0.4 | 0.4 | 0.5 | 25.3 | 28.5 | 29.9 | 101.0 | 119.5 | 126.0 | 13.1 | 18.2 | 66.7 |
| 43–5 | 2 | 45 | 260 | 0.5 | 0.5 | 0.5 | 23.5 | 29.5 | 30.0 | 86.8 | 113.1 | 125.3 | 15.4 | 24.1 | 25.9 |
| 46–8 | 2 | 90 | 240 | 0.4 | 0.5 | 0.5 | 28.6 | 28.8 | 29.8 | 99.3 | 109.5 | 116.2 | 19.7 | 19.9 | 78.6 |
| 49–51 | 2 | 90 | 250 | 0.5 | 0.5 | 0.5 | 26.9 | 31.1 | 32.5 | 88.0 | 120.5 | 122.7 | 18.0 | 32.4 | 56.8 |
| 52–4 | 2 | 90 | 260 | 0.4 | 0.5 | 0.5 | 29.4 | 30.6 | 32.2 | 113.6 | 123.5 | 123.9 | 37.6 | 38.5 | 45.3 |
| 55–7 | 4 | 0 | 240 | 2.4 | 2.7 | 3.0 | 27.3 | 29.0 | 29.9 | 118.3 | 119.1 | 132.8 | 71.5 | 85.6 | 88.0 |
| 58–60 | 4 | 0 | 250 | 2.6 | 2.8 | 2.8 | 26.8 | 29.5 | 30.6 | 124.7 | 126.2 | 130.5 | 75.1 | 84.2 | 86.7 |
| 61–3 | 4 | 0 | 260 | 2.8 | 3.1 | 3.2 | 28.8 | 29.1 | 29.5 | 123.7 | 130.5 | 131.5 | 84.5 | 87.6 | 91.0 |
| 64–6 | 4 | 45 | 240 | 0.4 | 0.4 | 0.4 | 22.3 | 23.3 | 26.0 | 88.5 | 107.5 | 118.0 | 11.7 | 15.7 | 17.2 |
| 67–9 | 4 | 45 | 250 | 0.3 | 0.4 | 0.5 | 24.6 | 24.9 | 27.9 | 109.3 | 112.6 | 118.4 | 13.9 | 15.7 | 19.6 |
| 70–2 | 4 | 45 | 260 | 0.4 | 0.5 | 0.5 | 25.7 | 28.5 | 29.4 | 109.6 | 116.2 | 128.7 | 16.1 | 16.1 | 19.6 |
| 73–5 | 4 | 90 | 240 | 0.5 | 0.5 | 0.5 | 21.8 | 21.9 | 22.3 | 86.6 | 88.2 | 94.3 | 16.7 | 16.7 | 19.8 |
| 76–8 | 4 | 90 | 250 | 0.3 | 0.5 | 0.5 | 22.2 | 23.5 | 24.6 | 90.2 | 100.6 | 107.3 | 20.5 | 21.2 | 30.6 |
| 79–81 | 4 | 90 | 260 | 0.4 | 0.5 | 0.5 | 22.5 | 23.4 | 27.7 | 80.6 | 102.4 | 111.2 | 15.9 | 18.5 | 21.3 |
Results
Mechanical properties
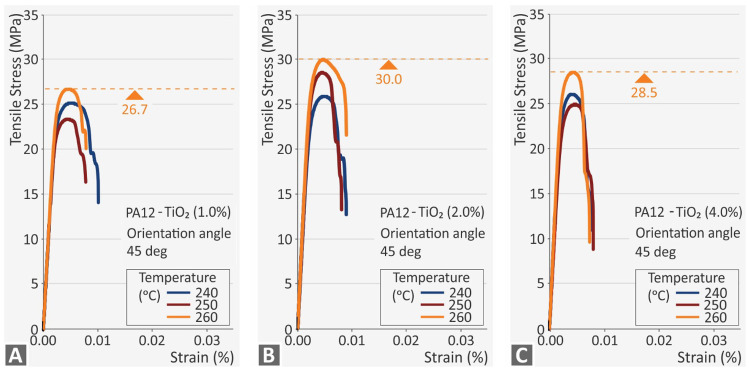
Tensile tests were conducted on a set of six specimens for all tested scenarios to determine their mechanical strength and acquire a generic aspect of their mechanical performance. Figure 3 presents the typical stress (MPa) to strain (mm/mm) curves of the specimens in a comparison with different filler loadings and 3D printing nozzle temperatures for the same infill 3D printing orientation angle of 45°. According to the results, all nanocomposites exhibited enhanced tensile strength when the nozzle temperature was set to 260 °C. This behavior can be attributed to the better flow rate of the materials, which resulted in a fine fusion to interlayer bonding. Other mechanical properties, such as the tensile modulus of elasticity are decreased at 260 °C, with the highest values recorded at 250 °C. This indicates that the optimum mechanical response is on parts built with nozzle temperature in the range of 250–260 °C. It should be noted that the 1 wt.% nanocomposite presented in Fig. 3 was prepared, but since it did not exhibit antibacterial performance, it was not further considered in the modeling process.
Fig. 3.
Typical tensile stress (MPa) to strain (mm/mm) curves of tensile specimens’ 3D printed with infill’s extrusion orientation of 45° and for all tested nozzle’s temperatures for A PA12-TiO2 1.0 wt.%, B PA12-TiO2 2.0 wt.%, and C PA12-TiO2 4.0 wt.%
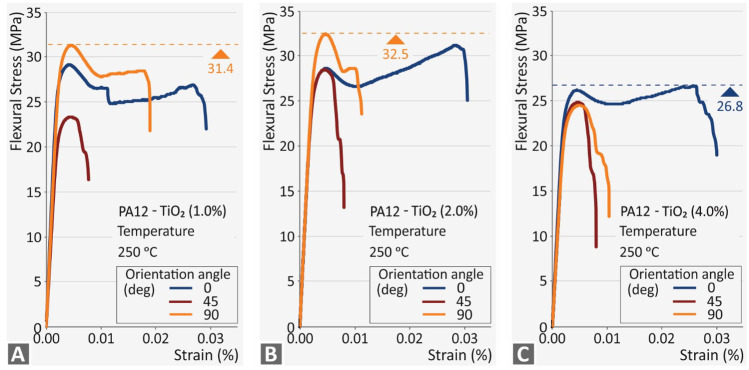
Figure 4 shows the typical stress (MPa) to strain (mm/mm) curves of the tensile tests for the same nozzle temperature of 250 °C for different filler loading and infill orientation 3D printing angles. A noticeable ductile behavior was observed for all nanocomposites with an orientation angle of 0°, while for the other two orientation angles, a rather brittle behavior was reported. The coherence of the specimens in the 3D printing direction was higher than that in the other 3D printing orientations, whereas the filler loading caused an inconsistent effect in the cases of 1.0 wt.% and 2.0 wt.%. At 90°, a higher tensile strength was measured which contradicts the mechanical behavior of the 3D printed specimens, as the fusion between the infill strands in the 3D printing direction is expected to be less than that in the other directions. As a result, 90° exhibited the worst mechanical performance, which was not the result here. This behavior was plausibly due to the filler’s fusion in each nanocomposite material. In the case of 4.0 wt.%, such effect is changing to what is usually reported for the infill orientation and such change in the mechanical behavior is possibly implying a saturation effect due to the filler’s loading. Such variations in the mechanical properties further strengthen the need for mathematical modeling to optimize the mechanical response of the 3D printed parts, according to the selected 3D printing parameters.
Fig. 4.
Typical tensile stress (MPa) to strain (mm/mm) curves of tensile specimens’ 3D printed with nozzle temperature set to 250 °C and for all tested infill’s extrusion orientation for A PA12-TiO2 1.0 wt.%, B PA12-TiO2 2.0 wt.%, and C PA12-TiO2 4.0 wt.%
Figure 5C shows the tensile test results of the filaments. As shown, the measured tensile strength of the filament is in good agreement with the nominal strength of the material in its datasheet. The measured tensile strength of the filament was approximately 43% higher than the 3D printed specimens, indicating the strong effect of the 3D printing process on the mechanical response of the materials. This further supports the need for mathematical modeling to optimize the 3D printing parameters for parts built with this material.
Thermal properties
To verify the thermal performance of the studied materials, thermogravimetric analysis (TGA) was conducted on the samples from the 3D printed parts. Figure 5D shows the weight loss (%) to temperature (°C) for the PA12 TiO2 2.0 wt.% nanocomposite and the corresponding d(weight) rate to dT in comparison to temperature (°C) (Fig. 5E). The TGA graphs verified that the temperatures used in the extrusion and the 3D printing process did not affect the material because its degradation temperature was much higher than the temperatures used in the study.
Morphological analysis
The quality of the produced filament was verified by recording the filament diameter from the built-in sensor of the 3D Evo extruder (Fig. 5A) during the filament extrusion process. The diameter was set at 1.75 mm. As shown in Fig. 5A, the diameter of the produced filament had an average deviation of 0.05 mm to the nominal value, which is an acceptable deviation, ensuring the 3D printing quality.
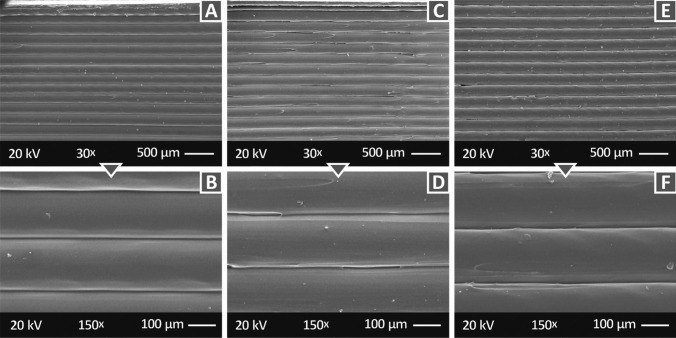
To evaluate the 3D printing quality of the specimens, side surface SEM images were acquired from tensile test specimens (Fig. 6). In the pure PA12 images (Fig. 6a, b), a perfect layer interfusion can be observed, with no defects. With the addition of the filler, a few voids and defects can be observed in the SEM images. These voids and defects do not seem to increase with the increase of the filler loading. In the higher magnification images, these defects were not evaluated as significant; still, they might be the reason for the decreased mechanical performance of the nanocomposites, when compared to the pure PA12 material.
Fig. 6.
Specimen’s side surface in a magnification level of 30 × and 150 × : a, b pure PA12, c, d PA12/TiO2 1.0 wt.%, e, f PA12/TiO2 2.0 wt.%
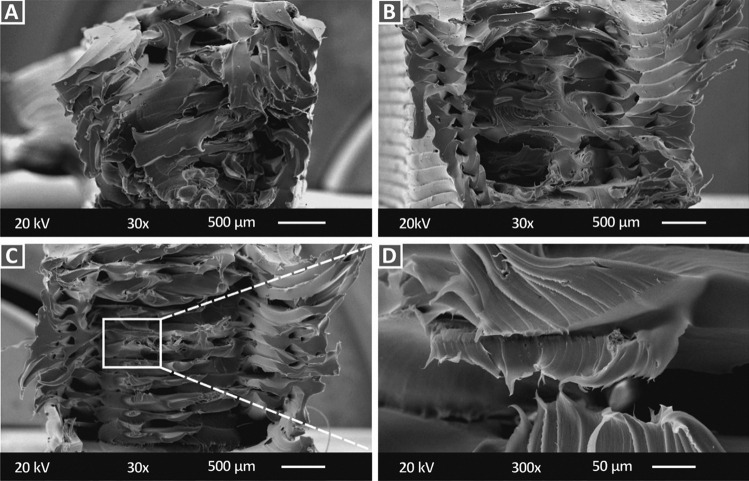
To investigate the fracture mechanism, SEM images were acquired from the fracture areas of the specimens. Through the SEM images, an aspect of the internal structure can also be extracted, providing mainly qualitative information related to the processing quality. In Fig. 7A, PA12 pure material’s fracture area is shown at a magnification level of 30 × . The internal structure appears compact enough, considering that it is fractured, indicating a fine quality for the 3D printing procedure. A ductile fracture mechanism is observed, which agrees with the PA12 mechanical properties, and a fine fusion quality in the interlayer direction is depicted. Figures 6C and 7B present the fracture areas of the PA12 TiO2 2.0 wt.% and 4.0 wt.% nanocomposites. Few minor voids were observed between the shell structure and the infill. Such voids are plausibly caused during the fracture of the specimen, but they can also indicate that the presence of TiO2 introduced a change in the flow rate of the nanocomposite which forced a reduction in the bonding quality in the intralayer direction, while the interlayer fusion seems to be less affected. In Fig. 7D, a closer view at a magnification level of 300 × is presented for the PA12 TiO2 4.0 wt.% nanocomposite material, clearly indicating the ductile fracture mechanism of all tested materials.
Fig. 7.
Specimen’s fracture area in a magnification level of 30 × for A PA12 pure, B PA12/TiO2 2.0 wt.%, C PA12/TiO2 4.0 wt.%, and D 300 × magnification level of PA12/TiO2 4.0 wt.%
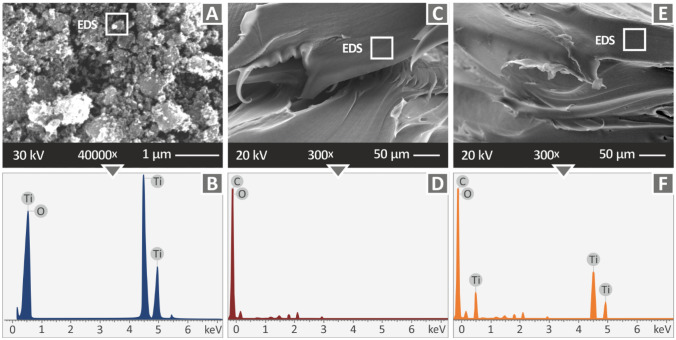
In Fig. 8, SEM images of the TiO2 powder (Fig. 8a), pure PA12 (Fig. 8b), and PA12/TiO2 2.0 wt.% are presented along with the corresponding EDX graphs produced in each case. In all cases, the elements of the materials were verified, as shown in the figures. As expected, in the TiO2 powder EDX graph, the Ti peaks are higher, indicating a higher concentration than in the nanocomposite material.
Fig. 8.
a SEM image of the TiO2 powder, b corresponding EDS graph of the TiO2 powder, c SEM image of the pure PA12, d corresponding EDS graph of the pure PA12, e SEM image of the PA12/TiO2 2.0 wt.%, f corresponding EDS graph of the PA12/TiO2 2.0 wt.%
Antibacterial performance
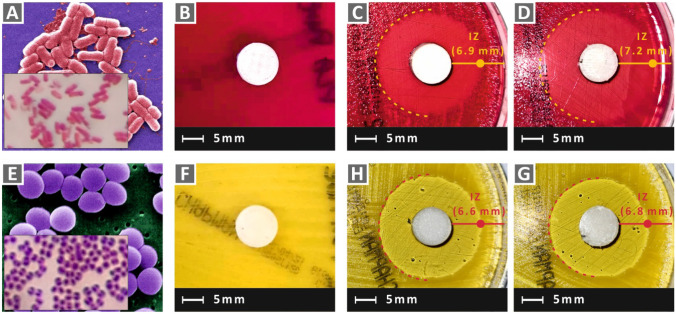
This work aimed to optimize with mathematical modeling the mechanical response of nanocomposites with antibacterial properties and 3D printing using the FFF process. Therefore, the antibacterial performance of the prepared 3D printed nanocomposites should have been verified. This was achieved in this work using the following screening process. The antibacterial performance of the fabricated PA12/TiO2 nanocomposite materials is shown in Fig. 9. Images were acquired after culturing the bacteria for a duration of 24 h. The antibacterial performance with the introduction of TiO2 in the nanocomposites is clearly shown through the developed inhibition zones (IZ). In Fig. 9B, F, PA12 pure material’s antibacterial performance is shown. As expected, the material did not exhibit antibacterial performance. The addition of titanium dioxide in 2.0 wt.% (Fig. 9C and H) or 4.0 wt.% (Fig. 9D, G) created IZs which were measured with over 6.5 mm width, for both tested bacteria (E. coli and S. aureus). It was also shown that an increase in the filler loading increased the IZs. Agar well diffusion, utilized as a screening method for the determination of the antibacterial performance of nanocomposites, exposes the specimens to a severe bacterial growth environment. The creation of such IZs for the nanocomposites assessed herein indicates the potential for further study of the antibacterial performance of TiO2 as a filler in filamentous nanocomposites, as it could function as a strong factor for the development of multifunctional nanocomposite materials in 3D printing.
Fig. 9.
A Typical morphology of E. coli, B PA12 pure specimen in E. coli, C PA12/TiO2 2.0 wt.% specimen in E. coli, D PA12/TiO2 4.0 wt.% specimen in E. coli, E Typical morphology of S. aureus, F PA12 pure specimen in S. aureus, H PA12/TiO2 2.0 wt.% specimen in S. aureus, G PA12/TiO2 4.0 wt.% specimen in S. aureus
Data analysis and modeling
Previous works in the literature [73] inspired the analysis of experimental data. The three best values reported of the six experiments conducted were considered in the modeling process. Therefore, the main effects plots (MEP) and the interaction charts decompose the parameter effects and interactions according to the mechanical response.
According to the MEP plots:
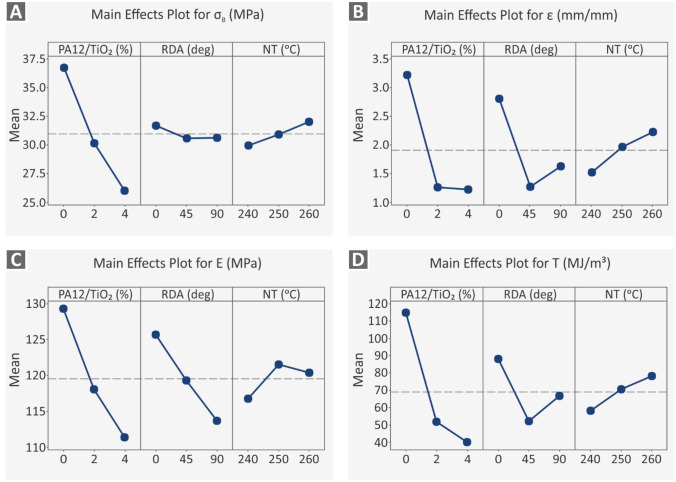
σb (MPa): The percentage of TiO2 was the most critical factor affecting σb (Fig. 10A). The increase in TiO2 loading decreased the σb. This effect plausibly implies a saturation effect on the nanocomposites. Higher filling ratios probably create changes in the volume melting flow ratio, which could be further investigated in future studies. However, NT and RDA did not significantly affect the results, indicating that they are not as important parameters as filler loading. During the FFF process in the current study, the flow rate on the 3D printer was maintained at a constant pre-set value for all the tested materials. The flow rate parameter is related to the ability of the material to flow faster or slower (between a range of flow rates).
ε (mm/mm): Strain is significantly influenced by TiO2% and RDA (Fig. 10b), while NT showed a moderate influence. The addition of TiO2 seems to affect the flow rate of the nanocomposite materials, and as mentioned, the flow rate of all tested materials was set to the same pre-set value. Changing the flow rate value could plausibly improve the flow of the nanocomposites during the FFF process, but it would increase the complexity of the analysis because the results from the varied materials studied cannot be directly compared in this case. The infill orientation affected the strain, plausibly due to pure quality fusion in the 3D printing filamentous direction, causing an anisotropic behavior in the specimens. An infill of 90° RDA was prone to tensile stress. Such an RDA may maintain a better strength performance, but pure filamentous fusion worsens the strain behavior.
E (MPa): E was also significantly influenced by TiO2% and RDA (Fig. 10c) and was moderately influenced by NT. The filler ratio and RDA are described as the most significant settings which should be considered for a high-performance 3D printing process.
T (MJ/m2): Finally, T is also influenced by TiO2% and RDA significantly (Fig. 10d) and moderate by NT. Such a performance further enhances the factorial effect of filler loadings, as per the flow change, and the infill’s filamentous direction as the strain changes. Toughness describes the ability of a material to absorb energy as an integral of the stress–strain curve. Such calculations and the corresponding tensile modulus of elasticity are combined, exploiting the high significance of the specified 3D printing setting analysis.
Fig. 10.
MEP plots of variable parameters vs ε, σb, E, and T
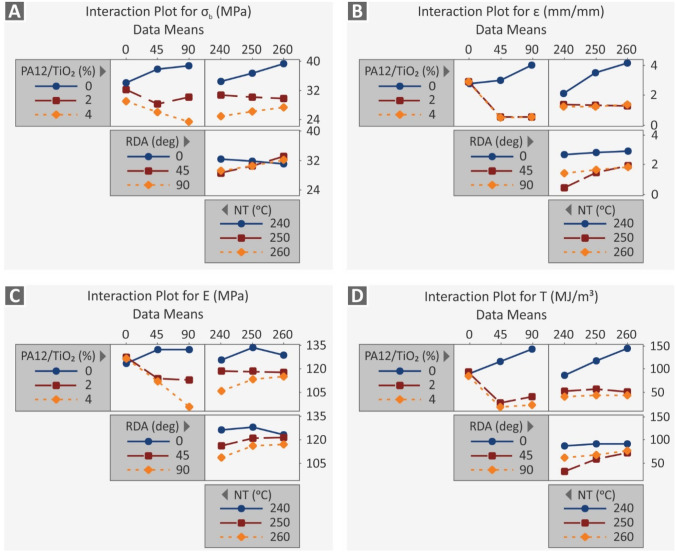
Interaction charts were used to evaluate how the variation of one parameter affected the mechanical response in correlation with other parameter changes (Fig. 11). Unfortunately, the trend lines of these diagrams are not parallel, and in some cases, are complex. Therefore, strong interactions exist, and predictive modeling using regression or neural network models is challenging.
Fig. 11.
Interaction plots
Quadratic regression models vs artificial neural network modeling
To correlate the input with the output parameters, analysis of variance (ANOVA) was performed on the pure data, and quadratic regression models (QRM) with all cross products and quadratic terms were adopted. Therefore, the following equations were used:
| 1 |
where the 'Rj' is used for the mechanical response (ε, σb, E, and T), xi, xj are the variable parameters (TiO2%, RDA, and NT), whilst the bi, bii, and bij are the linear, quadratic, and interaction products of the variables.
Table 3 presents the F values and R2 values based on the ANOVA analysis. The F values of all models were higher than four (4), and P values were lower than 0.05. Therefore, the developed models are appropriate for predicting the mechanical response metrics. According to the F values and R2 values, the ranking of the models concerning the expected accuracy is (i) σB, (ii) ε, (iii) T, and (iv) E. However, the R2 value of E is insufficient, which is evidence that the accuracy of the model is inadequate.
Table 3.
Analysis of variance
| ε (mm/mm) | σB (MPa) | E (MPa) | T (MJ/m.3) | ||
|---|---|---|---|---|---|
| Source | DF | F value | |||
| Regression | 9 | 33.75 | 37.06 | 12.30 | 32.83 |
| TiO2% | 1 | 11.85 | 1.04 | 1.04 | 9.52 |
| RDA | 1 | 0.77 | 6.24 | 2.74 | 1.18 |
| NT | 1 | 0.48 | 0.02 | 1.64 | 0.26 |
| TiO2%*TiO2% | 1 | 33.71 | 4.84 | 0.96 | 23.57 |
| RDA*RDA | 1 | 32.43 | 0.95 | 0.02 | 23.12 |
| NT*NT | 1 | 0.36 | 0.03 | 1.70 | 0.19 |
| TiO2%*RDA | 1 | 59.90 | 41.65 | 37.18 | 61.23 |
| TiO2%*NT | 1 | 17.28 | 2.40 | 0.89 | 14.03 |
| RDA*NT | 1 | 0.12 | 6.84 | 3.05 | 0.56 |
| Error | 71 | ||||
| Total | 80 | ||||
| Performance | |||||
| Regression P value | 0.000 | 0.000 | 0.000 | 0.000 | |
| R.2 | 81.06 | 82.45 | 60.93 | 80.63 | |
| R.2 (adj) | 78.65 | 80.22 | 55.98 | 78.17 | |
| R.2 (pred) | 75.37 | 77.55 | 49.70 | 74.91 | |
| Ranking | 2 | 1 | 4 | 3 | |
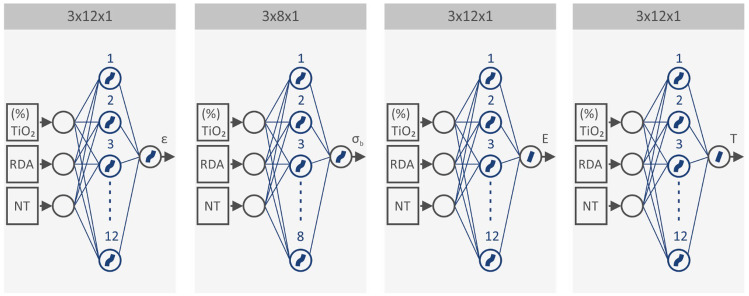
For soft computing modeling reasons, the input parameters (TiO2%, NT, RDA) were normalized using the min–max map rule (Kechagias et al., 2022), while each output parameter (ε, σB, E, T) was normalized using different rules, as indicated in Table 3. The topology of the developed ANN is shown in Fig. 12.
Fig. 12.
The topology of the developed ANNs
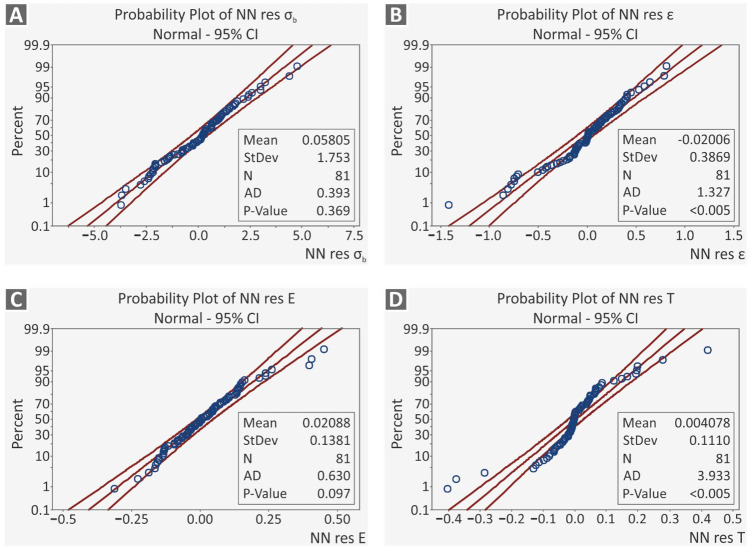
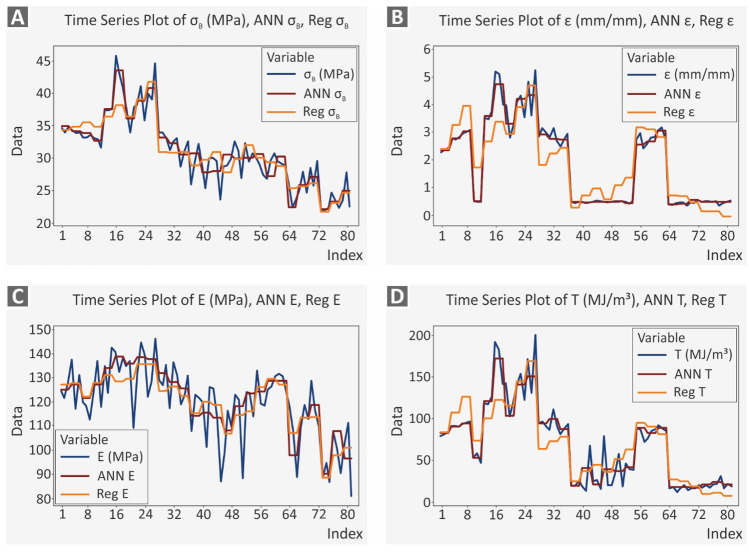
Details of the learning parameters, activation functions, normalization rules of the input and output, and performance of the ANNs are presented in Table 4. The mean absolute percentage values (MAPE) were lower than 16%. The ranking of the models’ prediction efficiency is (i) E, (ii) σB, (iii) ε, and (iv) T. All R2 values are higher than 79%, which means that the models are adequate and more efficient than the regression models (Eq. 1). Moreover, the prediction efficiency of the ANNs was presented by probability plots (Fig. 13a–d). Finally, time-series plots are shown in Fig. 14A–D and are evidence that the ANN models have better prediction efficiency.
Table 4.
Architecture, stop criteria, and performance of the developed ANN
| ε (mm/mm) | σB (MPa) | E (MPa) | T (MJ/m.3) | |
|---|---|---|---|---|
| Normalization rule | ||||
| Input | Map min–max [0, 1] | |||
| Output | − 10*log10(Yi) | No | Map min–max | log10(Yi) |
| Output objective | Yi ≥ 0 | |||
| Topology | ||||
| Topology | 3 × 12 × 1 | 3 × 8 × 1 | 3 × 12 × 1 | 3 × 12 × 1 |
| Transfer functions | ||||
| Layer 1 (hidden) | Tansig | Tansig | Tansig | Tansig |
| Layer 2 (output) | Tansig | Tansig | Purelin | Purelin |
| Learning parameters | ||||
| Mu | 0.001 | |||
| Mu- | 0.1 | |||
| Mu + | 10 | |||
| Stop training rules | ||||
| Epochs | 1000 | |||
| Goal | 0 | |||
| Max fail | 6 | |||
| Performance | ||||
| MSE | 0.20848 | 3.1606 | 0.026854 | 0.017726 |
| Epochs | 0 | 1 | 0 | 0 |
| Rtraining | 0.99561 | 0.95743 | 0.78773 | 0.94892 |
| Rvalidation | 0.99428 | 0.94487 | 0.91683 | 0.98113 |
| Rtest | 0.99841 | 0.89214 | 0.77727 | 0.98542 |
| Rall | 0.99600 | 0.94699 | 0.79434 | 0.9525 |
| MAPE | 6.5% | 4.6% | 6.1% | 16% |
| Ranking | 3 | 2 | 1 | 4 |
Fig. 13.
Probability plots of the residuals of the developed ANNs
Fig. 14.
Time series plots: actual vs ANNs vs QRMs
Evaluation experiments
The regression mentioned above and the ANN models were evaluated using 39 independent evaluation experiments, as described in Table 5. The mean absolute percentage values were similar to those shown in Table 5. This provides solid evidence that the following ANN modeling procedure is suitable.
Table 5.
Independent evaluation experiments
| PA12/TiO2 (%) | RDA (o) | NT (oC) | Actual | ANN | Actual | ANN | Actual | ANN | Actual | ANN | |
|---|---|---|---|---|---|---|---|---|---|---|---|
| ε (mm/mm) | σB (MPa) | E (MPa) | T (MJ/m3) | ||||||||
| 1 | 0 | 0 | 240 | 2.24 | 2.35 | 34.10 | 34.90 | 135.74 | 124.86 | 79.79 | 81.28 |
| 2 | 0 | 0 | 240 | 2.56 | 2.35 | 33.89 | 34.90 | 114.21 | 124.86 | 84.37 | 81.28 |
| 3 | 0 | 0 | 250 | 2.58 | 2.79 | 33.44 | 34.10 | 125.53 | 126.92 | 88.12 | 88.94 |
| 4 | 0 | 0 | 250 | 2.76 | 2.79 | 33.35 | 34.10 | 118.42 | 126.92 | 88.45 | 88.94 |
| 5 | 0 | 0 | 260 | 2.80 | 3.03 | 32.40 | 33.76 | 121.49 | 121.41 | 87.21 | 92.70 |
| 6 | 0 | 0 | 260 | 2.80 | 3.03 | 33.37 | 33.76 | 130.75 | 121.41 | 91.29 | 92.70 |
| 7 | 0 | 45 | 250 | 4.43 | 3.59 | 42.49 | 37.52 | 132.19 | 133.81 | 159.01 | 115.18 |
| 8 | 0 | 45 | 250 | 3.62 | 3.59 | 31.14 | 37.52 | 119.47 | 133.81 | 100.13 | 115.18 |
| 9 | 0 | 45 | 260 | 3.88 | 4.75 | 37.57 | 43.45 | 149.98 | 138.51 | 130.75 | 156.86 |
| 10 | 0 | 90 | 240 | 3.59 | 3.32 | 36.11 | 36.04 | 133.64 | 135.74 | 121.24 | 118.84 |
| 11 | 0 | 90 | 250 | 4.00 | 4.21 | 37.24 | 38.80 | 113.68 | 138.46 | 139.63 | 132.96 |
| 12 | 0 | 90 | 250 | 3.15 | 4.21 | 36.53 | 38.80 | 133.15 | 138.46 | 107.20 | 132.96 |
| 13 | 0 | 90 | 260 | 3.74 | 4.36 | 38.31 | 40.78 | 125.78 | 137.61 | 130.50 | 191.38 |
| 14 | 0 | 90 | 260 | 4.54 | 4.36 | 39.37 | 40.78 | 135.13 | 137.61 | 154.62 | 191.38 |
| 15 | 2 | 0 | 240 | 3.36 | 2.92 | 33.45 | 33.14 | 124.92 | 131.85 | 102.93 | 94.89 |
| 16 | 2 | 0 | 240 | 3.30 | 2.92 | 33.78 | 33.14 | 122.29 | 131.85 | 101.64 | 94.89 |
| 17 | 2 | 0 | 250 | 3.47 | 2.76 | 33.44 | 32.23 | 123.20 | 128.05 | 101.69 | 94.73 |
| 18 | 2 | 0 | 250 | 3.50 | 2.76 | 34.10 | 32.23 | 124.39 | 128.05 | 106.57 | 94.73 |
| 19 | 2 | 0 | 260 | 3.06 | 2.73 | 31.82 | 30.49 | 117.41 | 125.48 | 91.58 | 83.52 |
| 20 | 2 | 45 | 240 | 0.46 | 0.48 | 31.08 | 30.61 | 128.45 | 114.05 | 28.42 | 18.80 |
| 21 | 2 | 45 | 250 | 0.46 | 0.44 | 31.42 | 27.75 | 123.66 | 115.30 | 82.55 | 34.69 |
| 22 | 2 | 45 | 260 | 0.45 | 0.48 | 31.01 | 27.91 | 121.89 | 113.10 | 22.38 | 24.16 |
| 23 | 2 | 90 | 240 | 0.52 | 0.46 | 24.60 | 30.44 | 96.32 | 107.84 | 18.82 | 31.16 |
| 24 | 2 | 90 | 240 | 0.49 | 0.46 | 31.74 | 30.44 | 120.03 | 107.84 | 46.51 | 31.16 |
| 25 | 2 | 90 | 250 | 0.49 | 0.49 | 28.83 | 29.90 | 112.03 | 117.83 | 24.37 | 24.07 |
| 26 | 2 | 90 | 260 | 0.47 | 0.43 | 31.27 | 30.01 | 123.69 | 123.35 | 102.04 | 44.93 |
| 27 | 4 | 0 | 240 | 2.47 | 2.56 | 27.96 | 30.57 | 129.31 | 123.98 | 70.80 | 79.41 |
| 28 | 4 | 45 | 240 | 0.50 | 0.39 | 23.97 | 22.35 | 109.78 | 97.71 | 17.56 | 16.46 |
| 29 | 4 | 45 | 240 | 0.42 | 0.39 | 23.26 | 22.35 | 102.95 | 97.71 | 13.73 | 16.46 |
| 30 | 4 | 45 | 250 | 0.43 | 0.41 | 27.81 | 25.76 | 121.56 | 113.17 | 19.31 | 16.27 |
| 31 | 4 | 45 | 250 | 0.42 | 0.41 | 21.62 | 25.76 | 86.02 | 113.17 | 12.68 | 16.27 |
| 32 | 4 | 45 | 260 | 0.47 | 0.53 | 30.71 | 27.08 | 124.53 | 118.55 | 33.38 | 19.61 |
| 33 | 4 | 45 | 260 | 0.42 | 0.53 | 27.62 | 27.08 | 119.08 | 118.55 | 17.73 | 19.61 |
| 34 | 4 | 90 | 240 | 0.44 | 0.48 | 23.86 | 22.03 | 103.87 | 90.02 | 20.98 | 18.25 |
| 35 | 4 | 90 | 240 | 0.49 | 0.48 | 23.34 | 22.03 | 97.88 | 90.02 | 17.06 | 18.25 |
| 36 | 4 | 90 | 250 | 0.49 | 0.46 | 27.36 | 23.19 | 104.79 | 107.53 | 30.08 | 23.70 |
| 37 | 4 | 90 | 250 | 0.48 | 0.46 | 26.65 | 23.19 | 100.91 | 107.53 | 17.51 | 23.70 |
| 38 | 4 | 90 | 260 | 0.46 | 0.48 | 22.33 | 24.92 | 90.99 | 96.36 | 19.08 | 18.54 |
| 39 | 4 | 90 | 260 | 0.42 | 0.48 | 25.66 | 24.92 | 105.06 | 96.36 | 16.68 | 18.54 |
| Mean absolute error — MAPE (%) | 9.8% | 7.0% | 7.2% | 18.0% | |||||||
Discussion
In this work, tensile specimens with antibacterial performance were fabricated through FFF 3D printing with various 3D printing settings, as described above. The significance of each 3D printing parameter was evaluated based on the experimental results and ANN analysis. Three parameters, that is, filler loading, RDA, and NT, were analyzed for their effect on the tensile performance of the nanocomposites. The analysis performed through mathematical modeling highlighted the most significant settings and their values that optimize the mechanical performance. Filler loading was the most significant parameter affecting the mechanical response of the specimens, mainly because of its effect on the flow behavior of the nanocomposites during the 3D printing process. Through ANN modeling, it was shown that further studies are required to create a fully analytical model of this parameter. But the addition of the filler induces antibacterial properties to the matrix material, which are important for specific types of applications. This was expected since titanium has characteristics that are inhibiting the growth of different bacteria [75]. Still, it was found in the experiments, that the increase of the filler loading does not significantly improve the antibacterial performance of the nanocomposites.
Considering the filler wt%, it is evident that it reduces all the mechanical responses. The PA12 with 4wt.% TiO2 exhibits about 10 MPa lower σb than pure PA12. On the other hand, the raster deposition angle decrease or the nozzle temperature increase increases the σb of the investigated material and experimental region. These results are similar to the literature for other composite materials, e.g., PLA wood composites [11].
Infill orientation has also been exploited as a crucial factor in the mechanical performance of nanocomposites. The quantification of the parameter through ANN modeling enabled the ability to predict in a more accurate way the mechanical response according to the requested specifications of each case. The RDA radically affected the isotropic behavior of the specimens. Insufficient fusion increased the anisotropic behavior of the specimens and increased the significance of this parameter. Finally, the quantification of the nozzle temperature effect on the mechanical performance of the nanocomposites through ANN modeling indicated that there was no significant factor in the cases studied.
Conclusions
The evolution of manufacturing is enhancing the role of AM in end-use and operating component manufacturing. Composite and nanocomposite materials are continuously developed to enable the fabrication of AM parts to operate under different conditions. The necessity of predicting the mechanical and other performances of such materials most promptly and effectively is high. In the current study, the effect of three (3) FFF parameters was analyzed through mathematical and ANN modeling to optimize the mechanical response of nanocomposites with antibacterial performance.
All the parameters have an effect on the mechanical response of the materials investigated. Through the analysis, filler loading, and infill orientation were reported as significant parameters. Zero degree print orientation and the highest temperature of 260 °C studied achieved the highest mechanical response on the materials, with overall high values in strength, modulus of elasticity, and strain. Still, no clear pattern was observed in the effect of the parameters studied in the mechanical response. The addition of the filler had a negative effect on the mechanical strength of the matrix material, but its strength is still adequate for use in applications requiring an enhanced mechanical response. At the same time, the introduction of the filler, induced antibacterial properties to the nanocomposites prepared, which is an important asset for the materials, for use in demanding medical applications. Since the increase of the filler loading does not significantly increase the antibacterial performance, low filler concentrations are adequate for the specific nanocomposites. Low filler loadings are easier to process and do not significantly increase the cost of the materials in the process.
The enhanced mechanical response and antibacterial performance of the tested materials indicated their high potential for use in a wide range of medical applications. ANN model analysis has further enabled the quantification of the effect of the 3D printing parameters on the mechanical response, while it could be extended to other FFF settings such as the flow rate, which was found to plausibly affect the mechanical performance of the tested nanocomposites. Optimization of the FFF process could be time-wise shortened through prompt, accurate mathematical models, which should not only consider the geometric and operational conditions of the 3D printers but also include material parameters, as was reported in the current study.
Acknowledgements
The authors would like to thank Ms. Aleka Manousaki from the Institute of Electronic Structure and Laser of the Foundation for Research and Technology-Hellas (IESL-FORTH) for taking the SEM images presented in this work.
Author contribution
Nectarios Vidakis: conceptualization, resources, supervision, project administration; Markos Petousis: methodology, formal analysis, writing—original draft preparation, writing—review, and editing; Nikolaos Mountakis: Software, formal analysis, investigation, data curation; Emmanuel Maravelakis: validation, investigation, visualization; Stefanos Zaoutsos: investigation, visualization; John D. Kechagias: mathematical modeling, writing—review and editing. The manuscript was written through the contributions of all authors. All authors have approved the final version of the manuscript.
Funding
Funding sponsors had no role in the design of the study; in the collection, analyses, or interpretation of data; in the writing of the manuscript; or in the decision to publish the results.
Data availability statement
The raw/processed data required to reproduce these findings cannot be shared at this time because of technical or time limitations.
Declarations
Conflict of interest
The authors declare no competing interests.
Footnotes
Publisher's Note
Springer Nature remains neutral with regard to jurisdictional claims in published maps and institutional affiliations.
Contributor Information
Nectarios Vidakis, Email: vidakis@hmu.gr.
Markos Petousis, Email: markospetousis@hmu.gr.
Nikolaos Mountakis, Email: mountakis@hmu.gr.
Emmanuel Maravelakis, Email: marvel@hmu.gr.
Stefanos Zaoutsos, Email: szaoutsos@uth.gr.
John D. Kechagias, Email: jkechag@uth.gr
References
- 1.Challagulla NV, Rohatgi V, Sharma D, Kumar R (2020) Recent developments of nanomaterial applications in additive manufacturing: a brief review. Current Opinion in Chemical Engineering Elsevier Ltd 1 June
- 2.Ngo TD, Kashani A, Imbalzano G, Nguyen KTQ, Hui D (2018) Additive manufacturing (3D printing): a review of materials methods applications and challenges. Composites Part B: Engineering Elsevier Ltd 15 June
- 3.Tack P, Victor J, Gemmel P, Annemans L. 3D-printing techniques in a medical setting: a systematic literature review. Biomed Eng Online. 2016;15(1):1–21. doi: 10.1186/s12938-016-0236-4. [DOI] [PMC free article] [PubMed] [Google Scholar]
- 4.Vidakis N, Petousis M, Velidakis E, Liebscher M, Mechtcherine V, Tzounis L. On the strain rate sensitivity of fused filament fabrication (Fff) processed pla abs petg pa6 and pp thermoplastic polymers. Polymers MDPI AG. 2020;12(12):1–15. doi: 10.3390/polym12122924. [DOI] [PMC free article] [PubMed] [Google Scholar]
- 5.Bishop EG, Leigh SJ. Using large-scale additive manufacturing (LSAM) as a bridge manufacturing process in response to shortages in PPE during the COVID-19 outbreak. International Journal of Bioprinting. 2020;6(4):51–58. doi: 10.18063/ijb.v6i4.281. [DOI] [PMC free article] [PubMed] [Google Scholar]
- 6.Gauss C, Pickering KL, Muthe LP. The use of cellulose in bio-derived formulations for 3D/4D printing: a review. Composites Part C: Open Access Elsevier BV. 2021;4:100113. [Google Scholar]
- 7.Maraveas C (2020) Production of sustainable and biodegradable polymers from agricultural waste. Polymers MDPI AG 1 May. 10.3390/POLYM12051127 [DOI] [PMC free article] [PubMed]
- 8.Tarfaoui M, Nachtane M, Goda I, Qureshi Y, Benyahia H. Additive manufacturing in fighting against novel coronavirus COVID-19 International Journal of Advanced Manufacturing Technology. The International Journal of Advanced Manufacturing Technology. 2020;110(11–12):2913–2927. doi: 10.1007/s00170-020-06077-0. [DOI] [PMC free article] [PubMed] [Google Scholar]
- 9.Zuniga JM, Cortes A. The role of additive manufacturing and antimicrobial polymers in the COVID-19 pandemic. Expert Review of Medical Devices Taylor & Francis. 2020;17(6):477–481. doi: 10.1080/17434440.2020.1756771. [DOI] [PMC free article] [PubMed] [Google Scholar]
- 10.Vidakis N, Petousis M, Savvakis K et al (2019) A comprehensive investigation of the mechanical behavior and the dielectrics of pure polylactic acid (PLA) and PLA with graphene (GnP) in fused deposition modeling (FDM). Int J Plast Technol 23. 10.1007/s12588-019-09248-1
- 11.Kechagias JD, Zaoutsos SP, Chaidas D, Vidakis N. Multi-parameter optimization of PLA/coconut wood compound for fused filament fabrication using robust design. Int J Adv Manuf Technol. 2022;119:4317–4328. doi: 10.1007/s00170-022-08679-2. [DOI] [Google Scholar]
- 12.Auffray L, Gouge PA, Hattali L. Design of experiment analysis on tensile properties of PLA samples produced by fused filament fabrication. Int J Adv Manuf Technol. 2022;118:4123–4137. doi: 10.1007/s00170-021-08216-7. [DOI] [Google Scholar]
- 13.Wang JC, Ruilova M, Hsieh SJ. A web-based platform for automated vat photopolymerization additive manufacturing process. Int J Adv Manuf Technol. 2022;119:2721–2742. doi: 10.1007/s00170-021-08318-2. [DOI] [Google Scholar]
- 14.Petousis M, Vidakis N, Velidakis E et al (2022) Affordable biocidal ultraviolet cured cuprous oxide filled vat photopolymerization resin nanocomposites with enhanced mechanical properties. Biomimetics 7. 10.3390/biomimetics7010012 [DOI] [PMC free article] [PubMed]
- 15.Vidakis N, Petousis M, Velidakis E et al (2022) Investigation of the biocidal performance of multi-functional resin/copper nanocomposites with superior mechanical response in SLA 3D Printing. Biomimetics 7. 10.3390/biomimetics7010008 [DOI] [PMC free article] [PubMed]
- 16.Badrossamay M, Rezaei A, Foroozmehr E, et al. Effects of increasing powder layer thickness on the microstructure, mechanical properties, and failure mechanism of IN718 superalloy fabricated by laser powder bed fusion. Int J Adv Manuf Technol. 2022;118:1703–1717. doi: 10.1007/s00170-021-07719-7. [DOI] [Google Scholar]
- 17.Wu C, Zafar MQ, Zhao H. Numerical investigation of consolidation mechanism in powder bed fusion considering layer characteristics during multilayer process. Int J Adv Manuf Technol. 2021;113:2087–2100. doi: 10.1007/s00170-021-06768-2. [DOI] [Google Scholar]
- 18.Ziri S, Hor A, Mabru C. Combined effect of powder properties and process parameters on the density of 316L stainless steel obtained by laser powder bed fusion. Int J Adv Manuf Technol. 2022 doi: 10.1007/s00170-022-09160-w. [DOI] [Google Scholar]
- 19.Hailu YM, Nazir A, Hsu CP, et al. Investigation of torsional properties of surface- and strut-based lattice structures manufactured using multiJet fusion technology. Int J Adv Manuf Technol. 2022;119:5929–5945. doi: 10.1007/s00170-022-08681-8. [DOI] [Google Scholar]
- 20.Nazir A, Ali M, Hsieh CH, Jeng JY. Investigation of stiffness and energy absorption of variable dimension helical springs fabricated using multijet fusion technology. Int J Adv Manuf Technol. 2020;110:2591–2602. doi: 10.1007/s00170-020-06061-8. [DOI] [Google Scholar]
- 21.Haq MR, ul, Nazir A, Lin SC, Jeng JY, Parametric investigation of functionally gradient wave springs designed for additive manufacturing. Int J Adv Manuf Technol. 2022;119:1673–1691. doi: 10.1007/s00170-021-08325-3. [DOI] [Google Scholar]
- 22.Greco S, Gutzeit K, Hotz H, et al. Selective laser melting (SLM) of AISI 316L—impact of laser power, layer thickness, and hatch spacing on roughness, density, and microhardness at constant input energy density. Int J Adv Manuf Technol. 2020;108:1551–1562. doi: 10.1007/s00170-020-05510-8. [DOI] [Google Scholar]
- 23.Yamamoto S, Azuma H, Suzuki S, et al. Melting and solidification behavior of Ti-6Al-4V powder during selective laser melting. Int J Adv Manuf Technol. 2019;103:4433–4442. doi: 10.1007/s00170-019-03384-z. [DOI] [Google Scholar]
- 24.Shrestha S, Chou K. An investigation into melting modes in selective laser melting of Inconel 625 powder: single track geometry and porosity. Int J Adv Manuf Technol. 2021;114:3255–3267. doi: 10.1007/s00170-021-07105-3. [DOI] [Google Scholar]
- 25.Ke WC, Oliveira JP, Cong BQ et al (2022) Multi-layer deposition mechanism in ultra high-frequency pulsed wire arc additive manufacturing (WAAM) of NiTi shape memory alloys. Addit Manuf 50. 10.1016/j.addma.2021.102513
- 26.Ramalho A, Santos TG, Bevans B et al (2022) Effect of contaminations on the acoustic emissions during wire and arc additive manufacturing of 316L stainless steel. Addit Manuf 51. 10.1016/j.addma.2021.102585
- 27.Rodrigues TA, Bairrão N, Farias FWC, et al. Steel-copper functionally graded material produced by twin-wire and arc additive manufacturing (T-WAAM) Mater Des. 2022;213:110270. doi: 10.1016/j.matdes.2021.110270. [DOI] [Google Scholar]
- 28.ISO/ASTM52900–15 (2015) Standard terminology for additive manufacturing – general principles – terminology (ASTM52900). Int Organ Stand Geneva, Switz i:1–9
- 29.Vidakis N, Petousis M, Velidakis E, Liebscher M, Tzounis L. Three-dimensional printed antimicrobial objects of polylactic acid (PLA)-silver nanoparticle nanocomposite filaments produced by an in-situ reduction reactive melt mixing process. Biomimetics. 2020;5(3):42. doi: 10.3390/biomimetics5030042. [DOI] [PMC free article] [PubMed] [Google Scholar]
- 30.Wu H, Fahy WP, Kim S, Kim H, Zhao N, Pilato L, Kafi A et al (2020) Recent developments in polymers/polymer nanocomposites for additive manufacturing. Progress in Materials Science 111(January). 10.1016/j.pmatsci.2020.100638
- 31.Vidakis N, Petousis M, Korlos A, Velidakis E, Mountakis N, Charou C, Myftari A. Strain rate sensitivity of polycarbonate and thermoplastic polyurethane for various 3D printing temperatures and layer heights. Polymers. 2021;13(16):2752. doi: 10.3390/polym13162752. [DOI] [PMC free article] [PubMed] [Google Scholar]
- 32.Advincula RC, Dizon JRC, Chen Q, Nui I, Chung J, Kilpatrick L, Newman R. Additive manufacturing for COVID-19: Devices materials prospects and challenges. MRS Communications. 2020;10(3):413–427. doi: 10.1557/mrc.2020.57. [DOI] [PMC free article] [PubMed] [Google Scholar]
- 33.Kunovjanek M, Wankmüller C. An analysis of the global additive manufacturing response to the COVID-19 pandemic. J Manuf Technol Manag. 2020;32(9):75–100. doi: 10.1108/JMTM-07-2020-0263. [DOI] [Google Scholar]
- 34.Patel P, Gohil P. Role of additive manufacturing in medical application COVID-19 scenario: India case study. Journal of Manufacturing Systems Elsevier Ltd. 2021;60(November 2020):811–822. doi: 10.1016/j.jmsy.2020.11.006. [DOI] [PMC free article] [PubMed] [Google Scholar]
- 35.Larrañeta E, Dominguez-Robles J, Lamprou DA (2020) Additive manufacturing can assist in the fight against COVID-19 and other pandemics and impact on the global supply chain. 3D Printing and Additive Manufacturing 7(3):100–103 [DOI] [PMC free article] [PubMed]
- 36.Tareq MS, Rahman T, Hossain M, Dorrington P. Additive manufacturing and the COVID-19 challenges: an in-depth study. Journal of Manufacturing Systems Elsevier Ltd. 2021;60(October 2020):787–798. doi: 10.1016/j.jmsy.2020.12.021. [DOI] [PMC free article] [PubMed] [Google Scholar]
- 37.Somireddy M, Singh CV, Czekanski A. Analysis of the material behavior of 3D printed laminates via FFF. Exp Mech. 2019;59(6):871–881. doi: 10.1007/s11340-019-00511-5. [DOI] [Google Scholar]
- 38.Johnson GA, French JJ. Evaluation of infill effect on mechanical properties of consumer 3D printing. Materials Advances in Technology Innovation. 2018;3(4):179–184. [Google Scholar]
- 39.Liao Y, Liu C, Coppola B, Barra G, Maio L, Di Incarnato L, Lafdi K. Effect of porosity and crystallinity on 3D printed PLA Properties. Polymers. 2019;11(9):1487. doi: 10.3390/polym11091487. [DOI] [PMC free article] [PubMed] [Google Scholar]
- 40.Ferreira I, Melo C, Neto R, Machado M, Alves JL, Mould S. Study of the annealing influence on the mechanical performance of PA12 and PA12 fibre reinforced FFF printed specimens. Rapid Prototyping Journal Emerald Group Holdings Ltd. 2020;26(10):1761–1770. doi: 10.1108/RPJ-10-2019-0278. [DOI] [Google Scholar]
- 41.Goh GD, Yap YL, Tan HKJ, Sing SL, Goh GL, Yeong WY (2020) Process–structure–properties in polymer additive manufacturing via material extrusion: a review. Critical Reviews in Solid State and Materials Sciences Taylor and Francis Inc 3 March
- 42.Zandi MD, Jerez-Mesa R, Lluma-Fuentes J, Jorba-Peiro J, Travieso-Rodriguez JA. Study of the manufacturing process effects of fused filament fabrication and injection molding on tensile properties of composite PLA-wood parts. The International Journal of Advanced Manufacturing Technology. 2020;108(5–6):1725–1735. doi: 10.1007/s00170-020-05522-4. [DOI] [Google Scholar]
- 43.Gao X, Qi S, Kuang X, Su Y, Li J, Wang D (2021) Fused filament fabrication of polymer materials: a review of interlayer bond. Additive Manufacturing Elsevier BV 1 January. 10.1016/j.addma.2020.101658
- 44.Vidakis N, Petousis M, Tzounis L, Maniadi A, Velidakis E, Mountakis N, Kechagias JD. Sustainable additive manufacturing: mechanical response of polyamide 12 over multiple recycling processes. Materials MDPI AG. 2021;14(2):1–15. doi: 10.3390/ma14020466. [DOI] [PMC free article] [PubMed] [Google Scholar]
- 45.Vidakis N, Petousis M, Velidakis E, Tzounis L, Mountakis N, Kechagias J, Grammatikos S (2021) Optimization of the filler concentration on fused filament fabrication 3d printed polypropylene with titanium dioxide nanocomposites. Materials 14(11). 10.3390/ma14113076 [DOI] [PMC free article] [PubMed]
- 46.Jiang J, Ma Y (2020) Path planning strategies to optimize accuracy, quality, build time and material use in additive manufacturing: a review. Micromachines 11. 10.3390/MI11070633 [DOI] [PMC free article] [PubMed]
- 47.Jiang J, Hu G, Li X, et al. Analysis and prediction of printable bridge length in fused deposition modelling based on back propagation neural network. Virtual Phys Prototyp. 2019;14:253–266. doi: 10.1080/17452759.2019.1576010. [DOI] [Google Scholar]
- 48.Jiang J, Xiong Y, Zhang Z, Rosen DW. Machine learning integrated design for additive manufacturing. J Intell Manuf. 2022;33:1073–1086. doi: 10.1007/s10845-020-01715-6. [DOI] [Google Scholar]
- 49.Jiang J, Yu C, Xu X, et al. Achieving better connections between deposited lines in additive manufacturing via machine learning. Math Biosci Eng. 2020;17:3382–3394. doi: 10.3934/MBE.2020191. [DOI] [PubMed] [Google Scholar]
- 50.Popescu D, Zapciu A, Amza C, Baciu F, Marinescu R. FDM process parameters influence over the mechanical properties of polymer specimens: a review. Polymer Testing Elsevier Ltd. 2018;69:157–166. doi: 10.1016/j.polymertesting.2018.05.020. [DOI] [Google Scholar]
- 51.Diment LE, Thompson MS, Bergmann JHM (2017) Clinical efficacy and effectiveness of 3D printing: A systematic review. BMJ Open 7(12). 10.1136/bmjopen-2017-016891 [DOI] [PMC free article] [PubMed]
- 52.Kramer DB, Xu S, Sc M, Kesselheim AS (2012) Health law ethics and human rights. Regulation of Medical Devices in the United States and European Union [DOI] [PubMed]
- 53.Morrison RJ, Kashlan KN, Flanangan CL, Wright JK, Green GE, Hollister SJ, Weatherwax KJ. Regulatory considerations in the design and manufacturing of implantable 3D-printed medical devices. Clin Transl Sci. 2015;8(5):594–600. doi: 10.1111/cts.12315. [DOI] [PMC free article] [PubMed] [Google Scholar]
- 54.Benedetti L, Brulé B, Decreamer N, Evans KE, Ghita O (2019) Shrinkage behaviour of semi-crystalline polymers in laser sintering: PEKK and PA12. Materials and Design Elsevier Ltd 181. 10.1016/j.matdes.2019.107906
- 55.Wencke YL, Kutlu Y, Seefeldt M, Esen C, Ostendorf A, Luinstra GA (2021) Additive manufacturing of PA12 carbon nanotube composites with a novel laser polymer deposition process. Journal of Applied Polymer Science John Wiley and Sons Inc 138(19). 10.1002/app.50395
- 56.Espera AH, Valino AD, Palaganas JO, Souza L, Chen Q, Advincula RC (2019) 3D Printing of a robust polyamide-12-carbon black composite via selective laser sintering: thermal and electrical conductivity macromolecular. Materials and Engineering Wiley-VCH Verlag 304(4). 10.1002/mame.201800718
- 57.Vidakis N, Petousis M, Kechagias JD. Parameter effects and process modelling of polyamide 12 3D-printed parts strength and toughness. Mater Manuf Process. 2022;00:1–12. doi: 10.1080/10426914.2022.2030871. [DOI] [Google Scholar]
- 58.Kam M, İpekçi A, Şengül Ö. Investigation of the effect of FDM process parameters on mechanical properties of 3D printed PA12 samples using Taguchi method. J Thermoplast Compos Mater. 2021 doi: 10.1177/08927057211006459. [DOI] [Google Scholar]
- 59.Rahim TNAT, Abdullah AM, Akil HM, Mohamad D, Rajion ZA. The improvement of mechanical and thermal properties of polyamide 12 3D printed parts by fused deposition modelling. Express Polym Lett. 2017;11(12):963–982. doi: 10.3144/expresspolymlett.2017.92. [DOI] [Google Scholar]
- 60.Ferreira I, Machado M, Alves F, Torres Marques A (2019) A review on fibre reinforced composite printing via FFF. Rapid Prototyping Journal Emerald Group Publishing Ltd 8 July
- 61.Laureto J, Tomasi J, King JA, Pearce JM. Thermal properties of 3-D printed polylactic acid-metal composites. Progress in Additive Manufacturing Springer International Publishing. 2017;2(1–2):57–71. doi: 10.1007/s40964-017-0019-x. [DOI] [Google Scholar]
- 62.Campbell TA, Ivanova OS. 3D printing of multifunctional nanocomposites. Nano Today Elsevier Ltd. 2013;8(2):119–120. doi: 10.1016/j.nantod.2012.12.002. [DOI] [Google Scholar]
- 63.Ivanova O, Williams C, Campbell T. Additive manufacturing (AM) and nanotechnology: promises and challenges. Rapid Prototyping Journal. 2013;19(5):353–364. doi: 10.1108/RPJ-12-2011-0127. [DOI] [Google Scholar]
- 64.dos Santos J, de Oliveira RS, de Oliveira TV, Velho MC, Konrad MV, da Silva GS, Deon M, et al. 3D printing and nanotechnology: a multiscale alliance in personalized medicine. Adv Func Mater. 2021;31(16):1–35. [Google Scholar]
- 65.Gázquez MJ, Bolívar JP, Garcia-Tenorio, R, Vaca F (2014) A review of the production cycle of titanium dioxide pigment. Materials Sciences and Applications Scientific Research Publishing Inc 05(07):441–458
- 66.Chen X, Mao SS. Titanium dioxide nanomaterials: synthesis properties modifications and applications. Chem Rev. 2007;107(7):2891–2959. doi: 10.1021/cr0500535. [DOI] [PubMed] [Google Scholar]
- 67.Haider AJ, Jameel ZN, Al-Hussaini IHM. Review on: titanium dioxide applications. Energy Procedia Elsevier BV. 2019;157:17–29. doi: 10.1016/j.egypro.2018.11.159. [DOI] [Google Scholar]
- 68.Kang X, Liu S, Dai Z, He Y, Song X, Tan Z (2019) Titanium dioxide: from engineering to applications. Catalysts 9. 10.3390/catal9020191
- 69.Selvin TP, Kuruvilla J, Sabu T. Mechanical properties of titanium dioxide-filled polystyrene microcomposites. Mater Lett. 2004;58(3–4):281–289. doi: 10.1016/S0167-577X(03)00470-1. [DOI] [Google Scholar]
- 70.Reddy KR, Karthik KV, Prasad SBB, Soni SK, Jeong HM, Raghu AV. Enhanced photocatalytic activity of nanostructured titanium dioxide/polyaniline hybrid photocatalysts. Polyhedron. 2016;120:169–174. doi: 10.1016/j.poly.2016.08.029. [DOI] [Google Scholar]
- 71.Elsaka SE, Hamouda IM, Swain MV. Titanium dioxide nanoparticles addition to a conventional glass-ionomer restorative: influence on physical and antibacterial properties. Journal of Dentistry Elsevier Ltd. 2011;39(9):589–598. doi: 10.1016/j.jdent.2011.05.006. [DOI] [PubMed] [Google Scholar]
- 72.Kechagias JD, Tsiolikas A, Petousis M, Ninikas K, Vidakis N, Tzounis L (2022) A robust methodology for optimizing the topology and the learning parameters of an ANN for accurate predictions of laser-cut edges surface roughness. Simulation Modelling Practice and Theory Elsevier BV 114(May 2021):102414
- 73.Kechagias J, Chaidas D, Vidakis N, Salonitis K, Vaxavanidi NM. Key parameters controlling surface quality and dimensional accuracy: a critical review of FFF process. Mater Manuf Process. 2022;00:1–22. doi: 10.1080/10426914.2022.2032144. [DOI] [Google Scholar]
- 74.Vidakis N, Petousis M, Vaxevanidis N, Kechagias JD. Surface Roughness Investigation of Poly-Jet 3D Printing. Mathematics. 2020;8(10):1758. doi: 10.3390/math8101758. [DOI] [Google Scholar]
- 75.Raffi M, Mehrwan S, Bhatti TM, et al. Investigations into the antibacterial behavior of copper nanoparticles against Escherichia coli. Ann Microbiol. 2010;60:75–80. doi: 10.1007/s13213-010-0015-6. [DOI] [Google Scholar]
Associated Data
This section collects any data citations, data availability statements, or supplementary materials included in this article.
Data Availability Statement
The raw/processed data required to reproduce these findings cannot be shared at this time because of technical or time limitations.


