

Summary
Looking and reaching are controlled by different brain regions and coordinated during natural behaviour1. Understanding how flexible, natural behaviours like coordinated looking-and-reaching are controlled depends on understanding how neurons in different regions of the brain communicate2. Neural coherence in a gamma-frequency (40–90 Hz) band has been implicated in excitatory multiregional communication3. Inhibitory control mechanisms are also required to flexibly control behaviour4, but little is known about how neurons in one region transiently suppress individual neurons in another to support behaviour. How does neuronal firing in a sender-region transiently suppress firing in a receiver-region? Here, we study inhibitory communication during a flexible, natural behaviour, termed gaze-anchoring, in which saccades are transiently inhibited by coordinated reaches. During gaze-anchoring, we find that neurons in the reach region of the posterior parietal cortex can inhibit neuronal firing in the parietal saccade region to suppress eye movements and improve reach accuracy. Suppression is transient, only present around the coordinated reach, and greatest when reach neurons fire spikes with respect to beta-frequency (15–25 Hz) activity, not gamma-frequency activity. Our work provides evidence in the activity of single neurons for a novel mechanism of inhibitory communication in which beta-frequency neural coherence transiently inhibits multiregional communication to flexibly coordinate our natural behaviour.
The flexible control of behaviour depends on both excitatory and inhibitory mechanisms to route information flow between cortical regions2. Excitatory projection neurons can drive increases in activity in downstream regions by recruiting correlated5 and coherent3,6,7 temporal patterns of neural activity. Inhibitory control mechanisms also guide behaviour in the face of changing goals4. Whether and how increased firing of neurons in one cortical region can improve behavioural performance by suppressing firing in another cortical region remains poorly understood. How does inhibitory communication between neurons in different brain regions flexibly guide behaviour?
In primates, saccadic eye movements are naturally coordinated with arm movements to make accurate reach-and-grasp movements8. Subregions of the posterior parietal cortex are interconnected by excitatory projections across short white matter tracts called U-fibers9,10. Silencing neural firing in the parietal reach region (PRR) alters reaching and not saccades made alone, while silencing firing in the parietal saccade region (the lateral intraparietal area, area LIP) alters saccades but not reaching11,12. Thus, communication between neurons in PRR and neurons in area LIP may support coordinated visual behaviour.
In humans, behavioural inhibition improves reach performance through gaze-anchoring13. Gaze is naturally ‘anchored’ to the target of an ongoing reach and new eye movements are inhibited, extending target foveation in time and improving reach accuracy. Reach-region neurons guiding the reach may inhibit response selection in saccade-region neurons responsible for the upcoming saccade. We therefore tested the activity of individual neurons in the parietal reach (PRR) and saccade (area LIP) regions for evidence of inhibitory communication during gaze-anchoring (Fig 1A).
Figure 1. Coordinated behaviour and multiregional communication.
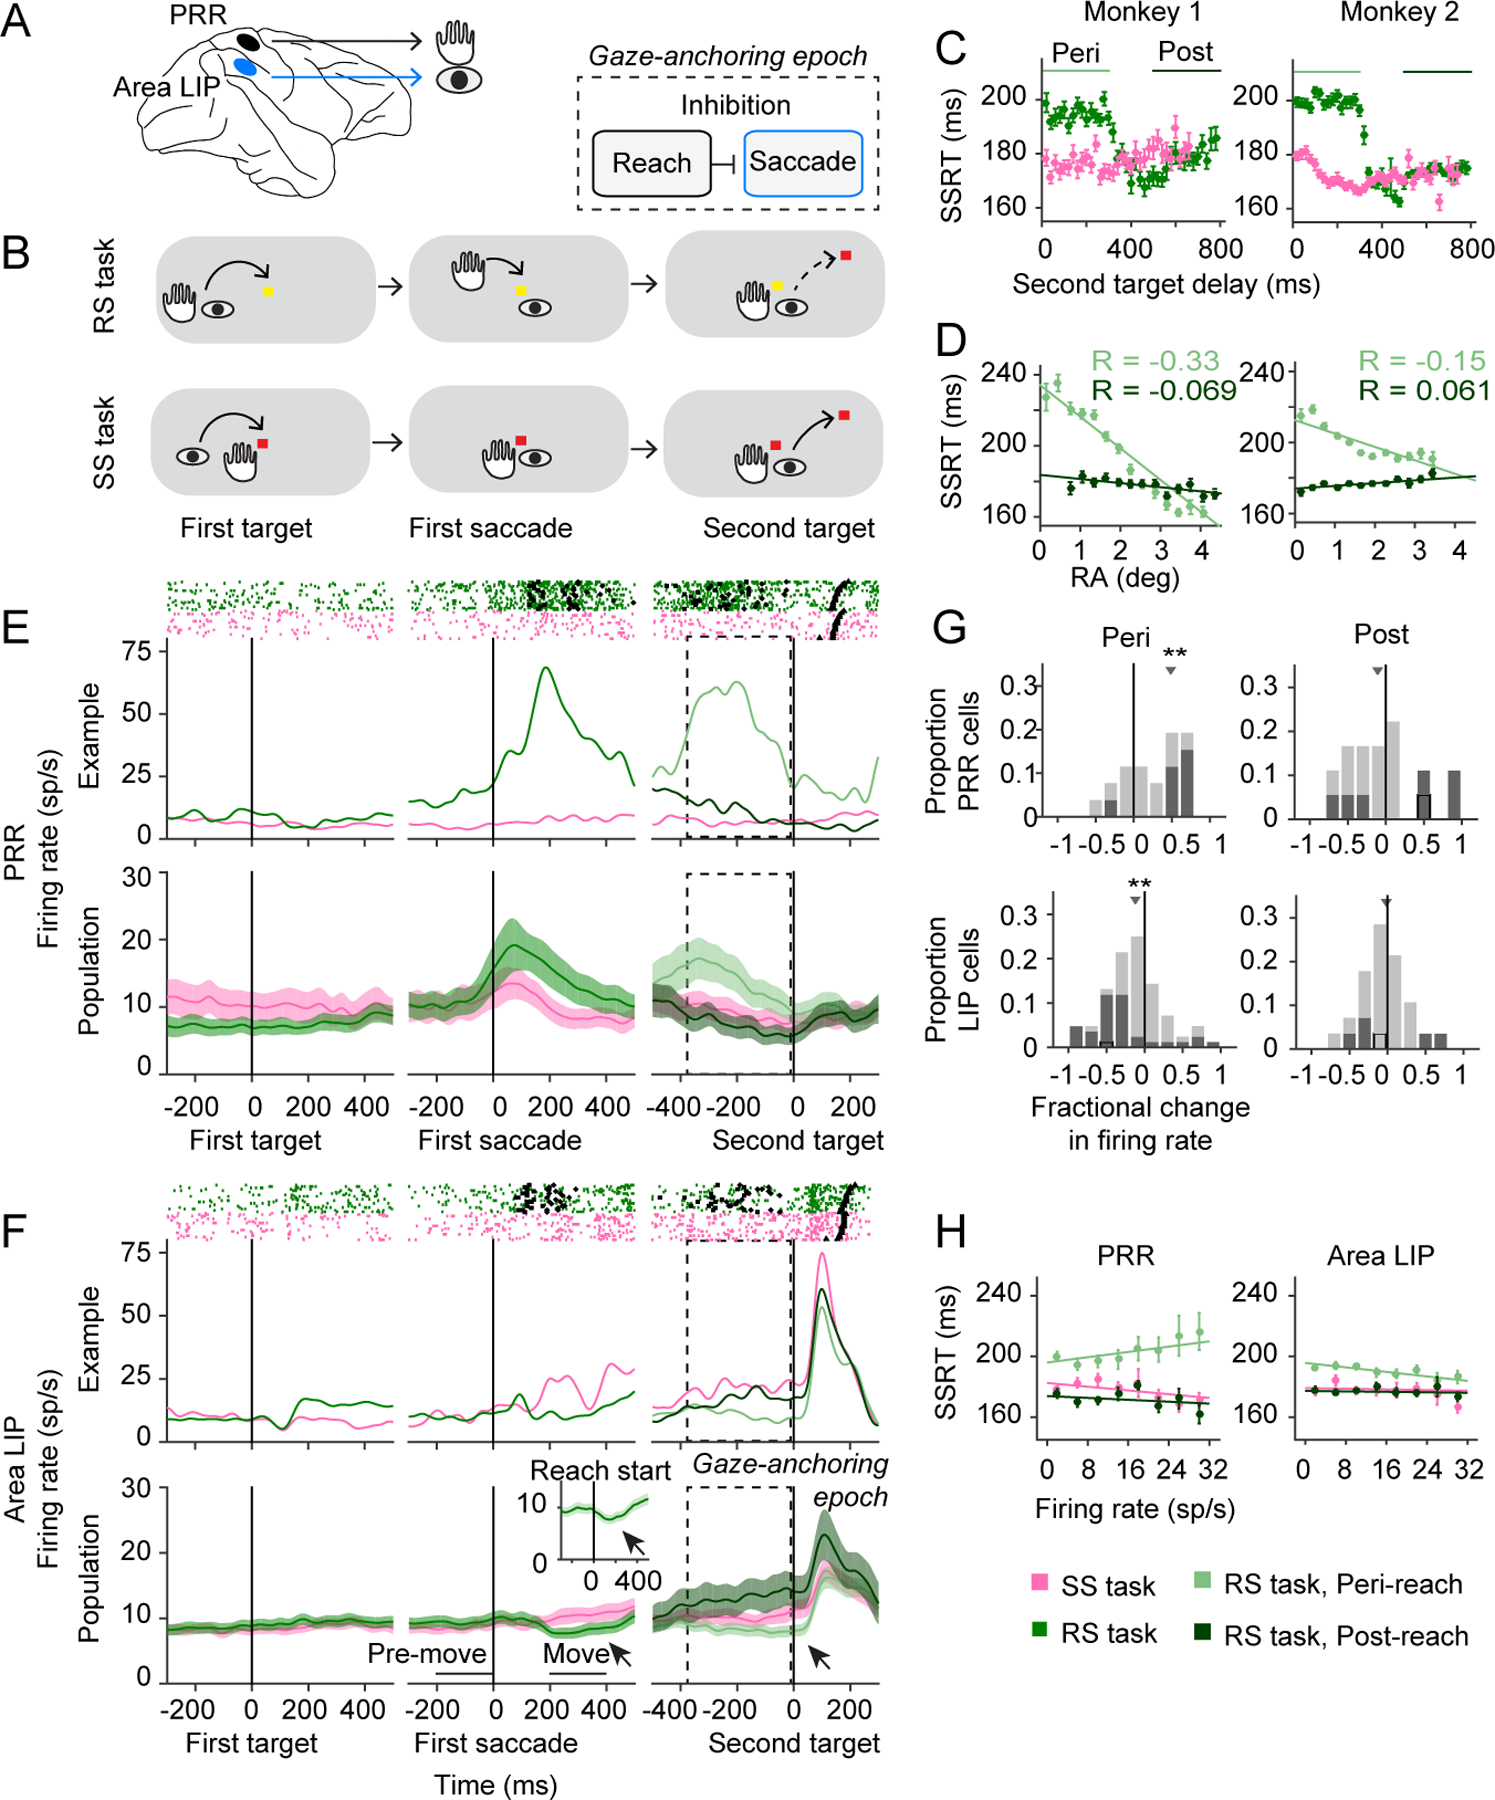
(A) Schematic. (B) RS task and SS task, indicating hand and eye position for task epoch. (C) SSRT against second target delay for RS (green) and SS (pink) tasks. Peri-reach (light green): M1: p=5×10−62, 8140 trials, M2: p= 5×10−210, n=10245 trials. Post-reach (dark green): M1: p=1×10⁻³, n=2872 trials, M2: p=0.54, n=3903 trials, t-test vs SS second target delay matched. (D) SSRT against RA. Peri-reach (light green): M1: R=−0.33, slope=−17.8ms/deg, p=1×10−95, M2: R=−0.15, slope=−7.5ms/deg, p=2×10⁻³³. Post-reach (dark green): M1: R=−0.069, slope=−2.3 ms/deg, p=2×10⁻⁴, M2: R=0.061, slope=1.5 ms/deg, p=6×10⁻⁵. All t-test. R: Pearson correlation. (E/F) PRR/LIP firing rates. Inset: Reach onset aligned. Arrows indicate suppressed LIP firing. Mean Fractional Difference=(RS-SS)/SS (MFD). RS task: move vs pre-move: MFD=−0.18, p=0.01. SS task: MFD=0.01, p=0.10. All sign-rank test. Dashed: gaze-anchoring epoch. Rasters: Reach start (squares), reach stop (diamond), second saccade (triangle). PRR firing did not significantly differ before the first target after controlling for initial eye-hand position (Methods, p=0.87, permutation test). (G) PRR population MFD (Peri-reach: MFD=0.49, p=3.7×10⁻⁴. Post-reach: MFD=−0.17, p=0.24). LIP population MFD (Peri-reach: MFD=−0.11, p=0.001. Post-reach: MFD=−0.04, p=0.51). All sign-rank test. Dark squares, significant (p<0.05). Black outline, example cells (E,F). (H) Firing rates against SSRT: PRR (Peri-reach: Rho=0.11, slope=0.44 ms/(sp·s−1), p=0.001. Post-reach: Rho=− 0.06, p=0.35. Saccade: Rho=−0.12, slope=−0.31 ms/(sp·s−1), p=0.004); LIP (Peri-reach: Rho=− 0.10, slope=−0.37 ms/(sp·s−1), p=7×10⁻⁷. Post-reach: Rho=−0.03, p=0.2. Saccade: Rho=−0.02, p=0.54). All permutation test. Rho: Spearman’s correlation. All error bars and error bands show mean±SEM.
Inhibitory communication modulates gaze
We trained two non-human primates (Macaca mulatta) to perform a reach-saccade (RS) task, that should naturally-elicit gaze-anchoring, and a saccade-only (SS) task, which should not elicit gaze-anchoring (Fig 1B, Extended Data Fig 1A, Methods). In the RS task, each monkey made a reach and saccade to a target, followed by a second saccade to a newly-presented target. We presented the second saccade target at one of two spatial locations unexpectedly following reach completion (second target delay, 0–800 ms). In the SS task, each monkey made two saccades and no reach.
Both monkeys exhibited gaze-anchoring naturally during the RS task (Methods). Second saccade reaction times (SSRT) were significantly longer on RS peri-reach trials, when the second target appeared within 300 ms of the reach, compared with RS post-reach trials, when the second target appeared 500–800 ms after reach completion (Fig 1C). On peri-reach trials, reaching was significantly more accurate on trials with longer SSRTs while, on post-reach trials, the association between reach accuracy and SSRT was inconsistent (Fig 1D). SSRT covaried with reach RT in the RS task, but not with the saccade RT in the SS task (Extended Data Fig 1B-G). Thus, gaze-anchoring occurs briefly during the RS peri-reach trials, and involves changes in reach and saccade movement performance.
Reaching inhibits saccade firing
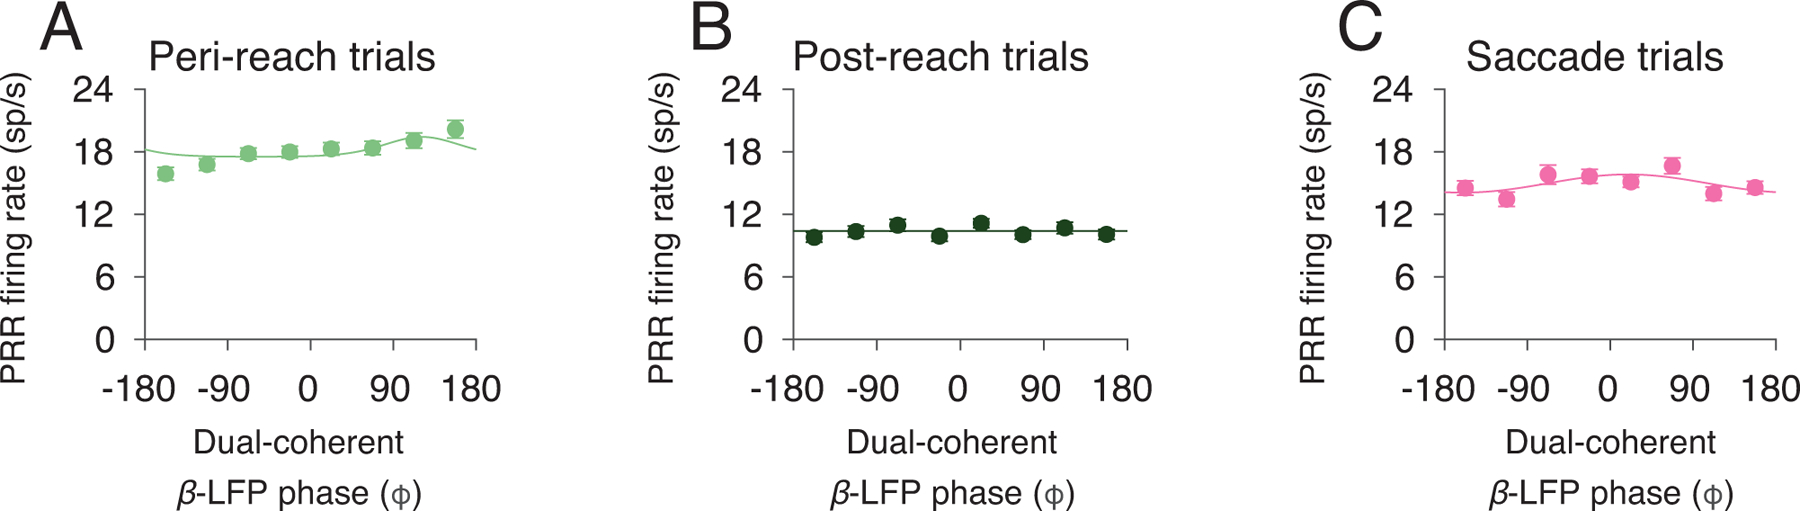
To obtain evidence of inhibitory communication during gaze-anchoring, we recorded from 120 spatially-selective neurons in the parietal reach and saccade systems (PRR: 34 neurons. Area LIP: 86 neurons; Methods, Extended Data Fig 2). For each task, we presented the first movement target in the response field of a PRR neuron and the second target in the response field of an area LIP neuron. Consistent with a role in guiding the reach14, PRR neurons fired more during coordinated reaches than during saccades made alone (Fig 1E). Consistent with a role in guiding saccades15, area LIP neurons fired more when the second target was in the response field (Fig 1F).
During the gaze-anchoring epoch, area LIP activity was transiently suppressed during RS trials around the reach, starting at reach onset (Fig 1F and inset). Comparing RS and SS trials, PRR neurons fired significantly more and area LIP neurons fired significantly less during gaze-anchoring, but not 500 ms after the reach (Fig 1G). Therefore, PRR neuron firing may drive inhibition and suppress firing in area LIP during gaze-anchoring.
Changes in area LIP and PRR firing rate reflected gaze-anchoring. PRR neurons fired more and area LIP neurons fired less on peri-reach trials with longer SSRTs not shorter SSRTs (Fig 1H). This inverse relationship was transient and task-dependent: neural gaze-anchoring effects were specific to coordinated movements and were not observed at other times. Firing of a subset of simultaneously-recorded area LIP and PRR neurons was negatively correlated during gaze anchoring trials, but positively correlated during other trials (32 pairs, peri-reach: R=−0.07, p=0.02; post-reach: R=0.2, p=5×10⁻⁶; saccade: R=0.08, p=0.01; Spearman’s correlation).
Beta coherence modulates gaze-anchoring
Correlations in firing rate suggest that gaze anchoring is due to neurons in PRR communicating with neurons in area LIP. If so, behavioural performance should vary with reach-to-saccade communication. We therefore analyzed how performance varies with neural activity on peri-reach trials compared to post-reach and saccade trials.
How might one region exert a transient, task-dependent inhibitory/suppressive effect on another? Neuronal coherence is the correlated timing of neural activity across groups of neurons measured by the phase of local field potential (LFP) activity in specific frequency bands16. Since the strength of neural interactions depends on the timing of neuronal activity with respect to neural excitability, multiregional communication may depend on the phase of neural coherence. Neural activity in the beta-frequency band reflects suppression of movement initiation14,17,18, motor processing19,20, top-down feedback21,22 and multiregional integration23–25 and may support inhibitory communication. If so, inhibition between PRR and area LIP, and behavioural performance, should covary with spike timing with respect to the phase of beta-frequency activity in PRR and area LIP.
We conducted 151 experimental sessions with PRR spiking recorded simultaneously with LFPs in PRR and area LIP (Fig 2A). In the RS task, LFP activity in area LIP and PRR synchronized around the reach, with PRR spiking tending to occur at a particular phase of beta-frequency LFP activity in both areas (Fig 2B). On SS trials, PRR spiking tended to occur at a different phase of beta-frequency LFP activity in both areas (Fig 2C, Extended Data Fig 3).
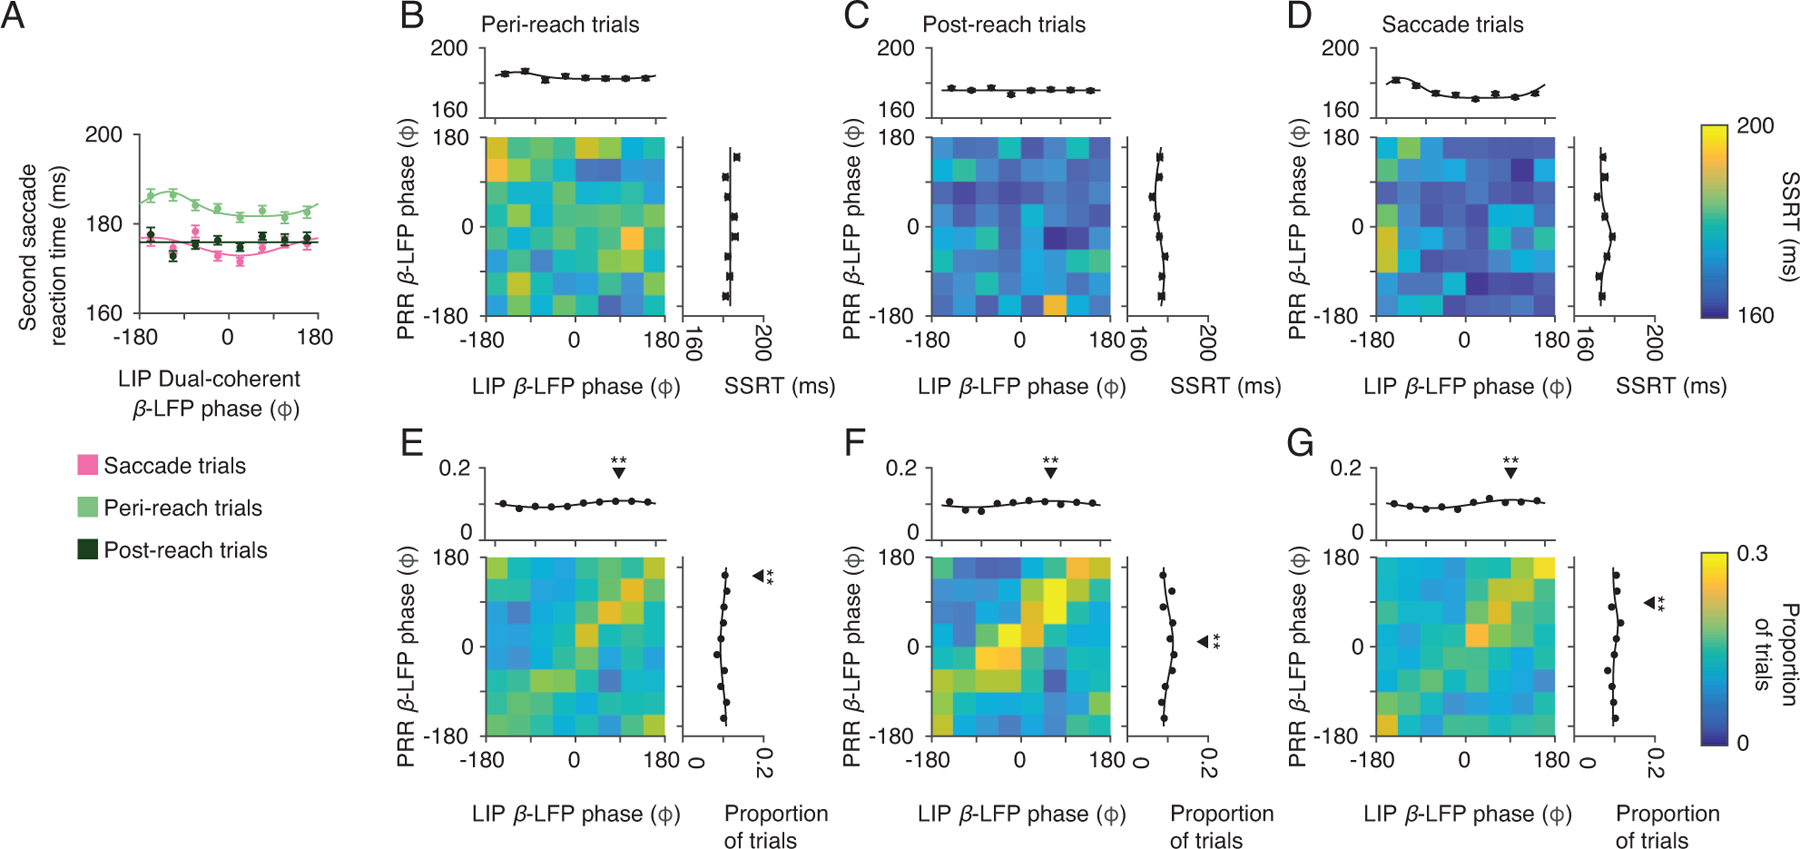
Figure 2. Behavioural performance and coherent neural dynamics.
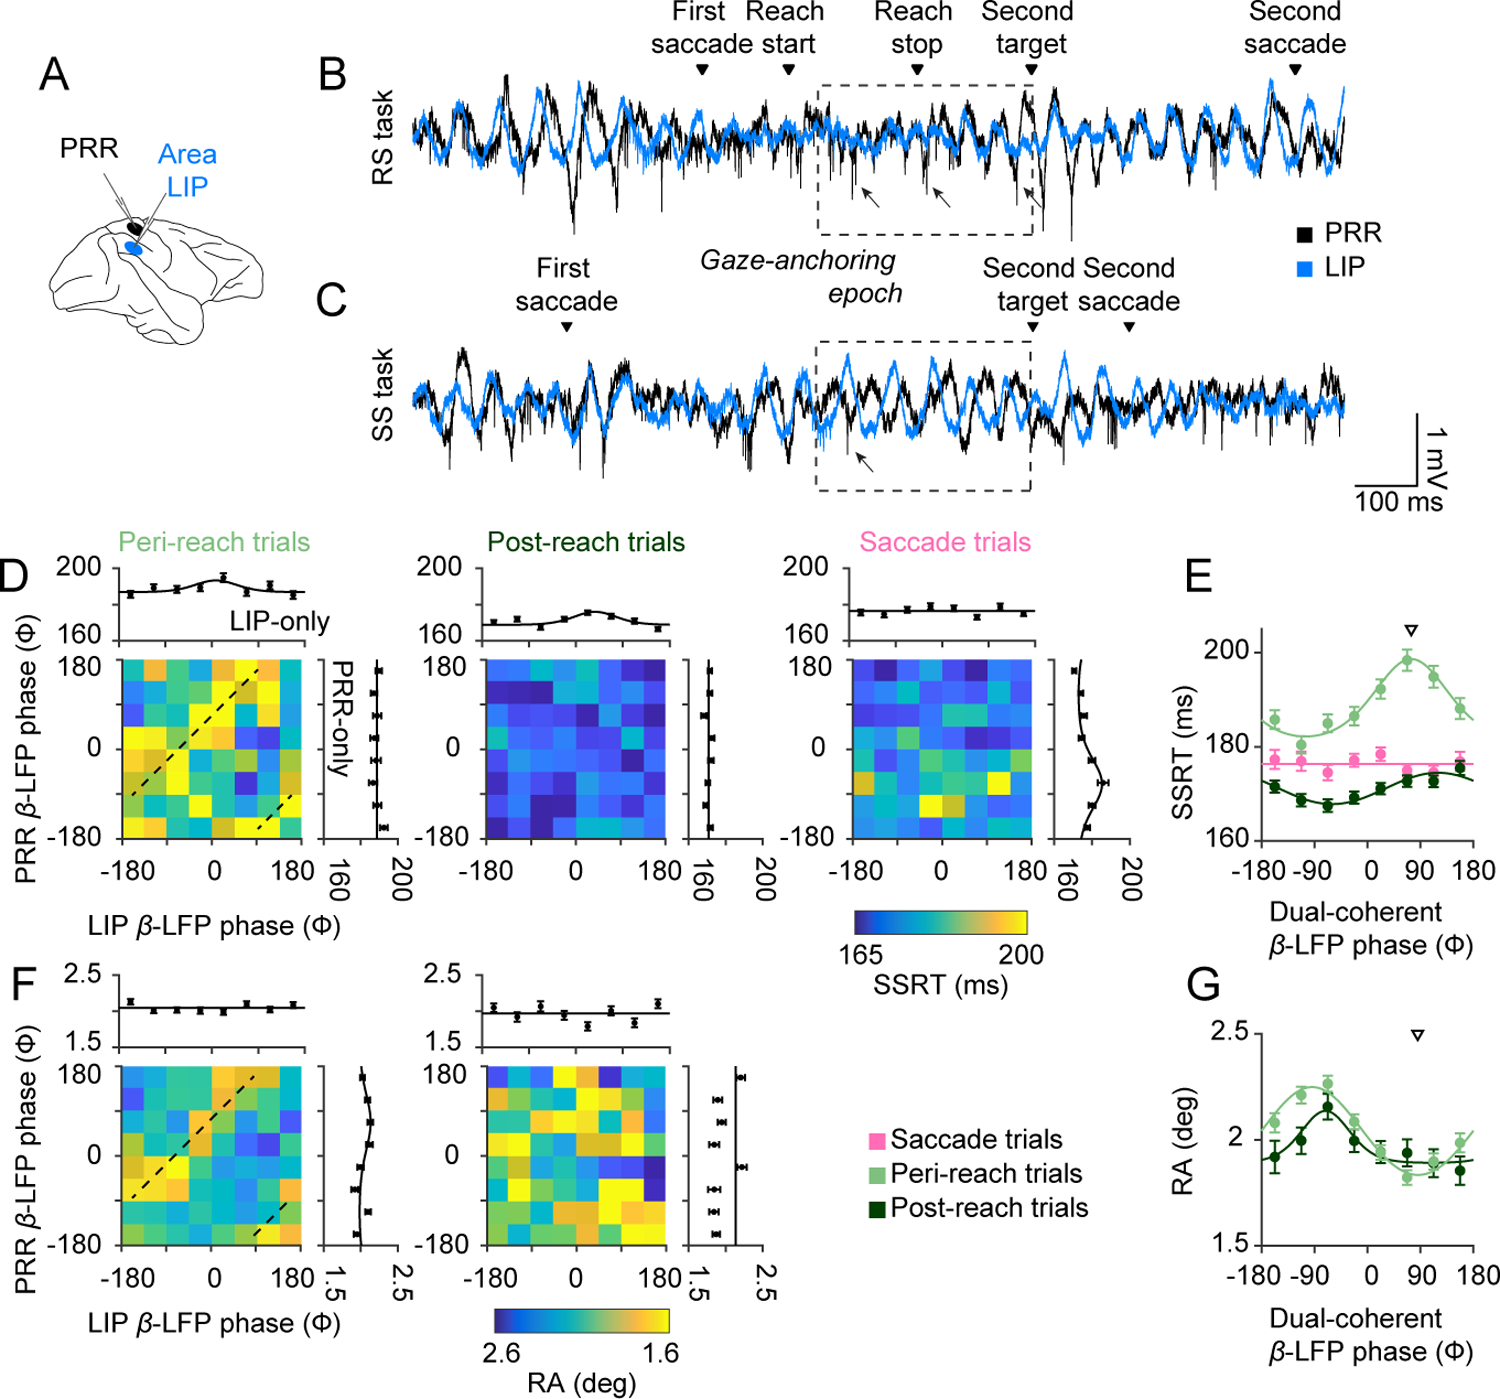
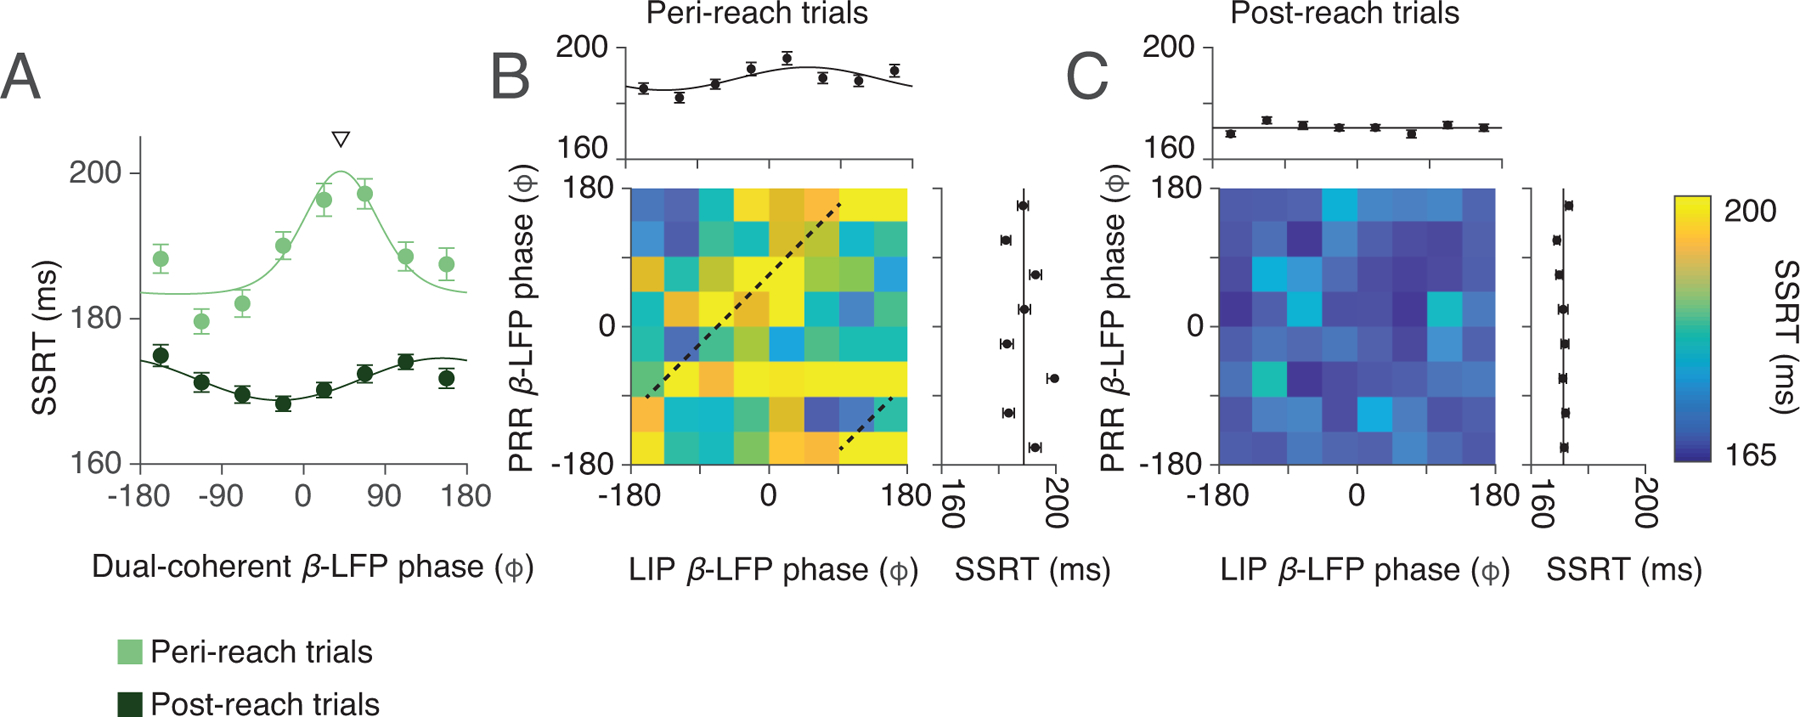
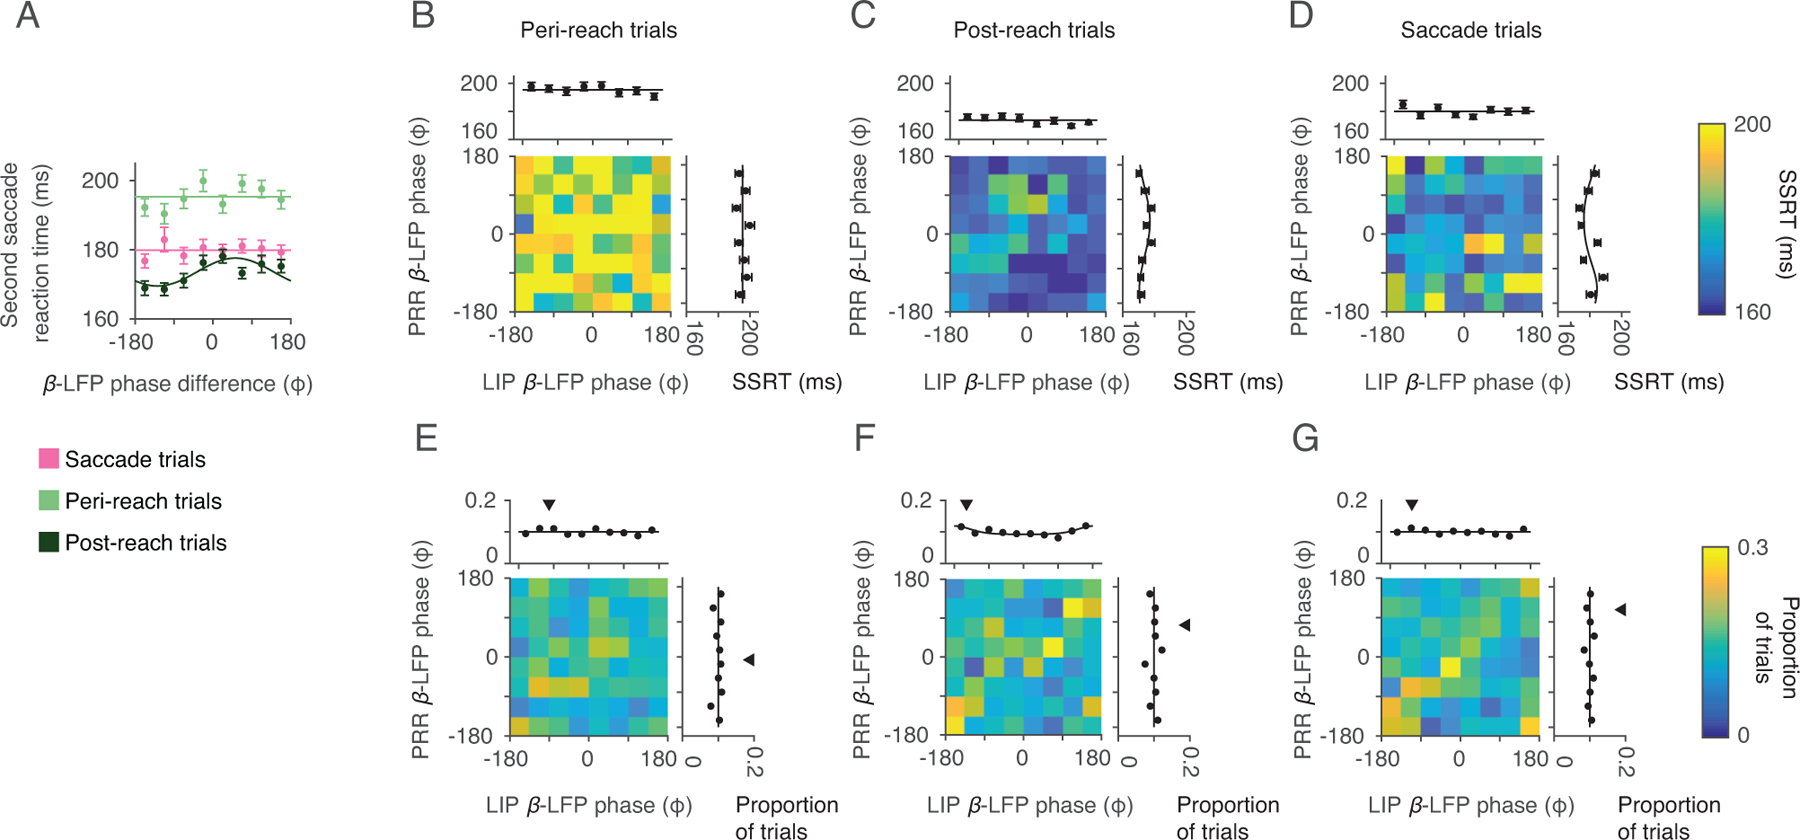
(A) Schematic showing neural recordings. (B) Voltage traces of RS task and (C) SS task example trials (PRR: black, LIP: blue). Dashed box indicates gaze-anchoring epoch. Arrows indicate example spikes occurring at representative phases. (D) Peri-reach (n=4814), post-reach (n=2116), and saccade (n=3583) trials showing mean β-LFP phase in each cortical area (PRR β-LFP phase, y axis; LIP β-LFP phase × axis) and corresponding SSRT (colorscale). Marginals show SSRT against β-LFP phase in each area alone (SSRT vs PRR-only: peri-reach: p=0.09. post-reach: p=0.40. saccade: p=3.7×10⁻¹². SSRT vs LIP-only: peri-reach: p=0.025. post-reach: p=6.4×10⁻⁶. saccade: p=0.12). (E) SSRT against dual-coherent β-LFP phase for each trial type (Peri-reach (light green): p=2.2×10⁻¹⁶; Post-reach (dark green); p=1.40×10⁻⁵, preferred phase = 120°. Saccade (pink): p=0.5). Solid lines present SSRT fitted by von Mises function. (F) Peri-reach and post-reach trials showing mean β-LFP phase in each cortical area (PRR β-LFP phase, y axis; LIP β-LFP phase × axis) and corresponding RA (colorscale). Marginals show RA against mean PRR-spike β-LFP phase in each area alone. (PRR-only: peri-reach: p=6.4×10⁻³, variation in RA: 0.15°, 7% fractional change (ΔRA/mean(RA). post-reach: p = 1. LIP-only: peri-reach: p=0.36; post-reach: p=0.2). (G) RA against dual-coherent β-LFP phase for each trial type (Peri-reach: variation in RA = 0.45°, 22% fractional change, p=0; Post-reach: variation in RA=0.25°, 12% fractional change, p=4.2×10⁻³) conventions as in (E). Downward triangles present mean of the von-Mises fit dual-coherent β-LFP phase on peri-reach trials at maximum SSRT (E) or minimum RA (G). Dashed lines (D,F) indicate dual-coherent phase shown by the downward triangles in (E,G). All p-values report likelihood-ratio test. All error bars show mean±SEM.
We next investigated whether beta-frequency spike-LFP phase predicted changes in coordinated behaviour (Methods). PRR-only phase did not predict SSRT on peri-reach or post-reach trials but did predict SSRT on saccade trials, while LIP-only phase was inconsistent with gaze-anchoring and most strongly predicted SSRT on post-reach trials (Fig 2D). These data show that PRR spiking with respect to single-region phase does not predict variations in performance at times when reach-to-saccade communication is expected, during peri-reach trials.
Recent work links multiregional communication to spike timing with respect to the phase of beta-frequency coherence in both regions, termed dual-coherence26. Multiregional communication may therefore occur when beta-frequency coherence has a consistent phase difference across the reach-and-saccade system and may be suppressed at other times.
We computed dual-coherent phase for each trial (Methods). Variations in performance with dual-coherent phase were consistent with gaze-anchoring. On peri-reach trials, SSRT significantly varied with dual-coherent phase and was slowest on trials with a preferred dual-coherent phase of ~75° (Fig 2E, Methods). SSRT did not significantly vary with dual-coherent phase on saccade trials (Fig 2E). SSRT on peri-reach trials with non-preferred dual-coherent phases did not increase compared with saccade trials (SSRT peri-reach vs saccade trials at - 112°, p=0.25, permutation test). SSRT significantly varied with dual-coherent phase on post-reach trials (Fig 2E), but post-reach SSRT slowing (6 ms) was smaller than peri-reach SSRT slowing (17 ms).
These data demonstrate that the relationship between SSRT slowing and dual-coherent PRR spike timing is consistent with reach-to-saccade communication on reach trials and not saccade trials.
We analyzed whether PRR spike timing also predicted reach accuracy (RA). PRR spiking with LIP-only phase did not predict improved RA while PRR spiking with PRR-only phase predicted RA on peri-reach but not post-reach trials, albeit weakly (Fig 2F). In contrast, RA significantly and strongly depended on dual-coherent phase, (Fig 2G). On post-reach trials, RA also significantly depended on dual-coherent phase albeit more weakly than on peri-reach trials (Fig 2G).
Variations of RA and SSRT with dual-coherent phase were consistent with a common underlying mechanism of communication. On peri-reach trials, reaches were most accurate and SSRT slowest at a similar dual-coherent phase (RA: 91°. SSRT: 75°). Variations with single-region phase were not consistent with a common underlying mechanism.
Parametrically-fitting SSRT and RA to phase trial-by-trial showed dual-coherent phase had greater likelihood and less generalization error compared to single-region phase (Methods, Extended Data Fig 4). Non-parametric analysis of SSRT, RA and phase trial-by-trial provided convergent evidence consistent with the absence of reach-to-saccade communication on saccade trials and more communication on peri-reach than post-reach trials.
Dual-coherence on peri-reach trials may be driven by the evoked LFP phase change at reach onset. However, reach-onset-aligned dual-coherence predicted SSRT slowing even after explicitly subtracting the evoked LFP response (Extended Data Fig 5).
Additional analyses emphasized PRR-spike timing with respect to beta-frequency dual-coherent phase. Variations in the phase of beta-frequency LFP phase alone did not predict gaze-anchoring-related SSRT slowing (Extended Data Fig 6). Beta-frequency coherence has a period of 50 ms, which implies spike timing changes every quarter-cycle, e.g. 12.5 ms. We therefore jittered PRR spike times on each trial (Methods). PRR-spike dual-coherent phase on peri-reach trials predicted SSRT only when jittering by less than 10 ms (Extended Data Fig 7).
Effects were specific to dual coherence in the beta frequency (20 Hz) not the gamma frequency (40 Hz). Gamma-frequency dual-coherent phase had a small but significant effect on SSRT on peri-reach trials that was significantly smaller than for beta-frequency dual-coherent phase (Extended Data Fig 8).
Since area LIP spike rate predicted SSRT slowing, we asked whether area LIP spike timing with respect to dual-coherent phase also predicted SSRT slowing. While LIP-spike beta-frequency dual-coherent phase had a small but significant correlation with SSRT on peri-reach trials, SSRT varied with PRR-spike dual-coherent phase significantly more than with LIP-spike dual-coherent phase (Extended Data Fig 9).
Consequently, PRR spike timing may drive behavioural inhibition during gaze-anchoring to slow SSRT and improve reach accuracy with respect to beta-frequency dual-coherent phase compared with single-region beta-frequency phase, LFP coherence phase, gamma-frequency coherence, and LIP spike timing.
A reach-to-saccade communication channel
Since spiking in PRR does not generally guide saccades, PRR spiking may suppress saccades depending on modulation of a reach-to-saccade communication channel. According to this channel modulation hypothesis, when the channel opens, SSRT lengthens because PRR firing is more effective at suppressing saccades. When the channel closes, SSRT shortens because PRR firing is less effective at suppressing saccades. We analyzed PRR spiking and SSRT for evidence of state-dependent reach-to-saccade communication.
PRR firing covaried with gaze-anchoring-related increases in SSRT on trials with preferred dual-coherent phase, not when dual-coherent phase was non-preferred (Fig 3A), and not during post-reach or saccade trials (Fig 3B,C). Thus, SSRT may depend on a state-dependent gain in which input drive from PRR is gain-modulated by channel state, e.g. dual-coherent phase. During certain modulation states, large changes in PRR activity are compressed with small gain and the channel is effectively closed. During other modulation states, the same changes in PRR activity can lead to changes with larger gain and the channel is effectively open.
Figure 3. State-dependent inhibitory communication.
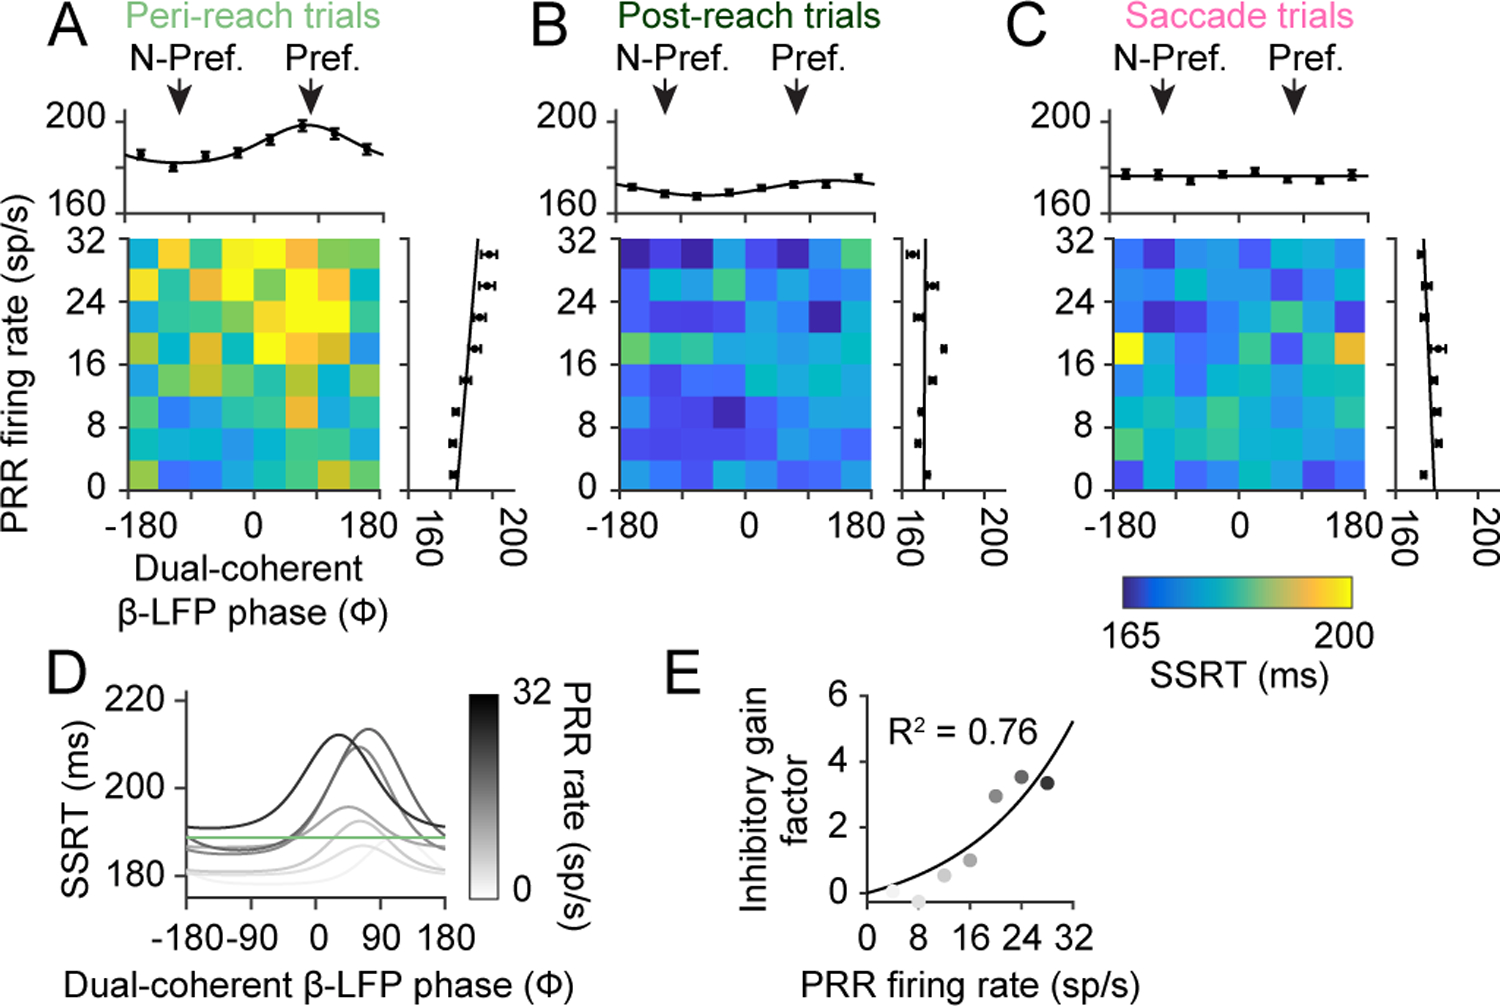
(A) Peri-reach, (B) post-reach, and (C) saccade trials showing PRR firing rate and dual-coherent β-LFP phase and their relationship to SSRT (colorscale). Marginals show SSRT against PRR firing rate or dual-coherent β-LFP phase alone. Peri-reach, preferred: R=0.15, p=9×10⁻⁴ non-preferred: R= 0.01, p = 0.82. Post-reach, preferred R=0.01, p=0.85. Saccade, preferred: R=−0.02, p=0.81. (D) Peri-reach modulation state functions fit to PRR firing rates bins. Green line indicates mean SSRT. (E) Gain factor function fit to the scaled peaks of the modulation state functions presented in (D) for each PRR firing rate bin. Adjusted R2 = 0.76. R: Pearson correlation. All error bars show mean±SEM.
To better understand channel gain and modulation, we divided trials based on the level of PRR firing and fit SSRT with dual-coherent phase (Fig 3D). This analysis revealed a gain mechanism. As PRR firing rate increased, SSRT slowed more on trials when the channel was more open. The gain factor revealed a non-linear slowing of SSRT with PRR activity (Fig 3E). State-dependent non-linear gain underlies how the channel can be more open or closed.
PRR neurons fired the same number of spikes across trials independent of dual-coherent phase during gaze-anchoring (Extended Data Fig 10). This suggests that PRR firing rate is not modulated by channel state and is consistent with the role of a sender in this circuit.
Channel modulation predicts suppression
The channel modulation model explains how gaze-anchoring is controlled by reach-to-saccade communication according to PRR firing, dual-coherent phase and SSRT. The model also makes testable predictions about how the saccade system in general, and area LIP firing in particular, should depend on PRR firing and dual-coherent phase. Figure 4A illustrates the model and predictions. According to the model, PRR-sender activity acts as input to the communication channel. The channel transforms the PRR input to suppress activity in area LIP from the pre-move epoch to the move epoch, and saccade behaviour, according to two dissociable components: a gain function models the inhibitory gain for the PRR firing on that trial, and a modulation state function models the state of the dual-coherent phase on that trial (Methods).
Figure 4. Channel modulation predicts LIP firing rates.
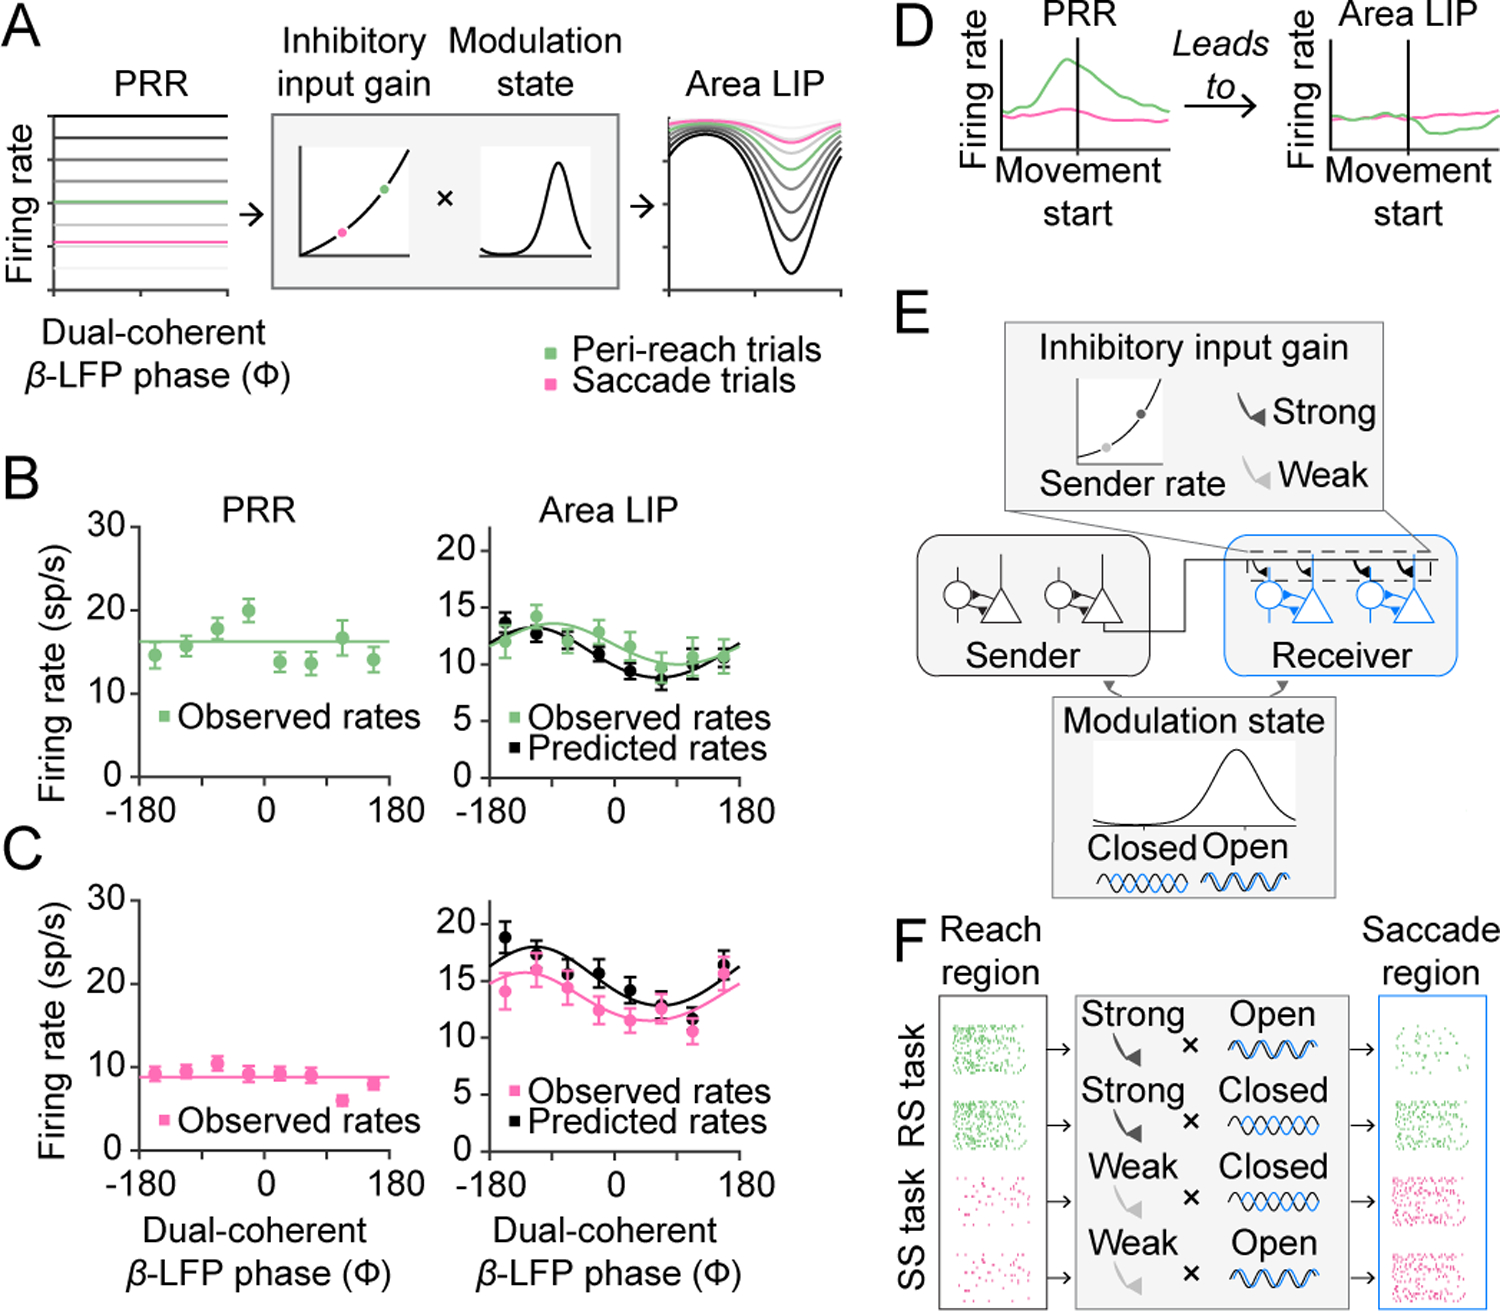
(A) Channel modulation model takes inputs as the PRR firing rate and dual-coherent β-LFP phase. The PRR rate determines the input gain and the dual-coherent β-LFP phase determines the modulate state. The product of these two functions makes a prediction about the LIP firing rate. (B) Simultaneously observed PRR and LIP firing rates on peri-reach trials (n=1188, light green) and predicted LIP firing rates from the model (black) against dual-coherent β-LFP phase. The channel-modulation model had the lowest mean squared error: channel-modulation model = 175; gain-only=177; modulation-only = 185; regression = 247. (C) Simultaneously observed PRR and LIP firing rates on saccade trials (n=942, pink) and predicted LIP firing rates from the model (black) against dual-coherent β-LFP phase. The channel modulation model had the lowest mean squared error: channel-modulation model = 137; gain only = 138; modulation-only = 285; regression = 232. (D) Schematic showing activity in PRR leads to suppressed activity in area LIP. (E) This inhibition is predicted by the channel modulation model which consists of an input gain function which ranges from weak to strong and a modulation state function which ranges between open and closed. (F) High sender activity during the RS task may lead to strong inhibitory input, which on ‘open’ state trials leads to suppression in the saccade area. Whereas low reach activity during the SS task means inhibitory input gain is weak and does not drive suppression regardless of modulation state. All error bars show mean±SEM.
We model and fit the input gain and the modulation state using saccade behaviour without directly observing neural activity in the saccade system. Input gain and modulation state are observed and fit using PRR firing and dual-coherent phase from Fig 3. Moreover, since in the model area LIP reflects the output of the communication channel that guides saccade behavior, the model predicts area LIP activity. Area LIP firing should be suppressed from the move epoch during the RS task but not the SS task. The suppression should follow the strength of PRR firing, which determines the gain, and the dual-coherent phase, which determines the modulation state. The model never observes area LIP activity during the move epoch that reveals gaze-anchoring (Methods).
To test the model, we analyzed simultaneously-recorded firing of PRR neurons, LIP neurons, SSRT and dual-coherent phase (32 spatially-selective PRR-LIP neuron pairs; 88 spike-spike-LFP-LFP sessions; Methods). We measured PRR firing rates and dual-coherent phase and used the model to predict simultaneously-recorded LIP firing on each trial. Although PRR firing did not vary with dual-coherent phase, in the experimental data, area LIP firing significantly covaried with dual-coherent phase (Fig 4B, green) and was maximally suppressed at the same preferred phase angle as the SSRT variations with dual-coherent phase (minimum rate at 92°, von Mises fit). These features were predicted by the model from the observed PRR firing and dual-coherent phase (Fig 4B, black).
We evaluated the contributions of the input gain, modulation state and their combination using reduced models (Methods). The channel-modulation model best predicted the observed area LIP firing rates during the RS task. Removing the gain term degraded the prediction more than removing the modulation term. A regression fit using simultaneous recordings of PRR and area LIP neuron firing performed worse. At lower PPR firing rates, as in the SS task, the model predicted weak modulation of LIP firing rates (Fig 4A). Area LIP firing rates in the SS task were also predicted from PRR firing and dual-coherent phase on each trial (Fig 4C). The modeling results suggest that PRR firing can influence area LIP firing during gaze-anchoring to coordinate looking and reaching.
Discussion
Here, we investigate the mechanisms of inhibitory communication during eye-hand coordination in the activity of individual neurons27,28. Behavioral task design allowed us to decompose a naturally-expressed behaviour, gaze-anchoring, into components to establish that multiregional communication features dissociable gain and modulation components. Gaze-anchoring ensured that communication went from the reach system to the saccade system. Area LIP activity related to the second saccade could not be responsible for signals in PRR that improve reach accuracy because we presented the second saccade target after the reach and we placed the two saccade targets such that area LIP neural response fields did not spatially overlap. Since gaze-anchoring is naturally-expressed, confounding influences due to training are also relatively absent.
Our results suggest that beta-frequency neural coherence modulates how much reach-related firing suppresses saccade-related firing (Fig 4E,F). When reach activity is high, input gain is strong and the saccade region is more or less suppressed depending on modulation state. When reach activity is low, input gain is weak and the saccade region does not depend on modulation state (Fig 4G).
We show that inhibitory communication involves beta coherence and not gamma coherence29. Slower saccades and accurate reaches occur with relative phase of ~75°. Since beta-frequency, 20 Hz, activity has a period of 50 ms, 75° corresponds to a ~10 ms time difference and is consistent with a time-delay due to the latency for presynaptic PRR spike propagation across U-fibers to area LIP, as well as post-synaptic LIP hyperpolarization due to inhibitory GABA synapses. Importantly, the result dissociates the excitability of spiking in a given brain region from behavioral effects of spiking across multiple brain regions. Since PRR spikes tend to occur for a specific combination of beta-frequency phases in PRR and LIP, beta-frequency phase may reflect PRR excitability (Extended Data Fig 3). However, since the impact of PRR spikes to slow saccades for accurate reaching varies with the relative phase and not a specific combination of phases (Fig 2), multiregional communication depends on a time-delay. The impact of PRR spiking on LIP is greatest when PRR beta differs from LIP beta with a ~10 ms time-delay.
Previous work also links beta coherence to GABAergic activity experimentally30–33 and through modelling30. Our results suggest that beta coherence may specifically engage feedforward inhibition by suppressing synaptic influences from PRR on area LIP across an inhibitory feedforward pathway34. Note that our results do not imply that LFP activity exerts causal influences on brain function. Interacting populations of neurons may instead exert causal influences that are measured by relative LFP phase.
Our work constrains theoretical explanations for how multiregional neural population dynamics exert causal effects on behavior. We show that the mechanism of modulation depends on spike timing at 5–10 ms time-scales. Neural population dynamics at slower 50–100 ms time-scales may explain the gain component but not the modulation component. Therefore, relatively fast firing dynamics are needed in order to explain the mechanisms of behaviorally-relevant communication.
Inhibitory control mechanisms have been implicated in flexible, coordinated behaviour17,35,36 , visual attention25,37 and dual-task performance38. We show that an increase in the reach-related firing of individual neurons in PRR is associated with net suppression of firing by individual neurons in area LIP and the slowed initiation of saccades to visual targets presented unexpectedly at different spatial locations. Net suppression and slowed saccade initiation is consistent with suppressed attentional selection throughout area LIP. Consequently, beta-frequency modulation may allow the reach system to transiently suppress attentional selection in the saccade system. Beta-frequency multiregional communication may reflect a general mechanism of inhibitory cognitive control necessary for flexible behavior.
Methods
Experimental Preparation
Two male rhesus monkeys (Macaca mulatta) participated in the experiments (Monkey 1, 9.5 kg and Monkey 2, 6.5 kg). Each animal was first implanted with an MRI-compatible head cap under general anesthesia. A structural MRI was obtained with 0.5 mm isotropic voxels and used to guide the placement of a recording chamber over the posterior parietal cortex of the hemisphere contralateral to the reaching arm (Monkey 1: right reaching arm and left hemisphere; Monkey 2: left reaching arm and right hemisphere) in a second surgical procedure. Chamber placement and electrode recording sites were registered to the structural MRI to within 1 mm (BrainSight, Rogue Research). The structural MRIs were also used to estimate recording locations for area LIP and PRR (see Extended Data Fig 2). All surgical and animal care procedures were done in accordance with National Institute of Health guidelines and were approved by the New York University Animal Care and Use Committee.
Behavioural experiments
Experimental hardware and software:
Eye position was monitored with a video-based eye tracker (I-Scan). Visual stimuli were generated using an array of tristate light-emitting diodes (LEDs, Kingbright, USA) situated directly behind a touch screen (ELO Touchsystems). The LEDs formed a grid with points spaced at 10° intervals. The use of LEDs to present visual stimuli allowed for precise temporal control of stimulus onset and offset. LEDs also ensured that there was no source of background illumination that could influence reach accuracy. Reach accuracy was measured by calculating the Euclidean distance between the target LED and the position of the hand on the touch screen. Trials for which the hand position at reach completion was more than 5° from the target were excluded from further analysis. The visual stimuli were controlled via custom LabVIEW (v8.5, National Instruments) software executed on a real-time embedded system (NI PXI-8184, National Instruments).
Experimental design:
Each monkey first performed a center-out saccade task to map the spatial saccade response fields of neurons. On a subset of sessions, each monkey also performed a center-out reach-and-saccade task to map spatial reach response fields of neurons. Each monkey then performed the reach-and-saccade double-step task, RS trials, or the saccade-saccade double-step task, SS trials, to study gaze-anchoring in a manner that was consistent with natural behaviour. On a subset of catch trials (percent of trials: Monkey 1: 15%, [13–18%], Monkey 2: 17%, [15–23%], median, interquartile range), subjects performed only the first step of the double-step tasks with no second target to suppress anticipation. All RS, SS and catch trial conditions were randomly interleaved.
Center-out tasks:
At the start of each trial, ocular fixation and manual touch were instructed by a green target and a red target, placed centrally side-by-side. The green target indicated the start position for the hand touch, and the red target indicated the start position for the eye. The subject fixated while touching the screen for a variable baseline period of 500–800 ms. In the center-out saccade task a red saccade target would appear in the periphery. In the center-out reach-and-saccade task a yellow saccade target would appear in the periphery. There were eight possible target locations in each task. Each monkey then maintained fixation and touch for a variable delay period of 1000–1500 ms. After the delay period, the central fixation target would extinguish, cueing each monkey to saccade to the target location while maintaining hand position at the initial touch position for the center-out saccade task, or reach-and-saccade to the target location for the center-out reach-and-saccade task.
Reach-and-saccade double-step task (RS task):
Initial fixation and touch were again instructed by a red target and a green target, respectively. The initial position was placed 10 degrees to the left (Monkey 1) or right (Monkey 2) of the central target on the horizontal axis, ipsilateral to the recording chamber. Each monkey touched and fixated for a variable baseline of period of 500–800 ms, after which a yellow target would appear at the central location. After a variable delay of 1000–1500 ms, the initial touch and fixation were extinguished cueing a reach and saccade to the yellow target. The second saccade target was presented after the reach was completed after an interval of 10–800 ms. The second saccade target was a red LED cueing a saccade alone, presented after the reach was completed after an interval of 10–800 ms and placed either in the response field of the area LIP neuron under study or at an alternative target location also positioned in the contralateral visual field but outside the response field.
Saccade-saccade double-step task (SS task):
Initial fixation was cued by a red target 10° away horizontally from the central target and the initial touch was cued by a green target at the central target location. The first saccade target also appeared at the central location, cuing the first saccade toward the hand. As a result, the hand-eye position before the second saccade was identical to that during the RS task. After the baseline period, a red target would appear at the central location. After a variable delay of 500–800 ms, the initial fixation target was extinguished cueing a saccade alone to the central target. As in the RS task, the second target was a red LED cueing a saccade alone. The second target was presented 10–1000 ms after the first saccade.
We matched the time interval from the first saccade to presentation of the second saccade target across the SS and RS tasks. Monkeys were not rewarded for making fast or slow eye movements in either task. Overall, visual and oculomotor spatial and temporal contingencies were matched between the two tasks so that the tasks were naturalistic, did not require dedicated training and differed according to whether or not the subject made a reach. In pilot experiments, we also observed that presenting the second saccade target after the first saccade and during the reach resulted in changes in coordinated visual behaviour that altered the timing of the coordinated reach and saccade and led to inconsistent task performance. This was likely due to confusion about the cues, and their interference with ongoing visual processes needed to guide the first movement, such as attention. Since presenting second saccade targets during the reach would require training to ensure consistent task performance, we only studied presentations of the second saccade target after the reach was completed, which both monkeys could perform successfully without the need for additional training.
Behavioural database:
We collected a database of trials from each monkey for each task (Monkey 1: 10,324 RS task, 8,372 SS task; Monkey 2: 12,840 RS task, 8,452 SS task) across 10 task conditions that were randomly interleaved. This allowed us to analyze the relationship between the latency of the second saccade and the variables of the two tasks in sufficient detail to identify and test multiregional communication. Trials in which saccade and reach reaction times, for both steps, were not within a 100–500 ms window were discarded. This ensures that on all trials analyzed, the subject was neither anticipating nor being inattentive to the targets.
SSRT vs second target delay:
We compared second saccade reaction time to second target delay from first saccade (both tasks), second target delay from reach completion, reach reaction time, reach duration, and reach reaction time minus saccade reaction time for the first step (RS task only). For presentation, we graph the independent variable in 10 ms bins (Fig 1C). Each bin needed a minimum of 20 trials to be included in the analysis, although the average number of trials was usually much greater (Monkey 1: RS task, 198±130 mean±SD; [118:195] interdecile range; SS task, 162±29 mean±SD; [75:387] interdecile range; Monkey 2: RS task, 263±178 mean±SD; [29:220] interdecile range; SS task, 158±63 mean±SD, [49:493] interdecile range).
SSRT vs reach accuracy:
We measured the association between the second saccade reaction time and the accuracy of the reach by performing linear regression and reporting the slope, statistical significance and correlation coefficient separately for peri-reach trials and post-reach trials (Fig 1D, Monkey 1: 3,825 Peri-reach, 2,921 Post-reach trials; Monkey 2: 6,635 Peri-reach, 4,329 Post-reach trials).
Neurophysiological experiments
Experimental design:
We performed neuronal recordings during a subset of task conditions used to study behaviour. In the RS task, the second target was either presented 10–300 ms after the reach completion, which we will refer to as peri-reach trials, or 500–800 ms after reach completion, which we will refer to as post-reach trials. In the SS task, the second target was presented 200–1000 ms after the first saccade to temporally match the second target presentation to that in the RS task accounting for the duration of the reach, which we will refer to as saccade trials. On average, the reach was initiated 165±39 ms (Monkey 1, mean±SD; [124:218] interdecile range) or 123±65 ms (Monkey 2, mean±SD; [94:153] interdecile range) after the Go cue with a reach duration of 171±42 ms (Monkey 1, mean±SD, [128:211] interdecile range) or 122±33 ms (Monkey 2, mean±SD, [91:159] interdecile range). We defined the 350 ms time period prior to second target onset as the gaze-anchoring epoch. On peri-reach trials, the gaze-anchoring epoch included activity related to reach execution, reach preparation and the coordinated saccade. On post-reach trials and saccade trials, these processes were weaker or absent during the gaze-anchoring epoch.
Neural recordings were made from area LIP and PRR on the lateral and medial banks of the intraparietal sulcus using multiple-electrode microdrives (Double MT, Alpha Omega; Extended Data Fig 2). Neurons were recorded within 5–8 mm of the cortical surface. Spiking and LFP activity were recorded with glass-coated tungsten electrodes (Alpha Omega) with impedance 0.7–1.4 MΩ measured at 1 kHz (Bak Electronics). Neural signals were amplified (×10,000; TDT Electronics), digitized at 20 kHz with 12 bits/sample (National Instruments), and continuously streamed to disk during the experiment (custom C and Matlab 2019a code). Broadband neural activity was preprocessed to obtain single-unit spike times and LFP activity. All significant differences in firing rates for this study were determined using a random permutation test with 10,000 permutations.
During the experiment, we analyzed the activity of each area LIP neuron recorded in the center-out saccade task to assess spatial selectivity. If the LIP neuron appeared to show spatial selectivity, the double-step tasks were run, including all of the test conditions described above. We placed the second target for the double-step tasks either within the response field for an area LIP neuron being recorded, or at an alternative location in the same visual hemi-field outside the response field. During the experiment, PRR neurons were isolated and recorded regardless of their response properties.
Area LIP neuronal database:
Area LIP neurons were isolated and mapped for spatial selectivity using a visually-guided, center-out, delayed saccade to eight possible target locations, as described above. After the experiment, if the cell showed a significant increase in activity during the delay period of the center-out task relative to baseline period for a given target (p<0.05, permutation test), the cell was determined to be spatially-selective and that target was labeled as being in the cell's preferred direction. Each LIP cell was recorded for a minimum of 10 trials in the preferred direction for each task condition (peri-reach, post-reach and saccade trials). If the LIP cell met these two criteria (spatial selectivity in a center-out task and minimum number of trials), the cell was included in the database. Importantly, there were no inclusion or exclusion criteria for the LIP neurons based on neural responses in either of the double-step tasks.
PRR neuronal database:
After the experiment, we analyzed the activity of each PRR neuron for responses to planning and executing the reach. We only included in the database PRR neurons that contained a significant response during the delay and reach execution periods of the RS task when compared to the baseline epoch of that task. For a minority of PRR neurons, (13/34 neurons) we also confirmed the location of the first movement was in the response field by mapping the response field in the center-out reach-and-saccade task using 4–8 targets . PRR neurons that did not respond to the first movement of the RS task compared to the baseline and PRR neurons with responses to other target locations were excluded from further analysis. Consequently, the first movement of the RS task was in the reach response field of the PRR neurons under study.
Firing rate RS/SS task selectivity:
We estimated peri-stimulus time histograms with a 20 ms smoothing window. We defined a task selectivity index that measured the fractional difference (MFD) in firing rate between the RS and SS task trials ((RS-SS)/SS) during the gaze-anchoring epoch. We tested for significant differences between the RS and SS task trials by comparing the measured task selectivity index with a null distribution of task selectivity indices when randomly permuting the RS and SS task labels on each trial. Results presented in Fig 1G.
Firing rate vs SSRT:
We measured the association between the second saccade reaction time and the firing rate of area LIP and PRR neurons by performing linear regression and reporting the slope, statistical significance and correlation coefficient separately for peri-reach trials, post-reach trials and saccade trials. Results presented in Fig 1H.
LFP phase:
We subtracted the mean LFP response from each trial to suppress the influence of responses evoked by the stimuli and responses. We then band-pass filtered the LFP at 20 Hz to study beta-frequency activity and at 40 Hz to study gamma-frequency activity. Band-pass filtering was performed with multitaper methods (T=200 ms, W=5 Hz39). Due to variability in the timing of the coordinated reach and saccade and the temporal smoothing necessary to resolve band-limited LFP phase, the peri-reach interval and not the post-reach interval potentially includes reach execution, reach preparation and the coordinated saccade.
Dual-coherent LFP phase:
For each trial, we measured the phase of LFP activity at the time of the spiking activity by calculating the spike times within the analysis window and computing the phase of band-pass filtered LFP activity at these times. The mean phase was calculated for each trial by calculating the circular mean across all spikes within the analysis window. We refer to this value as the spike-triggered dual-coherent LFP phase. For spike-LFP-LFP sessions, we calculated the spike-triggered LFP phase for each spike-LFP pair (ϕPRR and ϕLIP) and then the circular distance between the two phases, which we refer to as the dual-coherent phase (ϕDual):
| Equation 1 |
The circular statistics toolbox in Matlab (The Mathworks) was used to perform statistical tests40. Results presented in Fig 2, Extended Data Figs 3, 5-9.
Phase analysis also allowed us to analyze trial-by-trial variations between the neural responses and behavioural effects such as the reaction time for the second saccade and accuracy of the reach, described below.
LFP phase difference and SSRT:
For each trial, we measured the effect of LFP phase alone on SSRT. For each area, we calculated the circular mean of the phase of the LFP across the analysis window. We then calculated the circular distance between the two phases in each area using Equation 1 above. Results presented in Extended Data Fig 6.
Dual-coherent LFP phase vs SSRT - parametric approach:
We modeled the SSRT from peri-reach, post-reach and saccade trials using a von Mises fit in which SSRT varies across trials according to a gamma distribution with constant scale, k, and a rate, θ, that depends on the phase, ϕ, on that trial during the last 350 ms preceding the onset of the second target according to a von Mises function, We defined three different versions of the model each containing the same number of parameters where phase was set by PRR-only phase, LIP-only phase or dual-coherent phase. The gamma scale parameter, k, and the von Mises fit parameters, A, B, k, µ, were estimated using maximum likelihood. The null hypothesis was that SSRT varied across trials according to a gamma distribution with constant scale and rate parameters and did not vary with phase. For each version of the model, the likelihood was maximized using the function mle in Matlab (Matlab 2019a, Mathworks). We fit parameters using a two-step procedure. In step 1, we initialized parameters based on heuristics derived from the SSRT vs phase tuning curve. The offset, A, was initialized at the minimum of the tuning curve. The magnitude, B, was initialized using the range of the tuning curve. The preferred phase, µ, was initialized at the phase with the maximum of the tuning curve. The dispersion, k, was initialized at 0.5 based on visual inspection of the tuning curves. The scale, k, was also initialized at 20 based on visual inspection of the SSRT distributions. When tuning was weaker, the fits based on initializing based on heuristics became trapped in local minima. In such cases, we pursued step 2. In step 2, we generated surrogate data sets by jittering the SSRT observations by adding a random value less than 1% of the original data and refitting the data using the same heuristics as before. We then used the parameter fits obtained from the surrogate data to initialize the optimization for the original data and repeated the optimization based on these initial conditions. We tested the significance of the von Mises fit for each version of the model against the null hypothesis using a likelihood-ratio test. We selected between the models based on dual-coherent phase, LIP-only phase and PRR-only phase based on the difference in the maximized log likelihood according to Akaike Information Criterion (AIC). For each model, we also estimated and compared the generalization error using k-fold cross validation with 10 folds. Results presented in Fig 2D, Extended Data Fig 4A,B.
To test the dependence of dual-coherent phase on spike timing, we repeated the analysis described above after jittering the spiketimes on each trial according to a Gaussian distribution with standard deviation 2 ms, 5 ms,10 ms or 20 ms. Results presented in Extended Data Fig 8.
Dual-coherent LFP phase vs reach accuracy - parametric approach:
We modeled the accuracy of the reach on peri-reach and post-reach trials according to a von Mises fit in which accuracy varies across trials according to a gamma distribution with constant scale, k, and a rate, θ, that depends on the phase, ϕ, on that trial during the last 350 ms preceding the onset of the second target according to a von Mises function, We defined three different versions of the model each containing the same number of parameters where phase was set by PRR-only phase, LIP-only phase or dual-coherent phase. For each model, the gamma scale parameter, k, and the von Mises fit parameters, A, B, k, µ, were estimated using maximum likelihood. The null hypothesis was that reach accuracy varied across trials according to a gamma distribution with constant scale and rate parameters and did not vary with phase. The likelihood was maximized using the function mle in Matlab 2019a (Mathworks) using the same 2-step procedure as detailed above for SSRT. We tested the significance of the von Mises fit for each version of the model against the null hypothesis using a likelihood-ratio test. We selected between the models based on dual-coherent phase, LIP-only phase and PRR-only phase based on the difference in the maximized log likelihood according to Akaike Information Criterion (AIC). For each model, we also estimated the generalization error using k-fold cross validation with 10 folds. Results presented in Fig 2F, Extended Data Fig 4C,D.
Reach accuracy and SSRT vs phase - non-parametric approach:
We performed a non-parametric test of the effects of phase on behavioral performance, reach accuracy and SSRT. For each metric, we computed the resultant vector using eight equally-spaced and sized phase bins. To determine significance, we performed a permutation test by permuting the phase on each trial and recalculating the resultant vector (10,000 permutations).
Two-sample non-parametric phase tuning:
We used a non-parametric test of the effects of phase on behavioral performance to compare resultant vectors across different phase measurements (for example, beta-LFP vs gamma-LFP dual coherence). We performed the permutation test by calculating the difference in resultant vectors and comparing to the resultant when permuting the phases across populations (10,000 permutations). Results presented in Extended Data Fig 8,9.
Reach-start aligned analysis:
We analyzed the relationship between LFP phase, SSRT and reach accuracy during a 350 ms time epoch aligned to the start of the reach. The reach-start analysis window extends from 200 ms before the start of the reach until 150 ms after the start of the reach. Since the reach duration was typically 100–200 ms (see Extended Data Fig 1), the reach-start analysis window spans the reach execution period. This interval was chosen to be close in time to the gaze-anchoring window while avoiding confounding influences due to presentation of the Go cue and the second saccade target. Earlier time intervals included the onset of the Go cue while later time intervals included the onset of the second saccade target. Results presented in Extended Data Fig 5.
Dual-coherent LFP phase, firing rate and SSRT:
We measured the association between the SSRT and the firing rate of PRR neurons for trials grouped by spike-triggered phase by performing linear regression. We report the statistical significance of the preferred and null phase bins. Results presented in Fig 3 A-C.
Dual-coherent LFP phase vs firing rate:
We modeled the firing rate on peri-reach, post-reach and saccade trials according to a von Mises fit in which spike count varies across trials according to a Poisson distribution with rate, λ, that depends on the phase, ϕ, on that trial during the last 350 ms preceding the onset of the second target according to a von Mises function,. The von Mises fit parameters, A, B, k, µ, were estimated using maximum likelihood. The null hypothesis was that spike count across trials varied according to a Poisson distribution with constant rate parameter. The likelihood for each model was maximized using the function mle in Matlab (Mathworks). We tested for significance of the von Mises fit against the null hypothesis using a likelihood-ratio test. Results presented in Extended Data Fig 10, Fig 4C,D.
Inhibitory channel modulation model:
We modeled the firing rate of LIP neurons (RateLIP) trial-by-trial as a function of the LIP Base firing rate on that trial, (BASELIP), the PRR spike rate on that trial (RatePRR ) and the dual-coherent β-LFP phase on that trial (ϕDual) according to an inhibitory channel modulation model. The model operates according to two functions (see Fig 4A): inhibitory input gain function models the inhibitory gain (It) based on the PRR firing on that trial, and a modulation state function models the modulation state (Mt) based on the dual-coherent β-LFP phase on that trial:
| Equation 2 |
The inhibitory input gain function and modulation state function were fit by binning trials according to PRR spike rate and fitting a von Mises function to the SSRTs in each bin according to dual-coherent phase (see Fig 3A). Trials were grouped in increments of 8 spikes/sec. The inhibition scale factor for each firing rate bin was measured as the weighted difference between the peak of the von Mises function fit to that bin and the mean SSRT across all peri reach trials (see Fig 3D). The inhibitory gain on each trial (It) was defined according to an exponential function consisting of two parameters (α, β) and the PRR firing rate on that trial (RatePRR ):
| Equation 3 |
The parameters of the inhibitory input gain function (α, β) were fit using the scale factors of the von Mises fit to each firing rate bin (see Fig 3E). The modulation state for each trial was defined according to a von Mises distribution with two parameters (k, µ) and the dual-coherent β-LFP phase on that trial (ϕDual):
| Equation 4 |
The parameters of the modulation state function (k, µ) were calculated from the average of the von Mises parameters fit across bins of PRR firing rates and SSRTs (k = 1.5 , µ = 65 ; see Fig 3D). We describe the goodness of fit (R2) using the adjusted R2 value, which is the ratio of the sum of squared error to the sum of squared total, scaled to account for the number of observations and the number of predictors.
Importantly, LIP spike rates were not used in fitting either the inhibitory gain function or the modulation state function. The inhibitory channel model only depends on LIP spiking activity for a base rate starting point for the model on each trial. The LIP base rate (BASELIP) on each trial (t) was defined by the average LIP firing rate recorded before firing rate suppression is observed (MeanPreMove) and difference between the LIP firing rate prior to movement onset (preMove(t)) and before the onset of the second target (preTarg(t)) on each trial such that:
| Equation 5 |
We characterized the performance of the model by calculating the mean squared error (MSE) between the observed LIP firing rate on each trial and the predicted LIP firing rate on each trial according to the model. For comparison, we also calculated the MSE for an input gain function only model, which did not include the modulation state function, a modulation state only model, which did not include the inhibitory input gain function, and a linear regression model. The linear regression, unlike the other models, was fit using the observed LIP firing rates on each trial.
Extended Data
Extended Data Fig 1.
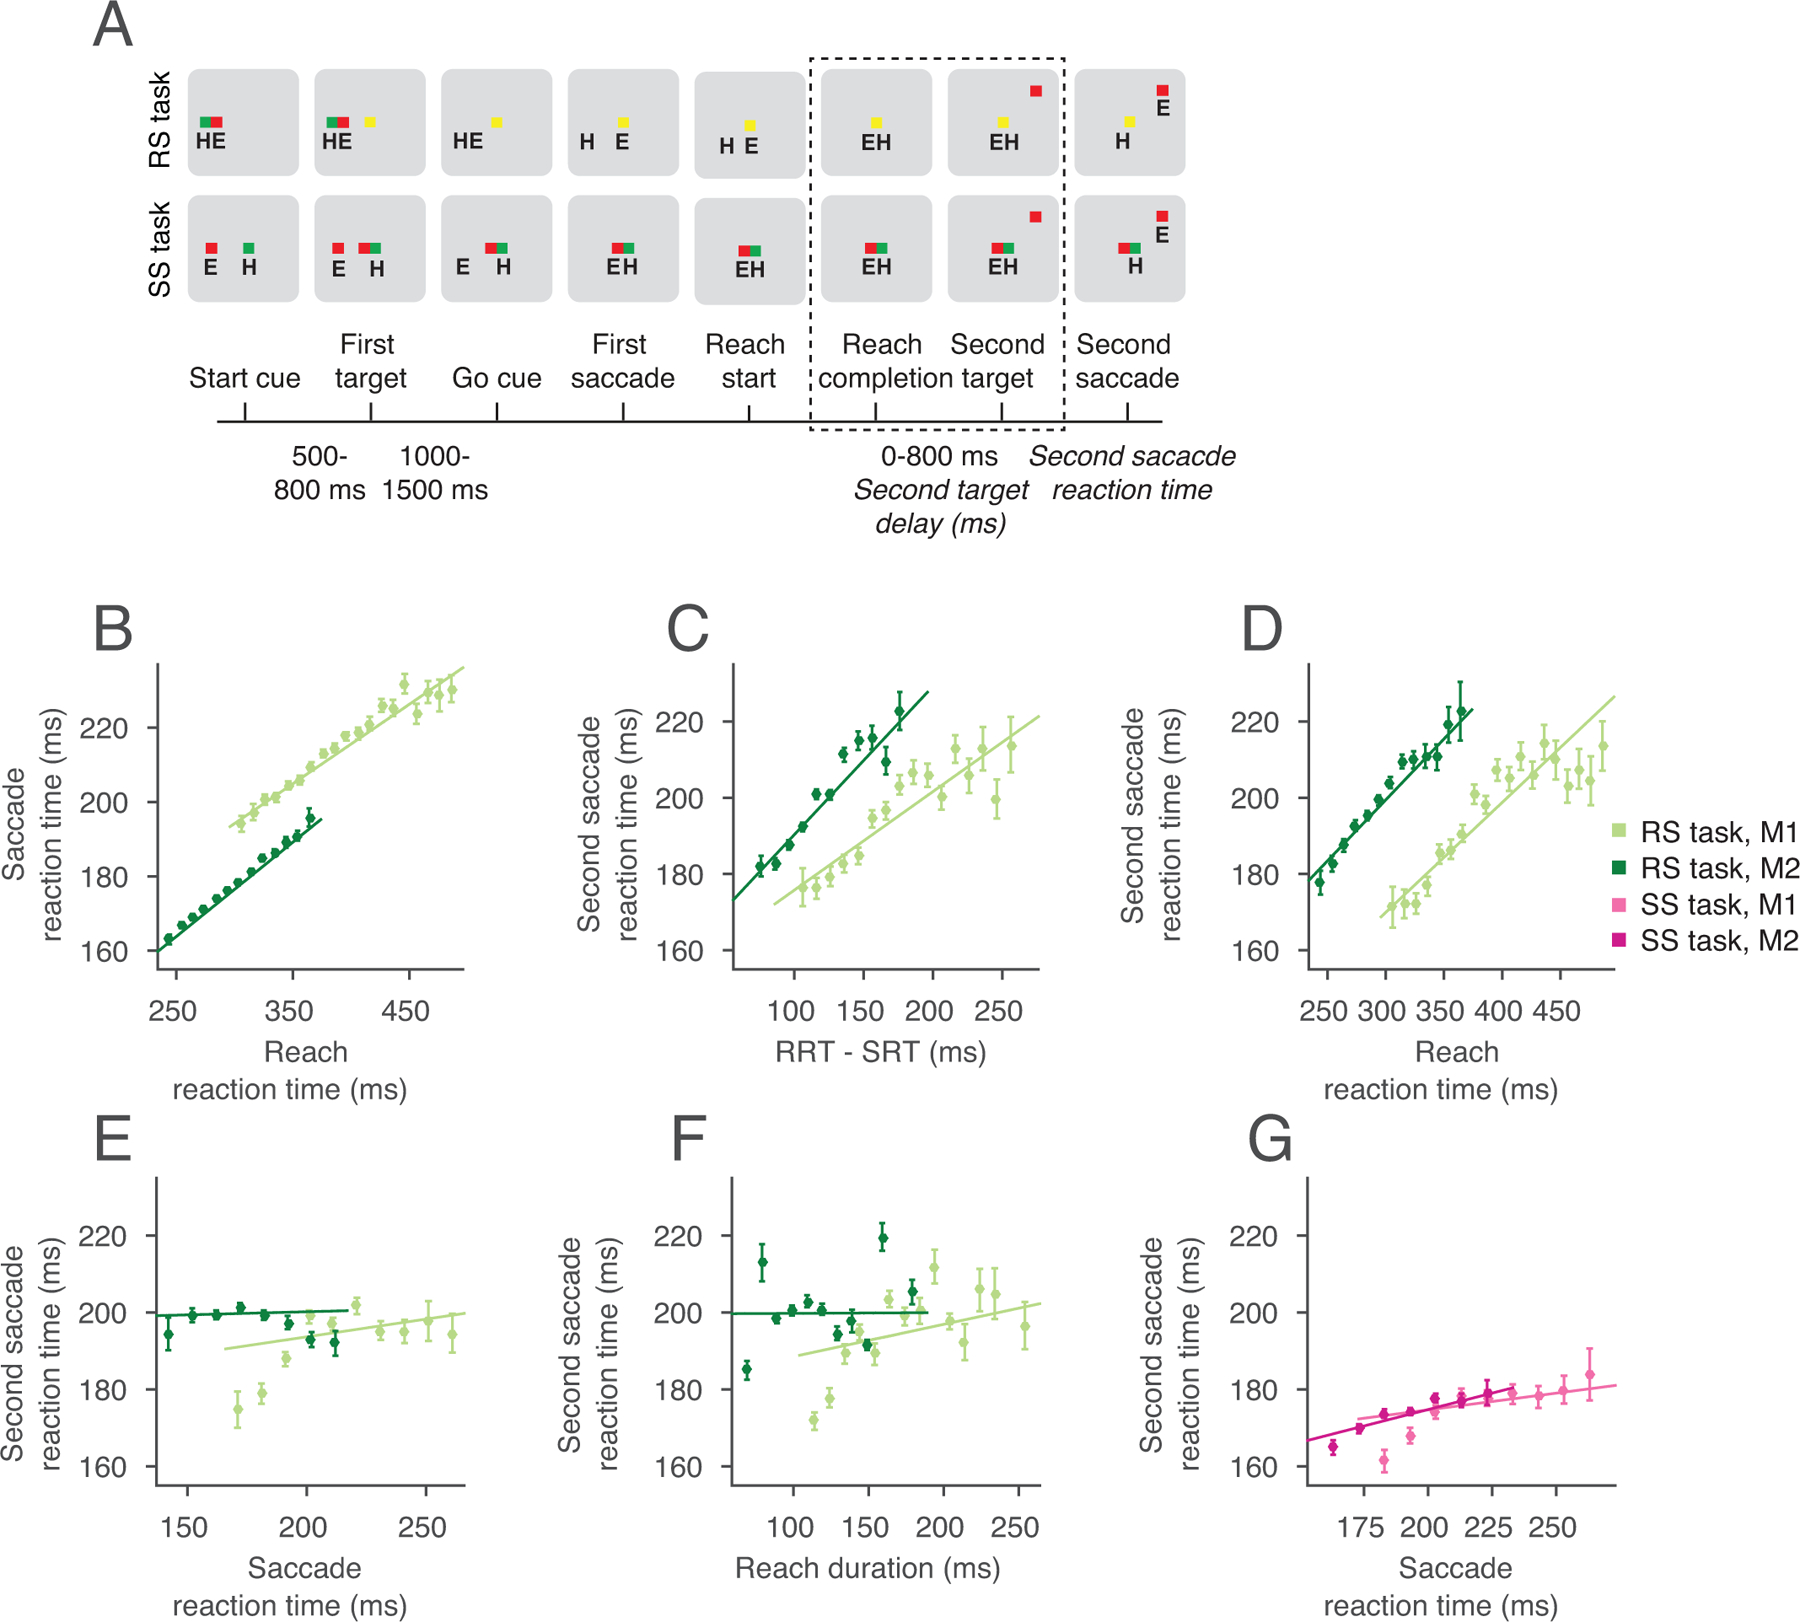
Coordinated and independent movement tasks. (A) Reach and saccade double-step task (RS) and Saccade double-step task (SS), indicating hand (H) and eye (E) position at each epoch. Dashed lines indicate period of gaze-anchoring in the RS task, and temporally matched epochs in the SS task.The slowing of the second saccade reaction time (SSRT) was tied to the coordinated movement. (B) The coordination of the first movement was established by the strong correlation between the reaction times for the reach and saccade in the first movement (Monkey 1 (M1): R=0.34, slope=0.21 ms/ms, p=3×10−139, Monkey 2 (M2): R=0.45, slope=0.25 ms/ms, p=0, Pearson pairwise linear correlation). (C) SSRT correlated with the difference between the reaction times of the reach and saccade in the first movement (M1: R=0.20, slope=0.26 ms/ms, p=2×10−49, M2: R=0.22, slope=0.39 ms/ms, p=2×10−78, Pearson pairwise linear correlation). (D) Specifically, SSRT correlated with the reaction time of the reach (M1: R=0.23, slope=0.29 ms/ms, p=4×10−63, M2: R=0.20, slope=0.32 ms/ms, p=2×10−65, Pearson pairwise linear correlation). (E) The SSRT was not dependent on the reaction time of the saccade in the RS task (M1: R=0.05, slope=0.09 ms/ms, p=8×10⁻⁴, M2: R=0.006, slope=0.02 ms/ms, p=0.63, Pearson pairwise linear correlation) (F) SSRT did not depend on the duration of the reach (M1: R=0.07, slope=0.08 ms/ms, p=1×10⁻⁶, M2: R=0.001, slope=0.002 ms/ms, p=0.91, Pearson pairwise linear correlation). (G) SSRT only weakly correlated with the SRT in the SS task (M1: R=0.06, slope=0.08 ms/ms, p=1×10⁻³, M2: R=0.12, slope=0.17 ms/ms, p=7×10⁻¹³, Pearson pairwise linear correlation). Therefore, the slowing of the SSRT was tied to coordinated movement, and primarily the timing of the reach. Monkey 1: RS task, n=10,324 trials, SS task, n=8,372 trials; Monkey 2: RS task, n=12,840 trials, SS task n=8,452 trials. All error bars show mean±SEM.
Extended Data Fig 2.
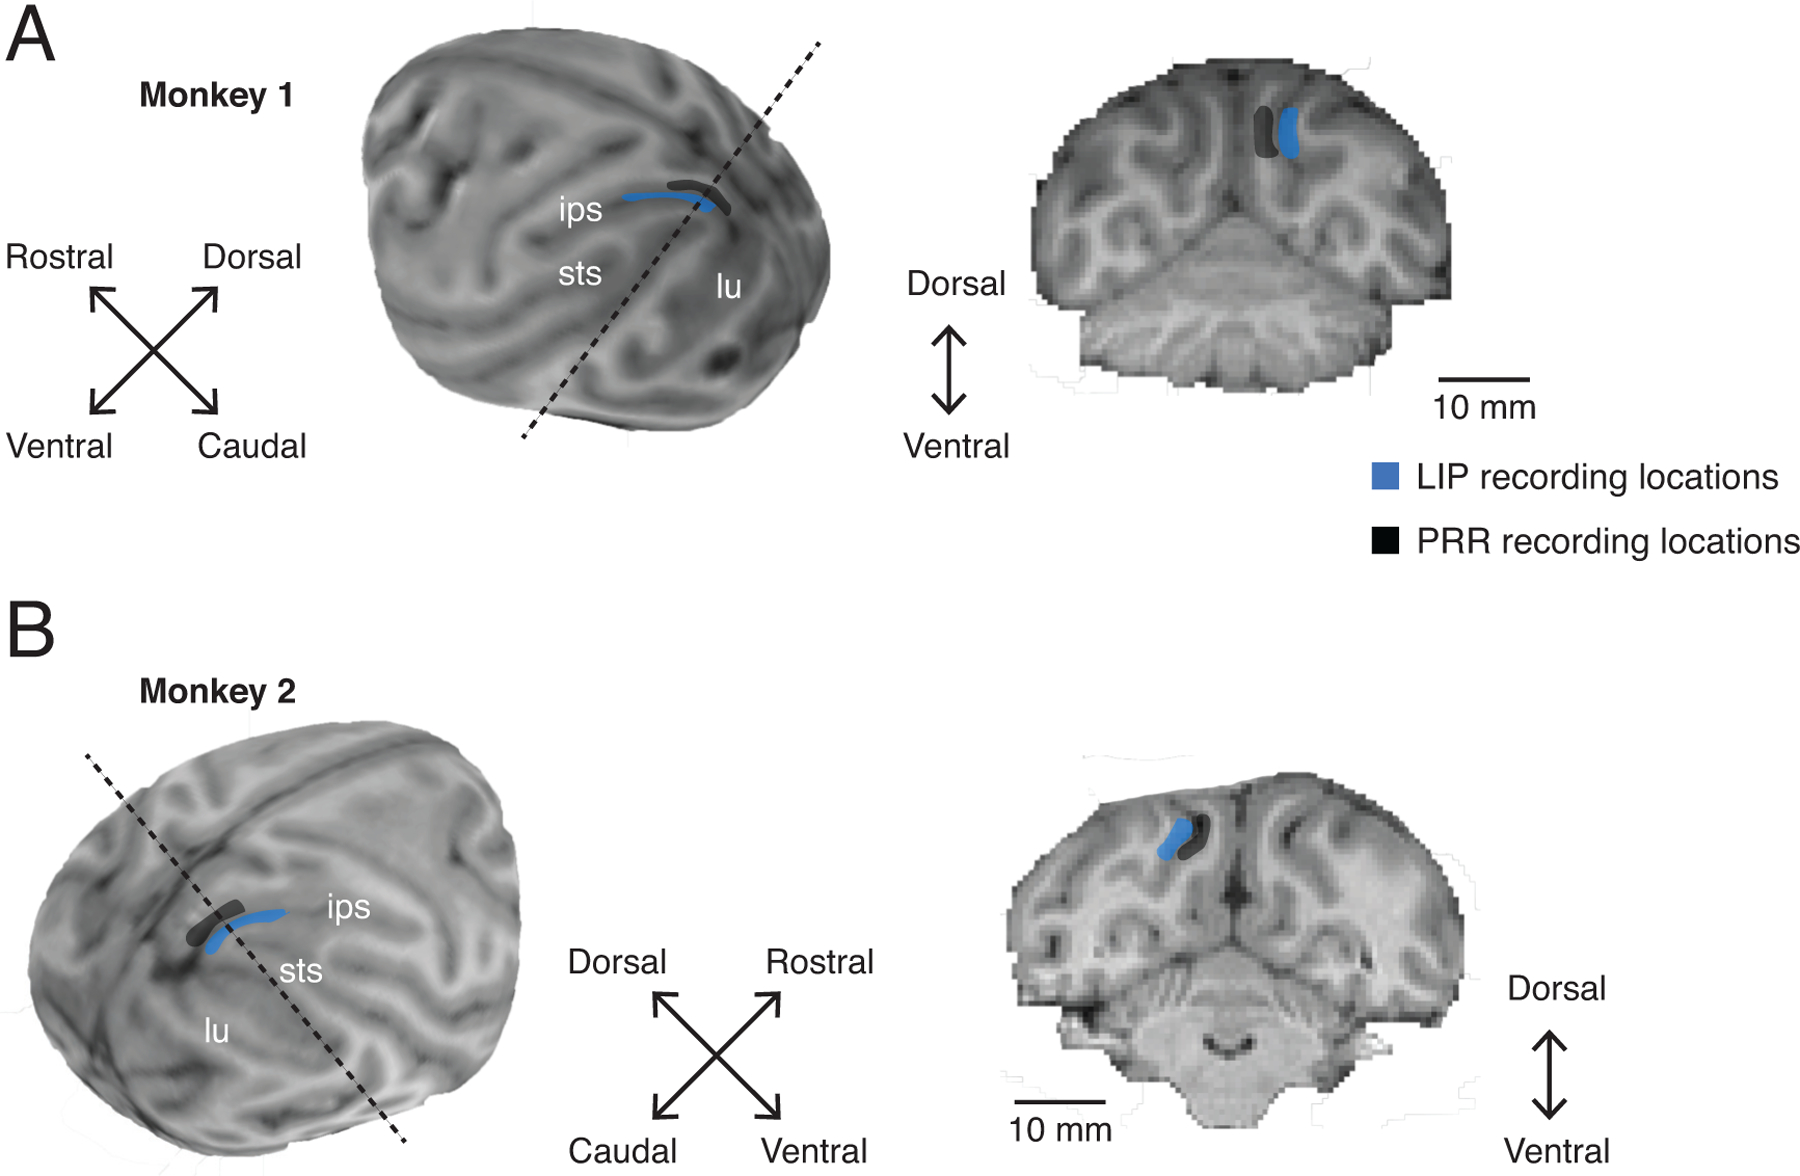
Anatomical locations of recordings. Recording chambers were placed over the posterior parietal cortex of the hemisphere contralateral to the reaching arm (A) Whole brain MRI reconstructions and example coronal slice from Monkey 1 and (B) Monkey 2. Chamber placement and electrode recording sites were registered to the structural MRI (BrainSight, Rogue Research). Recording regions for area LIP (blue) and PRR (black) are indicated by the shaded regions. Dashed lines indicate the plane of example coronal sections shown. Key sulcal landmarks, intraparietal sulcus (ips), lunate sulcus (lu) and superior temporal sulcus (sts), are also indicated.
Extended Data Fig 3.
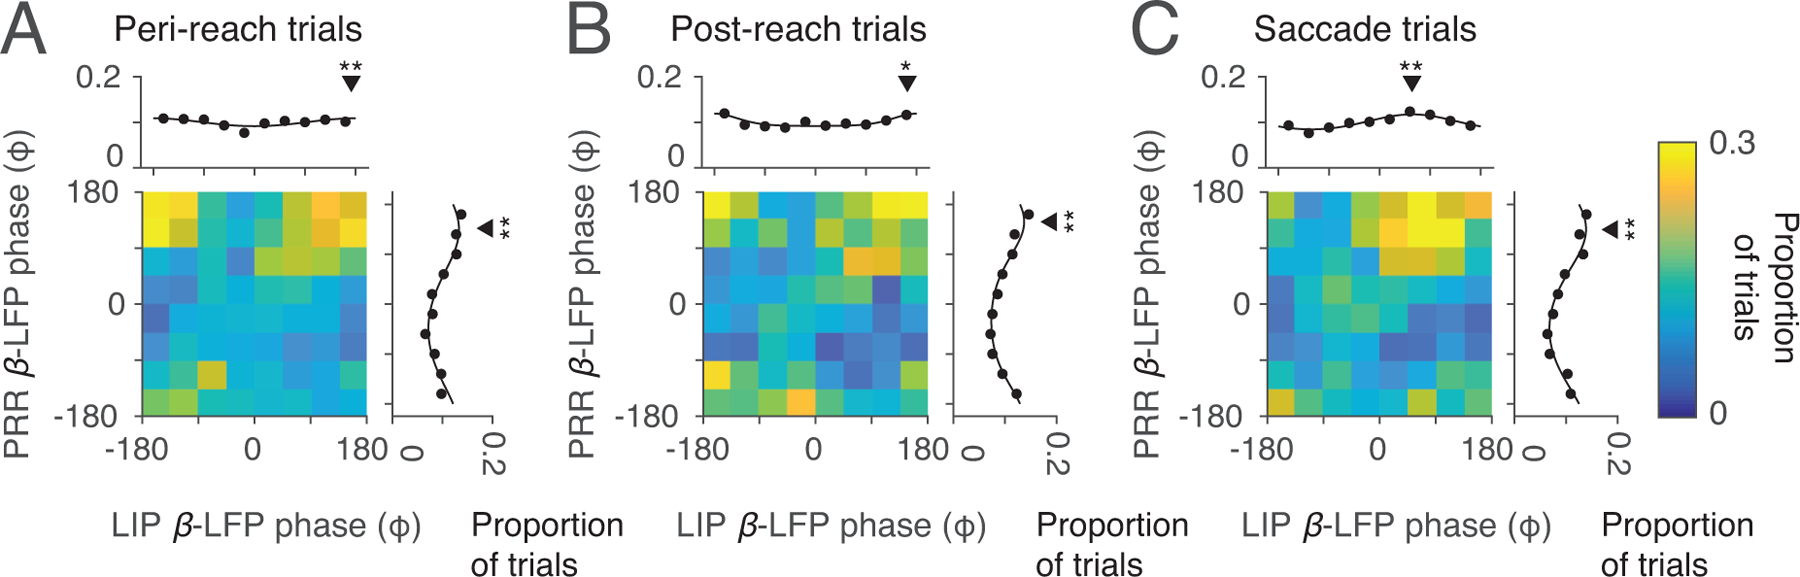
Phase of spike-β-LFP coherence in each cortical area. (A) Peri-reach, (B) Post-reach, and (C) Saccade trials showing spike-LFP coherence between PRR spiking and PRR LFP phase (y-axis) and LIP LFP phase (x-axis) in the beta-band (β, 20 Hz, colorscale: proportion of trials). Marginals show the proportion of trials as a function of phase in each area. Peri-reach: PRR β-LFP p=2×10−49, mean phase=136±75°; LIP β-LFP p=8×10⁻⁵, mean phase=172±79°, Post-reach: PRR β-LFP p=4×10−57, mean phase=149±74°, LIP β-LFP p=0.02, mean phase=164±79°, Saccade trials: PRR β-LFP p=2×10−52, mean phase=135±73°, LIP β-LFP p=2×10−52, mean phase=59±78°, Rayleigh’s test of non-uniformity, circular mean±SD phase). Black triangles indicate mean phase, stars indicate that the distribution is non-uniform (one star, p< 0.05; two stars, p<0.01, exact p-values above). Peri-reach: n=4814 trials, Post-reach: n=2116 trials, Saccade: n=3583 trials (same dataset shown in Fig 2,3). All error bars show mean±SEM.
Extended Data Fig 4.
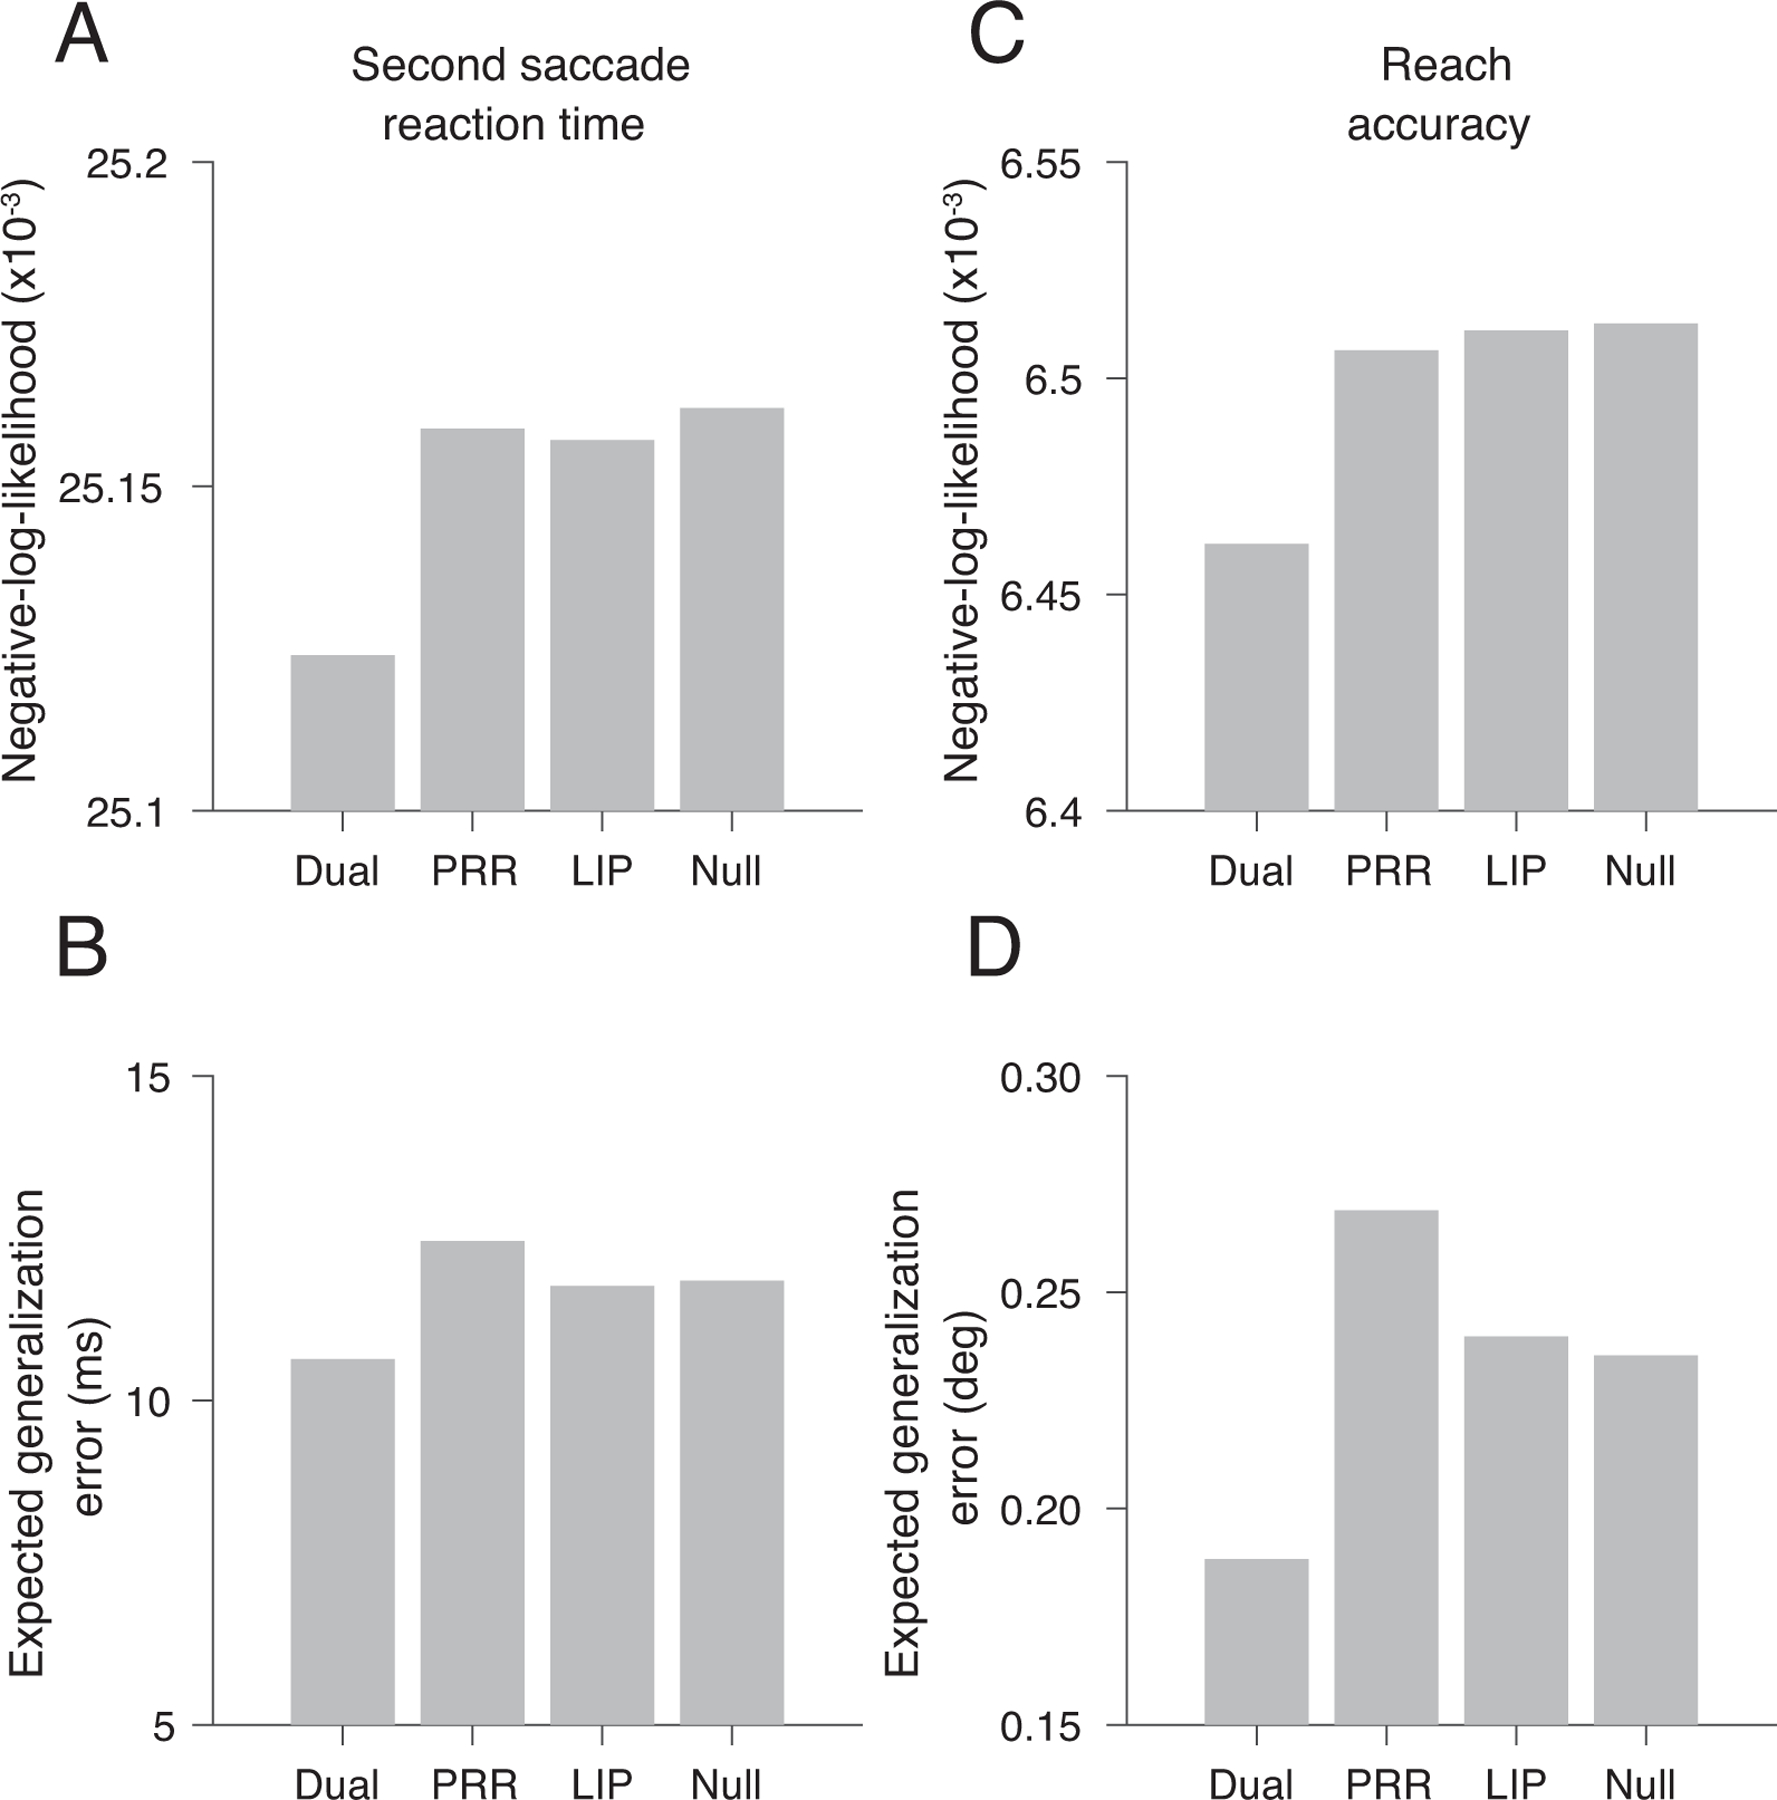
Negative-log-likelihood and generalization errors for model fits. Second saccade reaction time: (A) Dual-phase negative-log-likelihood (NLL)= 25124; PRR-only phase NLL=25158; LIP-only phase NLL = 25157; Null NLL = 25162; ∆NLLDual-PRR = 35; ∆NLLDual-LIP = 33, AIC test; (B) Expected generalization error: Dual-coherent: 10.6 ms, R= 0.10; PRR-only: 12.5 ms, R= −0.05; LIP-only: 11.8 ms, R= 0.01; Null: 11.8 ms, where R=1-(SSE_model/SSE_null); Reach accuracy: (C) Dual-phase negative-log-likelihood (NLL)= 6462; PRR-only phase NLL=6507; LIP-only phase NLL= 6511; Null NLL = 6512; ∆NLLDual-PRR = 45; ∆NLLDual-LIP = 49, AIC test; (D) Expected generalization error: Dual-coherent: 0.18 deg, R= 0.20, PRR-only: 0.27 deg, R = −0.14, LIP-only: 0.24 deg, R = −0.02, Null: 0.24 deg). Non-parametric analyses: Peri-reach trials: SSRT: dual-coherent: resultant=6.2×10⁻³,p<10−6, LIP-only: p=0.28, PRR-only: resultant=2.3×10⁻⁶,p=0.02, RA: dual-coherent: resultant=1.6×10⁻⁴,p=0. LIP-only: p=0.33. PRR-only: resultant=5.3×10⁻⁵,p=1.6×10⁻³. Post-reach trials for dual coherent phase: SSRT: resultant=5.7×10⁻³,p=0. post-reach RA: resultant=2.1×10⁻⁴,p=1.2×10⁻³. Saccade trials: SSRT: p=0.89. Peri-reach: n=4814 trials, Post-reach: n=2116 trials, Saccade: n=3583 trials (same dataset shown in Fig 2,3).
Extended Data Fig 5.
Dual coherent β-LFP phase aligned to reach onset. (A) Second saccade reaction time (SSRT) against dual-coherent β-LFP phase for each RS task trial type (Peri-reach: light green. Post-reach: dark green) during the gaze anchoring epoch when aligned to reach onset, instead of second target onset. Solid lines present changes in SSRT fitted by von Mises function (peri-reach: p = 0, preferred phase = 41°. post-reach: p = 6×10⁻⁵, preferred phase = 153°). Downward triangle presents the mean of the von-Mises fit dual-coherent β-LFP phase at maximum SSRT on peri-reach trials. (B-C) Phase of spike-β-LFP coherence in each cortical area (PRR β-LFP coherence, y axis; LIP β-LFP coherence, x axis) and influence on SSRT (colorscale). Marginals show SSRT against β-LFP phase coherence in each area alone (Peri-reach: PRR-only p = 0.53, LIP-only p = 2×10⁻³, preferred phase = 48°. Post-reach: PRR-only p = 0.53, LIP-only p = 0.48) . Dashed lines (B) indicate the corresponding dual-coherent phase shown by the downward triangle in (A). Note that confounds due to the onset of the Go cue were not a concern because the LFP phase calculation during gaze-anchoring epoch rarely overlapped cue delivery (3.7% of peri-reach trials, 0% of post-reach trials and 2.5% of saccade trials). All p-values report likelihood-ratio test. Peri-reach: n=4814 trials, Post-reach: n=2116 trials, Saccade: n=3583 trials (same dataset shown in Fig 2,3). All error bars show mean±SEM.
Extended Data Fig 6.
β-LFP phase difference alone did not predict gaze anchoring. The circular mean β-LFP phase was taken across the gaze-anchoring epoch, irrespective of spike timing. (A) Mean phase difference of the β-LFP (20 Hz) across cortical areas for each task trial type (Saccade: pink. Peri-reach: light green. Post-reach: dark green). Solid lines present changes in SSRT fitted by von Mises function (Peri-reach: p = 0.23. Post-reach: p = 1×10⁻³, preferred phase = 53°. Saccade: p = 0.83. likelihood-ratio test). (B-D) Mean β-LFP phase in each cortical area (PRR β-LFP phase, y axis; LIP β-LFP phase × axis) and influence on SSRT (colorscale). Marginals show SSRT as a function of mean β-LFP phase in each area alone (Peri-reach: PRR-only p = 0.89, LIP-only p = 0.24. Post-reach: PRR-only p = 8×10⁻³, preferred phase = 32° LIP-only p = 0.20. Saccade: PRR-only p = 8×10⁻⁴, preferred phase = −143; LIP-only p = 0.12. likelihood-ratio test). (E-G) β-LFP phase in PRR (y-axis) and LIP (x-axis, colorscale: proportion of trials). Downward triangles show the circular mean phase. Peri-reach: n=4814 trials, Post-reach: n=2116 trials, Saccade: n=3583 trials (same dataset shown in Fig 2,3). All error bars show mean±SEM.
Extended Data Fig 7.
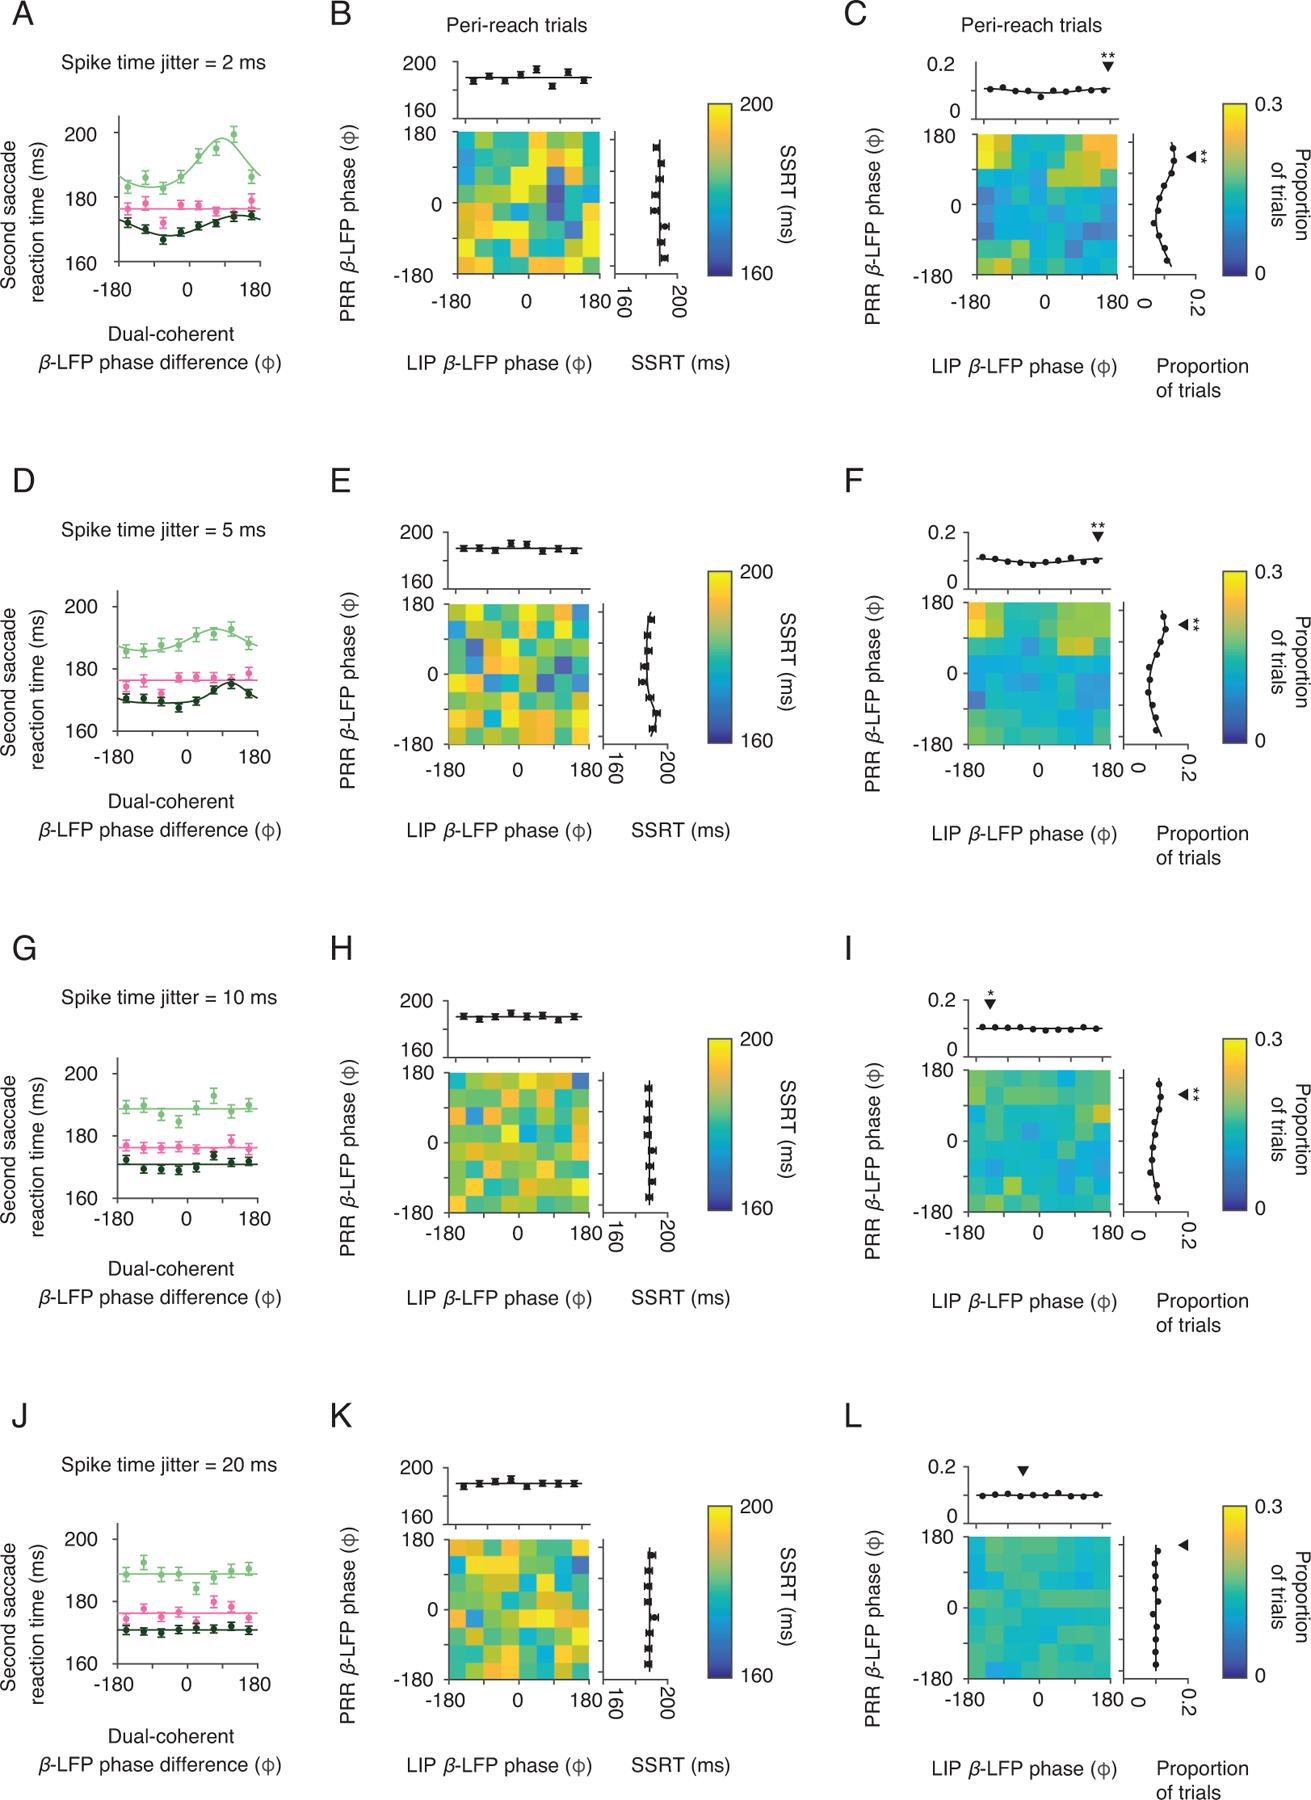
Spike timing dependence of dual coherent β-LFP phase. For each trial, spike times were jittered according to a Gaussian distribution with standard deviation (A-C) 2 ms, (D-F) 5 ms, (G-I) 10 ms and (J-L) 20 ms. Second saccade reaction time (SSRT) as a function of dual-coherent β-LFP phase for each task trial type (Saccade, pink; Peri-reach, light green; Post-reach, dark green) during the gaze anchoring epoch was recomputed with the jittered spike times. Solid lines present changes in SSRT fitted by von Mises function (A, Peri-reach: p = 1×10⁻¹³, preferred phase = 82°. Post-reach: p = 5×10⁻⁵, preferred phase = 126°. Saccade: p = 0.68. D, Peri-reach: p = 3×10⁻³, preferred phase = 73°. Post-reach: p = 7×10⁻⁵, preferred phase = 108°. Saccade: p = 0.23. G, Peri-reach: p = 0.22. Post-reach: p = 0.29. Saccade: p = 0.90. J, Peri-reach: p = 0.11. Post-reach: p = 1. Saccade: p = 0.38. likelihood-ratio test). For peri-reach trials, the phase of spike-β-LFP coherence in each cortical area were computed for the jittered spike times (PRR β-LFP coherence, y axis; LIP β-LFP coherence x axis) and influence on SSRT (colorscale). Marginals show SSRT as a function of β-LFP phase coherence in each area alone (B, PRR-only p = 0.10, LIP-only, p = 0.10, E, PRR-only p = 0.04, preferred phase = −127°, LIP-only, p = 0.47, H, PRR-only p = 0.68, LIP-only, p = 0.63, K, PRR-only p = 0.52, LIP-only, p = 0.71, likelihood-ratio test). Spike-LFP coherence between PRR spiking and each cortical area alone for jittered spike times on peri-reach trials (PRR LFP phase, y-axis, LIP LFP phase x-axis, colorscale: proportion of trials). Marginals show the proportion of trials as a function of phase in each area (C, PRR p = 2×10−47, mean = 137°, LIP p = 8×10⁻⁴, mean = 175°, F, PRR p = 2×10⁻³¹, mean = 139°, LIP p = 1×10⁻³, mean = 167°, I, PRR p = 3×10⁻¹⁰, mean = 132°, LIP p = 0.04, mean = −140°, L, PRR p = 0.84, LIP p = 0.79, Rayleigh’s test of non-uniformity, circular mean phase). Black triangles indicate mean phase, stars indicate that the distribution is non-uniform (one star, p< 0.05; two stars, p<0.01, exact p-values above). Peri-reach: n=4814 trials, Post-reach: n=2116 trials, Saccade: n=3583 trials (same dataset shown in Fig 2,3). All error bars show mean±SEM.
Extended Data Fig 8.
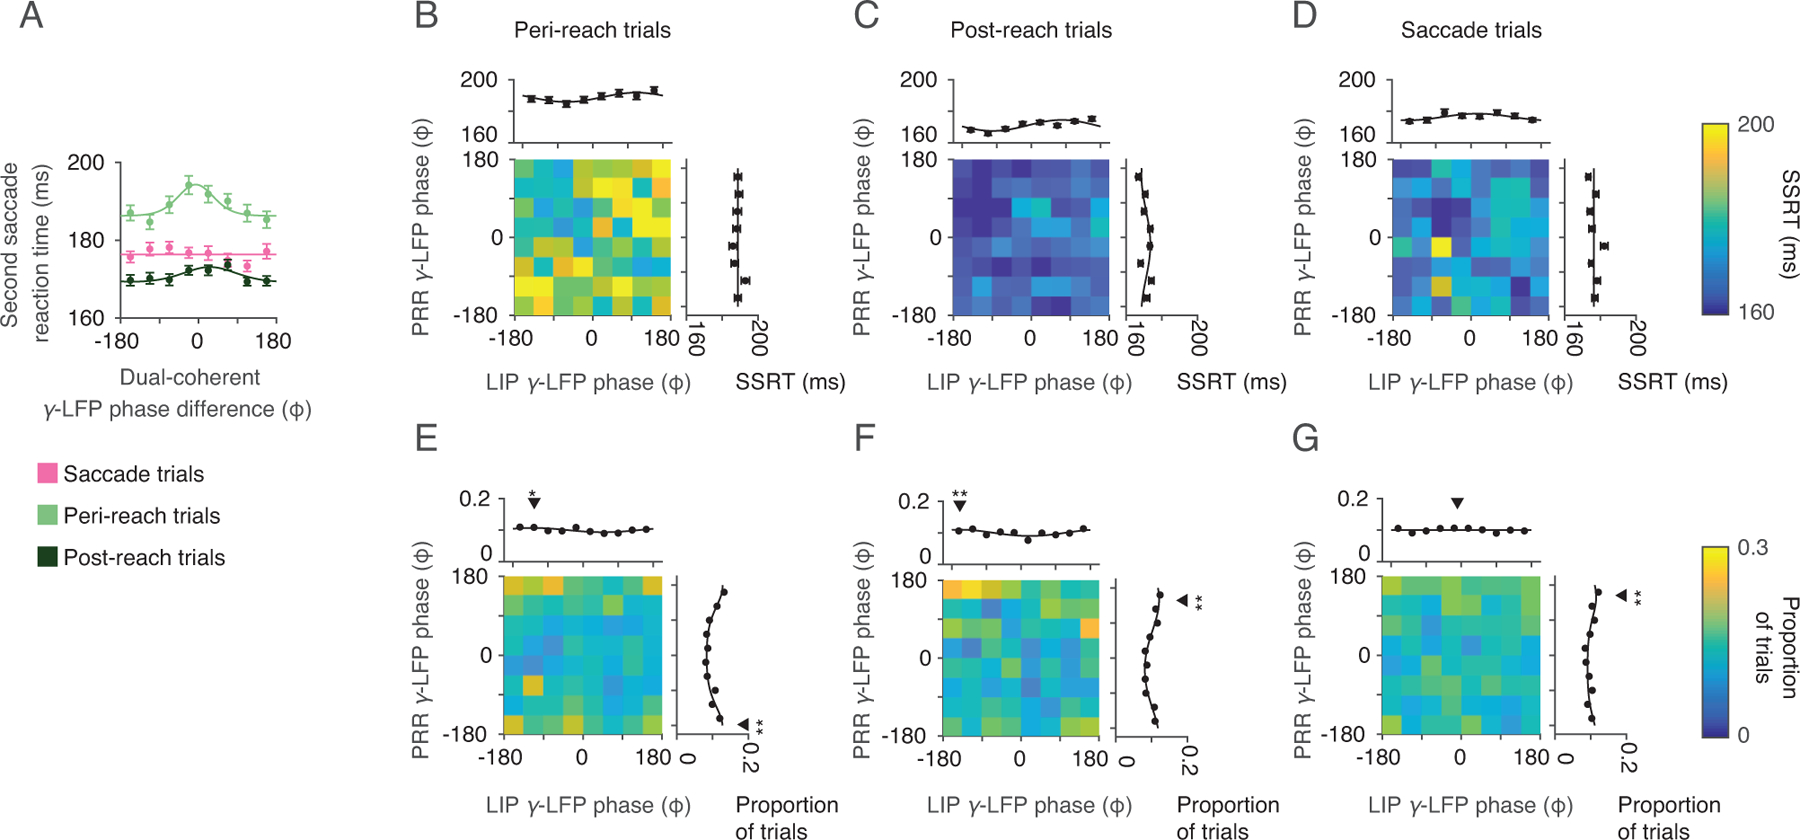
Dual coherent γ-LFP phase. Dual-coherent phase was calculated between PRR spiking and the γ-LFP phase (40 Hz) in each cortical area. (A) Second saccade reaction time (SSRT) against dual-coherent γ-LFP phase for each RS task trial type (Peri-reach = light green; Post-reach = dark green). Solid lines present changes in SSRT fitted by von Mises function (Peri-reach: p = 8×10⁻⁴, preferred phase = −6°. Post-reach: p = 0.04, preferred phase = 26°. Saccade: p = 0.1likelihood-ratio test). (B-D) Mean γ-LFP phase in each cortical area (PRR γ-LFP phase, y axis; LIP γ-LFP phase × axis) and their influence on SSRT (colorscale). Marginals show SSRT against mean γ-LFP phase in each area alone (Peri-reach: PRR-only p = 0.55, LIP-only p = 0.02, preferred phase = 112°. Post-reach: PRR-only p = 0.02, preferred phase = −25°. LIP-only p = 4×10⁻⁶, preferred phase = 78°. Saccade: PRR-only p = 0.13, LIP-only p = 0.04, preferred phase = 17°, likelihood-ratio test). (E-G) γ-LFP phase in PRR (y-axis) and LIP (x-axis, colorscale: proportion of trials). Marginals show the proportion of trials against phase in each area (Peri-reach: PRR p = 4×10⁻²³, mean = −177°, LIP p = 0.02, mean = −125°. Post-reach: PRR p = 2×10⁻⁶, mean = 148°, LIP p = 3×10⁻⁴, mean = −159°. Saccade: PRR p = 1×10⁻⁴, mean = 153°, LIP p = 0.33, Rayleigh’s test of non-uniformity). Black triangles indicate mean phase, stars indicate that the distribution is non-uniform (one star, p< 0.05; two stars, p<0.01, exact p-values above). Peri-reach SSRT slowing with gamma-frequency phase was significantly reduced compared to that with beta-frequency dual-coherent phase (resultant = 2.9×10⁻³,p = 1×10⁻⁴. permutation test). Peri-reach: n=4814 trials, Post-reach: n=2116 trials, Saccade: n=3583 trials (same dataset shown in Fig 2,3). All error bars show mean±SEM.
Extended Data Fig 9.
LIP-spike dual coherent β-LFP phase. Dual-coherent phase was calculated between LIP spiking and the β-LFP phase (20 Hz) in each cortical area. (A) Second saccade reaction time (SSRT) as a function of LIP dual-coherent β-LFP phase for each RS task trial type (peri-reach trials, light green; post-reach trials, dark green) and SS task trials (saccade trials). Solid lines present changes in SSRT fitted by von Mises function (peri-reach: p = 1×10⁻⁴, preferred phase = −122°. post-reach: p = 0.21. saccade: p = 1×10⁻³, preferred phase = −157°. likelihood-ratio test). SSRT varied with PRR-spike dual-coherent phase significantly more than with LIP-spike dual-coherent phase (resultant=1.2×10⁻³, p<10−6, permutation test). (B-D) Mean LIP-spike β-LFP phase in each cortical area (PRR β-LFP phase, y axis; LIP β-LFP phase × axis) and their influence on SSRT (colorscale). Marginals show SSRT as a function of mean LIP-spike β-LFP phase in each area alone (Peri-reach: PRR-only p = 0.23. LIP-only p = 0.49. Post-reach: PRR-only p = 6×10⁻⁴, preferred phase = 109°. LIP-only p = 0.48. Saccade: PRR-only p = 5×10⁻⁵ preferred phase = −25°. LIP-only p = 0, preferred phase = −142°, likelihood-ratio test). (E-G) LIP-spike β-LFP phase in PRR (y-axis) and LIP (x-axis, colorscale: proportion of trials). Marginals show the proportion of trials as a function of phase in each area (Peri-reach: PRR: p = 2×10⁻⁵, mean = 160°, LIP: p = 1×10⁻⁷, mean = 97°. Post-reach: PRR p = 2×10⁻⁵, mean = 11°, LIP p = 5×10⁻⁴, mean = 67°. Saccade: PRR p = 2×10⁻⁵, mean = 100°, LIP p = 4×10⁻¹², mean = 103°, Rayleigh’s test of non-uniformity, circular mean). Black triangles indicate mean phase, stars indicate that the distribution is non-uniform (one star, p< 0.05; two stars, p<0.01, exact p-values above). Peri-reach: n=7782 trials, Post-reach: n=3604 trials, Saccade: n=8603 trials. All error bars show mean±SEM.
Extended Data Fig 10.
Dual-coherent β-LFP phase is weakly correlated with PRR firing rate. PRR firing rate and a function of dual-coherent β-LFP phase for each (A) Peri-reach, (B) Post-reach, and (C) Saccade trials. Solid lines present changes in SSRT fitted by von Mises function (Peri-reach: p = 0, preferred phase = −121°. Post-reach: p = 0.23. Saccade: p = 0, preferred phase = 19°, likelihood-ratio test). Peri-reach: n=4814 trials, Post-reach: n=2116 trials, Saccade: n=3583 trials (same dataset shown in Fig 2,3). All error bars show mean±SEM.
Supplementary Material
Acknowledgements
We thank Roch Comeau, Stephen Frey and Brian Hynes for custom modifications to the BrainSight system, and Nic Price, Elizabeth Zavitz, Adam Charles and members of the Pesaran lab for helpful feedback. This work was supported, in part, by NIH T32 EY007136 (MAH), ARC DE180100344 (MAH), NSF CAREER Award BCS-0955701 (BP), NEI R01-EY024067 (BP), the Army Research Office (BP), the Simons Foundation (BP), McKnight Scholar Award (BP), and Sloan Research Fellowship (BP). MAH and BP conceptualized the project and designed the experiments. MAH performed the experiments. MAH and BP analyzed the data and wrote the manuscript. The authors declare no competing interests.
Footnotes
Data availability: Data for the current study are available on a github repository. https://github.com/mauhagan/Hagan2022Nature
Code availability: Matlab code for current study is available on a github repository. https://github.com/mauhagan/Hagan2022Nature
References and Notes:
- 1.Milner D & Goodale M The Visual Brain in Action (Oxford University Press, USA, 2006). [Google Scholar]
- 2.Hahn G, Ponce-Alvarez A, Deco G, Aertsen A & Kumar A Portraits of communication in neuronal networks. Nat. Rev. Neurosci 20, 117–127 (2019). [DOI] [PubMed] [Google Scholar]
- 3.Buschman TJ & Miller EK Top-Down Versus Bottom-Up Control of Attention in the Prefrontal and Posterior Parietal Cortices. Science vol. 315 1860–1862 (2007). [DOI] [PubMed] [Google Scholar]
- 4.Anderson MC & Weaver C Inhibitory Control over Action and Memory. in Encyclopedia of Neuroscience (ed. Squire LR) 153–163 (Academic Press, 2009). [Google Scholar]
- 5.Semedo JD, Zandvakili A, Machens CK, Yu BM & Kohn A Cortical Areas Interact through a Communication Subspace. Neuron 102, 249–259.e4 (2019). [DOI] [PMC free article] [PubMed] [Google Scholar]
- 6.Gregoriou GG, Gotts SJ, Zhou H & Desimone R High-Frequency, Long-Range Coupling Between Prefrontal and Visual Cortex During Attention. Science vol. 324 1207–1210 (2009). [DOI] [PMC free article] [PubMed] [Google Scholar]
- 7.Pesaran B, Nelson MJ & Andersen RA Free choice activates a decision circuit between frontal and parietal cortex. Nature 453, 406–409 (2008). [DOI] [PMC free article] [PubMed] [Google Scholar]
- 8.Abrams RA, Meyer DE & Kornblum S Eye-hand coordination: oculomotor control in rapid aimed limb movements. J. Exp. Psychol. Hum. Percept. Perform 16, 248–267 (1990). [DOI] [PubMed] [Google Scholar]
- 9.Catani M et al. Short parietal lobe connections of the human and monkey brain. Cortex 97, 339–357 (2017). [DOI] [PubMed] [Google Scholar]
- 10.Lewis JW & van Essen DC Corticocortical connections of visual, sensorimotor, and multimodal processing areas in the parietal lobe of the macaque monkey. J. Comp. Neurol 428, 112–137 (2000). [DOI] [PubMed] [Google Scholar]
- 11.Kubanek J, Li JM & Snyder LH Motor role of parietal cortex in a monkey model of hemispatial neglect. Proc. Natl. Acad. Sci. U. S. A 112, E2067–72 (2015). [DOI] [PMC free article] [PubMed] [Google Scholar]
- 12.Hwang EJ, Hauschild M, Wilke M & Andersen RA Inactivation of the parietal reach region causes optic ataxia, impairing reaches but not saccades. Neuron 76, 1021–1029 (2012). [DOI] [PMC free article] [PubMed] [Google Scholar]
- 13.Neggers SF & Bekkering H Ocular gaze is anchored to the target of an ongoing pointing movement. J. Neurophysiol 83, 639–651 (2000). [DOI] [PubMed] [Google Scholar]
- 14.Hagan MA, Dean HL & Pesaran B Spike-field activity in parietal area LIP during coordinated reach and saccade movements. Journal of Neurophysiology vol. 107 1275–1290 (2012). [DOI] [PMC free article] [PubMed] [Google Scholar]
- 15.Barash S, Bracewell RM, Fogassi L, Gnadt JW & Andersen RA Saccade-related activity in the lateral intraparietal area. II. Spatial properties. J. Neurophysiol 66, 1109–1124 (1991). [DOI] [PubMed] [Google Scholar]
- 16.Pesaran B et al. Investigating large-scale brain dynamics using field potential recordings: analysis and interpretation. Nat. Neurosci (2018) doi: 10.1038/s41593-018-0171-8. [DOI] [PMC free article] [PubMed] [Google Scholar]
- 17.Dean HL, Hagan MA & Pesaran B Only Coherent Spiking in Posterior Parietal Cortex Coordinates Looking and Reaching. Neuron vol. 73 829–841 (2012). [DOI] [PMC free article] [PubMed] [Google Scholar]
- 18.Pape A-A & Siegel M Motor cortex activity predicts response alternation during sensorimotor decisions. Nature Communications vol. 7 (2016). [DOI] [PMC free article] [PubMed] [Google Scholar]
- 19.Kristeva R, Patino L & Omlor W Beta-range cortical motor spectral power and corticomuscular coherence as a mechanism for effective corticospinal interaction during steady-state motor output. NeuroImage vol. 36 785–792 (2007). [DOI] [PubMed] [Google Scholar]
- 20.Chung JW, Ofori E, Misra G, Hess CW & Vaillancourt DE Beta-band activity and connectivity in sensorimotor and parietal cortex are important for accurate motor performance. NeuroImage vol. 144 164–173 (2017). [DOI] [PMC free article] [PubMed] [Google Scholar]
- 21.Brovelli A et al. Beta oscillations in a large-scale sensorimotor cortical network: Directional influences revealed by Granger causality. Proceedings of the National Academy of Sciences vol. 101 9849–9854 (2004). [DOI] [PMC free article] [PubMed] [Google Scholar]
- 22.Lee JH, Whittington MA & Kopell NJ Top-Down Beta Rhythms Support Selective Attention via Interlaminar Interaction: A Model. PLoS Computational Biology vol. 9 e1003164 (2013). [DOI] [PMC free article] [PubMed] [Google Scholar]
- 23.Tan H, Wade C & Brown P Post-Movement Beta Activity in Sensorimotor Cortex Indexes Confidence in the Estimations from Internal Models. The Journal of Neuroscience vol. 36 1516–1528 (2016). [DOI] [PMC free article] [PubMed] [Google Scholar]
- 24.Hawellek DJ, Wong YT & Pesaran B Temporal coding of reward-guided choice in the posterior parietal cortex. Proceedings of the National Academy of Sciences vol. 113 13492–13497 (2016). [DOI] [PMC free article] [PubMed] [Google Scholar]
- 25.Fiebelkorn IC, Pinsk MA & Kastner S A Dynamic Interplay within the Frontoparietal Network Underlies Rhythmic Spatial Attention. Neuron 99, 842–853.e8 (2018). [DOI] [PMC free article] [PubMed] [Google Scholar]
- 26.Wong YT, Fabiszak MM, Novikov Y, Daw ND & Pesaran B Coherent neuronal ensembles are rapidly recruited when making a look-reach decision. Nat. Neurosci 19, 327–334 (2016). [DOI] [PMC free article] [PubMed] [Google Scholar]
- 27.Pesaran B, Hagan M, Qiao S & Shewcraft R Multiregional communication and the channel modulation hypothesis. Curr. Opin. Neurobiol (2020) doi: 10.1016/j.conb.2020.11.016. [DOI] [PMC free article] [PubMed] [Google Scholar]
- 28.Krakauer JW, Ghazanfar AA, Gomez-Marin A, MacIver MA & Poeppel D Neuroscience Needs Behavior: Correcting a Reductionist Bias. Neuron 93, 480–490 (2017). [DOI] [PubMed] [Google Scholar]
- 29.Bastos AM et al. Visual Areas Exert Feedforward and Feedback Influences through Distinct Frequency Channels. Neuron vol. 85 390–401 (2015). [DOI] [PubMed] [Google Scholar]
- 30.Jensen O et al. On the human sensorimotor-cortex beta rhythm: Sources and modeling. NeuroImage vol. 26 347–355 (2005). [DOI] [PubMed] [Google Scholar]
- 31.Yamawaki N, Stanford IM, Hall SD & Woodhall GL Pharmacologically induced and stimulus evoked rhythmic neuronal oscillatory activity in the primary motor cortex in vitro. Neuroscience vol. 151 386–395 (2008). [DOI] [PubMed] [Google Scholar]
- 32.Hall SD et al. The role of GABAergic modulation in motor function related neuronal network activity. NeuroImage vol. 56 1506–1510 (2011). [DOI] [PubMed] [Google Scholar]
- 33.Baumgarten TJ et al. Beta Peak Frequencies at Rest Correlate with Endogenous GABA /Cr Concentrations in Sensorimotor Cortex Areas. PLOS ONE vol. 11 e0156829 (2016). [DOI] [PMC free article] [PubMed] [Google Scholar]
- 34.Pouille F & Scanziani M Enforcement of temporal fidelity in pyramidal cells by somatic feed-forward inhibition. Science 293, 1159–1163 (2001). [DOI] [PubMed] [Google Scholar]
- 35.Rogal L & Fischer B Eye-hand-coordination: a model for computing reaction times in a visually guided reach task. Biol. Cybern 55, 263–273 (1986). [DOI] [PubMed] [Google Scholar]
- 36.Hoff B & Arbib MA Models of Trajectory Formation and Temporal Interaction of Reach and Grasp. J. Mot. Behav 25, 175–192 (1993). [DOI] [PubMed] [Google Scholar]
- 37.Wimmer RD et al. Thalamic control of sensory selection in divided attention. Nature 526, 705–709 (2015). [DOI] [PMC free article] [PubMed] [Google Scholar]
- 38.Watanabe K & Funahashi S Neural mechanisms of dual-task interference and cognitive capacity limitation in the prefrontal cortex. Nat. Neurosci 17, 601–611 (2014). [DOI] [PubMed] [Google Scholar]
Methods References
- 39.Mitra PP & Pesaran B Analysis of dynamic brain imaging data. Biophys. J 76, 691–708 (1999). [DOI] [PMC free article] [PubMed] [Google Scholar]
- 40.Berens P CircStat: A MATLAB toolbox for circular statistics. J. Stat. Softw 31, 1–21 (2009). [Google Scholar]
Associated Data
This section collects any data citations, data availability statements, or supplementary materials included in this article.