

Abstract
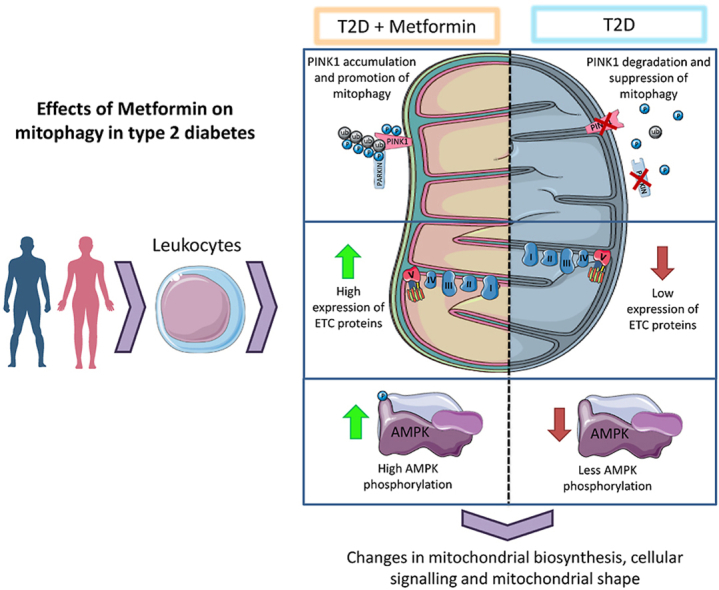
Type 2 diabetes is a chronic metabolic disease that affects mitochondrial function. In this context, the rescue mechanisms of mitochondrial health, such as mitophagy and mitochondrial biogenesis, are of crucial importance. The gold standard for the treatment of type 2 diabetes is metformin, which has a beneficial impact on the mitochondrial metabolism. In this study, we set out to describe the effect of metformin treatment on mitochondrial function and mitophagy in peripheral blood mononuclear cells (PBMCs) from type 2 diabetic patients. We performed a preliminary cross-sectional observational study complying with CONSORT requirements, for which we recruited 242 subjects, divided into 101 healthy volunteers, 93 metformin-treated type 2 diabetic patients and 48 non-metformin-treated type 2 diabetic patients. Mitochondria from the type 2 diabetic patients not treated with metformin displayed more reactive oxygen species (ROS) than those from healthy or metformin-treated subjects. Protein expression of the electron transport chain (ETC) complexes was lower in PBMCs from type 2 diabetic patients without metformin treatment than in those from the other two groups. Mitophagy was altered in type 2 diabetic patients, evident in a decrease in the protein levels of PINK1 and Parkin in parallel to that of the mitochondrial biogenesis protein PGC1α, both of which effects were reversed by metformin. Analysis of AMPK phosphorylation revealed that its activation was decreased in the PBMCs of type 2 diabetic patients, an effect which was reversed, once again, by metformin. In addition, there was an increase in the serum levels of TNFα and IL-6 in type 2 diabetic patients and this was reversed with metformin treatment. These results demonstrate that metformin improves mitochondrial function, restores the levels of ETC complexes, and enhances AMPK activation and mitophagy, suggesting beneficial clinical implications in the treatment of type 2 diabetes.
Keywords: Metformin, Mitochondria, Mitophagy, Type 2 diabetes
Graphical abstract
Highlights
-
•
Metformin promoted electron transport chain expression on type 2 diabetic patients.
-
•
Metformin restored mitophagy levels via PINK1 and PARKIN on type 2 diabetic patients.
-
•
Mitochondrial biogenesis was enhanced by metformin on type 2 diabetic patients.
-
•
Metformin restored AMPK activation on type 2 diabetic patients.
1. Introduction
Type 2 diabetes, which is characterized by hyperglycaemia and hyperinsulinemia, is the most prevalent metabolic disease worldwide [1,2]. At the cellular level, these homeostatic deregulations trigger cellular stress and mitochondrial dysfunction [3,4]. The hallmarks of mitochondrial dysfunction are increased ROS production, mitochondrial membrane depolarization and lower ATP production [5].
To prevent and reduce mitochondrial dysfunction, the cell activates coordinated processes that constitute mitochondrial quality control: mitochondrial dynamics, biogenesis and mitophagy [6,7]. Mitochondrial biogenesis is the process of synthesis of new mitochondria, which is triggered by the transcription factor PPAR-gamma co-activator 1 alpha (PGC1α) after AMP-activated kinase (AMPK) activation. It activates a transcriptional programme that includes the mitochondrial transcription factor alpha (mTFA) [8].
Mitophagy is a type of selective autophagy that degrades old or non-functioning mitochondria that are specifically tagged and then degraded by autophagy [9]. There are different pathways that regulate mitophagy, but one of the most studied relies on PTEN-induced kinase 1 (PINK1) and Parkin proteins [10]. PINK1 is an outer mitochondrial membrane protein that is continuously degraded. If phosphorylated, it is stabilised and interacts with Parkin, an E3 Ubiquitin ligase that marks mitochondria for degradation. Autophagy carriers, such as the neighbour of BRCA-1 gene protein (NBR1) or sequestosome-1 (SQSTM/p62), recognize these ubiquitinated proteins. Additionally, other carrier proteins, such as BCL2/Adenovirus E1B 19 kDa protein-interacting protein 3-like (BNIP3L/NIX), can also trigger mitophagy induced by different stimuli [11]. Mitophagy can be upregulated by active AMPK [12,13] and the subsequent expression of PGC1α and mitochondrial fission factor (MFF) [12].
Different hypotheses have been put forward in order to explain the molecular mechanisms that underlie the beneficial effects of metformin [14,15]. For example, it acts directly on peripheral blood mononuclear cells (PBMCs) by entering through human organic cation transporter type 1 (hOCT1), thereby modulating inflammatory response [16,17] and regulating mitochondrial dynamics [15]. Furthermore, metformin influences mitochondrial function in type 2 diabetes [17,18]. However, how metformin regulates mitophagy in PBMCs remains to be established.
In light of the above context, we hypothesized that PBMCs from type 2 diabetic patients suffer impairment of mitophagy and hampered mitochondrial function, thus leading to the accumulation of non-functional mitochondria, and this can be prevented by metformin treatment.
2. Material and methods
2.1. Subjects
We recruited 101 healthy subjects and 141 type 2 diabetic patients from the Endocrinology and Nutrition Outpatient's Department of University Hospital Doctor Peset, in Valencia (Spain). At recruitment, 93 of the 141 type 2 diabetic patients had received metformin for at least one year, at a dose of 1700 mg/day. The study was approved by the hospital's Ethics Committee for Clinical Investigation (ID: 98/19) and complied with the principles of the Helsinki declaration, and all the patients signed an informed consent form. Type 2 diabetes was diagnosed according to the criteria of the American Diabetes Association (ADA). The following inclusion criteria were established: age between 35 and 70 years, and evolution of diabetes over a period of more than 10 years. The following exclusion criteria were established: obesity (BMI >35 wt (kg)/(height (m))2; history of cardiovascular disorders; and diagnosis of any autoimmune, infectious, haematological or malignant disease. Healthy control subjects were recruited thought social media advertisements, and included individuals who were 35 years or older, living in Valencia, Spain, with no diagnosed type 2 diabetes.
2.2. Sample collection, anthropometrical and biochemical determinations
All the recruited subjects attended the Endocrinology Service of University Hospital Dr. Peset after 12 h fasting and had not taken any anti-inflammatory drug during the previous 24 h. A trained nurse obtained the anthropometrical data and extracted 30 mL of peripheral blood. BMI was calculated with the formula weight (kg)/height (m2). The biochemical parameters were obtained as explained in De Marañón et al. [15]. Information regarding the concomitant medications that the study participants were taking is included in Supplementary Table 1. No statistically significant differences were found between the treated groups with respect to other current medication.
2.3. Isolation of PBMCs
PBMCs were isolated from 8 mL of EDTA-anticoagulated peripheral blood by means of an immunomagnetic method (MACSprep Leukocyte Isolation Kit, human kit, Cat. Number 130-115-169, Milteny Biotech, Germany), following the manufacturer's protocol.
2.4. Flow cytometry assay
After erythrocyte lysis with RBC Lysis Solution (MACS, Cat. number 130-094-183, Milteny Biotech, Germany), 200 μl of human PBMCs were labeled with 5 μL of APC-CD45 antibody (BD pharmingen APC-mouse anti human CD45. CAT number 555485 BD biosciences, NJ, USA) and 1 μM MitoSox (Thermo-Fisher Scientific, MA, USA). Fluorescence was measured in a C6 Accuri cytometer (BD Biosciences, NJ, USA) with a blue laser (488 nm) and FL3 filter (585/40 nm) (mitoSOX Ex/Em = 510/580). 10,000 cells were analysed in each experiment, and the fluorescence registered was relativized to that of an internal control consisting of U937 cells that had undergone the same protocol.
2.5. Protein expression analysis
Whole-cell proteins were extracted from PBMCs obtained from the peripheral blood and frozen at −80 °C, following the procedure explained in de Marañón et al. [15]. Proteins of interest were detected using specific blocking buffer-diluted primary and secondary antibodies (see Supplementary Table 2). Protein signals were obtained using chemiluminescence and the Fusion FX5 (Vilber Lourmat, Marne-La Vallée, France) imaging system. The signal of each protein was relativized to a protein pool of U937 cells. In addition, some of the membranes were cut with the guidance of a molecular weight marker in order to analyze several proteins in the same experiment.
2.6. Transmission electronic microscopy (TEM)
Whole blood (1 mL) was diluted in Karnovsky solution (1:4) and incubated for 30 min, after which the PBMCs were separated by means of the aforementioned protocol. Next, the PBMCs were washed twice, diluted in 500 μL Karnovsky, and left for 1 h at room temperature. The sample was then stored at 4 °C until it was processed for TEM. TEM staining, inclusion and ultrathin sections were performed by the Microscopy Service of the University of Valencia with the JEM -1010 microscope (JEOL, Tokyo, Japan) at a magnification of 7000x and a voltage of 100 kV. The different mitochondrial shape parameters were measured with ImageJ.
2.7. Analysis of serum cytokines
Serum levels of TNFα and IL-6 were measured with a Luminex® 200 analyzer system (Austin, TX, USA) following the Milliplex® MAP Kit manufacturer's procedure (Millipore Corporation, Billerica, MA, USA). The intra-serial and inter-serial variation coefficients were <5.0% and <20.0%, respectively.
2.8. Statistical analysis
Normal distribution of the samples was confirmed with the Kolmogorov-Smirnov test or the Saphiro-Wilk test, depending on sample size. Normally and non-normally distributed data were expressed as mean ± SD and median±(25th-75th percentiles), respectively. One-way ANOVA and a Tukey post-hoc test were employed to compare the 3 groups. The possible influence of age, BMI or HbA1c was corrected with ANCOVA (multivariate general linear model). Differences were considered significant when p < 0.05, with a confidence interval of 95%. Analysis was performed with SPSS 17.0 (SPSS Statistics Inc., Chicago, IL, USA), and GraphPad (GraphPad, La Jolla, CA, USA) was used to plot the data with bar graphs to represent the media and standard error of the mean (SEM).
3. Results and discussion
3.1. Anthropometrical and biochemical parameters
First, we assessed anthropometrical measurements (Table 1), which reflected the metabolic alterations characteristic of type 2 diabetes. Regarding insulin metabolism parameters, type 2 diabetic patients showed higher levels of insulin, HOMA-IR index HbA1c% and glucose than our healthy subjects. Lipid metabolism perturbations were also observed, although some were attributed to statin treatment. Previous studies have demonstrated the benefits of metformin regarding different parameters, such as levels of glucose, insulin and HOMA-IR [15,19]. In accordance with such reports, metformin treatment in our type 2 diabetic patients reduced HbA1c%, thus demonstrating its capacity to decrease glycaemia and glucose-related alterations in the long term. We confirmed that age and BMI were independent factors that did not influence the rest of the data. Moreover, the differences between the groups remained when we adjusted the data for HbA1c. In order to provide information regarding the concomitant medication taken at the time by the study participants, we have included a summarized table (Table 1) which shows that there were no statistical differences between type 2 diabetic patients with or without metformin treatment.
Table 1.
Anthropometric and biochemical parameters of control subjects and type 2 diabetic patients treated or not with metformin.
| Control | T2D | T2D-metformin | Age and BMI-corrected p value | HbA1c% corrected p value | |
|---|---|---|---|---|---|
| n | 101 | 48 | 93 | ||
| Male% | 45 | 47.92 | 55 | ||
| Age (years) | 45 ± 10 | 60 ± 11* | 60 ± 9* | – | |
| BMI (Kg/m2) | 24.83 ± 4.42 | 29.59 ± 5.31* | 29.70 ± 4.62* | – | |
| Waist circumference (cm) | 82.69 ± 13.49 | 100.34 ± 13.06* | 102.38 ± 11.21* | * | * |
| Waist-Hip index | 0.83 ± 0.09 | 0.93 ± 0.08* | 0.96 ± 0.07* | * | * |
| SBP (mm Hg) | 122 ± 20.33 | 142.74 ± 20.61* | 139.16 ± 14.59* | * | * |
| DBP (mm Hg) | 74.54 ± 12.07 | 81.58 ± 11.75* | 79.33 ± 9.82* | * | * |
| Insulin (μUI/mL) | 7.42 ± 5.18 | 16.58 ± 9.37* | 16.37 ± 12.11* | * | * |
| HOMA-IR | 1.67 ± 1.28 | 5.56 ± 4.06* | 5.27 ± 4.25* | * | * |
| HbA1c (%) | 5.27 ± 0.30 | 7.16 ± 1.56* | 6.66 ± 0.69#* | * | – |
| Glucose (mg/dL) | 89.60 ± 10.71 | 135.48 ± 40.53* | 131.40 ± 32.87* | * | * |
| cholesterol (mg/dL) | 194.28 ± 34.77 | 175.43 ± 39.77* | 168.21 ± 38.56* | * | * |
| HDL(mg/dL) | 56.15 ± 14.11 | 46.73 ± 12.81* | 44.34 ± 10.59* | * | * |
| LDL(mg/dL) | 118.30 ± 28.78 | 104.38 ± 33.53* | 97.06 ± 33.54* | * | * |
| VLDL(mg/dL) | 14.5 (11.75–23) | 20.5 (15–30)* | 24 (18–33.75)* | * | * |
| CT/HDL | 3.44 ± 1.02 | 3.98 ± 1.19 | 3.94 ± 1.12 | * | * |
| Triglycerides (mg/dL) | 73 (58.5–116) | 102 (76–150)* | 127 (92–169.83)* | * | * |
| Non-HDL Cholesterol | 138.12 ± 33.64 | 129.67 ± 36.66 | 123.86 ± 37.38* | * | * |
Mean±standard deviations are shown in the table for normally distributed data, while the median and the 25th and 75th quartiles are displayed for non-normally distributed data. Comparisons between groups were made with ANOVA and the Tukey post-test. Non-normally distributed data were compared with the Kolmogorov-Smirnov test. The influence of age, BMI and HbA1c was tested and corrected with the multivariate linear model correction. *p < 0.05 vs control and †p < 0.05 vs type 2 diabetes.
3.2. The effect of type 2 diabetes and metformin on ETC complexes and mitochondrial oxidative balance in isolated PBMCs
We assessed levels of the different ETC proteins and of a voltage-dependent anion channel (VDAC) (Fig. 1). VDAC expression did not change in any of the groups (Fig. 1A). ETC complexes, with the exception of complex IV, were affected in a similar way: their expression was reduced in PBMCs from type 2 diabetic patients (Fig. 1B–F), while in PBMCs from metformin-treated type 2 diabetic patients levels were comparable to those in healthy subjects' PBMCs (Fig. 1B–F). In accordance with these results, type 2 diabetes has been related to an impairment of mitochondrial complexes in studies with animal models [21], and in subsarcolemmal mitochondria of type 2 diabetic patients’ right atrial tissue [22].
Fig. 1.

Protein expression of ETC complexes and mitochondrial ROS production in type 2 diabetic patients and control subjects. (A–F). Bar graphs show measurements of the ETC complexes relativized to VDAC protein levels and to an internal control. Representative WB images are shown. Quantification was performed with at least 20 samples for each group. G) Bar graph showing the median intensity of fluorescence of MitoSOX, relative to the levels of the internal control, assessed by flow cytometry. H) Representative histogram displaying the three spectra of the analysed groups. Orange histogram represents healthy subjects, blue are type 2 diabetes patients, and red represent type 2 diabetes patients + metformin. Values represent mean ± SEM. Comparisons were made with ANOVA and a Tukey post-hoc test. *p < 0.05 and **p < 0.01 vs Control; #p < 0.05 and ###p < 0.001 vs type 2 diabetes. (For interpretation of the references to colour in this figure legend, the reader is referred to the Web version of this article.)
Moreover, we observed that mitochondria from PBMCs of type 2 diabetic patients had more ROS than those of control subjects, and that treatment with metformin restored mitochondrial ROS levels (Fig. 1G and H), which reflects the findings of previous research [15,20]. Importantly, excessive levels of ROS can lead to the activation of inflammatory pathways [17]. Hence, we hypothesize that metformin diminishes leukocyte activation through the reduction of ROS production and mitochondrial fission - as observed in animal studies [25] - or through AMPK activation [23,24].
The accumulation of ROS impairs mitochondrial functionality due to the generation of mtDNA mutations and the accumulation of dysfunctional and “mitophagy-resistant” mitochondria [26,27]. As a consequence, the accumulation of dysfunctional mitochondria is related to decreased insulin sensitivity and impaired β-cell insulin synthesis and secretion [28].
3.3. Mitophagy markers are altered in PBMCs from type 2 diabetic patients and metformin reverses these effects
We next explored whether there was an impairment of mitophagy by measuring the protein expression of several markers of mitophagy and mitochondrial biogenesis (Fig. 2). The protein levels of PINK1 and Parkin (Fig. 2 A, B) were reduced in PBMCs from type 2 diabetic patients. In metformin-treated patients, the expression of PINK1, Parkin and NBR1 (Fig. 2C) was significantly higher than in untreated patients. Protein levels of BNIP3L/NIX (Fig. 2D) did not differ among the three groups. In line with these data, a significant downregulation of PINK1 transcripts has been observed in skeletal muscle biopsies obtained from type 2 diabetic patients [35], and reduced mRNA expression of mitofusin 2 (MFN2), Parkin and PINK1 has been reported in patients with diabetic nephropathy [29].
Fig. 2.

Protein levels of mitophagy and mitochondrial biogenesis-related proteins in PBMCs from type 2 diabetic patients and control subjects. Protein levels relative to the actin signal of the mitophagy proteins PINK1 (A), Parkin (B), NBR1 (C) and BNIP3L/NIX (D) are shown. Mitochondrial biogenesis-related proteins mTFA and PGC1α are shown in plots E and F, respectively. P-AMPK total and relative levels are displayed in blots G and H. Representative images of the WB experiments are shown for each assessed protein. Values in the bar charts represent mean ± SEM. Quantification was performed using at least 20 samples for each group. Comparisons were made with ANOVA and a Tukey post-hoc test. *p < 0.05 vs Control; #p < 0.05 and ##p < 0.01 vs type 2 diabetes.
In addition, we evaluated levels of mTFA (Fig. 2E) and observed a non-significant increase of this protein's expression in type 2 diabetic patients, which was reduced by metformin treatment. Furthermore, we analysed PGC1α and observed that its levels were markedly decreased in PBMCs from type 2 diabetic patients, while those from metformin-treated patients displayed a significant increase (Fig. 2F). A similar decrease has been observed in the vastus lateralis of type 2 diabetic patients when compared with controls with no family history of diabetes mellitus [30]. It is important to highlight that a decrease in the expression of PGC1α-responsive genes involves a decrease in the expression of ETC genes [30]. Regarding the observed effect of metformin on PGC1α expression, our results are in line with those of Aatsinki et al. [31] and Suwa et al. [32], who demonstrated that metformin increases PGC1α protein levels and oxidative enzyme activity in hepatic and skeletal muscle, possibly via AMPK phosphorylation,.
In order to explore this putative mechanism, we assessed the levels of total and phosphorylated AMPK (Fig. 2G and H) in PBMCs from type 2 diabetic patients and controls. Levels of both proteins were reduced in PBMCs from type 2 diabetic patients. PBMCs from metformin-treated patients presented AMPK and P-AMPK levels similar to those of healthy patients.
3.4. Metformin modulates mitochondrial morphology in PBMCs from type 2 diabetic patients
In comparison with those from healthy subjects, PBMCs from type 2 diabetics presented larger mitochondria with increased area (Fig. 3A) and perimeter (Fig. 3B), and reduced circularity (Fig. 3C). These results might appear to be in conflict with those previously reported in type 2 diabetes, which supported an increase in mitochondrial fission [15]. However, the increase in mitochondrial size can be explained by the formation of megamitochondria, swollen “mitophagy and fission-resistant” mitochondria that are a result of enhanced mitochondrial dysfunction [33,34]. Such altered mitochondria have been previously reported in pancreatic β cells from rats with type 2 diabetes, and also in podocytes from murine and in vitro models of type 2 diabetes [35,36]. Aspect ratio (Fig. 3D) and roundness (Fig. 3E), which indicate the interconnection between mitochondria, did not change significantly between our type 2 diabetic patients and controls. Metformin reversed the changes in area and perimeter and increased the roundness and circularity compared with the non-treated groups (representative TEM images of each group are shown in Fig. 3F). These features can be observed in the representative images. The beneficial effects of metformin are in line with those reported by Wang et al. [37], who demonstrated that metformin preserves mitochondrial structure in hepatocytes from high-fat diet (HFD)-fed mice.
Fig. 3.

Morphological analysis of mitochondria isolated from PBMCs from type 2 diabetic patients and control subjects. TEM images were analysed with ImageJ. Area (A), perimeter (B), circularity (C), aspect ratio (D) and roundness (E) were measured in at least 100 mitochondria for each group. (F) Representative images are shown below the bars. Arrows point to mitochondria characteristic of each group. Values in the bar graphs represent the mean ± SEM. Comparisons were made with ANOVA and a Tukey post-hoc test. *p < 0.05 and ***p < 0.001 vs Control; ###p < 0.001 vs type 2 diabetes.
3.5. Metformin reduces TNFα and IL-6 in type 2 diabetic patients
We next explored TNFα and IL-6, markers of the inflammatory condition in type 2 diabetes (Fig. 4), and found that the levels of both (Fig. 4 A, B) were increased in serum from type 2 diabetic patients. In metformin-treated patients, the levels of TNFα and IL-6 were significantly lower than those in subjects not receiving metformin. Given that these cytokines are proinflammatory, our findings provide further evidence of the role of inflammation in the development of type 2 diabetes. In fact, the enhanced release of TNF-α from leukocytes after activation by oxidative stress may inhibit insulin signalling and impair glucose uptake [38]. These results are in accordance with those of a previous study in which metformin treatment was associated with significantly lower levels of various pro-inflammatory cytokines in the systemic circulation of type 2 diabetic patients [39].
Fig. 4.

Serum levels of TNFα (A) and IL-6 (B) measured with a Luminex® 200 analyzer system following the Milliplex® MAP Kit manufacturer's procedure. Comparisons were made with ANOVA and a Tukey post-hoc test. *p < 0.05 and ***p < 0.001 vs Control; #p < 0.05 vs type 2 diabetes.
4. Conclusion
Our findings highlight the beneficial effects of metformin in the context of type 2 diabetes, in which it ameliorates the mitochondrial dysfunction and deregulation of mitochondrial complex levels and mitophagy that characterise this condition, avoiding, in turn, their possible clinical implications.
Author contributions
Conceptualization: V.M.V and M.R.; Methodology, A.M.M, P.D.P., F.C., N.D.M., Z.A.J; Resources: C.M., V.M.V., M.R.; Data curation: A.M.M, P.D.P., F.C., S.L.D., V.M.V.; Writing-Original Draft: A.M.M and P.D.P.; Writing-Review and Editing: N.A., T.V., V.M.V, and M.R.; Visualization: A.M.M., P.D.P., S.L.D., and Z.A.J.; Supervision: N.A., C.M., V.M.V and R.M; Project administration: V.M.V, M.R.; Funding acquisition: V.M.V., M.R.
Technical assistance
We thank Rosa Falcón for her technical assistance and Brian Normanly (University of Valencia/CIBERehd) for his editorial assistance.
Guaranteers name
Víctor M. Víctor and Milagros Rocha.
Funding
This study was financed by grants PI19/00838, PI19/0437 and CIBERehd CB06/04/0071 by Carlos III Health Institute and by the European Regional Development Fund (ERDF‘‘A way to build Europe’’); UGP-15-220 by FISABIO; PROMETEO/2019/027 by Ministry of Health of the Valencian Regional Government.
Declaration of competing interest
The authors declare no conflict of interests.
Footnotes
Supplementary data to this article can be found online at https://doi.org/10.1016/j.redox.2022.102342.
Contributor Information
Milagros Rocha, Email: milagros.rocha@uv.es.
Víctor M. Víctor, Email: victor.victor@uv.es.
Appendix A. Supplementary data
The following are the Supplementary data to this article:
References
- 1.Magliano D.J., Islam R.M., Barr E.L.M., Gregg E.W., Pavkov M.E., Harding J.L., et al. Trends in incidence of total or type 2 diabetes: systematic review. BMJ. 2019 Sep 11;366:l5003. doi: 10.1136/bmj.l5003. [DOI] [PMC free article] [PubMed] [Google Scholar]
- 2.Lin X., Xu Y., Pan X., Xu J., Ding Y., Sun X., et al. Global, regional, and national burden and trend of diabetes in 195 countries and territories: an analysis from 1990 to 2025. Sci. Rep. 2020 Sep 8;10(1):14790. doi: 10.1038/s41598-020-71908-9. [DOI] [PMC free article] [PubMed] [Google Scholar]
- 3.Lowell B.B., Shulman G.I. Mitochondrial dysfunction and type 2 diabetes. Science. 2005 Jan 21;307(5708):384–387. doi: 10.1126/science.1104343. [DOI] [PubMed] [Google Scholar]
- 4.Pinti M.V., Fink G.K., Hathaway Q.A., Durr A.J., Kunovac A., Hollander J.M. Mitochondrial dysfunction in type 2 diabetes mellitus: an organ-based analysis. Am. J. Physiol. Endocrinol. Metab. 2019 Jan 2;316(2):E268–E285. doi: 10.1152/ajpendo.00314.2018. [DOI] [PMC free article] [PubMed] [Google Scholar]
- 5.Diaz-Vegas A., Sanchez-Aguilera P., Krycer J.R., Morales P.E., Monsalves-Alvarez M., Cifuentes M., et al. Is mitochondrial dysfunction a common root of noncommunicable chronic diseases? Endocr. Rev. 2020 Jun 1;41(3):491–517. doi: 10.1210/endrev/bnaa005. [DOI] [PMC free article] [PubMed] [Google Scholar]
- 6.Liang Q., Kobayashi S. Mitochondrial quality control in the diabetic heart. J. Mol. Cell. Cardiol. 2016 Jun;95:57–69. doi: 10.1016/j.yjmcc.2015.12.025. [DOI] [PMC free article] [PubMed] [Google Scholar]
- 7.Lin K.-L., Chen S.-D., Lin K.-J., Liou C.-W., Chuang Y.-C., Wang P.-W., et al. Quality matters? The involvement of mitochondrial quality control in cardiovascular disease. Front. Cell Dev. Biol. 2021;9 doi: 10.3389/fcell.2021.636295. [DOI] [PMC free article] [PubMed] [Google Scholar]
- 8.Popov L. Mitochondrial biogenesis: an update. J. Cell Mol. Med. 2020 May;24(9):4892–4899. doi: 10.1111/jcmm.15194. [DOI] [PMC free article] [PubMed] [Google Scholar]
- 9.Palikaras K., Lionaki E., Tavernarakis N. Mechanisms of mitophagy in cellular homeostasis, physiology and pathology. Nat. Cell Biol. 2018 Sep;20(9):1013–1022. doi: 10.1038/s41556-018-0176-2. [DOI] [PubMed] [Google Scholar]
- 10.Eiyama A., Okamoto K. PINK1/Parkin-mediated mitophagy in mammalian cells. Curr. Opin. Cell Biol. 2015 Apr;33:95–101. doi: 10.1016/j.ceb.2015.01.002. [DOI] [PubMed] [Google Scholar]
- 11.Marinković M., Šprung M., Novak I. Dimerization of mitophagy receptor BNIP3L/NIX is essential for recruitment of autophagic machinery. Autophagy. 2021 May;17(5):1232–1243. doi: 10.1080/15548627.2020.1755120. [DOI] [PMC free article] [PubMed] [Google Scholar]
- 12.Herzig S., Shaw R.J. AMPK: guardian of metabolism and mitochondrial homeostasis. Nat. Rev. Mol. Cell Biol. 2018 Feb;19(2):121–135. doi: 10.1038/nrm.2017.95. [DOI] [PMC free article] [PubMed] [Google Scholar]
- 13.Laker R.C., Drake J.C., Wilson R.J., Lira V.A., Lewellen B.M., Ryall K.A., et al. Ampk phosphorylation of Ulk1 is required for targeting of mitochondria to lysosomes in exercise-induced mitophagy. Nat. Commun. 2017 Sep 15;8(1):548. doi: 10.1038/s41467-017-00520-9. [DOI] [PMC free article] [PubMed] [Google Scholar]
- 14.Foretz M., Guigas B., Viollet B. Understanding the glucoregulatory mechanisms of metformin in type 2 diabetes mellitus. Nat. Rev. Endocrinol. 2019 Oct;15(10):569–589. doi: 10.1038/s41574-019-0242-2. [DOI] [PubMed] [Google Scholar]
- 15.de Marañón A.M., Canet F., Abad-Jiménez Z., Jover A., Morillas C., Rocha M., et al. Does metformin modulate mitochondrial dynamics and function in type 2 diabetic patients? Antioxidants Redox Signal. 2021 Aug 10;35(5):377–385. doi: 10.1089/ars.2021.0019. [DOI] [PubMed] [Google Scholar]
- 16.Bhansali S., Bhansali A., Dhawan V. Metformin promotes mitophagy in mononuclear cells: a potential in vitro model for unraveling metformin's mechanism of action. Ann. N. Y. Acad. Sci. 2020 Mar 1;1463(1):23–36. doi: 10.1111/nyas.14141. [DOI] [PubMed] [Google Scholar]
- 17.Apostolova N., Iannantuoni F., Gruevska A., Muntane J., Rocha M., Victor V.M. Mechanisms of action of metformin in type 2 diabetes: effects on mitochondria and leukocyte-endothelium interactions. Redox Biol. 2020 May 25;34 doi: 10.1016/j.redox.2020.101517. [DOI] [PMC free article] [PubMed] [Google Scholar]
- 18.Bhansali S., Bhansali A., Dutta P., Walia R., Dhawan V. Metformin upregulates mitophagy in patients with T2DM: a randomized placebo‐controlled study. J. Cell Mol. Med. 2020 Mar;24(5):2832–2846. doi: 10.1111/jcmm.14834. [DOI] [PMC free article] [PubMed] [Google Scholar]
- 19.van Stee M.F., de Graaf A.A., Groen A.K. Actions of metformin and statins on lipid and glucose metabolism and possible benefit of combination therapy. Cardiovasc. Diabetol. 2018 Jun 30;17(1):94. doi: 10.1186/s12933-018-0738-4. [DOI] [PMC free article] [PubMed] [Google Scholar]
- 20.Diaz-Morales N., Iannantuoni F., Escribano-Lopez I., Bañuls C., Rovira-Llopis S., Sola E., et al. Does metformin modulate endoplasmic reticulum stress and autophagy in type 2 diabetic peripheral blood mononuclear cells? Antioxidants Redox Signal. 2018 Jun 10;28(17):1562–1569. doi: 10.1089/ars.2017.7409. [DOI] [PubMed] [Google Scholar]
- 21.Yokota T., Kinugawa S., Hirabayashi K., Matsushima S., Inoue N., Ohta Y., et al. Oxidative stress in skeletal muscle impairs mitochondrial respiration and limits exercise capacity in type 2 diabetic mice. Am. J. Physiol. Heart Circ. Physiol. 2009 Sep 1;297(3):H1069–H1077. doi: 10.1152/ajpheart.00267.2009. [DOI] [PubMed] [Google Scholar]
- 22.Croston T.L., Thapa D., Holden A.A., Tveter K.J., Lewis S.E., Shepherd D.L., et al. Functional deficiencies of subsarcolemmal mitochondria in the type 2 diabetic human heart. Am. J. Physiol. Heart Circ. Physiol. 2014 Jul 1;307(1):H54–H65. doi: 10.1152/ajpheart.00845.2013. [DOI] [PMC free article] [PubMed] [Google Scholar]
- 23.Zhou G., Myers R., Li Y., Chen Y., Shen X., Fenyk-Melody J., et al. Role of AMP-activated protein kinase in mechanism of metformin action. J. Clin. Invest. 2001 Oct;108(8):1167–1174. doi: 10.1172/JCI13505. [DOI] [PMC free article] [PubMed] [Google Scholar]
- 24.Cheng J.-T., Huang C.-C., Liu I.-M., Tzeng T.-F., Chang C.J. Novel mechanism for plasma glucose-lowering action of metformin in streptozotocin-induced diabetic rats. Diabetes. 2006 Mar;55(3):819–825. doi: 10.2337/diabetes.55.03.06.db05-0934. [DOI] [PubMed] [Google Scholar]
- 25.Wang Q., Zhang M., Torres G., Wu S., Ouyang C., Xie Z., et al. Metformin suppresses diabetes-accelerated atherosclerosis via the inhibition of Drp1-mediated mitochondrial fission. Diabetes. 2017 Jan;66(1):193–205. doi: 10.2337/db16-0915. [DOI] [PMC free article] [PubMed] [Google Scholar]
- 26.Scherz-Shouval R., Shvets E., Fass E., Shorer H., Gil L., Elazar Z. Reactive oxygen species are essential for autophagy and specifically regulate the activity of Atg4. EMBO J. 2007 Apr 4;26(7):1749–1760. doi: 10.1038/sj.emboj.7601623. [DOI] [PMC free article] [PubMed] [Google Scholar]
- 27.Lemasters J.J. Variants of mitochondrial autophagy: Types 1 and 2 mitophagy and micromitophagy (Type 3) Redox Biol. 2014 Jun 12;2:749–754. doi: 10.1016/j.redox.2014.06.004. [DOI] [PMC free article] [PubMed] [Google Scholar]
- 28.Petersen K.F., Befroy D., Dufour S., Dziura J., Ariyan C., Rothman D.L., et al. Mitochondrial dysfunction in the elderly: possible role in insulin resistance. Science. 2003 May 16;300(5622):1140–1142. doi: 10.1126/science.1082889. [DOI] [PMC free article] [PubMed] [Google Scholar]
- 29.Czajka A., Ajaz S., Gnudi L., Parsade C.K., Jones P., Reid F., et al. Altered mitochondrial function, mitochondrial DNA and reduced metabolic flexibility in patients with diabetic nephropathy. EBioMedicine. 2015 Jun 1;2(6):499–512. doi: 10.1016/j.ebiom.2015.04.002. [DOI] [PMC free article] [PubMed] [Google Scholar]
- 30.Patti M.E., Butte A.J., Crunkhorn S., Cusi K., Berria R., Kashyap S., et al. Coordinated reduction of genes of oxidative metabolism in humans with insulin resistance and diabetes: potential role of PGC1 and NRF1. Proc. Natl. Acad. Sci. U. S. A. 2003 Jul 8;100(14):8466–8471. doi: 10.1073/pnas.1032913100. [DOI] [PMC free article] [PubMed] [Google Scholar]
- 31.Aatsinki S.-M., Buler M., Salomäki H., Koulu M., Pavek P., Hakkola J. Metformin induces PGC-1α expression and selectively affects hepatic PGC-1α functions. Br. J. Pharmacol. 2014 May;171(9):2351–2363. doi: 10.1111/bph.12585. [DOI] [PMC free article] [PubMed] [Google Scholar]
- 32.Suwa M., Egashira T., Nakano H., Sasaki H., Kumagai S. Metformin increases the PGC-1alpha protein and oxidative enzyme activities possibly via AMPK phosphorylation in skeletal muscle in vivo. J. Appl. Physiol. Bethesda Md. 1985;101(6):1685–1692. doi: 10.1152/japplphysiol.00255.2006. 2006 Dec. [DOI] [PubMed] [Google Scholar]
- 33.Tandler B., Hoppel C.L., Mears J.A. Morphological pathways of mitochondrial Division. Antioxidants. 2018 Feb;7(2):30. doi: 10.3390/antiox7020030. [DOI] [PMC free article] [PubMed] [Google Scholar]
- 34.Wakabayashi T. Megamitochondria formation - physiology and pathology. J. Cell Mol. Med. 2002;6(4):497–538. doi: 10.1111/j.1582-4934.2002.tb00452.x. [DOI] [PMC free article] [PubMed] [Google Scholar]
- 35.Woo C.-Y., Kc R., Kim M., Kim H.S., Baek J.Y., Koh E.H. Autophagic flux defect in diabetic kidney disease results in megamitochondria formation in podocytes. Biochem. Biophys. Res. Commun. 2020 Jan 15;521(3):660–667. doi: 10.1016/j.bbrc.2019.10.132. [DOI] [PubMed] [Google Scholar]
- 36.Ma Z., Wirström T., Borg L.A.H., Larsson-Nyrén G., Hals I., Bondo-Hansen J., et al. Diabetes reduces β-cell mitochondria and induces distinct morphological abnormalities, which are reproducible by high glucose in vitro with attendant dysfunction. Islets. 2012 Jun;4(3):233–242. doi: 10.4161/isl.20516. [DOI] [PMC free article] [PubMed] [Google Scholar]
- 37.Wang Y., An H., Liu T., Qin C., Sesaki H., Guo S., et al. Metformin improves mitochondrial respiratory activity through activation of AMPK. Cell Rep. 2019 Nov;29(6):1511–1523. doi: 10.1016/j.celrep.2019.09.070. e5. [DOI] [PMC free article] [PubMed] [Google Scholar]
- 38.Gonzalez F., Rote N.S., Minium J., Kirwan J.P. Reactive oxygen species-induced oxidative stress in the development of insulin resistance and hyperandrogenism in polycystic ovary syndrome. J. Clin. Endocrinol. Metab. 2006;91:336–340. doi: 10.1210/jc.2005-1696. 2006. [DOI] [PubMed] [Google Scholar]
- 39.Amoani B., Sakyi S.A., Mantey R., Laing E.F., Ephraim R.D., Sarfo-Katanka O., Koffie S., Obese E., Afranie B.O. Increased metformin dosage suppresses pro-inflammatory cytokine levels in systemic circulation and might contribute to its beneficial effects. J. Immunoassay Immunochem. 2021;42(3):252–264. doi: 10.1080/15321819.2020.1862861. [DOI] [PubMed] [Google Scholar]
Associated Data
This section collects any data citations, data availability statements, or supplementary materials included in this article.