Abstract
We used a quantitative PCR method targeting 16S ribosomal DNA using competitive PCR for specific detection of indigenous Pseudomonas DNA in soil hot spots. The amount of Pseudomonas DNA corresponded to the number of culturable Pseudomonas bacteria on Gould’s S1 agar. This represents the first use of PCR for quantification of indigenous bacteria in more than one sample of soil.
It is a well-established fact that only a small fraction of environmental bacterial communities can be cultivated by current techniques. As a consequence, doubt has been raised that results obtained with traditional agar plating are representative of the actual processes in nature. Among the methods that have been suggested for studying the unculturable fraction of indigenous bacterial communities, some of the most prominent are based on nucleic acids. Extraction and purification of DNA from soil have come in focus (7, 18), and now commercial kits based on recent techniques are successfully marketed (1).
As a means of quantifying unculturable bacterial populations, competitive PCR (cPCR) is promising. cPCR employs the highly sensitive PCR and bypasses quantification problems caused by differences in the exponential PCR amplification of DNA by using an internal standard (4). The internal standard is a competitive DNA template which shares two primers and thus is coamplified in competition with specific DNA sequences in the sample. Since the lengths of the fragments differ, amplification products from the internal standard and sample DNAs are readily separated on a gel.
Competitive PCR has been used in, e.g., marine environments (14), but soil poses problems, as it is heterogeneous and consists of large amounts of inhibitory compounds, so reproducible results are more difficult to obtain. Lee et al. (13) added 16S ribosomal DNA from strain EA25 to soil and could thereafter quantify it by cPCR with good correlation. Lechner and Conrad (12) compared cPCR with traditional cultivation techniques for estimation of hydrogenase-containing bacteria in one rice rhizosphere sample and obtained approximately the same enumeration result by cPCR and cultivation in a single sample. Hallier-Soulier et al. (6) monitored introduced toluene degraders by CFU counting and cPCR with xylE in sterilized soil. They found no clear correlation between CFU counting and DNA. Rosado et al. (15) likewise found varying correlation between a DNA assay (most-probable-number PCR) and CFU counting of introduced bacteria in soil. Hence, only one study (12) has applied it for detection of indigenous bacteria in one soil sample, and no study has provided a comparison between quantitative PCR and traditional cultivation techniques for detection and quantification of indigenous bacterial population dynamics in soil.
Our purpose was to assess the reproducibility and appropriateness of competitive PCR in soil ecosystems for quantification of an indigenous Pseudomonas population in a soil hot spot. The hot spots were excised bits of young barley roots submerged in soil and monitored during degradation. This report presents, for the first time, a tight association between the number of culturable bacteria and the DNA of indigenous bacteria in soil.
PCR mixtures.
Each PCR tube contained a total volume of 46 μl, with 33.4 μl of twice-distilled water, 4.5 μl of 10× Ampli Taq PCR buffer (Perkin-Elmer Cetus, Norwalk, Conn.), 0.2 μl of each primer (in a 0.1 mM solution), 4.5 μl of 1% DNase-free bovine serum albumin (Pharmacia, Uppsala, Sweden), 2 μl of Gene Amp 10 mM deoxynucleoside triphosphate mixture (Perkin-Elmer), 0.2 μl of Ampli Taq polymerase (Perkin-Elmer), and 1 μl of template DNA. cPCRs contained 1 μl of internal standard and 1 μl of sample as templates. All primers (Table 1) were Gibco BRL custom primers of desalted purity purchased from Life Technologies, Roskilde, Denmark.
TABLE 1.
Primers used in this study
| Primer | Sequencea |
|---|---|
| 9-27 | 5′ GAG TTT GAT CCT GGC TCA G 3′ |
| PSMG | 5′ CCT TCC TCC CAA CTT 3′ |
| Intern1R | 5′ CTG ACT CGA TGC GTA ACC TAG GCT CAT CTG 3′ |
| Intern 2 | 5′ TAC GCA TCG AGT CAG GAT GAT CAG CCA CAC 3′ |
Sequences in boldface are “sticky ends” used for construction of the internal standard.
Specific PCR amplification.
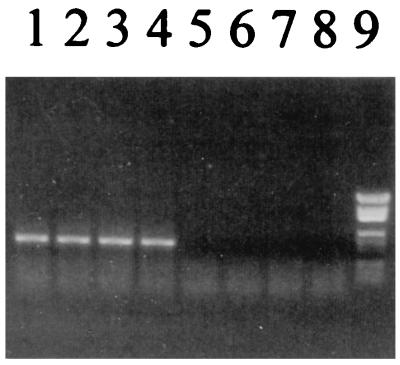
To ensure PCR amplification specific for Pseudomonas DNA, a Pseudomonas-specific primer set should be found. Probe PSMG (2) was reported to be Pseudomonas specific, and we checked the specificity of the Pseudomonas primer again on 1 August 1998 (11). The second primer was 9-27 (16). This sequence is one of several specific for eubacterial DNA conveniently placed 445 bp upstream of PSMG, hence giving Pseudomonas-specific amplification. In order to test if amplification using these two primers was specific, a panel of Fast Soil DNA (Bio 101, Vista, Calif.)-purified DNAs from seven strains were used for PCR (6 min at 94°C; 35 cycles of 30 s at 92°C, 30 s at 52.5°C, and 1 min at 68°C; 6 min at 68°C; and final cooling at 4°C). The PCR tubes were placed in the PCR machine after the temperature had reached 94°C. The organisms used were Pseudomonas aeruginosa DSM50071, P. putida DSM50208, P. fluorescens biovar I DSM50090, P. fluorescens biovar V DSM50148, Vibrio vulnificus DSM10143, Aeromonas hydrophila DSM30016, and Corynebacterium glutamicum DSM20300. The V. vulnificus strain has 16S sequences closest to PSMG (differing in 2 of 15 bases). The amplification proved specific for the strains tested (Fig. 1).
FIG. 1.
Test for specific PCR amplification with PSMG as a Pseudomonas-specific primer. Lanes: 1, P. aeruginosa; 2, P. putida; 3, P. fluorescens I; 4, P. fluorescens V; 5, V. vulnificus; 6, A. hydrophila; 7, C. glutamicum; 8, no template DNA; 9, pGEM ladder (fragment sizes [from the top], 2,645, 1,605, 1,198, 676, 517, 460, 396, 350, 222, 179, 126, and 75 bp).
Construction of an internal standard.
In order to get an internal standard, a shorter fragment with the same primers in the end was constructed as described by Hallier-Soulier et al. (6). Essentially, two primers within the fragment spanning 9-27 and PSMG in P. aeruginosa DSM50071 were constructed (Intern1R and Intern2) (Table 1). The primers also had a 15-bp overlapping region, where the sequences were complementary. The two outer fragments were amplified (9-27 plus Intern1R and Intern2 plus PSMG), and the products were mixed and PCR amplified with 9-27 and PSMG as primers. Gel electrophoresis confirmed the presence of one band of the correct size, and the remaining PCR product was purified by the use of a QIAquick PCR Purification Kit (Qiagen GmbH, Hilden, Germany) as described by the manufacturer. Tenfold dilutions of the internal standard were prepared and amplified with DNA from P. aeruginosa DSM50071. Products of the correct sizes were made, indicating that the cPCR system worked. DNA from a soil Pseudomonas strain, JAJ137 (8), was purified by Fast Soil DNA and mixed with the internal standard in different mixtures as described by Suzuki and Giovannoni (16). The ratio of JAJ137 DNA to internal-standard DNA was the same in the PCR products as in the template (data not shown). This suggests that the relative efficiencies of amplification of the template and the internal standard were the same (16). DNA was quantified (A260) on a Shimadzu UV-240 Graphicord UV–visible-light recording spectrophotometer.
DNA purification from soil samples.
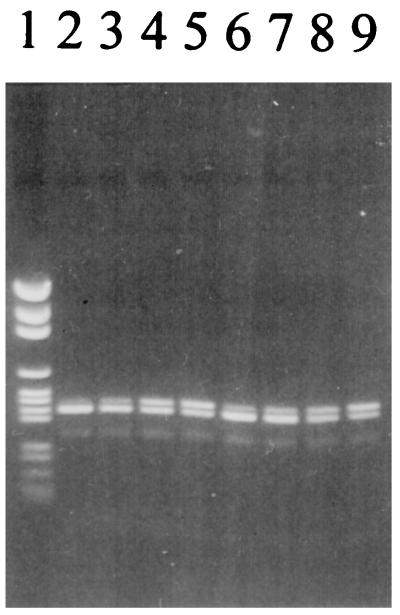
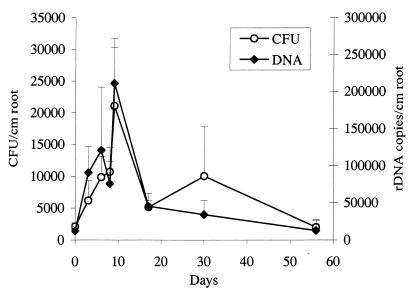
The Fast Soil DNA purification kit was used in accordance with the manufacturer’s instructions. However, cell lysis by the Fast Prep machine was replaced by three freeze-thaw cycles with 15 s of vortexing after each thawing. Samples likely to represent high and low levels of Pseudomonas DNA in the sample set were then subjected to PCR with a 10-fold dilution of the internal standard to find the appropriate DNA level range. Twofold dilutions of the internal standard were made and used as competitive template DNA in the PCR tests. An example is shown in Fig. 2. Results for four samples per sampling day were assessed, and average values for each day are shown in Fig. 3 (assuming 100% efficiency of DNA extraction from the soil). The numbers of culturable Pseudomonas CFU on Gould’s S1 agar, which is known to be Pseudomonas specific (5, 9, 10), are also depicted in Fig. 3 (17). The two methods give strikingly similar results. Considering all of the soil samples tested during the 56 days point by point, there is a coefficient of correlation (r2) between CFU numbers and DNA amounts of 0.60, corresponding to a level of significance of P > 0.001 in a product moment correlation coefficient analysis (3). Thus, our results demonstrate the ability of a competitive PCR to quantify DNA in soil reproducibly, even though both the DNA content and the number of culturable bacteria only varied within approximately 1 order of magnitude. Furthermore, the results show that culturability dependent methods, in some cases, are as suitable as molecular methods for describing soil microbial ecology.
FIG. 2.
Example of a gel with products of a cPCR. Lanes: 1, pGEM ladder (fragment sizes, 2,645, 1,605, 1,198, 676, 517, 460, 396, 350, 222, 179, 126, and 75 bp); 2 to 5, twofold dilution series with sample +B, day 3; 6 to 9, twofold dilution series with sample +B, day 6.
FIG. 3.
Comparison of numbers of CFU on Gould’s S1 agar specific for Pseudomonas and copies of PSMG-amplified DNA (assuming 100% extraction efficiency from the soil) specific for Pseudomonas. Error bars represent standard deviations. Samples are excised bits of young barley roots submerged in soil and monitored during degradation. Soil was incubated at 10°C for 56 days, and agar plates were incubated at 20°C for 3 days (17). rDNA, ribosomal DNA.
Acknowledgments
This study was supported by Danish Biotechnological Research and Development Program grant 9502015. Kaare Johnsen’s stay in Bergen was partly funded by NorFa (Nordisk Forskerutdanningsakademi).
We thank laboratory technician Frida Lise Daae for skillful help in the laboratory.
REFERENCES
- 1.Borneman J, Skroch P W, O’Sullivan K M, Palus J A, Rumjanek N G, Jansen J L, Nienhuis J, Triplett E W. Molecular microbial diversity of an agricultural soil in Wisconsin. Appl Environ Microbiol. 1996;62:1935–1943. doi: 10.1128/aem.62.6.1935-1943.1996. [DOI] [PMC free article] [PubMed] [Google Scholar]
- 2.Braun-Howland E B, Vescio P A, Nierzwicki-Bauer S A. Use of a simplified cell blot technique and 16S rRNA-directed probes for identification of common environmental isolates. Appl Environ Microbiol. 1993;59:3219–3224. doi: 10.1128/aem.59.10.3219-3224.1993. [DOI] [PMC free article] [PubMed] [Google Scholar]
- 3.Campbell R C. Statistics for biologists. Cambridge, United Kingdom: Cambridge University Press; 1989. [Google Scholar]
- 4.Ferre F. Quantitative or semi-quantitative PCR: reality versus myth. PCR Methods Appl. 1992;2:1–9. doi: 10.1101/gr.2.1.1. [DOI] [PubMed] [Google Scholar]
- 5.Gould W D, Hagedorn C, Bardinelli T R, Zablotowicz R M. New selective media for enumeration and recovery of fluorescent pseudomonads from various habitats. Appl Environ Microbiol. 1985;49:28–32. doi: 10.1128/aem.49.1.28-32.1985. [DOI] [PMC free article] [PubMed] [Google Scholar]
- 6.Hallier-Soulier S, Ducrocq V, Mazure N, Truffaut N. Detection and quantification of degradative genes in soils contaminated by toluene. FEMS Microbiol Ecol. 1996;20:121–133. [Google Scholar]
- 7.Jacobsen C S. Microscale detection of specific bacterial DNA in soil with a magnetic capture-hybridization and PCR amplification assay. Appl Environ Microbiol. 1995;61:3347–3352. doi: 10.1128/aem.61.9.3347-3352.1995. [DOI] [PMC free article] [PubMed] [Google Scholar]
- 8.Johnsen K, Andersen S, Jacobsen C S. Phenotypic and genotypic characterization of phenanthrene-degrading fluorescent Pseudomonas biovars. Appl Environ Microbiol. 1996;62:3818–3825. doi: 10.1128/aem.62.10.3818-3825.1996. [DOI] [PMC free article] [PubMed] [Google Scholar]
- 9.Johnsen K, Nielsen P. Diversity of Pseudomonas strains isolated with King’s B and Gould’s S1 agar determined by REP-PCR, 16S rDNA sequencing and FT-IR characterisation. FEMS Microbiol Lett. 1999;173:155–162. doi: 10.1111/j.1574-6968.1999.tb13497.x. [DOI] [PubMed] [Google Scholar]
- 10.Kragelund L, Leopold K, Nybroe O. Outer membrane protein heterogeneity within Pseudomonas fluorescens and P. putida and use of an OprF antibody as a probe for rRNA homology group I pseudomonads. Appl Environ Microbiol. 1996;62:480–485. doi: 10.1128/aem.62.2.480-485.1996. [DOI] [PMC free article] [PubMed] [Google Scholar]
- 11.Larsen, N., and T. Marsh. 1 August 1998, revision date. Unpublished data. [Online.] ttp://www.cme.msu.edu/RDP. [1 August 1998, last date accessed.]
- 12.Lechner S, Conrad R. Detection in soil of aerobic hydrogen-oxidizing bacteria related to Alcaligenes eutrophus by PCR and hybridization assays targeting the gene of the membrane-bound (NiFe) hydrogenase. FEMS Microbiol Ecol. 1997;22:193–206. [Google Scholar]
- 13.Lee S-Y, Bollinger J, Bezdicek D, Ogram A. Estimation of the abundance of an uncultured soil bacterial strain by a competitive quantitative PCR method. Appl Environ Microbiol. 1996;62:3787–3793. doi: 10.1128/aem.62.10.3787-3793.1996. [DOI] [PMC free article] [PubMed] [Google Scholar]
- 14.Leser T D. Quantitation of Pseudomonas sp. strain B13(FR1) in the marine environment by competitive polymerase chain reaction. J Microbiol Methods. 1995;22:249–262. [Google Scholar]
- 15.Rosado A S, Seldin L, Wolters A C, van Elsas J D. Quantitative 16S rDNA-targeted polymerase chain reaction and oligonucleotide hybridization for the detection of Paenobacillus azotofixans in soil and the wheat rhizosphere. FEMS Microbiol Ecol. 1996;19:153–164. [Google Scholar]
- 16.Suzuki M T, Giovannoni S J. Bias caused by template annealing in the amplification of mixtures of 16S rRNA genes by PCR. Appl Environ Microbiol. 1996;62:625–630. doi: 10.1128/aem.62.2.625-630.1996. [DOI] [PMC free article] [PubMed] [Google Scholar]
- 17.Thirup, L. Unpublished results.
- 18.Torsvik V L. Isolation of bacterial DNA from soil. Soil Biol Biochem. 1980;12:15–21. [Google Scholar]


