The note below updates results in the corrected proof publication of this article [van den Berg, Schechter-Perkins, Jack et al. Effectiveness of 3 Versus 6 ft of Physical Distancing for Controlling Spread of Coronavirus Disease 2019 Among Primary and Secondary Students and Staff: A Retrospective, Statewide Cohort Study. Clin Infect Dis https://doi.org/10.1093/cid/ciab230]. The updated analysis does not change the conclusion of the original manuscript, and continues to support the main finding that there was not a substantial difference in SARS-CoV-2 case rates among students or staff in districts that adopted a 3 versus 6 feet minimum physical distancing policy for students.
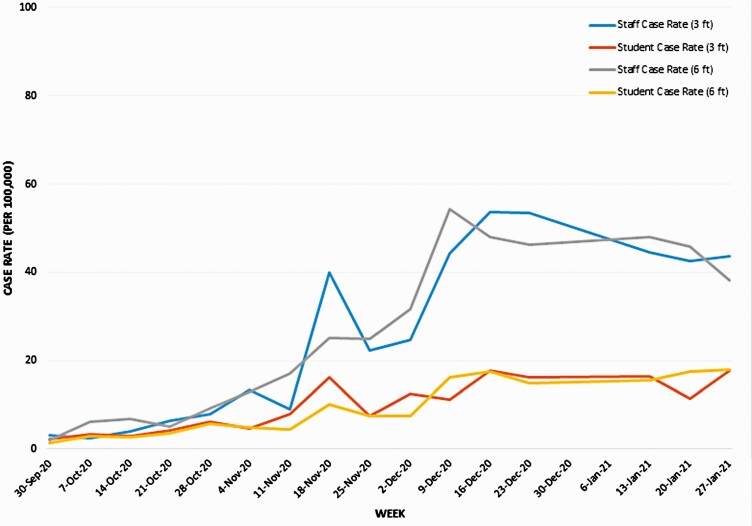
Figure 1.
Incidence of coronavirus disease cases among students and school staff, by physical distancing (3 or 6 ft), reported to Massachusetts’s Department of Elementary and Secondary Education during the first 16 weeks of the 2020–2021 academic year.
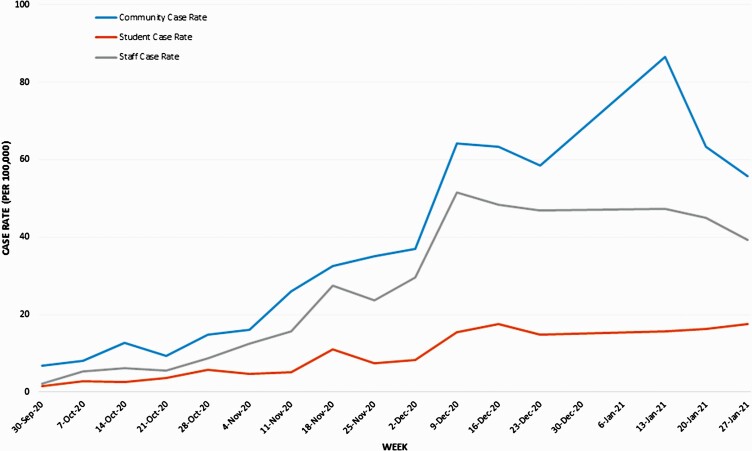
Figure 2.
Incidence of coronavirus disease 2019 cases among students and school staff reported to Massachusetts’s Department of Elementary and Secondary Education during the first 16 weeks of the 2020–2021 academic year and community incidence of COVID-19 from USAFacts [19].
The original paper uses data from Massachusetts to study the relationship between physical distancing policy in schools and COVID-19 case rates among students and school staff during the early part of the 2020-21 school year, prior to the state-wide policy change announced in early 2021 mandating an option for full, in-person learning for all students. District weeks with low in-person enrollment, defined as <5% of students participating in any type of in-person learning were excluded from the analysis. The conclusion of the paper was that choice of 3 versus 6 feet of distance did not significantly impact COVID-19 rates in students or staff.
Subsequent to publication, the authors received updated data on student enrollment by mode for 3 of the biweekly periods. The original data for these periods had contained an error affecting a subset of districts. The change in the data affects approximately 5% of district-weeks in the analysis; 9 of the original 3625 district weeks are excluded in the updated analysis due to in-person enrollments below the authors’ cutoff. Below, the authors present updated versions of the figures and tables in the paper. The changes are minor. Full replication code and updated data are available here.
Table 1.
Daily Incidence of Coronavirus Disease 2019 Among Students and School Staff Participating in In-Person Instruction in Massachusetts, as Reported to the Department of Elementary and Secondary Education
| Week End Date | Daily Cases per 100 000 by Physical Distancing Requirement | |||
|---|---|---|---|---|
| Students | Staff | |||
| ≥6 ft | ≥3 ft | ≥6 ft | ≥3 ft | |
| 2020 | ||||
| 30 Sep | 1.38 | 2.17 | 2.09 | 3.23 |
| 7 Oct | 2.90 | 3.26 | 6.26 | 2.42 |
| 14 Oct | 2.61 | 2.95 | 6.89 | 4.03 |
| 21 Oct | 3.59 | 4.32 | 5.19 | 6.47 |
| 28 Oct | 5.86 | 6.21 | 9.29 | 7.91 |
| 4 Nov | 4.81 | 4.67 | 12.85 | 13.47 |
| 11 Nov | 4.54 | 7.96 | 17.13 | 8.98 |
| 18 Nov | 10.12 | 16.12 | 25.06 | 39.86 |
| 25 Nov | 7.56 | 7.59 | 24.84 | 22.36 |
| 2 Dec | 7.54 | 12.46 | 31.73 | 24.62 |
| 9 Dec | 16.25 | 11.28 | 54.30 | 44.31 |
| 16 Dec | 17.58 | 17.64 | 48.03 | 53.78 |
| 23 Dec | 14.92 | 16.19 | 46.32 | 53.36 |
| 2021 | ||||
| 13 Jan | 15.65 | 16.48 | 48.10 | 44.59 |
| 20 Jan | 17.49 | 11.46 | 45.90 | 42.65 |
| 27 Jan | 18.01 | 17.63 | 38.14 | 43.64 |
Table 2.
Distribution of Infection Control Interventions Implemented in Massachusetts Public Schools With Any In-Person Instruction
| Infection Control Intervention | Districts, No. | Students, No.a | Staff, No.a | ||||
|---|---|---|---|---|---|---|---|
| All Districts | ≥6-ft Distancing | ≥3-ft Distancing | All Districts | ≥6-ft Distancing | ≥3-ft Distancing | ||
| School modelb | |||||||
| High on-campus enrollment | 90 | 186 587 | 122 925 | 55 289 | 27 415 | 18 880 | 8123 |
| Lower on-campus enrollment | 161 | 329 413 | 260 544 | 62 375 | 71 975 | 58 160 | 11 740 |
| Elementary, middle, and high school all in same model | 188 | 434 679 | 319 728 | 101 667 | 82 907 | 64 118 | 16 823 |
| Universal maskingc | |||||||
| Among all staff | 251 | 516 000 | 383 469 | 117 665 | 99 390 | 77 040 | 19 863 |
| Among all students | 251 | 516 000 | 383 469 | 117 665 | 99 390 | 77 040 | 19 863 |
| Physical distancing | |||||||
| ≥6 ft | 194 | 383 469 | 383 469 | … | 77 040 | 77 040 | … |
| ≥3 ft | 48 | 117 665 | … | 117 665 | 19 863 | … | 19 863 |
| Other (4–5 ft) | 9 | 14 866 | … | … | 2487 | … | … |
| Enhanced cleaning protocold | 218 | 426 686 | 335 351 | 76 469 | 78 290 | 62 521 | 13 282 |
| Cohorting (any) | 214 | 464 208 | 348 973 | 100 751 | 88 264 | 69 486 | 16 605 |
| Mandatory symptom screens before entering school buildings | 223 | 470 887 | 359 517 | 99 670 | 91 428 | 72 832 | 16 533 |
| Ventilation interventionse | 205 | 415 989 | 325 921 | 75 331 | 76 539 | 60 891 | 13 189 |
| Surveillance testing | 5 | 6908 | 6180 | 728 | 2307 | 2181 | 126 |
| Universal vaccination policyf | 251 | 516 000 | 383 469 | 117 665 | 99 390 | 77 040 | 19 863 |
| District demographic variablesg | |||||||
| Children aged 5–17 y in poverty, % | 10.47 | 10.24 | 12.13 | … | … | … | |
| Student race, % | |||||||
| White | 65.26 | 65.10 | 64.09 | … | … | … | |
| Black | 6.97 | 7.36 | 5.76 | … | … | … | |
| Asian | 7.58 | 7.91 | 6.34 | … | … | … | |
| Other | 4.23 | 4.32 | 3.909 | … | … | … | |
| Hispanic | 15.99 | 15.33 | 19.93 | … | … | … | |
Data represent no. (%) of students or staff, unless otherwise specified.
High on-campus enrollment is defined as districts with an average of ≥80% of their total enrolled students participating in on-campus instruction throughout the time period. Lower on-campus enrollment is defined as districts with an average of <80% of enrolled students participating in on-campus instruction.
During the study period, universal masking among staff and students in grades 2 and higher was a prerequisite for approval to open schools, according to the Massachusetts Department of Elementary and Secondary Education. Many districts opted to require (69.7%) or strongly recommend (26.3%) masking among students in younger grade levels.
Cleaning protocols were variably defined but were recorded if the district reported any enhanced protocols beyond usual practices.
Ventilation interventions were highly heterogeneous and included requirements to open windows, purchase of high-efficiency particulate air filters, plans for heating, ventilation, and air conditioning upgrades, and plans to move classrooms to outdoor spaces.
Universal influenza vaccination for all students was mandated in the state of Massachusetts during the fall of 2020. The requirement was later waived owing to low rates of influenza during the 2020–2021 influenza season.
Demographic variables obtained from the National Center for Education Statistics at the district level [18].
Table 3.
Regression and Sensitivity Analysesa
| Districts With Physical Distancing ≥6 ft | IRR for Students (95% CI) | IRR for Staff (95% CI) | ||
|---|---|---|---|---|
| Unadjusted | Adjustedb | Unadjusted | Adjustedb | |
| All districts (3616 district-weeks)c | .846 (0.575–1.324) | .842 (0.603–1.317) | .989 (0.733–1.335) | 1.015 (0.755–1.366) |
| Adjusted for district demographics (3603 district-weeks)d | .691 (0.465–1.02) | .709 (0.487–1.01) | .901 (0.663–1.226) | .915 (0.669–1.252) |
| Excluding districts with surveillance testing (3545 district-weeks)c | .832 (0.568–1.22) | .827 (0.594–1.15) | .971 (0.721–1.307) | .997 (0.743–1.338) |
| Versus distancing <6 ft (3754 district-weeks)e | .932 (0.644–1.34) | .904 (0.662–1.23) | 1.096 (0.818–1.468) | 1.104 (0.830–1.468) |
Abbreviations: CI, confidence interval; IRR, incidence rate ratio
All regressions were adjusted for week. Standard errors were adjusted for clustering by school district.
Adjusted for community incidence by week.
The referent group was districts with 3 ft of physical distancing.
Demographic variables included in the model included the percentages of total enrolled students who were black, Hispanic, Asian, or other (including Native American, Native Alaskan, Native Hawaiian, Pacific Islander, ≥2 races, unknown, and other rate), and the percentage of children aged 5–17 years in poverty. One district was missing poverty data and was dropped from the regression analysis.
The referent group was districts with <6 ft of physical distancing.


