Abstract
The purpose of this study was to develop a virtual imaging framework that simulates a new photon-counting CT (PCCT) system (NAEOTOM Alpha, Siemens). The PCCT simulator was built upon the DukeSim platform, which generates projection images of computational phantoms given the geometry and physics of the scanner and imaging parameters. DukeSim was adapted to account for the geometry of the PCCT prototype. To model the photon-counting detection process, we utilized a Monte Carlo-based detector model with the known properties of the detectors. We validated the simulation platform against experimental measurements. The images were acquired at four dose levels (CTDIvol of 1.5, 3.0, 6.0, and 12.0 mGy) and reconstructed with three kernels (Br36, Br40, Br48). The experimental acquisitions were replicated using our developed simulation platform. The real and simulated images were quantitatively compared in terms of image quality metrics (HU values, noise magnitude, noise power spectrum, and modulation transfer function). The clinical utility of our framework was demonstrated by conducting two clinical applications (COPD quantifications and lung nodule radiomics). The phantoms with relevant pathologies were imaged with DukeSim modeling the PCCT systems. Different imaging parameters (e.g., dose, reconstruction techniques, pixel size, and slice thickness) were altered to investigate their effects on task-based quantifications. We successfully implemented the acquisition and physics attributes of the PCCT prototype into the DukeSim platform. The discrepancy between the real and simulated data was on average about 2 HU in terms of noise magnitude, 0.002 mm−1 in terms of noise power spectrum peak frequency and 0.005 mm−1 in terms of the frequency at 50% MTF. Analysis suggested that lung lesion radiomics to be more accurate with reduced pixel size and slice thickness. For COPD quantifications, higher doses, thinner slices, and softer kernels yielded more accurate quantification of density-based biomarkers. Our developed virtual imaging platform enables systematic comparison of new PCCT technologies as well as optimization of the imaging parameters for specific clinical tasks.
Keywords: Computed Tomography, CT simulator, Photon-counting CT, DukeSim, Virtual clinical trial, Virtual imaging trials, XCAT, CT Quantifications, COPD, Radiomics
1. INTRODUCTION
Photon-counting CT (PCCT) is an emerging technology that has the potential of improving image quality and reducing radiation dose to patients, compared with conventional energy-integrating CT systems, thereby improving diagnosis and management of patients. This technology is currently in its investigational phase and requires comprehensive assessments for optimized use for various clinical tasks. These assessments are limited if only patient and physical phantom images are utilized. Physical phantoms do not represent various patient anatomies or clinical abnormalities, and patient images lack definite knowledge of ground-truth in terms of anatomy or physiology. In addition, the magnitude of these datasets is limited as currently, there are not many PCCT systems available. These assessments can alternatively be pursued through realistic medical imaging simulations that accurately model the imaging chain, including models of patient populations and imaging scanners. [1]
The purpose of this study was to develop a virtual imaging framework that simulates a new, state-of-the-art photon-counting system (NAEOTOM Alpha, Siemens). The developed CT simulator was validated against experimental measurements. To demonstrate the clinical utilities of this computational framework, we performed initial trials focusing on chronic obstructive pulmonary disease (COPD) quantifications and lung nodule radiomics.
2. MATERIALS AND METHODS
2.1. Simulator development
The PCCT simulator was built upon our DukeSim platform [2, 3], which generates projection images of computational phantoms by combining primary (through ray-tracing) and scatter (through Monte Carlo [4]) signals, given the desired geometry, physics of the source and detector, and acquisition parameters. In this work, DukeSim was adapted to account for the acquisition geometry of the NAEOTOM Alpha with detector pixel sizes of 0.4 mm at the isocenter. To model the photon-counting detection process, we utilized a Monte Carlo-based detector response model with the known material (CdTe) and geometry of the systems’ detectors. The response model consisted of a poly-energetic vector for quantum efficiency (per detector energy threshold), a poly-energetic vector for charge sharing between 3x3 neighboring pixels (per detector energy threshold), and a spatio-energetic covariance matrix for modeling correlated noise between signals acquired at different detector energy thresholds across 3x3 neighboring pixels.
For each detector pixel with a set of n detector energy thresholds, the average (noise-free) detected signal vector of M(det)1xn was calculated as
where Ntr(E)i,j is the transmitted photon counts for the 3x3 neighboring pixels (calculated by the ray-tracing and Monte Carlo modules), and R(E, tn)i,j is the probability of an incident photon at an Energy bin of E being detected at the 3x3 neighboring pixels of i,j at the detector energy threshold of tn. The noise associated with the detected signal was modeled with a covariance matrix of K(det)nxn
where Cov(E, ta, tb)i,j is the spatio-energetic covariance between incident counts at the energy thresholds of ta and tb for the 3x3 neighboring pixels of i,j. The noise was then estimated using multivariate gaussian random variables with the mean vector of M(det)1xn and covariance matrix of K(det)nxn. For the image reconstruction, the projection images were input to a water calibration and beam hardening correction module and then input to vendor-specific reconstruction software (ReconCT, Siemens).
2.2. Simulator validation
We validated the accuracy of the DukeSim simulations against experimental measurements using the NAEOTOM Alpha scanner installed at Duke University. We imaged an ACR (Gammex) phantom with detector thresholds of 20 and 65 keV, at 120 kV, dose levels (CTDIs of 1.5 to 24 mGy), beam collimations of 144x0.4 mm, a pitch of 0.8, and a rotation time of 0.5 seconds. The acquired projection images were used to reconstruct both threshold images and 70 keV virtual monoenergetic images using ReconCT with an inplane pixel size of 0.4 mm and a slice thickness of 0.4 mm. The reconstruction algorithm was Quantum Iterative Reconstruction (QIR) with kernels of Br36, Br40, and Br48.
The experimental acquisitions were replicated using our developed virtual simulation platform. A computational model of the ACR phantom was generated and input to DukeSim. The simulator was set to mimic the NAEOTOM Alpha scanner acquisition geometry and physics, simulating imaging conditions similar to the experimental acquisitions. The real and simulated images were quantitatively compared in terms of image quality metrics such as HU values, noise characteristics (magnitude and noise power spectrum), and spatial resolution (modulation transfer function).
2.3. VIT application
To demonstrate the clinical utility of this developed virtual framework, we studied two clinical applications (COPD quantifications and lung nodule radiomics) where PCCT scanners have the potential to improve the quantification and characterizations. XCAT computational phantoms [5-7] were used as virtual patients in the studies. The phantoms, including the relevant pathologies (COPD [8] and lung nodules), were imaged with DukeSim modeling the NAOETOM scanner. Different imaging parameters (radiation dose, reconstruction algorithm and kernel, pixel size, and slice thickness) were altered to investigate their effects on image quantifications. The objective was to identify the imaging parameters that optimize the accuracy of task-based quantifications, defined separately for each clinical task. The image quality metrics were density-based for COPD characterizations [9] and morphological radiomics features for lung nodule assessments [10]. These task-based metrics were extracted from the virtual CT images and compared against the digital ground truth that exists in the computational phantoms.
3. RESULTS
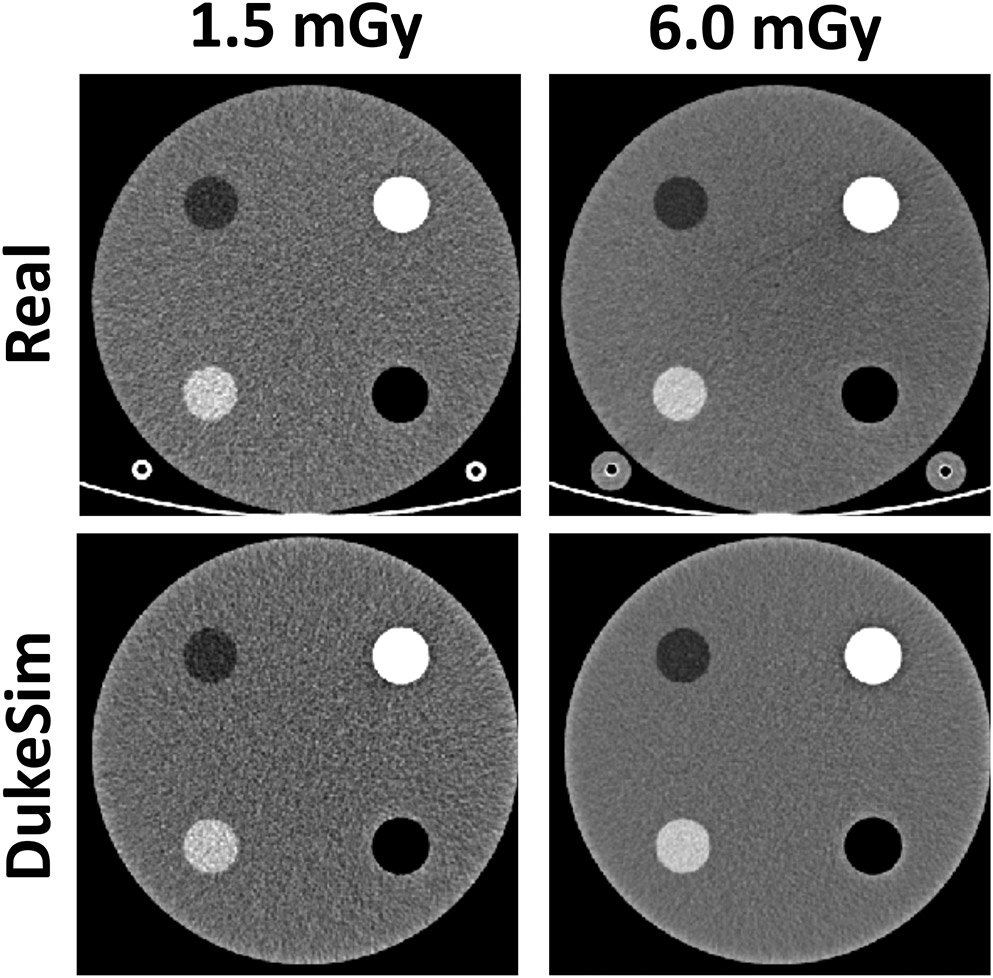
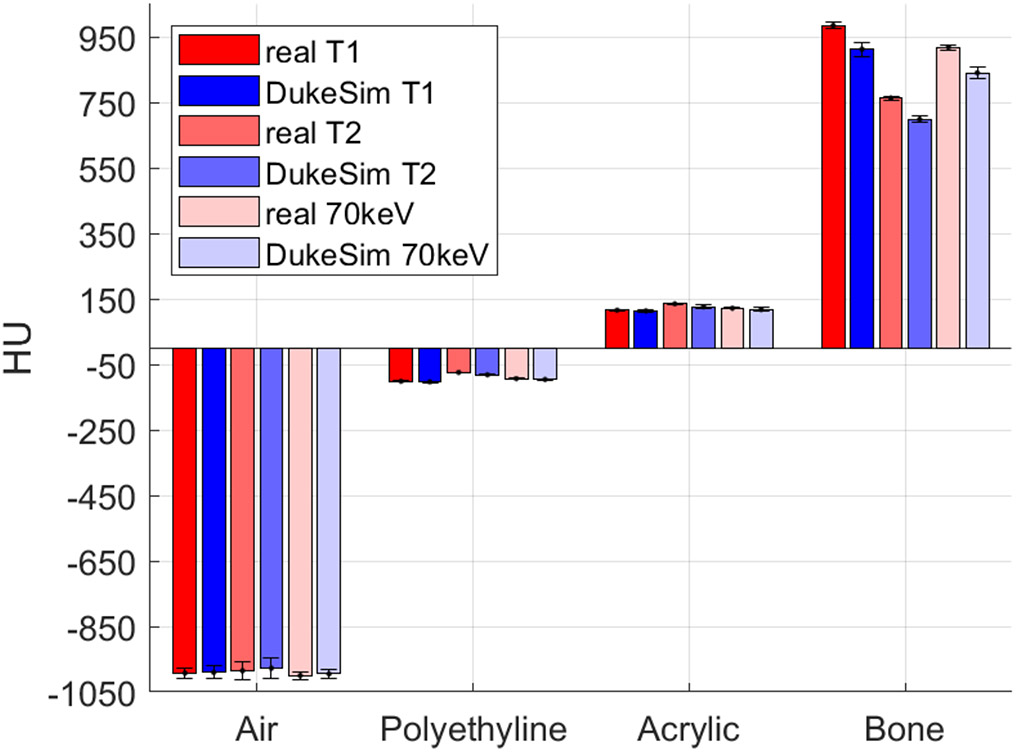
We successfully implemented the acquisition and physics attributes of the NAEOTOM Alpha into the DukeSim platform. Figure 1 shows images of an ACR phantom acquired with the NAEOTOM scanner and DukeSim. Qualitatively, the virtual images closely matched with the real images. Figure 2 shows the HU values measured in both real and simulated images. The simulated measurements closely matched the real ones with HU differences of −4.2 ± 4.5, 3.9 ± 3.6, 5.0 ± 6.3, and 71.1 ± 17.1 for the air, polyethylene, acrylic, and bone insert. The higher discrepancies in the bone insert are likely due to the mismatch of the density and elemental composition of that material since the exact values were unknown to us.
Figure 1.

Real (top row) and simulated (bottom row) images of the ACR phantom imaged at two different dose levels. Images demonstrate close visual match between the real and simulated images. Images are shown with a window level of 0 and level of 200 HU.
Figure 2.
HU values measured in both real and simulated images for two threshold images (T1 = 20 and T2 = 65 keV) and the virtual monoenergetic images at 70 keV.
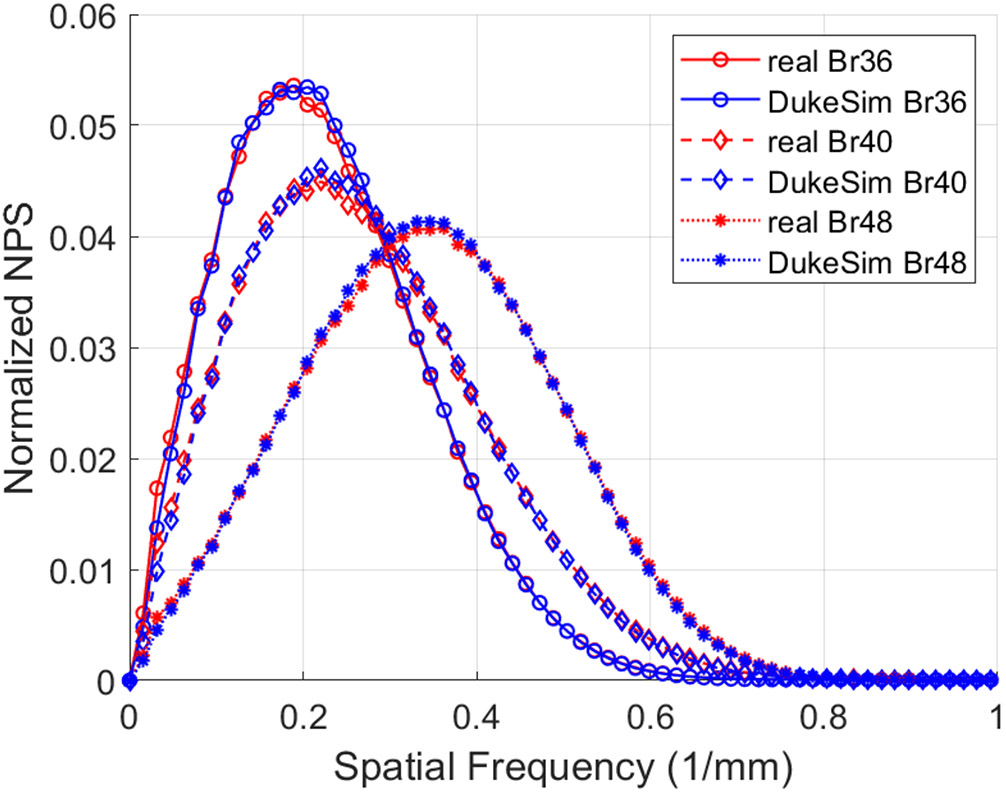
Figure 3 shows the comparison of the noise magnitude measurements across the acquired dose values and reconstruction kernels, demonstrating the close match between the real and simulated images in terms of noise magnitude (−1.6 ± 4.2 HU). Figure 4 illustrates the normalized noise power spectrum measurements in the real and simulated images across the reconstructed kernels. The difference between the real and simulated measurements was 0.002 ± 0.012 mm−1 in terms of peak frequency, showing a close match in terms of noise texture.
Figure 3.
Noise magnitude measured in real data (red) and simulated (blue) data at various dose levels (CTDIvol) and reconstruction kernels (Br36, Br40, and Br48).
Figure 4.
Normalized noise power spectrum measured in real data (red) and simulated (blue) images across multiple reconstruction kernels (Br36, Br40, and Br48).
Figure 5 shows the modulation transfer function measured in both real and simulated images across the reconstruction kernels. The simulations were done with both 1x1 and 4x4 subsampling of the source and detector area demonstrating how more sampling of the x-ray source and detector resulted in more realistic images in terms of spatial resolution. The discrepancy between the real and simulated data was 0.005 ± 0.009 in terms the frequency at 50% MTF (f50).
Figure 5.
Modulation transfer function measured in the real data (red) and simulated (blue and black) images across multiple reconstruction kernels (Br36, Br40, and Br48). The simulations were done with 1x1 and 4x4 subsampling of the source and detector area, demonstrating how more sampling of the x-ray source and detector resulted in more realistic images in terms of spatial resolution.
For the lung radiomics study, our analysis showed that morphological features were closer to the corresponding ground truth values when smaller pixel sizes (0.34 vs. 0.68 mm), smaller slice thicknesses (0.4 vs. 3.0 mm) and Q56 kernels (compared to Br56 and Bl56) were used [10]. For the COPD quantifications, we observed that higher doses (3.17 vs. 0.63 mGy), thinner slices (0.4 mm vs. 1.5 mm), and softer kernels (Br36 vs. Br48 and Br64) led to more accurate quantification of density-based biomarkers.[9]
4. CONCLUSION
We developed and validated a scanner-specific simulation platform to study a state-of-the-art clinical photon-counting scanner. We further performed two clinical studies (COPD quantifications, lung nodule radiomics) to optimize the imaging parameters of this investigational scanner for accurate characterization and quantifications of various imaging tasks. Our analysis suggested that an optimum protocol for lung lesion radiomics may have the smallest pixel size and slice thickness. For more accurate density-based COPD quantifications, higher doses, soft kernels, and thinner slices may be used. Our developed virtual imaging platform enables systematic comparison of new PCCT technologies as well as optimization of the imaging parameters for specific clinical tasks.
5. ACKNOWLEDGMENT
This study was supported in part by the National Institutes of Health (R01HL155293, P41EB028744, and R01EB001838) and Siemens. The authors acknowledge Karl Stierstofer, Martin Sedlmair, and Juan Carlos Ramirez for providing the information required to model the NAEOTOM Alpha scanner.
REFERENCES
- [1].Abadi E et al. , "Virtual clinical trials in medical imaging: a review," Journal of Medical Imaging, vol. 7, no. 4, p. 042805, 2020. [DOI] [PMC free article] [PubMed] [Google Scholar]
- [2].Abadi E, Harrawood B, Sharma S, Kapadia A, Segars WP, and Samei E, "DukeSim: a realistic, rapid, and scanner-specific simulation framework in computed tomography," IEEE transactions on medical imaging, vol. 38, no. 6, pp. 1457–1465, 2018. [DOI] [PMC free article] [PubMed] [Google Scholar]
- [3].Abadi E et al. "Development of a scanner-specific simulation framework for photon-counting computed tomography," Biomedical physics & engineering express, vol. 5, no. 5, p. 055008, 2019. [DOI] [PMC free article] [PubMed] [Google Scholar]
- [4].Sharma S, Abadi E, Kapadia A, Segars WP, and Samei E, "A GPU-accelerated framework for rapid estimation of scanner-specific scatter in CT for virtual imaging trials," Physics in Medicine & Biology, vol. 66, no. 7, p.075004, 2021. [DOI] [PMC free article] [PubMed] [Google Scholar]
- [5].Segars WP, Tsui B, Cai J, Yin F-F Fung GS, and Samei E, "Application of the 4-D XCAT Phantoms in Biomedical Imaging and Beyond," IEEE transactions on medical imaging, vol. 37, no. 3, pp. 680–692, 2018. [DOI] [PMC free article] [PubMed] [Google Scholar]
- [6].Abadi E et al. "Airways, vasculature, and interstitial tissue: anatomically informed computational modeling of human lungs for virtual clinical trials," in Medical Imaging 2017: Physics of Medical Imaging, 2017, vol. 10132: International Society for Optics and Photonics, p. 101321Q. [Google Scholar]
- [7].Abadi E, Segars WP, Sturgeon GM, Roos JE, Ravin CE, and Samei E, "Modeling lung architecture in the XCAT series of phantoms: physiologically based airways, arteries and veins," IEEE transactions on medical imaging, vol. 37, no. 3, pp. 693–702, 2017. [DOI] [PMC free article] [PubMed] [Google Scholar]
- [8].Abadi E, Jadick G, Hoffman EA, Lynch D, Segars WP, and Samei E, "COPD quantifications via CT imaging: ascertaining the effects of acquisition protocol using virtual imaging trial," in Medical Imaging 2021: Physics of Medical Imaging, 2021, vol. 11595: International Society for Optics and Photonics, p. 115950N. [Google Scholar]
- [9].Sotoudeh-Paima S, Segars WP, Samei E, and Abadi E, "Photon-counting CT versus conventional CT for COPD quantifications: intra-scanner optimization and inter-scanner assessments using virtual imaging trials," in Medical Imaging 2022: Physics of Medical Imaging, 2022, vol. 12031: International Society for Optics and Photonics. [DOI] [PMC free article] [PubMed] [Google Scholar]
- [10].McCabe C, Zarei M, Segars WP, Samei E, and Abadi E, "Optimization of imaging parameters of an investigational photon-counting CT prototype for lung lesion radiomics," in Medical Imaging 2022: Computer-Aided Diagnosis, 2022, vol. 12033: International Society for Optics and Photonicsmc. [Google Scholar]


