

Abstract
Background:
Acute increases of ≥20%+2 ng/mL (20+2 rule) over basal serum tryptase (BST) is the recommended threshold supporting a clinical diagnosis of anaphylaxis. Prospective studies have demonstrated high sensitivity for this algorithm following parenteral exposures, but specificity has not been evaluated.
Objective:
To define a serum tryptase change that distinguishes baseline variability from anaphylaxis based upon intraindividual variation in BST.
Methods:
Ninety-three subjects with atopy (N=62) or HαT (N=31) and ≥2 BST measurements were identified. Sequential BST variability measurements was modeled and threshold ratios that optimized sensitivity and/or specificity determined. Models were tested in 22 individuals with physician-diagnosed anaphylaxis, and validated in independent cohorts of individuals with HαT (N=33), ISM (N=52), and ISM+HαT (N=12). Mature tryptase levels were measured in HαT (N=19) and ISM (N=20). An online application was developed for clinical use.
Results:
Due to BST variability, 9.7% (9/93) of primary cohort patients, and 18% (6/33) of HαT, 30% (16/53) of ISM, and 25% (3/12) of ISM+HαT patients from validation cohorts met the 20+2 rule despite absent immediate hypersensitivity symptoms; mature tryptase was non-contributory among individuals with HαT or ISM at baseline. A ratio of acute tryptase/BST exceeding 1.685 provided the ‘optimized’ diagnostic rule for jointly maximizing sensitivity and specificity. Statistically significant improvement in specificity relative to the 20+2 rule was observed among individuals with elevated BST caused by HαT and ISM.
Conclusion:
Using a ratio of 1.685 (acute tryptase/BST) improves specificity of measured changes among individuals with HαT and ISM while maintaining high sensitivity for confirmation of anaphylaxis.
Keywords: anaphylaxis, mast cell activation, tryptase, hereditary alpha-tryptasemia
Introduction
Anaphylaxis is a severe systemic immediate hypersensitivity reaction caused canonically by IgE-dependent mast cell activation, degranulation and subsequent release of pre-formed mediators including histamine and mature tryptases (1, 2). Many of these mediators are short-lived, difficult to measure, or insufficiently specific to mast cells for routine use in confirming the clinical diagnosis of anaphylaxis. However, in healthy individuals tryptases are expressed almost exclusively by tissue mast cells and have been shown to rise significantly during anaphylaxis (3). Thus, the measurement of this protein, and the finding of an increase from a basal serum tryptase (BST) level by more than 20%+2ng/mL (20+2 rule) – when measured within approximately 4 hours of symptom-onset – is currently considered the diagnostic standard for confirming mast cell activation and anaphylaxis (4).
This formula appears to be sensitive following parenteral allergen exposure and is generally successful in correctly identifying individuals who are clinically presenting with anaphylaxis in this context (5, 6). However, the specificity of the 20+2 rule has not been well-studied among individuals in the absence of anaphylaxis. Because the majority of studies involving individuals without clonal myeloid neoplasms – and indeed the basis for establishing the “normal” range of BST clinically – are based upon cross-sectional population data, the lability of any given individual’s BST measurement over time remains undefined, though some studies have suggested variability may be substantial (7). Moreover, sensitivity may be limited in certain circumstances such as children with food allergy and patients with IgE-independent mast cell-mediated reactions (8–11) where acute tryptase increases may fail to meet the 20+2 rule in these patients.
In addition to systemic anaphylaxis, BST levels are often elevated in those with clonal mast cell diseases including indolent systemic mastocytosis (ISM) where they constitute a minor diagnostic criterion (12). BST levels are also elevated among individuals with hereditary alpha-tryptasemia (HαT) – a common genetic trait affecting approximately 5% of Western populations (13). Given that clonal mast cell disorders and HαT also modify the severity of anaphylaxis (14–16), establishing the variance between clinically measured BST levels and using this to define a threshold that can distinguish anaphylaxis from BST variability is important in order to correctly support the clinical diagnosis of anaphylaxis. This is of particular significance among individuals with elevated BST caused by HαT who do not have clonal mast cell disease, where the 20+2 rule may not perform optimally, and the diagnosis of anaphylaxis can be confounded by the presence of episodic symptoms such as gastrointestinal distress, autonomic instability, or subjective upper respiratory compromise which may or may not be due to mast cell degranulation (17).
Methods
Study Participants
All study participants in the primary cohorts with atopic disease, hereditary alpha-tryptasemia and anaphylaxis as well as the validation cohort of patients with indolent systemic mastocytosis (ISM) with or without HαT provided informed consent on NIH IRB-approved research protocols designed to study severe allergic inflammation and reactions, anaphylaxis, and/or mastocytosis (NCT00852943, NCT01164241, NCT00044122, NCT00001756, NCT007197190. The validation cohort of individuals with HαT provided informed consent on IRB-approved studies at UF (IRB 201702274) and/or UMMC (IRB 2019–0082). All study participants had complete history and physical examinations performed; BST measurements and tryptase genotyping by ddPCR was also performed as described below. Any patients presenting with signs or symptoms suggestive of clonal mast cell disease (18) underwent evaluation that included bone marrow aspirate and biopsy which included flow cytometric analysis for CD2 and CD25, as well as immunohistochemistry for enumeration and characterization of mast cells (KIT and tryptase), respectively. Allele-specific PCR for KIT p.D816V in peripheral blood and bone marrow was also performed in these patients. If clonal mast cell disease was identified, these patients were not included in the primary and validation cohorts characterizing BST variability, but were not excluded from the anaphylaxis test or validation cohorts. Patients on systemic corticosteroids, tyrosine or Janus kinase inhibitors, or other systemic immunomodulatory or cytoreductive therapy were no included in this study. Patients on established treatment with topical corticosteroids, calcineurin inhibitors, and/or omalizumab were included provided treatment was unchanged across all BST levels.
Total and mature serum tryptase measurements
Total and mature serum tryptase levels were measured using a commercially available ImmunoCAP assay (ThermoFisher, Waltham, MA) and enzyme-linked immunosorbent assay (19), respectively in Clinical Laboratory Improvement Amendments (CLIA) certified laboratories. The lower limit of detection for both assays is 1 ng/ml, and the normal range in serum for total tryptase is considered to be 1–11.4 ng/mL (20).
Tryptase genotyping
Genotyping of tryptase-encoding sequences at TPSAB1 and TPSB2 was accomplished as described (17). Briefly, genomic DNA was extracted using the DNEasy blood and tissue kit (Qiagen, Germantown, MD) according to the manufacturer’s instructions. Droplet digital PCR was performed on a QX200 (Bio-Rad, Hercules, CA) using a automated droplet generator and custom primer/probe sets for α- and β-tryptases sequences at TPSAB1 and/or TPSB2 employing the reference probe AP3B1 (Bio-Rad).
Statistical analysis
Modeled sensitivity was obtained by first computing the expected ratio of a pair of BST values from an individual (i.e., the ratio of larger to smaller), and its variability, using a prediction interval approach based on a square root transformation of the absolute difference between the first two BST measurements on the log scale (see online repository for details). This method allowed us to estimate the modeled specificity for any threshold ratio, using the first two BST measurements of the 93 Primary Cohort subjects known to be at baseline.
Using the same approach in subjects who had both a baseline serum tryptase value and a serum tryptase measurement obtained during physician-diagnosed anaphylaxis (Table S1), we derived modeled sensitivity estimates for any possible threshold ratio. This led to identification of a threshold ratio where sensitivity and specificity were jointly optimized, by selecting the threshold where the modeled estimates were equal. Threshold ratios that corresponded to 0.975 sensitivity and 0.975 specificity were also determined. Bootstrap based confidence intervals were computed for modeled estimates of sensitivity and specificity.
Observed (i.e., raw data) specificity and sensitivity estimates were also calculated, along with their corresponding Clopper-Pearson confidence intervals. Comparisons of the sensitivity and specificity of the 20+2 rule with the new ratio threshold rule were evaluated in Primary and Validation cohorts by exact McNemar’s tests.
Results
In order to address these questions, we identified 93 individuals in whom at least two serial BST levels were measured over the course of clinical evaluation and performed tryptase genotyping. Of these, 79 had two BST measurements, and 14 had three-to-five BST measurements. Sixty-two of these individuals had atopy and wild-type tryptase copy number (Fig. 1A), while 31 had HαT (Fig. 1B); none of the subjects included in these groups had clinical evidence of clonal mast cell disease or renal impairment.
Figure 1. Sequentially measured basal serum tryptase (BST) levels are labile.

Total tryptases in serum of (A) atopic controls and (B) individuals with hereditary alpha-tryptasemia (HαT) shown by age. BST measurements are shown using a log-scale. (C) Threshold ratios determined based upon high modeled sensitivity (red curve), specificity (blue curve) or the optimized sum of the two values (purple curve). The threshold ratio between BST values optimized for sensitivity was 1.374 (dashed black line) and for specificity was 1.868 (dashed pink line). The optimal threshold ratio maximizing both sensitivity and specificity was 1.685 (green line).
BST levels varied in both groups with a range from baseline of 0.15 – 4.9 ng/mL among atopic individuals and a range of 0.1 – 13.7 ng/mL amongst those with HαT. The median standard deviation of BST measurements was 0.495 (range 0.0902 – 3.46) for atopic controls and 1.93 (range 0.071–7.99) in HαT. However, the median standard deviation of BST measurements on the log-scale was 0.134 (range 0.022–0.761) for atopic controls and 0.118 (range 0.006–0.362) in HαT, suggesting that variation was comparable.
To establish our model, the first two sequential BST measurements for each subject were used. The percent change in BST between blood draws was substantial when compared to the lower BST value: the median change was 21.1% (range 3.1–193%) in atopic subjects and 16.7% (range 0.78–117%) in HαT. The median interval in timing between measurements was 1.1 years (Fig.1A, B). Because age and timing of samples did not appear to affect variability, these parameters were excluded from the model (see online repository).
While individuals had no symptoms of immediate hypersensitivity during basal blood draws, some individuals had chronic symptoms possibly attributable to mast cell activation. To examine this, mature tryptase levels were measured to determine whether sub-clinical mast cell degranulation was contributing to baseline variation; none of the individuals with HαT (0/19) who had additional samples available for testing had detectable mature tryptase in basal serum samples (Fig. S1).
Based on modeled sensitivity and specificity, we determined an ‘optimized’ threshold ratio identified as 1.685, where sensitivity and specificity were both estimated to be 0.944, and their sum was effectively maximized (Fig. 1C; Table 1). Simply put, an increase of 68.5% over baseline established a threshold consistent with the clinical diagnosis of anaphylaxis with approximately 0.95 sensitivity and specificity.
Table 1.
Performance comparison of threshold ratios and the 20+2 rule in distinguishing BST variability from anaphylaxis.
| Modeled data |
Observed Sensitivity |
Observed Specificity |
|||||||||
|---|---|---|---|---|---|---|---|---|---|---|---|
| Model | Sensitivity (95% CI) | Specificity (95% CI) | Anaphylaxis (95% CI) | Atopic BST (95% CI) | Primary HαT BST (95% CI) | Combined BST (95% CI) | Repeat HαT BST (95% CI) | Validation HαT BST (95% CI) | ISM BST (95% CI) | ISM + HαT BST (95% CI) | Validation + Primary + Repeat HαT BST (95% CI) |
|
| |||||||||||
| High Specificity 1.868 |
0.924 | 0.975 | 20/22=0.909 | 60/62 = 0.968 | 30/31 = 0.968 | 90/93 = 0.968 | 10/10=1.0 | 32/33 = 0.970 | 51/53 = 0.962 | 12/12 = 1.0 | 72/74=0.973 |
| (0.848–0.987) | (0.945–0.993) | (0.708–0.989) | (0.888–0.996) | (0.833–0.999) | (0.909–0.993) | (0.692–1.0) | (0.842–0.999) | (0.870–0.995) | (0.735–1.0) | (0.906–0.997) | |
| Optimized | 0.944 | 0.944 | 21/22=0.955 | 57/62 = 0.919 | 30/31 = 0.968 | 87/93 = 0.935 | 9/10 = 0.9 | 32/33 = 0.970 | 50/53 = 0.943 | 12/12 = 1.0 | 71/74=0.959 |
| 1.685 | (0.880–0.993) | (0.898–0.979) | (0.772–0.999) | (0.822–0.973) | (0.833–0.999) | (0.865–0.976) | (0.555–0.997) | (0.842–0.999) | (0.843–0.988) | (0.735–1.0) | (0.886–0.992) |
| High Sensitivity 1.374 |
0.975 | 0.765 | 22/22 = 1.0 | 48/62 = 0.774 | 26/31 = 0.839 | 74/93 = 0.796 | 8/10=0.8 | 27/33 = 0.818 | 44/53 = 0.830 | 10/12 = 0.833 | 61/74=0.824 |
| (0.933–0.998) | (0.688–0.849) | (0.846–1.0) | (0.650–0.871) | (0.663–0.945) | (0.699–0.872) | (0.444–0.975) | (0.645–0.930) | (0.702–0.919) | (0.516–0.979) | (0.718–0.903) | |
|
| |||||||||||
| 20+2 rule | N/A | N/A | 22/22 = 1.0 | 58/62 = 0.935 | 26/31 = 0.839 | 84/93 = 0.903 | 7/10 = 0.7 | 27/33 = 0.818 | 37/53 = 0.698 | 9/12 = 0.75 | 60/74=0.811 |
| (0.846–1.0) | (0.843–0.982) | (0.663–0.945) | (0.824–0.955) | (0.348–0.933) | (0.645–0.930) | (0.557–0.817) | (0.428–0.945) | (0.703–0.893) | |||
|
| |||||||||||
| P-value* | N/A | N/A | 1 | 1 | 0.125 | 0.375 | 0.5 | 0.0625 | <0.001 | 0.25 | 0.001 |
Comparing 20+2 with the optimized threshold result for the given group, Exact McNemar’s Test. Observed sensitivity and specificity are derived from case and control data. The optimized threshold ratio and observed outcomes are bolded. The modeled specificity is estimated from the prediction interval model using the combined 93 control subjects not in anaphylaxis (i.e., the probability a new control’s ratio of paired values would fall below the threshold). The modeled sensitivity is estimated analogously using the 22 cases in anaphylaxis (i.e., the probability a new case’s ratio of paired value will fall above the threshold). 95% CIs for modeled sensitivity and modeled specificity are from 5000 bootstrap samples. Bold boxes identify the high sensitivity and specificity threshold outcomes.
Because anaphylaxis is a clinical diagnosis, the pre-test probability may be quite different depending upon the antigenic and/or route of exposure. To address this statistically, we identified two additional threshold levels based upon a modeled sensitivity or specificity of 0.975. The high specificity threshold ratio – corresponding to a lower pre-test probability where a physician might think the diagnosis of anaphylaxis is less likely – was 1.868; whereas the high sensitivity threshold ratio was 1.374 – corresponding to a higher pre-test probability, where the diagnosis of anaphylaxis is more likely (Fig. 1C, Table 1).
To test the performance of these threshold ratios, we first applied these models to the original dataset. When examining only the first two sequential BST values, 9.7% (9/93) individuals would have met the 20+2 rule (4/62 Atopic Controls; 5/31 HαT) despite having no acute symptoms at the time of either blood draw (see orange boundaries in Fig. 2A and B; Table 1). Moreover, a greater percentage of individuals with HαT met the rule, suggesting higher BST levels may adversely affect the specificity of the 20+2 rule. Employing our optimized threshold ratio of 1.685, the specificity was increased with 6/93 meeting this rule; this was further reduced to 3/93 using the high specificity threshold ratio of 1.868 (Table 1). Among atopic individuals who do not have HαT, the specificities of the 20+2 rule and 1.685 ratio were similar, differing only in a single patient out of 62. However, among individuals with HαT, the respective specificity estimates were 0.84 and 0.97 for the 20+2 rule and optimized threshold ratio (Table 1).
Figure 2. An optimized threshold ratio of 1.685 demonstrates improved specificity when examining BST variability.

Comparison of two sequential BST measurements form 93 individuals shown using a linear (A) or log-scale (B). The optimized threshold ratio derived from modeled sensitivity and specificity curves of 1.685 (green) demonstrates improved specificity relative to the 20+2 rule (orange). (C) Comparison of the performance of the optimized threshold ratio (green) and the 20+2 rule (orange) in identifying physician-diagnosed anaphylaxis. Orange dashed line indicates equivalence (i.e. ratio = 1) between blood draws.
A more independent estimate of specificity was derived from a second dataset comprised of additional BST levels available from 10 HαT subjects from the same data set (Table 1; Observed Specificity, Repeat HαT BST). Using the 20+2 rule, 30% (3/10) of BST levels would have met the rule, whereas only 10% (1/10) would have been fallen within the prediction interval defined by the optimized threshold ratio of 1.685. Applying the high specificity threshold ratio of 1.868 correctly identified all 10 as being consistent with variability in BST.
Of the 22 tryptase values measured during anaphylaxis, 21 were correctly identified using the optimized 1.685 threshold ratio (Fig. S2). The 20+2 rule and high sensitivity threshold ratio of 1.374 correctly identified all 22 patients who had been diagnosed clinically with anaphylaxis (Fig. 2C, Fig. 3).
Figure 3. Performance of threshold ratios in correctly distinguishing baseline tryptase variability from acute increases during anaphylaxis.

Baseline – first two sequential BST values used for ratio; Repeat Baseline – second and third sequential BST values used for ratio; First two sequential values were used for HαT and ISM validation cohorts; Anaphylaxis – ratio of acute tryptase level during physician-diagnosed anaphylaxis to first BST measurement. The optimized threshold ratio (green line) maximizes summative sensitivity and specificity, whereas high sensitivity (black dashed line) or high specificity (pink dashed line) improve correct identification of anaphylaxis or basal variation in BST, respectively. HαT – hereditary alphatryptasemia; ISM – indolent systemic mastocytosis.
To further test our model, independent cohorts consisting of 33 individuals with HαT, 52 individuals with indolent systemic mastocytosis (ISM), and 12 individuals with both ISM and HαT (ISM+HαT) who had serial BST levels measurements were examined (Fig. 4A). Using our optimized threshold ratio to characterize individuals with only HαT, one asymptomatic individual would have been identified (Fig. 3; 4B, C), whereas using the 20+2 rule, 18% (6/33) would have met the rule (P=0.0625, Exact McNemar’s Test) (Fig. 4B, C). This difference in specificity was statistically significant when combining the Primary and Repeat HαT BST with the HαT validation cohort (P=0.001, Exact McNemar’s Test) (Table 1).
Figure 4. Sequential BST levels in validation cohorts of individuals with ISM and HαT.

BST levels of individuals with HαT (A-C), ISM (D-F), and ISM+HαT (G-I) shown by age (top). BST measurements are shown using a log-scale. Comparison of two sequential BST measurements in each group shown using a linear (middle) or log-scale (bottom), with the optimized threshold ratio of 1.685 shown in green and the 20+2 rule in orange. Orange dashed line indicates equivalence (i.e. ratio = 1) between blood draws.
The optimized threshold ratio demonstrated similar specificity when applied to sequential BST levels (Fig. 4D) among individuals with ISM where 50/53 would have correctly been characterized as baseline variability (0.943, 95% CI = [0.843, 0.988]) (Fig. 3; 4E, F). In marked contrast only 37/53 (0.698, 95% CI = [0.557, 0.817]) subjects would have fallen below the threshold set by 20+2, with 30% of individuals (16/53) demonstrating baseline variability that would have been considered consistent with mast degranulation using the 20+2 rule (P<0.001, Exact McNemar’s Test) (Table 1). Importantly, when carefully evaluating serial measurements among individuals with ISM, specificity of the optimized threshold ratio was maintained for approximately 3 years before time-dependent changes associated with ISM impacted performance (See online repository for statistical analysis and Fig. S4). A similar result was observed when considering BST variability (Fig. 4G) in patients with ISM+HαT, where 12/12 (1.0, 95% CI = [0.735, 1.0]) were correctly classified by using the optimized threshold ratio (Fig. 3; 4H, I) while baseline variability in only 9/12 (0.75, 95% CI = [0.428, 0.945]) fell within the range determined using 20+2 (P=0.25) Exact McNemar’s Test) (Table 1).
Discussion
Our data demonstrate that using an optimized threshold ratio of 1.685 when evaluating acute changes in serum tryptase improves specificity among individuals with elevated BST caused by HαT and ISM, while maintaining comparable specificity among atopic individuals without HαT and excellent sensitivity among all individuals in this study, with all relevant point estimates above 90%. Indeed, the two models are identical for individuals with a BST of 4.1 ng/mL – the median BST value of individuals without HαT and ISM. However, the 1.685 ratio performed better over the full range of BST measurements in this study (Fig. S3), and the high sensitivity threshold of 1.374 performed identically to the 20+2 rule with regard to sensitivity.
One clinical observation in this study – as reported previously by others (21) – is the striking female predominance among symptomatic individuals with HαT in both the primary and validation cohorts. A similar predominance was not observed among individuals with SM or SM+HαT. The basis for this finding remains speculative, but may relate to specific immediate hypersensitivity phenotypes observed among women (22) and reported experimentally for female mice (23), and their potential for modification by HαT.
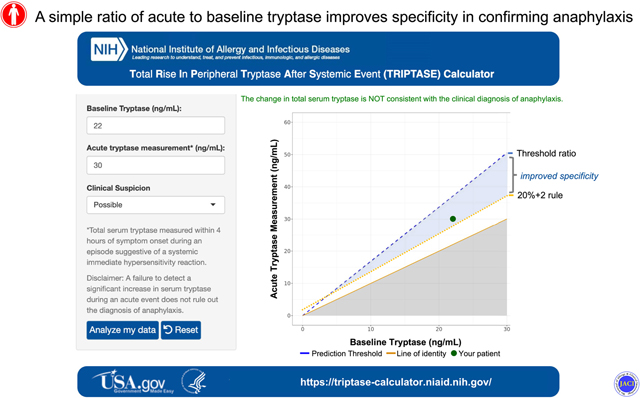
Because anaphylaxis is a clinical diagnosis, and based upon these data, we have proposed three threshold ratios based upon the clinical likelihood of this diagnosis, and as such have developed an online application: the Total Rise In Peripheral Tryptase After a Systemic Event (TRIPTASE) calculator (https://triptase-calculator.niaid.nih.gov/; see online repository for descriptive methods). This tool enables physicians to characterize the difference between two observed tryptase levels, conditioned upon the pre-test probability or clinical likelihood of anaphylaxis. Additional larger scale studies are needed to further validate and refine our new threshold ratio approach in particular by examining larger cohorts of individuals experiencing anaphylaxis including in children with food allergy and IgE-independent mast cell-mediated reactions. However, based upon the multiple cohorts that were included in this study, our approach appears to be widely applicable to all populations including HαT and ISM, where it has notably superior specificity over 20+2.
Supplementary Material
Capsule Summary:
By defining BST variability we identify an ‘optimized’ threshold ratio that improves specificity while maintaining sensitivity for detection of anaphylaxis, redefining clinically meaningful increases in serum tryptases, most notably in HαT and ISM.
Clinical Implications:
A ratio of 1.685 (acute tryptase/BST) defines a threshold change in serum tryptase that improves our ability to distinguish BST variability from anaphylaxis.
Acknowledgements
The investigators thank the patients, their families, and healthy volunteers who contributed to this research, as well as the clinical staff of the LAD, University of Florida, and University of Mississippi for their contributions.
Funding: This project was funded in whole or in part with federal funds from the Division of Intramural Research of the National Institute of Allergy and Infectious Diseases, NIH and the National Cancer Institute, National Institutes of Health, under Contract No. 75N910D00024, Task Order No. 75N91019F00130. SCG is supported by US Public Health Service Grant NIH R21DE028378. The content of this publication does not necessarily reflect the views or policies of the Department of Health and Human Services, nor does mention of trade names, commercial products, or organizations imply endorsement by the U.S. Government.
Abbreviations used:
- BST
basal serum tryptase
- HαT
hereditary alpha-tryptasemia
- ISM
indolent systemic mastocytosis
Footnotes
Conflict of interest statement: VCU receives royalties from Thermo Fisher for their tryptase test that are shared with LBS as its inventor. None of the remaining authors have relevant conflicts of interest to report.
Publisher's Disclaimer: This is a PDF file of an unedited manuscript that has been accepted for publication. As a service to our customers we are providing this early version of the manuscript. The manuscript will undergo copyediting, typesetting, and review of the resulting proof before it is published in its final form. Please note that during the production process errors may be discovered which could affect the content, and all legal disclaimers that apply to the journal pertain.
References
- 1.Turner H, Kinet JP. Signalling through the high-affinity IgE receptor Fc epsilonRI. Nature. 1999;402(6760 Suppl):B24–30. [DOI] [PubMed] [Google Scholar]
- 2.Wernersson S, Pejler G. Mast cell secretory granules: armed for battle. Nat Rev Immunol. 2014;14(7):478–94. [DOI] [PubMed] [Google Scholar]
- 3.Schwartz LB, Metcalfe DD, Miller JS, Earl H, Sullivan T. Tryptase levels as an indicator of mast-cell activation in systemic anaphylaxis and mastocytosis. N Engl J Med. 1987;316(26):1622–6. [DOI] [PubMed] [Google Scholar]
- 4.Valent P, Bonadonna P, Hartmann K, Broesby-Olsen S, Brockow K, Butterfield JH, et al. Why the 20% + 2 Tryptase Formula Is a Diagnostic Gold Standard for Severe Systemic Mast Cell Activation and Mast Cell Activation Syndrome. Int Arch Allergy Immunol. 2019;180(1):44–51. [DOI] [PMC free article] [PubMed] [Google Scholar]
- 5.Baretto RL, Beck S, Heslegrave J, Melchior C, Mohamed O, Ekbote A, et al. Validation of international consensus equation for acute serum total tryptase in mast cell activation: A perioperative perspective. Allergy. 2017;72(12):2031–4. [DOI] [PubMed] [Google Scholar]
- 6.Vitte J, Amadei L, Gouitaa M, Mezouar S, Zieleskiewicz L, Albanese J, et al. Paired acute-baseline serum tryptase levels in perioperative anaphylaxis: An observational study. Allergy. 2019;74(6):1157–65. [DOI] [PubMed] [Google Scholar]
- 7.Carter MC, Desai A, Komarow HD, Bai Y, Clayton ST, Clark AS, et al. A distinct biomolecular profile identifies monoclonal mast cell disorders in patients with idiopathic anaphylaxis. J Allergy Clin Immunol. 2018;141(1):180–8 e3. [DOI] [PMC free article] [PubMed] [Google Scholar]
- 8.Dua S, Dowey J, Foley L, Islam S, King Y, Ewan P, et al. Diagnostic Value of Tryptase in Food Allergic Reactions: A Prospective Study of 160 Adult Peanut Challenges. J Allergy Clin Immunol Pract. 2018;6(5):1692–8 e1. [DOI] [PubMed] [Google Scholar]
- 9.Wongkaewpothong P, Pacharn P, Sripramong C, Boonchoo S, Piboonpocanun S, Visitsunthorn N, et al. The utility of serum tryptase in the diagnosis of food-induced anaphylaxis. Allergy Asthma Immunol Res. 2014;6(4):304–9. [DOI] [PMC free article] [PubMed] [Google Scholar]
- 10.Finkelman FD, Khodoun MV, Strait R. Human IgE-independent systemic anaphylaxis. J Allergy Clin Immunol. 2016;137(6):1674–80. [DOI] [PMC free article] [PubMed] [Google Scholar]
- 11.Sivagnanam S, Deleu D. Red man syndrome. Crit Care. 2003;7(2):119–20. [DOI] [PMC free article] [PubMed] [Google Scholar]
- 12.Valent P, Akin C, Metcalfe DD. Mastocytosis: 2016 updated WHO classification and novel emerging treatment concepts. Blood. 2017;129(11):1420–7. [DOI] [PMC free article] [PubMed] [Google Scholar]
- 13.Lyons JJ. Hereditary Alpha Tryptasemia: Genotyping and Associated Clinical Features. Immunol Allergy Clin North Am. 2018;38(3):483–95. [DOI] [PMC free article] [PubMed] [Google Scholar]
- 14.Greiner G, Sprinzl B, Gorska A, Ratzinger F, Gurbisz M, Witzeneder N, et al. Hereditary alpha tryptasemia is a valid genetic biomarker for severe mediator-related symptoms in mastocytosis. Blood. 2020. [DOI] [PMC free article] [PubMed]
- 15.Lyons JJ, Chovanec J, O’Connell MP, Liu Y, Selb J, Zanotti R, et al. Heritable risk for severe anaphylaxis associated with increased alpha-tryptase-encoding germline copy number at TPSAB1. J Allergy Clin Immunol. 2020. [DOI] [PubMed]
- 16.Sabato V, Chovanec J, Faber M, Milner JD, Ebo D, Lyons JJ. First Identification of an Inherited TPSAB1 Quintuplication in a Patient with Clonal Mast Cell Disease. J Clin Immunol. 2018;38(4):457–9. [DOI] [PubMed] [Google Scholar]
- 17.Lyons JJ, Yu X, Hughes JD, Le QT, Jamil A, Bai Y, et al. Elevated basal serum tryptase identifies a multisystem disorder associated with increased TPSAB1 copy number. Nat Genet. 2016;48(12):1564–9. [DOI] [PMC free article] [PubMed] [Google Scholar]
- 18.Lyons JJ, Schwartz LB. Clinical Approach to a Patient with Elevated Serum Tryptase: Implications of Acute Versus Basally Elevated Levels. 1 ed. Akin C, editor: Springer, Cham; 2020. [Google Scholar]
- 19.Schwartz LB, Min HK, Ren S, Xia HZ, Hu J, Zhao W, et al. Tryptase precursors are preferentially and spontaneously released, whereas mature tryptase is retained by HMC-1 cells, Mono-Mac-6 cells, and human skin-derived mast cells. J Immunol. 2003;170(11):5667–73. [DOI] [PubMed] [Google Scholar]
- 20.Schwartz LB. Diagnostic value of tryptase in anaphylaxis and mastocytosis. Immunol Allergy Clin North Am. 2006;26(3):451–63. [DOI] [PubMed] [Google Scholar]
- 21.Giannetti MP, Weller E, Bormans C, Novak P, Hamilton MJ, Castells M. Hereditary alpha-tryptasemia in 101 patients with mast cell activation-related symptomatology including anaphylaxis. Ann Allergy Asthma Immunol. 2021. [DOI] [PubMed]
- 22.Shimabukuro TT, Cole M, Su JR. Reports of Anaphylaxis After Receipt of mRNA COVID-19 Vaccines in the US-December 14, 2020-January 18, 2021. JAMA. 2021;325(11):1101–2. [DOI] [PMC free article] [PubMed] [Google Scholar]
- 23.Hox V, Desai A, Bandara G, Gilfillan AM, Metcalfe DD, Olivera A. Estrogen increases the severity of anaphylaxis in female mice through enhanced endothelial nitric oxide synthase expression and nitric oxide production. J Allergy Clin Immunol. 2015;135(3):729–36 e5. [DOI] [PMC free article] [PubMed] [Google Scholar]
Associated Data
This section collects any data citations, data availability statements, or supplementary materials included in this article.