

Summary
Interleukin (IL)-22 is central to immune defense at barrier sites. We examined the contributions of innate lymphoid cell (ILC) and T cell-derived IL-22 during Citrobacter rodentium (C.r) infection using mice that both report Il22 expression and allow lineage-specific deletion. ILC-derived IL-22 activated STAT3 in C.r-colonized surface intestinal epithelial cells (IECs), but only temporally restrained bacterial growth. T cell-derived IL-22 induced more robust and extensive activation of STAT3 in IECs, including IECs lining colonic crypts, and T cell-specific deficiency of IL-22 led to pathogen invasion of the crypts and increased mortality. This reflected a requirement for T cell-derived IL-22 for the expression of a host-protective transcriptomic program that included AMPs, neutrophil-recruiting chemokines and mucin-related molecules, and restricted IFNγ–induced pro-inflammatory genes. Our findings demonstrate spatiotemporal differences in the production and action of IL-22 by ILCs and T cells during infection and reveal an indispenable role for IL-22–producing T cells in the protection of the intestinal crypts.
Keywords: Colonic surface IECs, Colonic crypt IECs, Citrobacter rodentium, Innate cells, CD4 T cells, AMPs, Chemokines, Mucins, IL-22, IFNγ, TNF
Graphical Abstract
eTOC blurb
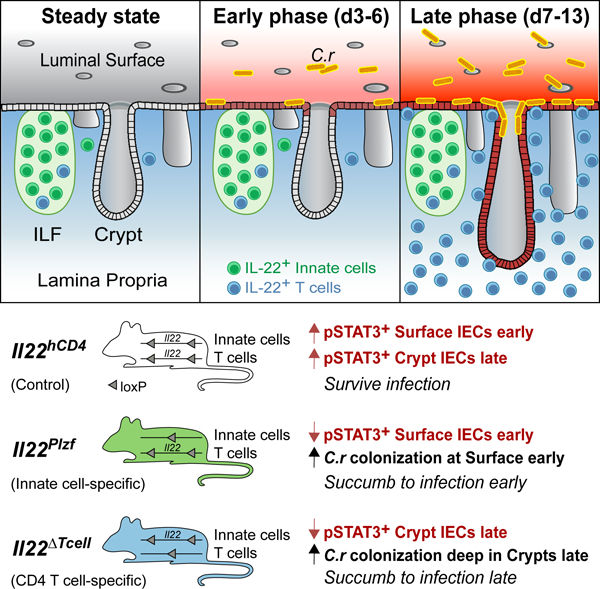
Interleukin (IL)-22–producing innate and adaptive immune cells contribute to host protection at barrier sites. Zindl et al. reveal that IL-22+ ILCs and T cells are specialized for early versus late protection of the intestinal mucosa via distinct patterns of activation of intestinal epithelial cells: actions of ILCs are limited to the superficial IECs to limit early bacterial colonization whereas, IL-22+ CD4 T cells recruited to the LP uniquely target crypt IECs to restrain bacterial spread into the colonic crypts.
Introduction
Host defense against extracellular bacteria is orchestrated by type 3 immunity, which employs cells of the innate and adaptive immune systems that share responsiveness to IL-23 and production of IL-17 family cytokines and the IL-10 family cytokine, IL-22 (Mangan et al., 2006; Sonnenberg et al., 2011a; Zheng et al., 2008). Citrobacter rodentium (C.r) is an attaching and effacing (AE) enteric pathogen that models human disease caused by enteropathogenic and enterohemorrhagic E. coli (EPEC and EHEC) (Collins et al., 2014; Mundy et al., 2005; Silberger et al., 2017). These Gram-negative bacteria use a type III secretion system to inject effectors into apical surfaces of intestinal epithelial cells (IECs), allowing them to attach and efface IEC microvilli and establish colonization (Donnenberg et al., 1997; Frankel et al., 1998). Clearance of C.r occurs when bacterial-laden IECs are shed into the lumen (Barker et al., 2008; Clevers, 2013). However, (AE) pathogens have evolved mechanisms to inhibit apoptosis and turnover of IECs to prolong colonization (Hemrajani et al., 2010; Kim et al., 2010; Nougayrède et al., 2005). Moreover, C.r manipulates host IEC metabolism for its growth and evasion from innate immune responses (Berger et al., 2017). Therefore, antigen-specific CD4 T-cell and B-cell responses are ultimately required for pathogen eradication (Bry et al., 2005; Maaser et al., 2004; Simmons et al., 2003; Vallance et al., 2002).
Histopathological hallmarks of C.r infection are elongation of crypts due to epithelial hyperplasia and goblet cell depletion (hypoplasia) in the distal colon (Berger et al., 2017; Bergstrom et al., 2008; Borenshtein et al., 2009; Chan et al., 2013; Ma et al., 2006; Papapietro et al., 2013), which is the infectious niche of C.r. Similar changes are induced by pathogenic E. coli infection of the ileum (EPEC) or transverse colon (EHEC) in humans (Croxen et al., 2013). Elongation of the crypts is thought to distance intestinal stem cells (ISCs) residing in the base of crypts from physical and metabolic damage that result from infection, thereby protecting progenitors that give rise to all IEC subsets (Kaiko et al., 2016; Liang et al., 2017; Matsuki et al., 2013; Okada et al., 2013). Infection-induced accelerated production of IEC progenitors, or transient-amplifying (TA) cells, correlates with increased shedding of C.r-laden IECs (Collins et al., 2014; Higgins et al., 1999); however, mechanisms by which IEC differentiation is altered during C.r infection are incompletely defined.
STAT3 activation is a major output of the liganded IL-22 receptor, composed of IL-22Ra1 and IL-10Rb subunits that are expressed by IECs (Lindemans et al., 2015). IL-22 signaling into IECs has been shown to be important for mucosal barrier protection and restitution of the intestinal epithelium during infection (Basu et al., 2012; Pickert et al., 2009; Wittkopf et al., 2015; Zheng et al., 2008). IL-22R signaling upregulates host defense molecules, such as antimicrobial peptides (e.g., Reg3 and S100a family members) (Liang et al., 2006; Wolk et al., 2006; Zheng et al., 2008), inflammatory reactive proteins (e.g., Lbp, Saa, complement, chemokines) (Aujla et al., 2008; Boniface et al., 2005; Hasegawa et al., 2014; Liang et al., 2010), and proteins that alter the mucus layer (e.g., Muc1, Fut2) (Pham et al., 2014; Sugimoto et al., 2008). Different types of innate cells, including ILC3s, natural killer (NK) cells, NKT cells, γδT cells and neutrophils (Cella et al., 2008, 2010; Chen et al., 2016; Colonna, 2009; Lee et al., 2012, 2015; Satpathy et al., 2013; Sonnenberg et al., 2011b, 2011a; Spits et al., 2013; Zheng et al., 2008; Zindl et al., 2013) can respond to IL-23 to produce IL-22 that acts on IECs. CD4 T cells of the Th17 pathway—Th17 and Th22— also produce IL-22, whether induced by IL-23 or TCR signaling (Akdis et al., 2012; Basu et al., 2012; Guo et al., 2014; Kim et al., 2012; Trifari et al., 2009). ILC3s are thought to be the major source of IL-22 contributed by innate cells and are crucial for early host protection (Rankin et al., 2016; Sonnenberg et al., 2011a; Spits et al., 2013). Th17 and Th22 cells contribute to IL-22 following recruitment to the intestinal mucosa later in C.r infection (Liang et al., 2006; Zheng et al., 2007) and are important for enhancing barrier protection and limiting IEC damage. (Basu et al., 2012; Silberger et al., 2017; Zenewicz et al., 2008). T cell-dependent, C.r-specific IgG is also required to eradicate virulent C.r (Kamada et al., 2015). Studies using mice with deficiency of Ahr in RORγ+ innate cells in the presence or absence of T cells shows both ILC3s and T cells contribute to antimicrobial defense during C.r infection (Song et al., 2015). However, relative contributions of IL-22+ innate cells and CD4 T cells in the context of an intact immune system including B cells and all T-cell subsets, and the mechanisms by which IL-22+ T cells control C.r infection are unclear.
We generated mice where a reporter gene (hCD4) was introduced into the Il22 gene that was also floxed to identify IL-22 producers and target deficiency of IL-22 to different cell populations. We found that IL-22–producing innate immune cells and CD4 T cells have distinct roles in activating IECs during C.r infection. Innate cell-derived IL-22 dominated the response at first, targeting superficial IECs early in infection to limit the initial wave of C.r colonization and spread. T cell-derived IL-22 was indispensable later in the response for induction of heightened and sustained STAT3 activation in both superficial and crypt IECs that prevented bacterial invasion of colonic crypts and limited bacterial dissemination as infection progressed. RNA-seq analysis of colonic IECs indicated that IL-22+ T cells mobilize multiple mechanisms that underlie their essential, non-redundant role in protecting the crypts and preserving ISCs that provide progeny for restitution of the infected intestinal epithelium.
Results
Distinct spatiotemporal distribution of IL-22+ innate and adaptive immune cells during C.r infection
Multiple immune cell types can produce IL-22 in the intestines (Basu et al., 2012; Cella et al., 2008; Colonna, 2009; Silberger et al., 2017; Sonnenberg et al., 2011a; Spits et al., 2013; Trifari et al., 2009; Zindl et al., 2013). To better characterize dynamics of the location and number of IL-22+ cells during C.r infection, we developed gene-targeted IL-22 reporter and conditional mutant mice to track and delete specific subsets of IL-22+ cells (Il22hCD4.fl mice, hereafter labeled Il22hCD4; Figures S1A–S1D). Using the reporter read-out, we found that type 3 innate lymphoid cells (ILC3s) were the dominant IL-22+ cells at steady state (Figures 1A–1E). During early C.r infection (days 3–6), mCD4+TCRβ– ILC3s (LTi cells) expressed the greatest amount of hCD4 (IL-22) (Figures 1A–1C) on a per-cell basis, albeit similar numbers of IL-22+ mCD4–TCRβ– cells (non-LTi ILC3s) were present. No change in numbers of IL-22+ ILCs was observed throughout infection, suggesting either these cells did not proliferate or alter their turnover rates during infection. This is consistent with recent reports that ILCs populate non-lymphoid tissues early in life and remain largely static (Ahlfors et al., 2014; Gasteiger et al., 2015) (Figures 1A–1B). In contrast, rapid increases in hCD4+ (IL-22+) CD4 T cells in the infected mucosa after the first week resulted in their outnumbering all IL-22+ innate cells combined, and they produced increased IL-22 on a per-cell basis compared to innate cells (Figures 1A, 1B and S1E).
Figure 1. Dynamics of IL-22 expression and cellular localization during C.r infection.
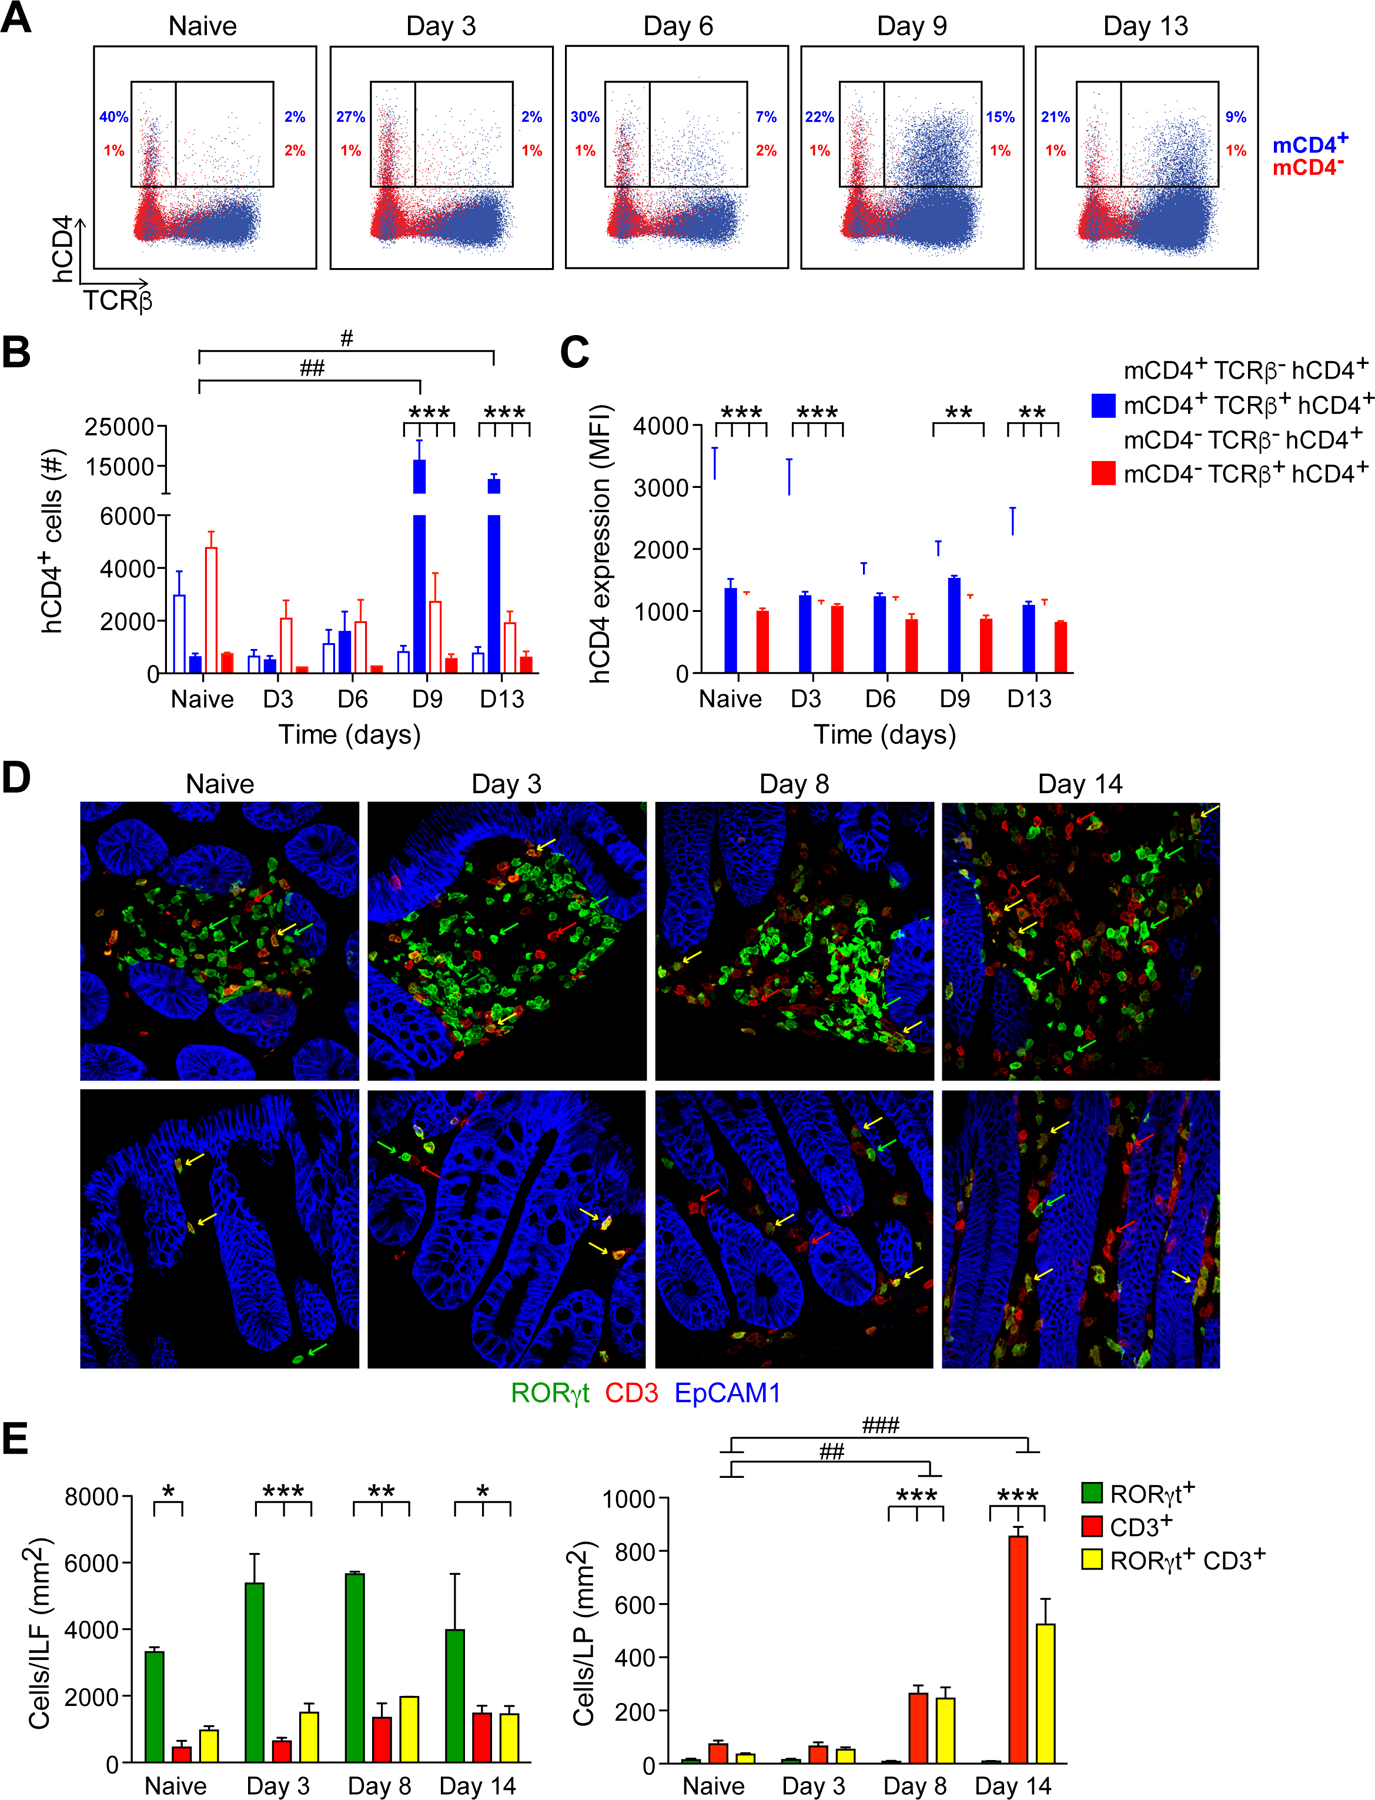
(A). Colon LP cells from naïve and C.r-infected Il22hCD4 mice stimulated with P/I+IL-23 for 4h, stained for TCRβ, hCD4, mCD4, and L/D dye and analyzed by flow cytometry. Numbers represent percentages of hCD4 (IL-22+) innate cells (TCRβ-) or T cells (TCRβ+) and are split into CD4+ (blue) and CD4– (red).
(B). Cell numbers and (C) IL-22/hCD4 expression based on mean fluorescence intensity (MFI). Cells were split into mCD4+ (open; blue) and mCD4– (open; red) innate cells, and mCD4+ (solid; blue) and mCD4- (solid; red) T cells. Error bars represent mean ± SEM.
(D). Colons from naïve and C.r-infected RorcEGFP mice stained for GFP (green), CD3 (red), and EpCAM1 (blue). Arrows depict RORγ/GFP+ cells (green), CD3+ cells (red), and GFP+ CD3+ cells (yellow). Scale bar, 20 µm.
(E). Quantitation of cells in colonic ILFs and LP. Error bars represent mean ± SEM.
One-way ANOVA, naïve vs infected; #p<0.05, ##p<0.01 and ###p<0.001. Two-way ANOVA, comparing different cell populations; *p<0.05, **p<0.01 and ***p<0.001. 3–4 mice per time point, 3 independent experiments. See also Figure S1.
Because in situ detection of hCD4/IL-22 by immunostaining proved unreliable using available antibodies, Rorc/EGFP BAC reporter mice (Lochner et al., 2008) were used to identify and localize colonic RORγt+ cells, including IL-22+ ILC3s, Th17 and Th22 cells (Figures 1D, 1E and S1F–S1H). While some IL-22+RORγt+ cells were found within the intestinal epithelium during infection, the great majority were found within non-epithelial tissue compartments, and ILC3s were mostly NKp46– (Figures S1I–S1K). In naïve mice and during C.r infection, RORγt+ CD3– ILC3s were clustered within colonic lymphoid tissues (i.e., solitary intestinal lymphoid tissues, or SILTS, and colonic patches); few ILC3s were found in the lamina propria (LP) and redistribution of these cells outside of ILFs did not change during infection, in agreement with recent studies (Ahlfors et al., 2014; Colonna, 2018; Gasteiger et al., 2015) (Figures 1D–1E). Similarly, there were no changes in the few RORγt+ T cells found in ILFs in naïve mice and during infection. In marked contrast, RORγt+ CD4 T cells increased dramatically (>50-fold) in the LP with numerous T cells found in close apposition to crypt IECs. Collectively, these findings indicate that IL-22+ ILC3s and CD4 T cells occupy distinct microanatomic niches over the course of C.r infection: IL-22+ ILC3s are restricted to ILFs and static in number, whereas IL-22+ CD4 T cells populate the LP in increasing numbers to become the dominant IL-22 producers, with more uniform distribution and in closer proximity to the epithelial monolayer relative to ILC3s.
IL-22 produced by either ILCs or T cells is required to restrain bacterial burden at different times during C.r infection
The distinct spatial and temporal deployment of IL-22+ ILCs and T cells during C.r infection suggested the possibility of complementary or unique functions for these cells in mucosal barrier defense. To evaluate their relative contributions, we crossed the Il22hCD4 mice with different Cre recombinase lines to target IL-22 deficiency to all cells, innate cells or T cells (Figure 2A). Using a bioluminescent strain of C.r (ICC180) that allowed real-time visualization of colonization in the whole animal (Wiles et al., 2006), we found that infected mice with global deficiency of IL-22 (EIIa-cre x Il22hCD4; Il22EIIa) had increased burden of C.r compared to controls as early as 3 days after inoculation and all Il22EIIa mice succumbed (Figures 2B–2D), in accord with previous results (Zheng et al., 2008). Similar to Il22EIIa mice, innate cell-specific deficiency of IL-22 (Zbtb16/Plzf)-cre x Il22hCD4; Il22Plzf)—in which Il22 is deleted in all γδ T cells and iNKT cells, and ~80% of all colonic ILC3s (Figure S2D) (Constantinides et al., 2014; Kovalovsky et al., 2008; Lu et al., 2015; Savage et al., 2008)—succumbed to C.r infection with similar kinetics to Il22EIIa mice, correlating with heightened C.r burden around day 3 compared to controls (Figures 2B, 2E and 2F). However, ~40% of Il22Plzf mice survived infection, presumably rescued by influx of IL-22+ T cells not present in Il22EIIa mice. Clearance of C.r progressed with the same kinetics as WT controls over the late course of infection (Figures 2B, 1A and 1B). This contrasted with T cell-specific deficiency of IL-22 (Cd4-cre x Il22hCD4; Il22∆Tcell), in which there was no increase in C.r burden early, but ~40% of mice succumbed late with delayed clearance of C.r compared to controls (Figures 2B, 2G and 2H). Because C.r colonization of colonic IECs is detectable around day 3 and crests by days 5–7 after inoculation (Figures S2A–S2C), these data establish that innate cell-derived IL-22 acts to limit C.r colonization during the early phase of infection, but is unable to compensate for T cell-derived IL-22 in bacterial restraint and host protection later.
Figure 2. Temporal bacterial burden and fatality in C.r-infected lineage-specific IL-22-deficient mice.
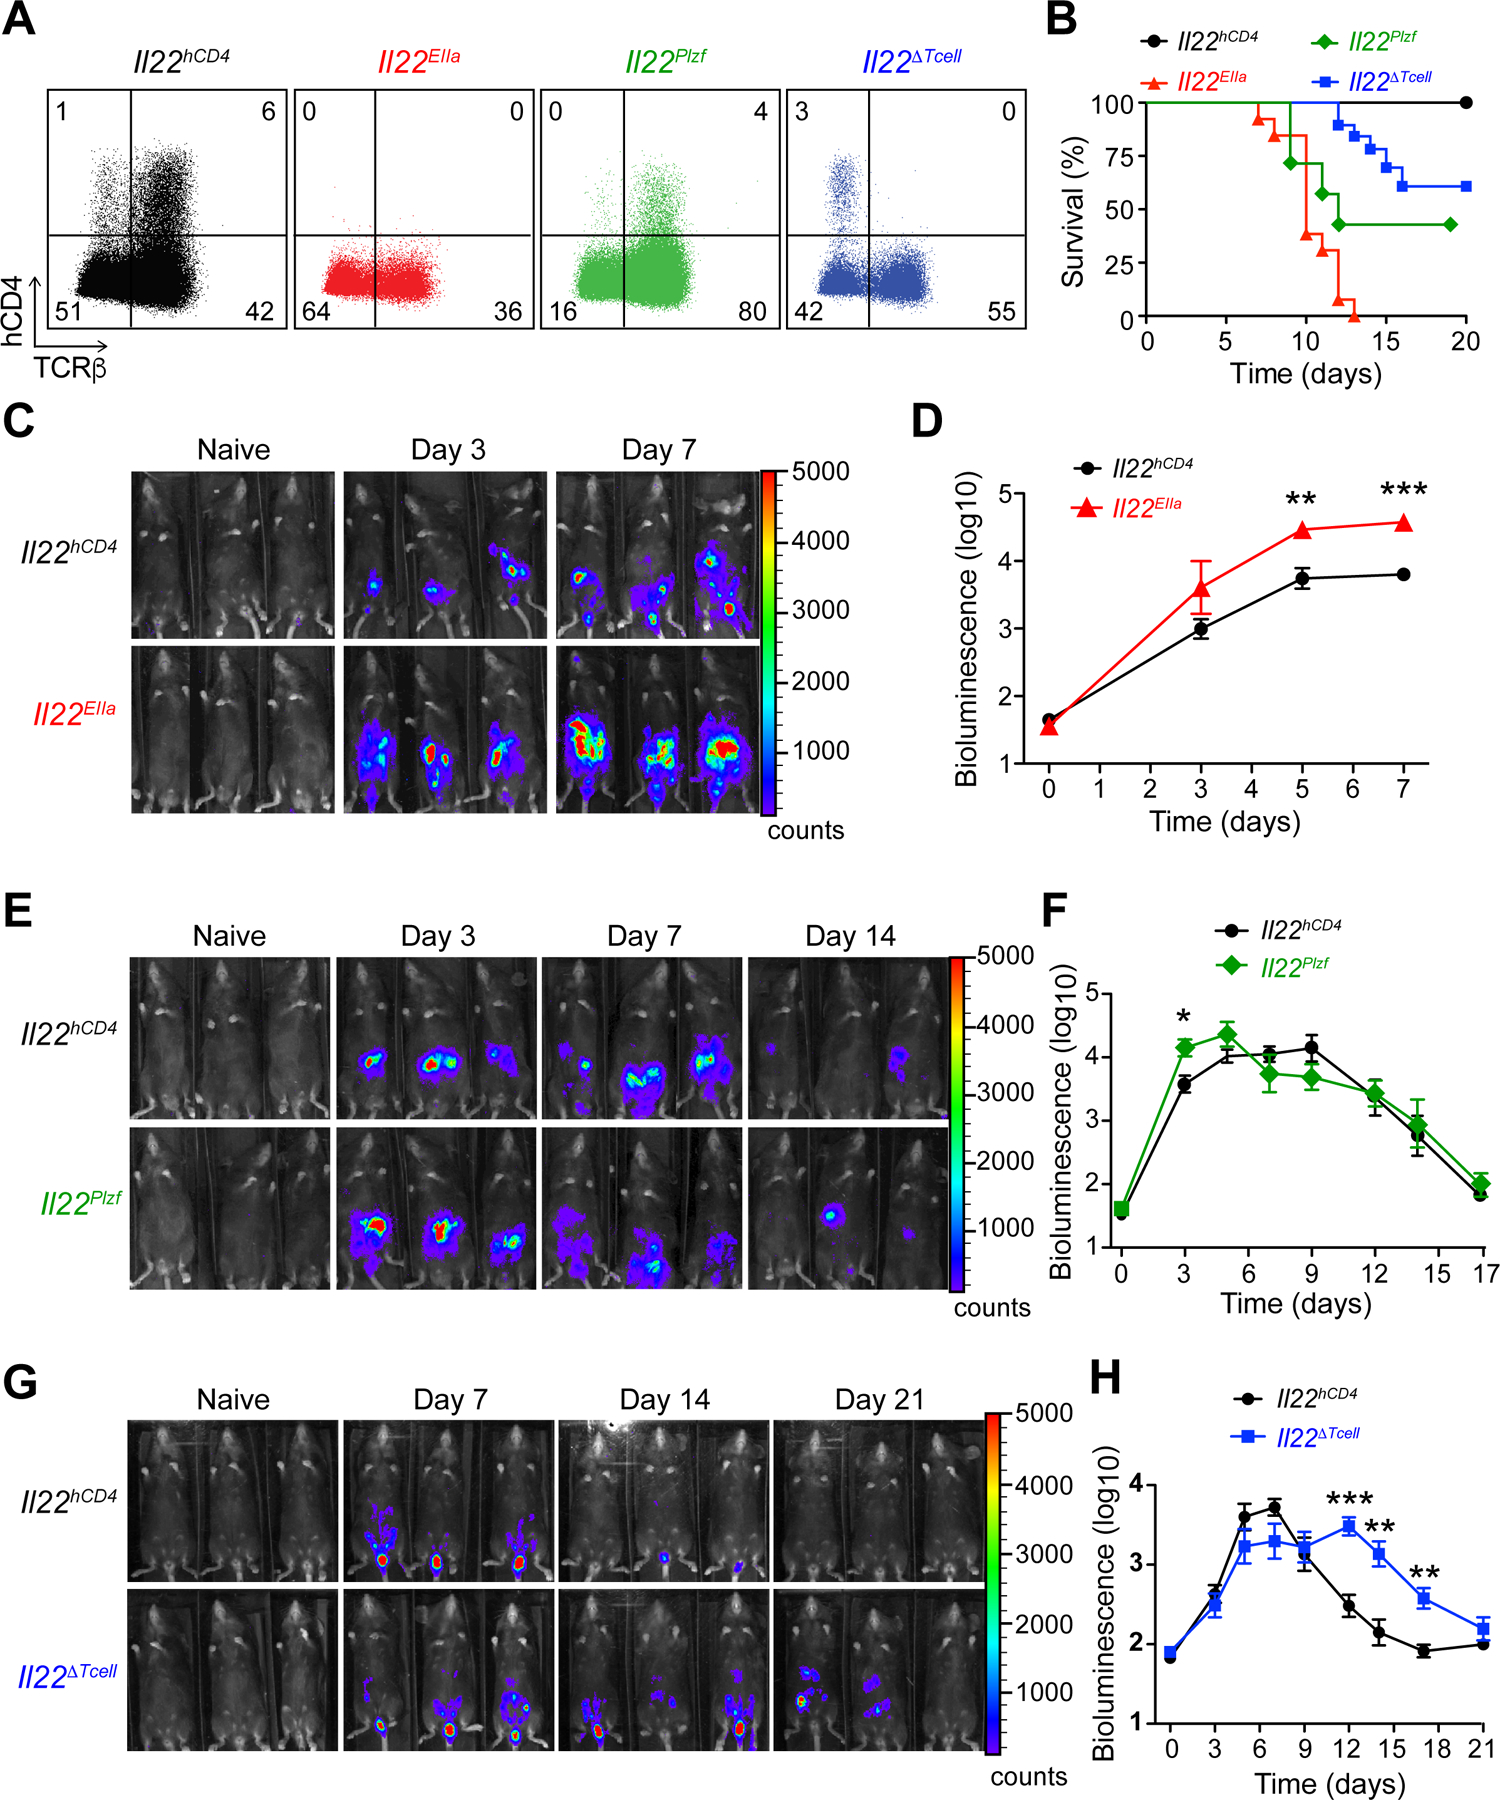
(A). Colon LP cells from day 7 C.r Il22hCD4 (black), Il22EIIa (red), Il22Plzf (green), and Il22∆Tcell (blue) mice stained for mCD4, hCD4 (IL-22), L/D dye and TCRβ after P/I+IL-23 stimulation.
(B). Survival kinetics of C.r-infected Cntrl, Il22EIIa, Il22Plzf and Il22∆Tcell mice.
(C, E, and G) Serial whole-body imaging and (D, F, H) Colonization kinetics of C.r-infected Cntrl, Il22EIIa, Il22Plzf and Il22∆Tcell mice. Error bars represent mean ± SEM.
Mann Whitney; *p<0.05, **p<0.01, ***p<0.001. 4–5 mice per time point, 2 independent experiments. See also Figure S2.
T cell-derived IL-22 is essential for protection of colonic crypts against bacterial invasion
In view of the foregoing results, we postulated that IL-22 delivered by T cells played a non-redundant role in barrier defense against C.r infection. To elucidate potential mechanisms, we examined the dynamics and distribution of bacterial epithelial attachment using GFP-expressing C.r (C.r-GFP; Bergstrom et al., 2010), and assessed histopathologic features of tissue injury over the course of infection in mice with lineage-specific deficiency of IL-22. Coincident with onset of death in infected Il22EIIa mice (day 8), we observed heightened epithelial injury in the middle and distal colon with increased goblet cell (GC) and crypt cell loss, and depletion of crypts (Figures 3A and S3A). This was accompanied by multifocal ulcerations of the mucosa and mass translocations of C.r cells (Figure 3A, and data not shown), consistent with our previous findings in IL-23- and IL-22-deficient mice (Basu et al., 2012; Mangan et al., 2006). During early phase of infection (days 3/4) in Il22hCD4 mice, isolated microcolonies of C.r were attached to luminal surfaces of IECs; in contrast, Il22EIIa mice showed uniform spread of C.r over the epithelial surface (Figures 3B–3C), indicating that following early C.r colonization, IL-22 produced by ILC3s acted to limit C.r growth at the luminal surface. As infection progressed, there was uniform distribution of C.r on the epithelium in control mice (day 9), with extension focally into luminal openings of the crypts, but no penetration deeper into the crypts (Figure 3B). In marked contrast, C.r invaded deep into colonic crypts in Il22EIIa mice by d9, coinciding with influx of CD4 T cells into the LP (Figure 1). Accordingly, the number of C.r cells attached to IECs was >10-fold higher compared to controls (Figure 3C) indicating that in global absence of IL-22, there was loss of protection of crypts against C.r invasion. Consistent with these findings, the bacterial burden in livers of infected Il22EIIa mice was increased compared to controls (Figure S3C). Thus, IL-22 is required to control the progressive spread of C.r from small microcolonies attached to surface IECs to the depths of crypts and into the periphery.
Figure 3. IL-22 protects the colonic crypts from deep bacterial invasion.
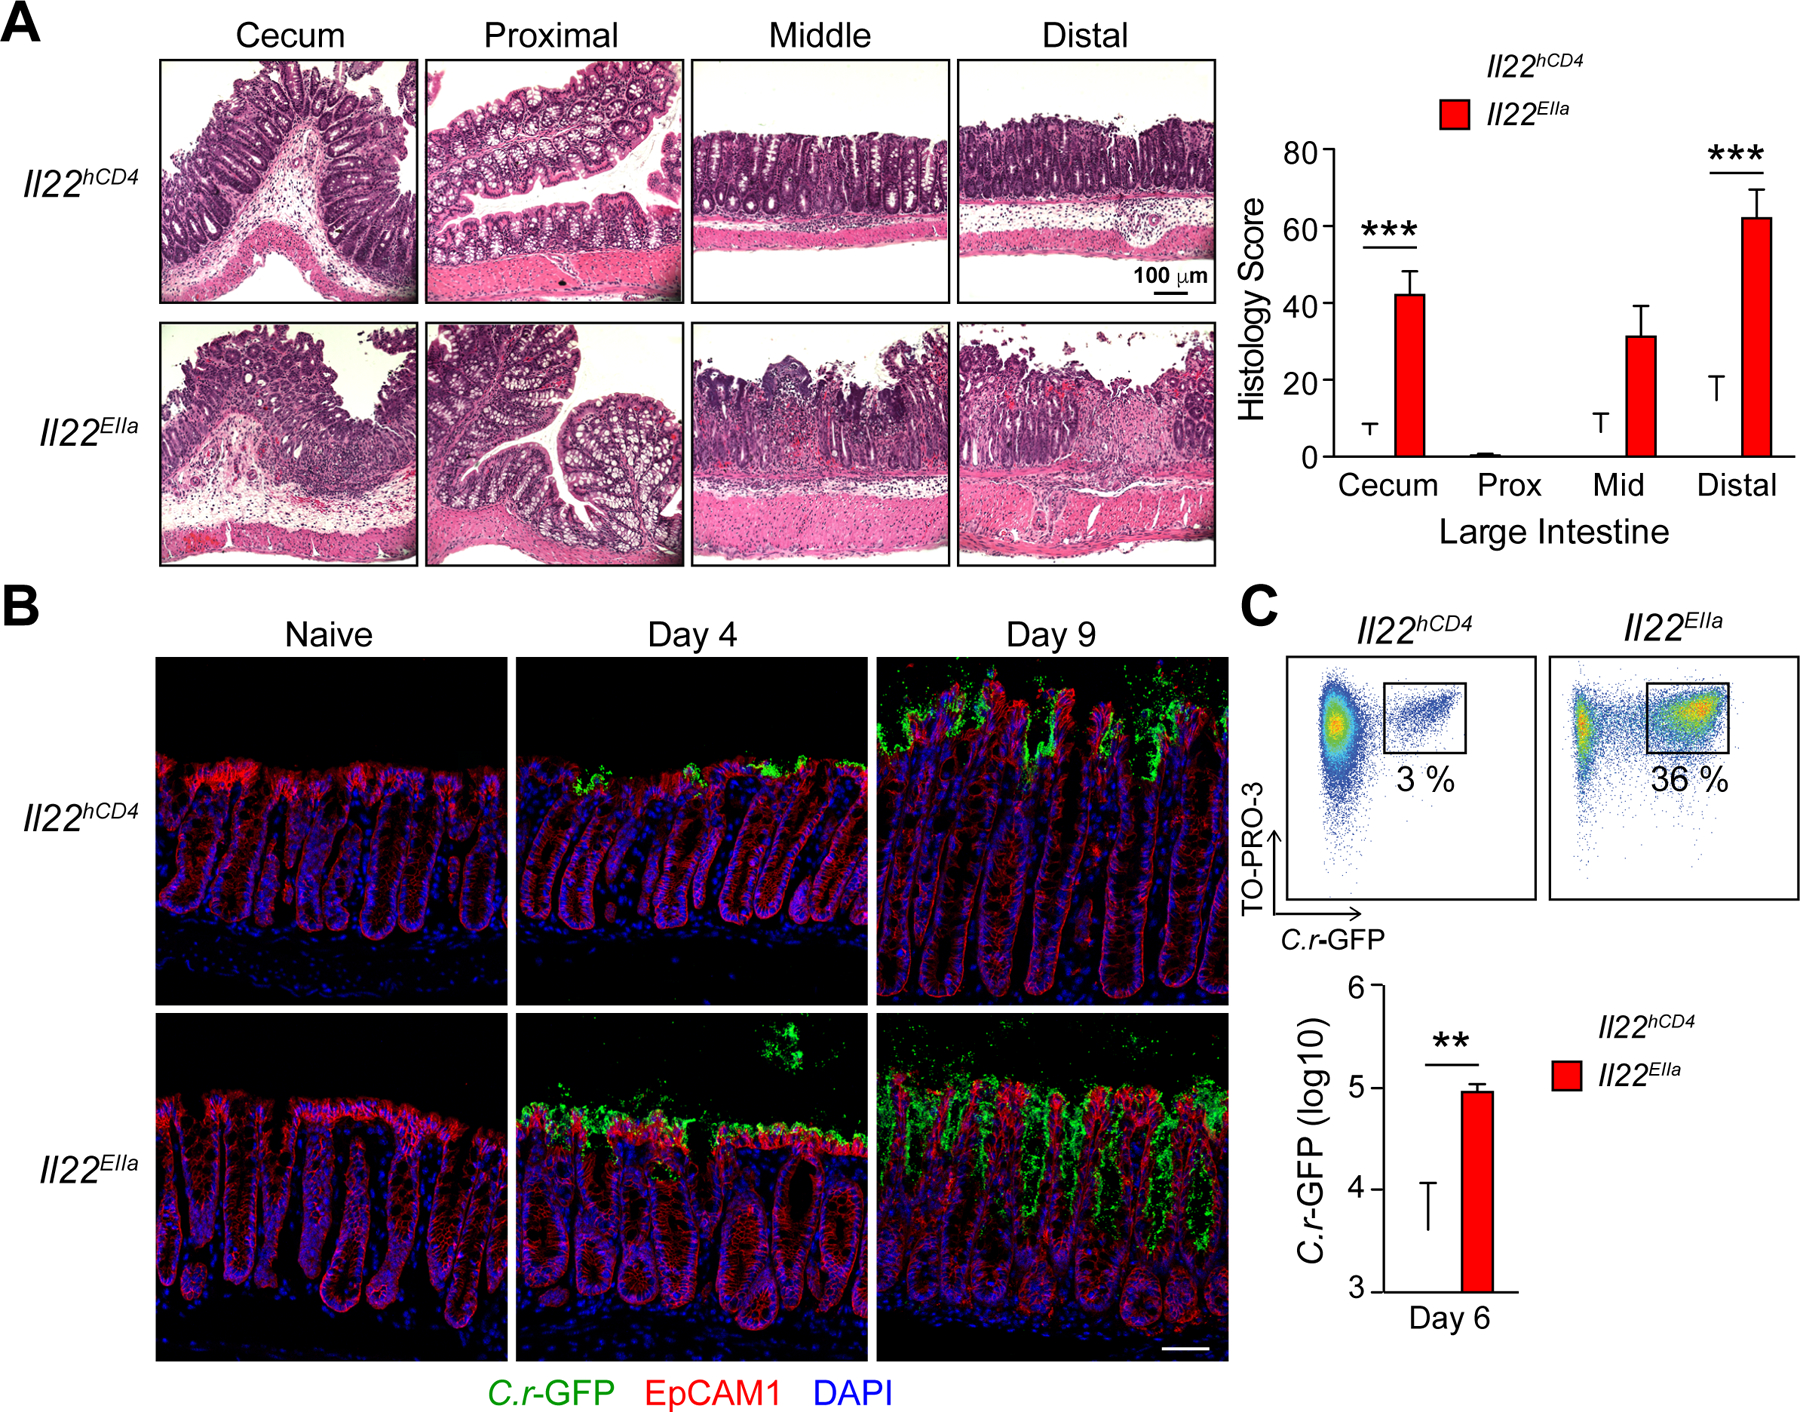
(A) LI from day 8 C.r Il22hCD4 (white) and Il22EIIa (red) mice stained with H&E (Two-way ANOVA, ***p<0.001) Scale bars, 100 µm. (B) Colons from naïve and C.r-GFP-infected Il22hCD4 and Il22EIIa mice stained for GFP (green), EpCAM1 (red) and DAPI (blue). Scale bars, 50 µm.
(C) C.r from supernatants of IEC preps from d6 C.r-GFP Il22hCD4 and Il22EIIa mice stained with TO-PRO-3 and analyzed by flow cytometry in log scale (Mann Whitney, **p<0.01). Error bars represent mean ± SEM. 3–5 mice per group, 2 independent experiments. See also Figure S3.
To define the contributions of IL-22+ ILCs and T cells to restraint of the spread of C.r, parallel studies were performed in Il22Plzf and Il22∆Tcell mice. Similar to Il22EIIa mice and consistent with our bioluminescent studies, infected Il22Plzf mice had enhanced C.r colonization of surface IECs with ~10-fold higher C.r burden compared to controls on day 4 of infection (Figures 2E, 2F, 4A and 4B). However, our tissue staining and bioluminescent studies showed no differences in distribution and C.r load on day 9 of infection, consistent with a dominant influence of IL-22+ CD4 T cells by this stage of infection (Figures 1, 2E, 2F, 4A and 4B). This correlated with C.r burden in the liver of C.r-GFP-infected Il22Plzf mice compared to controls on day 6 but not on day 9 post-infection (Figure S3D). In contrast to Il22EIIa mice, there was no deep extension of C.r into the crypts of infected Il22Plzf mice either in mice that died or in the fraction of mice that survived the innate phase infectious “crisis” (Figure 4A). Moreover, histopathologic exam of Il22Plzf mice that survived did not show differences from controls in colitis scores at the peak of infection (Figures S2E and S3B). These data reinforced the importance of innate cell-derived IL-22 in restraining bacterial proliferation and spread across the superficial epithelium, but suggested ILC3-derived IL-22 might be inadequate for protection of the crypts.
Figure 4. IL-22+ innate and adaptive cells protect distinct regions of the colon during C.r infection.
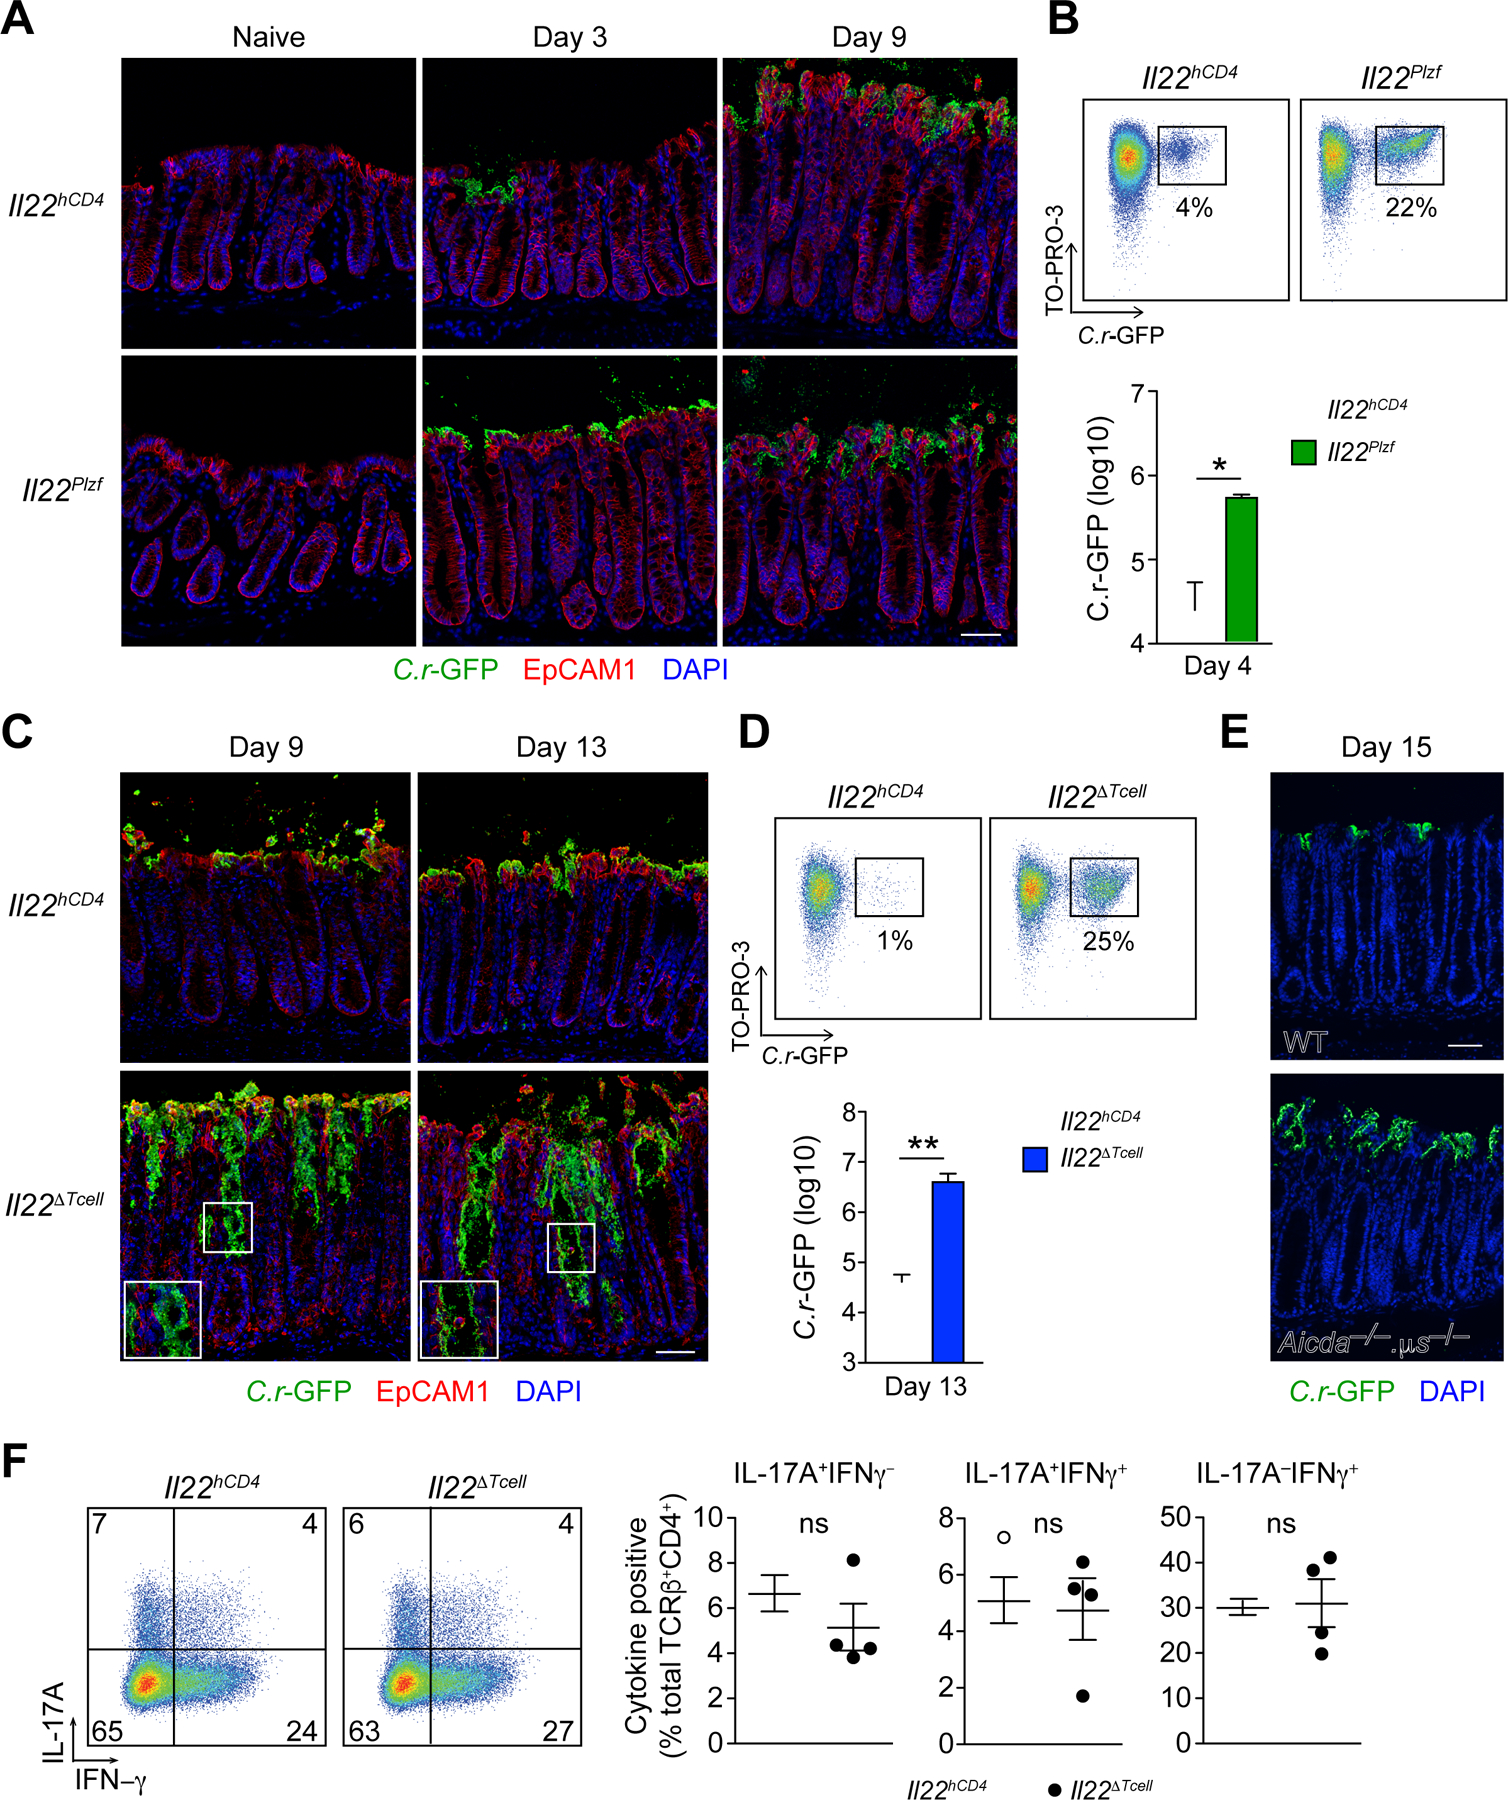
(A). Colons from naïve and C.r-GFP-infected Il22hCD4 and Il22Plzf mice stained for GFP (green), EpCAM1 (red) and DAPI (blue). Scale bar, 50 µm.
(B). C.r from supernatants of IEC preps from day 4 C.r-GFP Il22hCD4 and Il22Plzf (green) mice stained with TO-PRO-3 and analyzed by flow cytometry in log scale (Mann Whitney, *p<0.05). Error bars represent mean ± SEM.
(C). Colons from day 9 and day 13 C.r-GFP Il22hCD4 and Il22∆Tcell mice stained for GFP (green), EpCAM1 (red) and DAPI (blue). Scale bar, 50 µm.
(D). C.r from supernatants of IEC preps from day 13 C.r-GFP Cntrl and Il22∆Tcell (blue) mice stained with TO-PRO-3 and analyzed by flow cytometry in log scale (Mann Whitney, **p<0.01). Error bars represent mean ± SEM.
(E). Colons from d15 C.r-GFP WT and Aicda–/– µs–/– mice stained for GFP (green) and DAPI (blue). Scale bar, 50 µm.
(F). Colon lamina propria lymphocytes (LPLs) from day 9 C.r Cntrl (open) and Il22∆Tcell (solid) mice stimulated with P/I+GolgiPlug for 4h and stained for TCRβ, mCD4, and L/D dye, followed by IC staining for IL-17A and IFNγ. Error bars represent mean ± SEM.
ns=not significant, 3–4 mice per group, 2 independent experiments. See also Figure S4.
The discrepancy in crypt invasion by C.r between Il22EIIa and Il22Plzf mice suggested that T cell-derived IL-22 might be required for crypt protection. This proved to be the case. While there was no difference in C.r load in control and Il22∆Tcell mice early due to an intact ILC response (Figure 2H), at later time points, which correlated with influx of T cells in the LP, C.r cells extended into the colonic crypts (day 9; Figure 4C), spreading to the bases of crypts by days 12–14 of infection (Figure 4C, right panels)—similar to our findings in Il22EIIa mice (Figure 3B). In accord with extension of C.r into crypts and whole-body imaging data (Figures 2G–2H), flow cytometric quantitation of C.r attachment to IECs was ~100-fold higher in Il22∆Tcell mice compared to controls (Figure 4D), corresponding with more severe histopathologic findings prior to death (Figure 2B), including increased hyperplasia, GC loss, and crypt cell injury in the middle and distal colon compared to controls (Figures S4A–S4B). This paralleled C.r burden in the liver and spleens of infected Il22∆T cell mice compared to controls (Figure S4C).
The lack of crypt protection in Il22∆Tcell mice could not be attributed to altered production of protective antibodies against C.r, which are required for complete clearance of infection (Bry and Brenner, 2004; Maaser et al., 2004; Simmons et al., 2003), as infected mice with normal B cell numbers but deficiency of both Ig class-switching and secreted IgM (Aicda–/–.µs–/–) showed protection of crypts comparable to controls (Figure 4E). Moreover, total and anti-C.r specific fecal IgG was elevated in Il22∆Tcell mice, perhaps reflecting increased bacterial load (Figure S4D). Loss of crypt protection was also not due to deficiency of non-IL-22-producing effector CD4 T cells in Il22∆Tcell mice, as the number and effector phenotype of LP T cells did not differ from controls (Figure 4F). Collectively, these data establish that while ILC3s were sufficient to restrain C.r colonization early, they were unable to protect the crypts; only IL-22+ T cells could protect colonic crypts from C.r invasion, consistent with previous findings that crypts are not protected in C.r-infected Rag1–/– (Bergstrom et al., 2015; Chan et al., 2013) (Figure S4E). Thus, IL-22+ innate and adaptive immune cells have distinct, specialized roles in the clearance of attaching/effacing enteric pathogens.
IL-22–producing innate and adaptive immune cells target different IEC subsets
Because our findings implied a different capacity of IL-22+ ILC3s and CD4 T cells to activate a protective response in colonic crypts, we reasoned this might reflect differential IL-22 signaling into IEC subsets. Although STAT3 signaling is crucial for the protective effects of IL-22 on IECs (Pickert et al., 2009; Sovran et al., 2015; Wittkopf et al., 2015), details on which subsets of IECs are activated by IL-22 and from what cellular source are unclear. We therefore surveyed the colonic mucosa of Il22hCD4 WT and Il22EIIa mice for STAT3 activation by immunostaining for pTyr705-STAT3 at steady state and during infection. In naïve control mice, pSTAT3 was undetectable in either colonic IECs or LP cells (Figures 5A and 5C); i.e., no baseline activation of STAT3 was evident. During the innate phase of C.r infection (day 4), low-intermediate intensity pSTAT3 activation (pSTAT3dim) was detected in the nuclei of surface (s)IECs (i.e., IECs facing the lumen or lining the mouth of crypts) and in LP immune cells of control mice (Figures 5A–5B, see insets). Global deficiency of IL-22 eliminated detectable pSTAT3 in IECs, which was preserved in LP cells, indicating IL-22 is non-redundant in its activation of IECs during the innate phase of C.r infection, whereas other STAT3-activating cytokines signal into LP cells.
Figure 5. IL-22+ T cells induce robust and prolonged STAT3 activation.
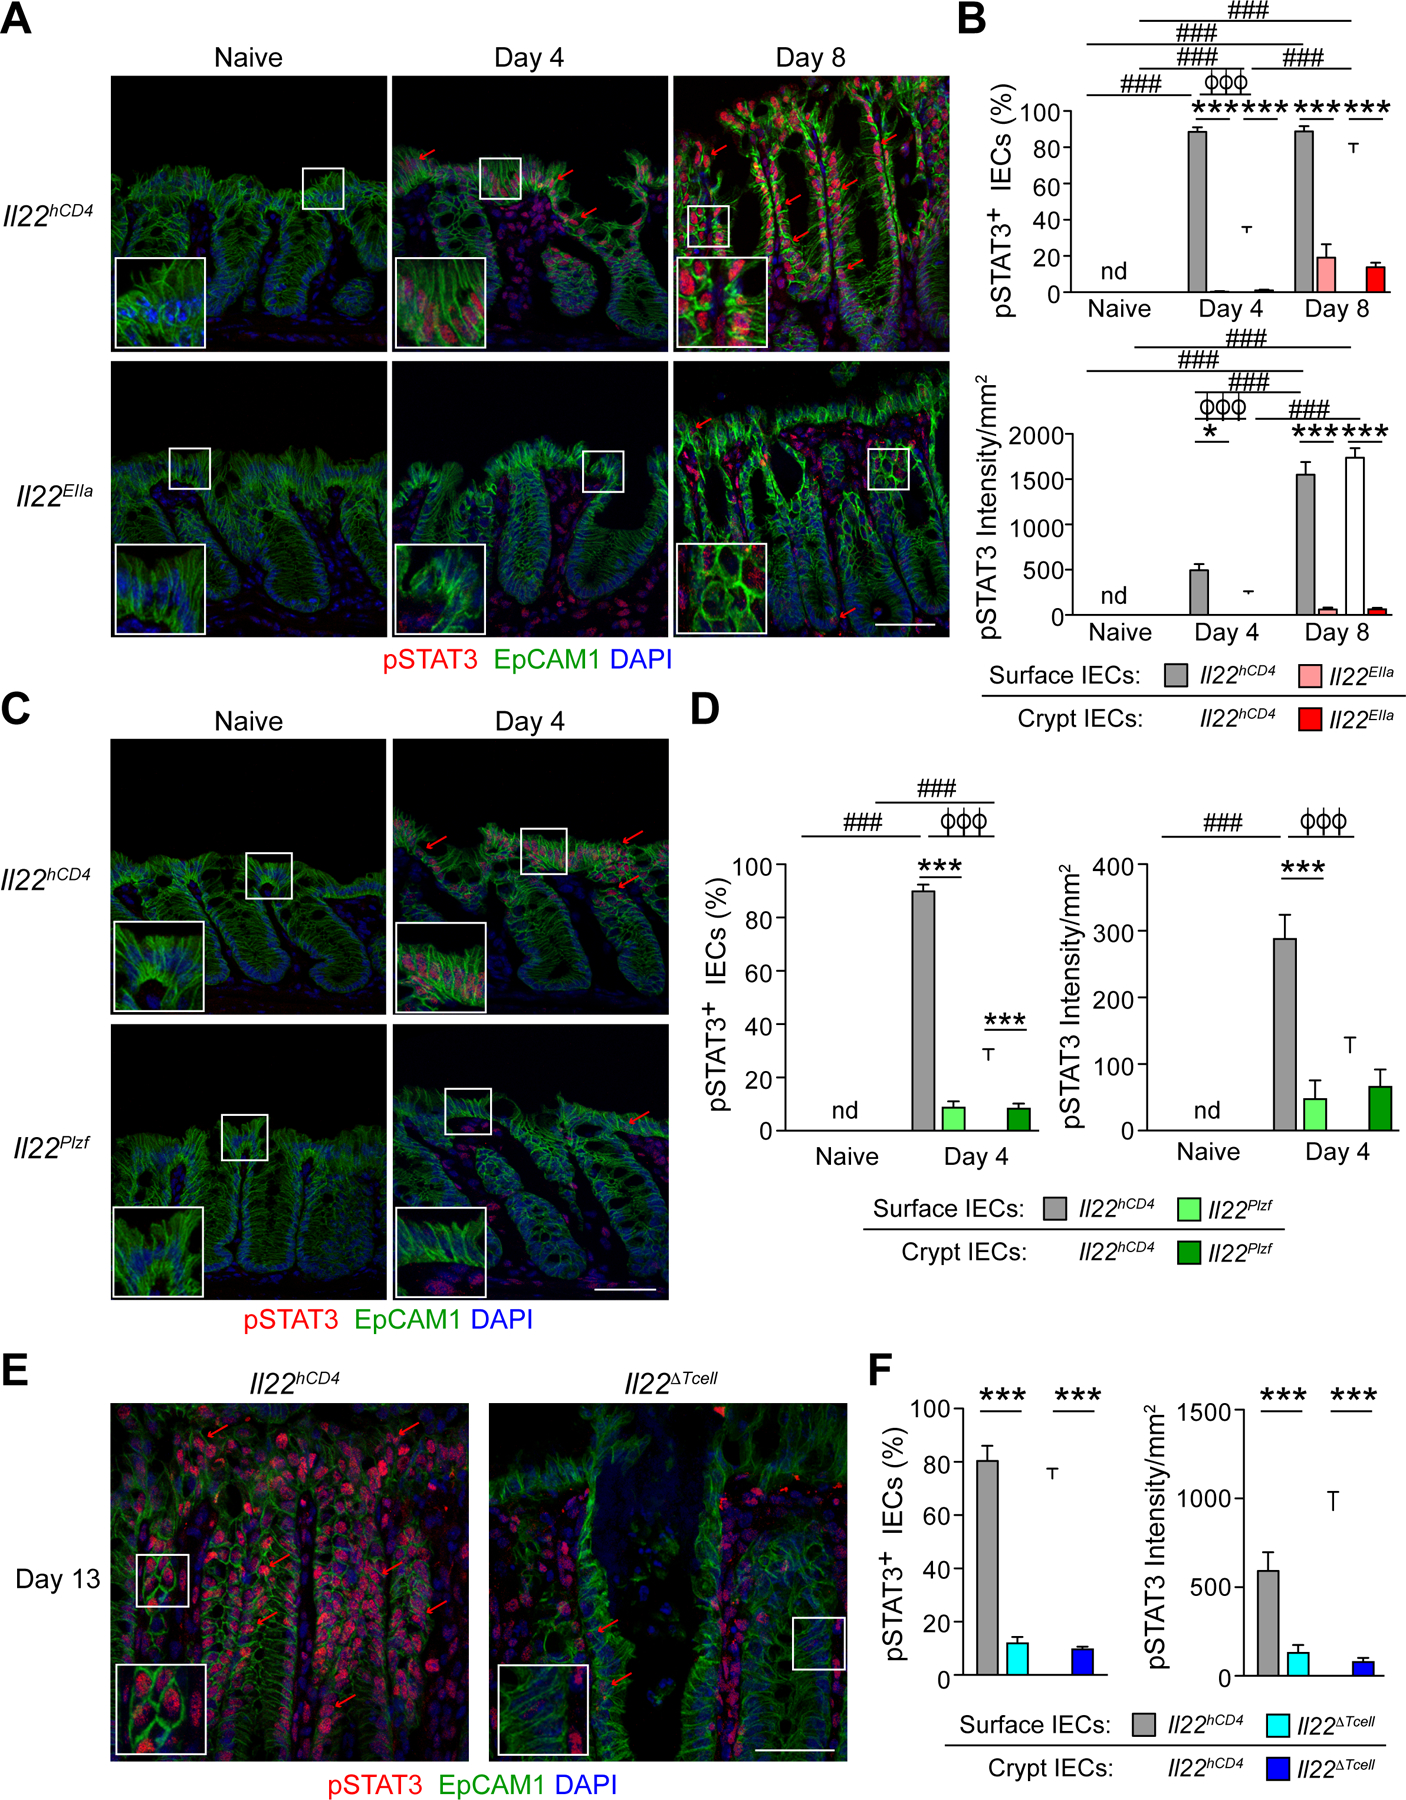
(A, C, and E) Colons from (A) naïve, day 4 and day 8 C.r-infected Il22hCD4 and Il22EIIa, and (C) naïve and day 4 Il22hCD4 and Il22Plzf, and (E) day 13 C.r Il22hCD4 and Il22∆Tcell mice stained for EpCAM1 (green), pSTAT3 (red) and DAPI (blue). Red arrows depict pSTAT3+ IECs. Scale bar, 50 µm.
(B, D, and F) Quantitation of percent pSTAT3+ cells and intensity of pSTAT3 in sIECs and cIECs from (B) naïve, day 4 and day 8 Il22hCD4 and Il22EIIa, and (D) naïve and day 4 C.r Il22hCD4 and Il22Plzf and (F) day 13 C.r Il22hCD4 and Il22∆Tcell mice. Error bars represent mean ± SEM.
(B and D) Two-way ANOVA with Bonferroni posttests; ###p<0.001, comparing different time points, *p<0.05 and ***p<0.001, WT vs lineage-specific IL-22-deficient and ϕϕϕp<0.001, sIECs vs cIECs.
(F) One-way ANOVA with post-hoc Tukey tests; ***p<0.001, WT vs lineage-specific IL-22-deficient. nd=not detected. 4–5 mice per group, 2 independent experiments.
In contrast to sIECs, most IECs lining the crypts showed no or minimal pSTAT3 during the innate phase of infection (day 4). This changed dramatically with the influx of IL-22+ CD4 T cells (day 8) (Figures 5A–5B). While there was no difference in the number of pSTAT3+ sIECs, the average intensity of staining increased ~3-fold, reflecting higher amplitude pSTAT3 signaling (pSTAT3bright). IECs now became pSTAT3-bright at all levels of the crypts, with comparable frequencies and staining intensities to those of sIECs. In contrast, STAT3 activation was ablated in all IECs in Il22EIIa mice compared to controls, indicating that IL-22 is also indispensable for STAT3 activation of crypt cells during C.r infection. Also, as noted above, no discernable decrement in the frequency or intensity of pSTAT3 staining was evident in LP immune cells consequent to loss of IL-22 during the adaptive phase of infection. Thus, whereas IL-22 is indispensable for activation of IECs, other STAT3-activating cytokines (e.g., IL-6, IL-23) act on immune cells in the involved mucosa. To extend these findings, we examined IL-22–dependent activation of STAT3 in IECs contingent on the source of IL-22, whether from ILC3s or T cells. During early stages of infection when ILC3-derived IL-22 was dominant in limiting C.r colonization of the luminal surface, STAT3 activation was diminished in sIECs of infected Il22Plzf mice compared to controls (Figures 5C–5D, see insets). During late phase of infection when T cell-derived IL-22 was required for crypt protection, both the frequency and intensity of pSTAT3 positivity was markedly reduced in crypt (c)IECs of infected Il22∆Tcell mice compared to controls (Figures 5E–5F, see insets). Deficiency in T cell-derived IL-22 also ablated STAT3 activation in sIECs, indicating that late in infection all IECs were dependent on T cell-derived IL-22 for STAT3 activation and thus protective responses, irrespective of the continued production of IL-22 by non-T cells.
Together with our previous findings, these data establish that ILC-derived IL-22 is the principal cytokine driving STAT3 activation in sIECs necessary for restraint of C.r colonization and host survival during the early course of infection, but its effectiveness is limited to superficial IECs. As infection progresses, T cell-derived IL-22 is indispensable for driving STAT3 activation that underpins resistance of cIECs to C.r invasion and for sustaining and amplifying STAT3 activation of sIECs. Thus, the non-redundant function of IL-22 in host protection against attaching/effacing bacteria reflects the ability of this cytokine to activate STAT3 in IECs, and CD4 T cells are indispensable for protection of both the colonic crypts and surface barrier as C.r infection progresses.
T cell-derived IL-22 promotes a shift in IEC functional programming to protect intestinal crypts
All IEC subsets arise from intestinal stem cells (ISCs) sequestered from the lumen—and potential pathogens—in the base of intestinal crypts (Barker et al., 2007; Chang and Leblond, 1971; Flier and Clevers, 2009; Hua et al., 2012). The differentiation and specialization of IECs occur as progeny of ISCs divide and transit along the crypt-surface axis, giving rise to absorptive enterocytes (ECs), the major surface IEC, and secretory IECs, including goblet cells (GC), tuft cells, enteroendocrine cells (EECs), and, in the colon, deep secretory cells (DSCs, or Paneth-like cells), which appear to share ISC-supportive functions similar to Paneth cells in the small intestine (Rothenberg et al., 2012; Sasaki et al., 2016). Because we identified a non-redundant role for IL-22+ T cells in activating STAT3 in crypt IECs—including those residing in the IEC “incubator” at the base of crypts—during C.r infection, we sought to understand how T cell-derived IL-22 might reprogram developing IECs to protect the crypts.
Genes differentially expressed (DEGs) contingent on T cell-derived IL-22 were identified by RNA-seq analysis of three subsets of IECs sorted from mid/distal colons of naïve (day 0) and day 9 C.r-infected control (Il22hCD4) and CD4 T cell-specific IL-22-deficient (Il22∆Tcell) mice. Subsets were defined by differential cell size/complexity and expression of EpCAM1 and CEACAM1: Small crypt (SC) cells (EpCAM1+CEACAM1lo FSCloSSClo); large crypt (LC) cells (EpCAM1+CEACAM1intFSChiSSCint); and superficial, or surface, cells (Srf) (EpCAM1+CEACAM1hiFSChiSSChi) (Figures 6A–6D); which correlated with lower crypt cells, upper crypt cells, and surface cells, respectively, based on correlative gene expression from RNA-seq and laser capture microdissection (LCM)/RT-PCR analyses (Allen et al., 1998; Duc et al., 1994; Peña-Münzenmayer et al., 2005;Figures S5A–S5D). At the peak of C.r infection (day 9), 739 DEGs were identified in colonic IECs from control versus Il22∆Tcell mice (Figures 6D–6F and S5E–S5G).
Figure 6. IL-22+ T cells upregulate host defense genes and repress IFNγ–induced genes.
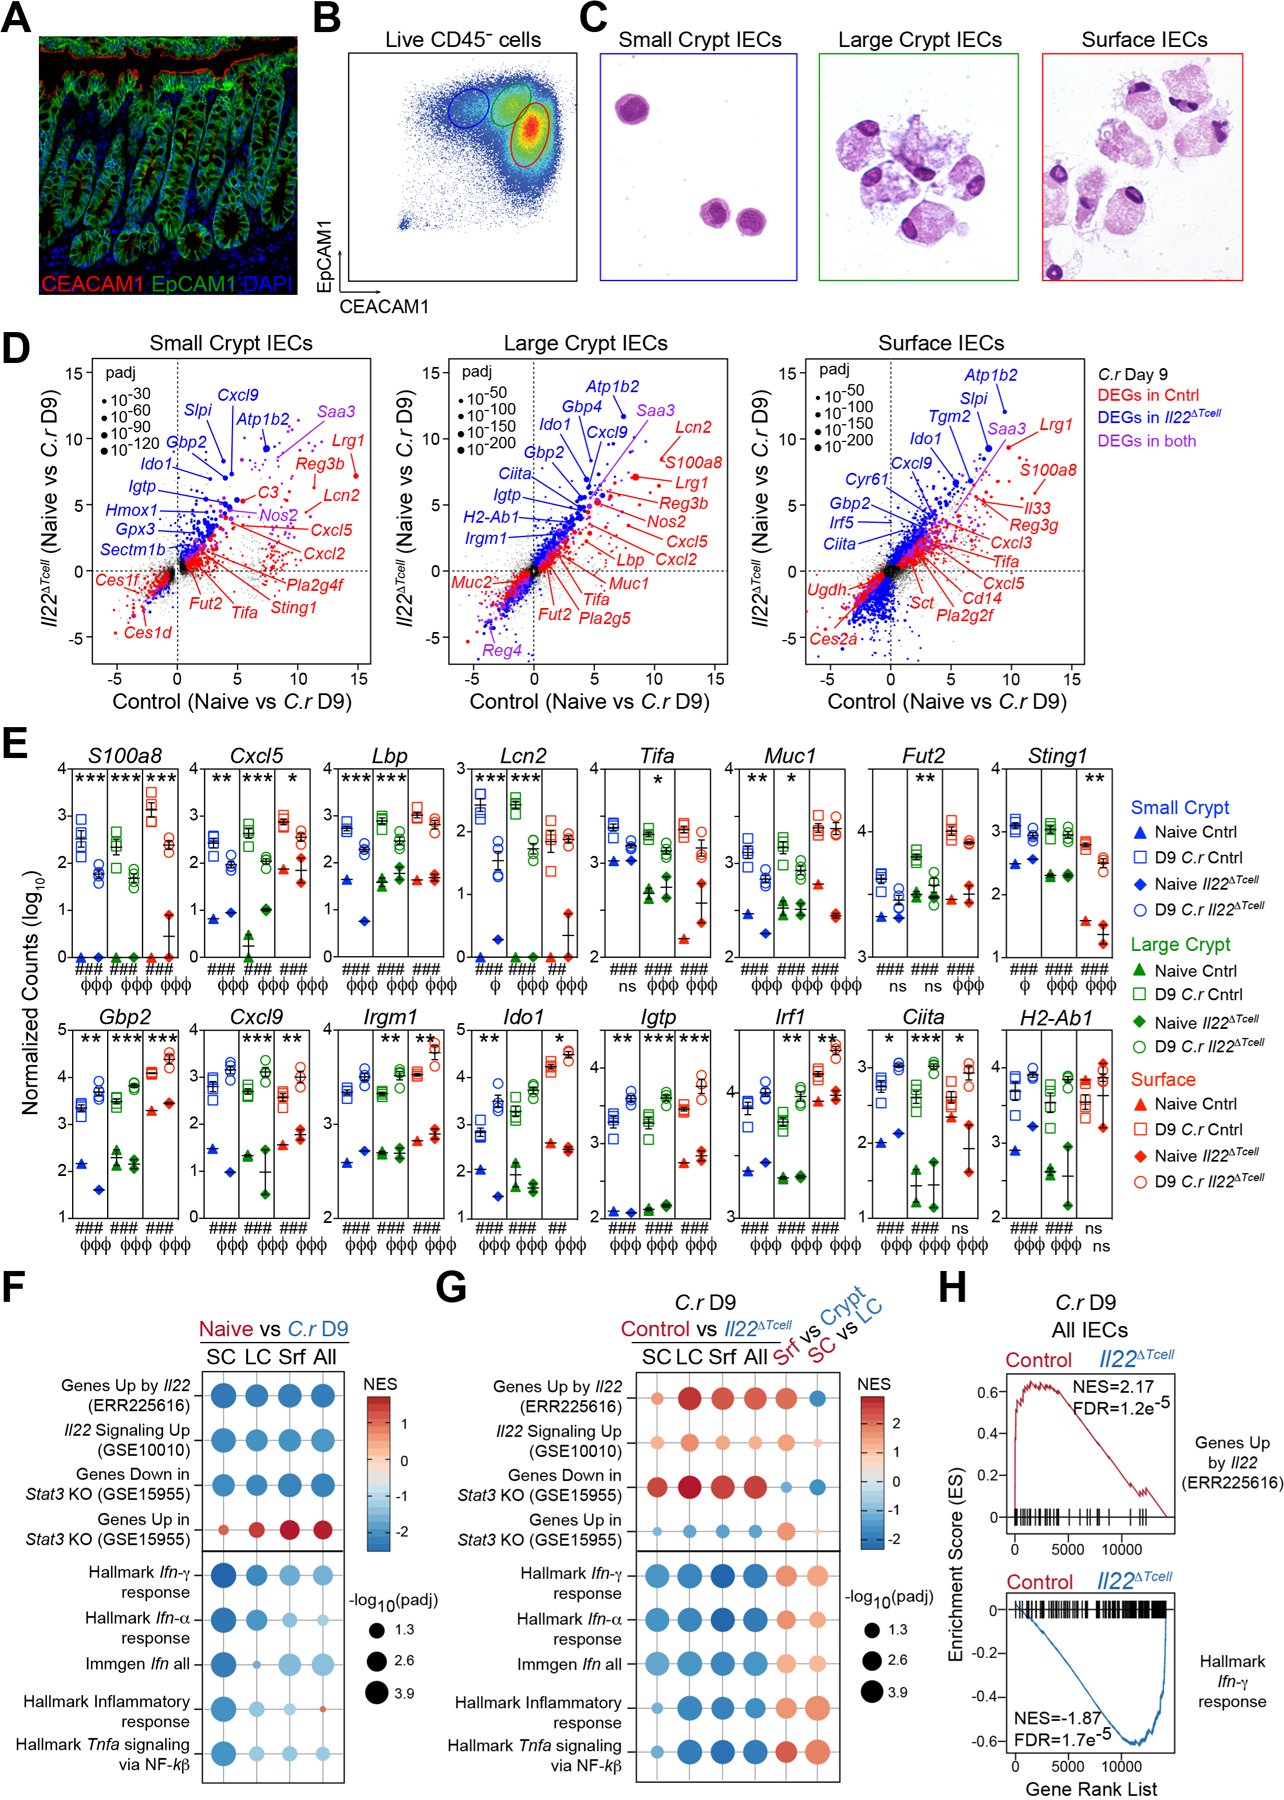
(A) Colon stained for EpCAM1 (green), CEACAM1 (red) and DAPI (blue). Scale bar, 50 µm.
(B) IECs from naïve mice stained for EpCAM1, CEACAM1, L/D dye and CD45 and analyzed by flow cytometry or (C) EpCAM1+CD45-LD/dye- cells sorted into small crypt (SC; CEACAM1loFSCloSSClo; blue), large crypt (LC; CEACAM1intFSChiSSCint; green) and surface IECs (Srf; CEACAM1hiFSChiSSChi; red) and stained with H&E.
(D-H) RNA-seq of sorted SC, LC and Srf IECs from mid/distal colons of naïve and day 9 C.r-infected Il22hCD4 and Il22∆Tcell mice. padj = adjusted p-value.
(D) Two-way scatter plots of DEGs in SC, LC and Srf IECs from naïve vs day 9 C.r Cntrl (red) & naïve vs day 9 C.r Il22∆Tcell (blue). DEGs in both (purple) (padj<0.05; colored dots).
(E) Count plots of DE host defense genes in SC (blue), LC (green) and Srf (red) IECs from day 9 C.r Cntrl (solid) and Il22∆Tcell (open). Normalized by library size. *padj<0.1, **padj<0.01, ***padj<0.001; day 9 C.r Cntrl vs Il22∆Tcell. ##padj<0.01, ###padj<0.001; naïve Cntrl vs day 9 C.r Cntrl. ϕp<0.1, ϕϕϕp<0.001; naïve Il22∆Tcell vs day 9 C.r Il22∆Tcell. Error bars represent mean ± SEM. ns = not significant.
(F and G) GSEA dot plots of IL-22, IFNα, IFNγ, TNF and Inflammatory pathways in SC, LC, Srf and pooled IECs (All) from (F) naïve (red) vs day 9 C.r Cntrl (blue) and (G) day 9 C.r Cntrl (red) vs Il22∆Tcell (blue), Srf (red) vs pooled Crypt (blue), and SC (red) vs LC (blue).
(H) GSEA bar code plots of IL-22 and IFNγ pathways in pooled IECs (All) from day 9 C.r Il22∆Tcell (blue) vs Cntrl (red). See also Figure S5.
NES, normal enrichment score; FDR, false discovery rate. 2–3 mice per sample, Independent experiments: 1–2 per naïve group and 3–4 per infected group.
Transcripts of genes involved in host defense were up-regulated by T cell-derived IL-22, whether predominantly in surface (s)IECs (e.g., Sting1), crypt (c)IECs (e.g., Lcn2, Lbp, Muc1) or all IEC subsets (e.g., S100a8, Lrg1, Tac1) (Figures 6D, 6E and S5E–S5G). The striking induction in cIECs of transcripts that encode lipocalin 2, a principal sequestrator of iron-binding siderophores expressed by pathogenic E. coli and C.r (Berger et al., 2006; Goetz et al., 2002), and S100a8, a component of the metal-chelator calprotectin (Brandtzaeg et al., 1995; Clohessy and Golden, 1995), is consistent with an important role of these antimicrobial peptides (AMPs) in defense of the colonic crypts. Moreover, IL-22+ T cells up-regulated several phospholipase A2 (PLA2) genes encoding phospholipid-hydrolyzing enzymes that have bactericidal activity and contribute to IL-22/STAT3-dependent host defenses (Harwig et al., 1995; Okita et al., 2016; Wittkopf et al., 2015; Yamamoto et al., 2015) (Figures 6D, S5E–S5G, 7B, 7C and S6) and transcripts for the Reg family AMPs, Reg3β and Reg3γ—implicated as important IL-22-dependent AMPs in C.r infection (Zheng et al., 2008) (Figures 6D and S5E–S5G). Up-regulation in cIECs of transcripts encoding the LPS-binding protein (Lbp), a key factor in enhanced recognition of Gram-negative bacterial cell wall components by TLR2 and TLR4 (Medzhitov et al., 1997; Poltorak et al., 1998; Pugin et al., 1993; Schletter et al., 1995), suggests potentiation of recognition of this pathogen-associated molecular pattern (PAMP) by cIECs may contribute to crypt defense in C.r infection.
Figure 7. T cell-derived IL-22 promotes a shift in IEC functional programming to protect intestinal crypts.
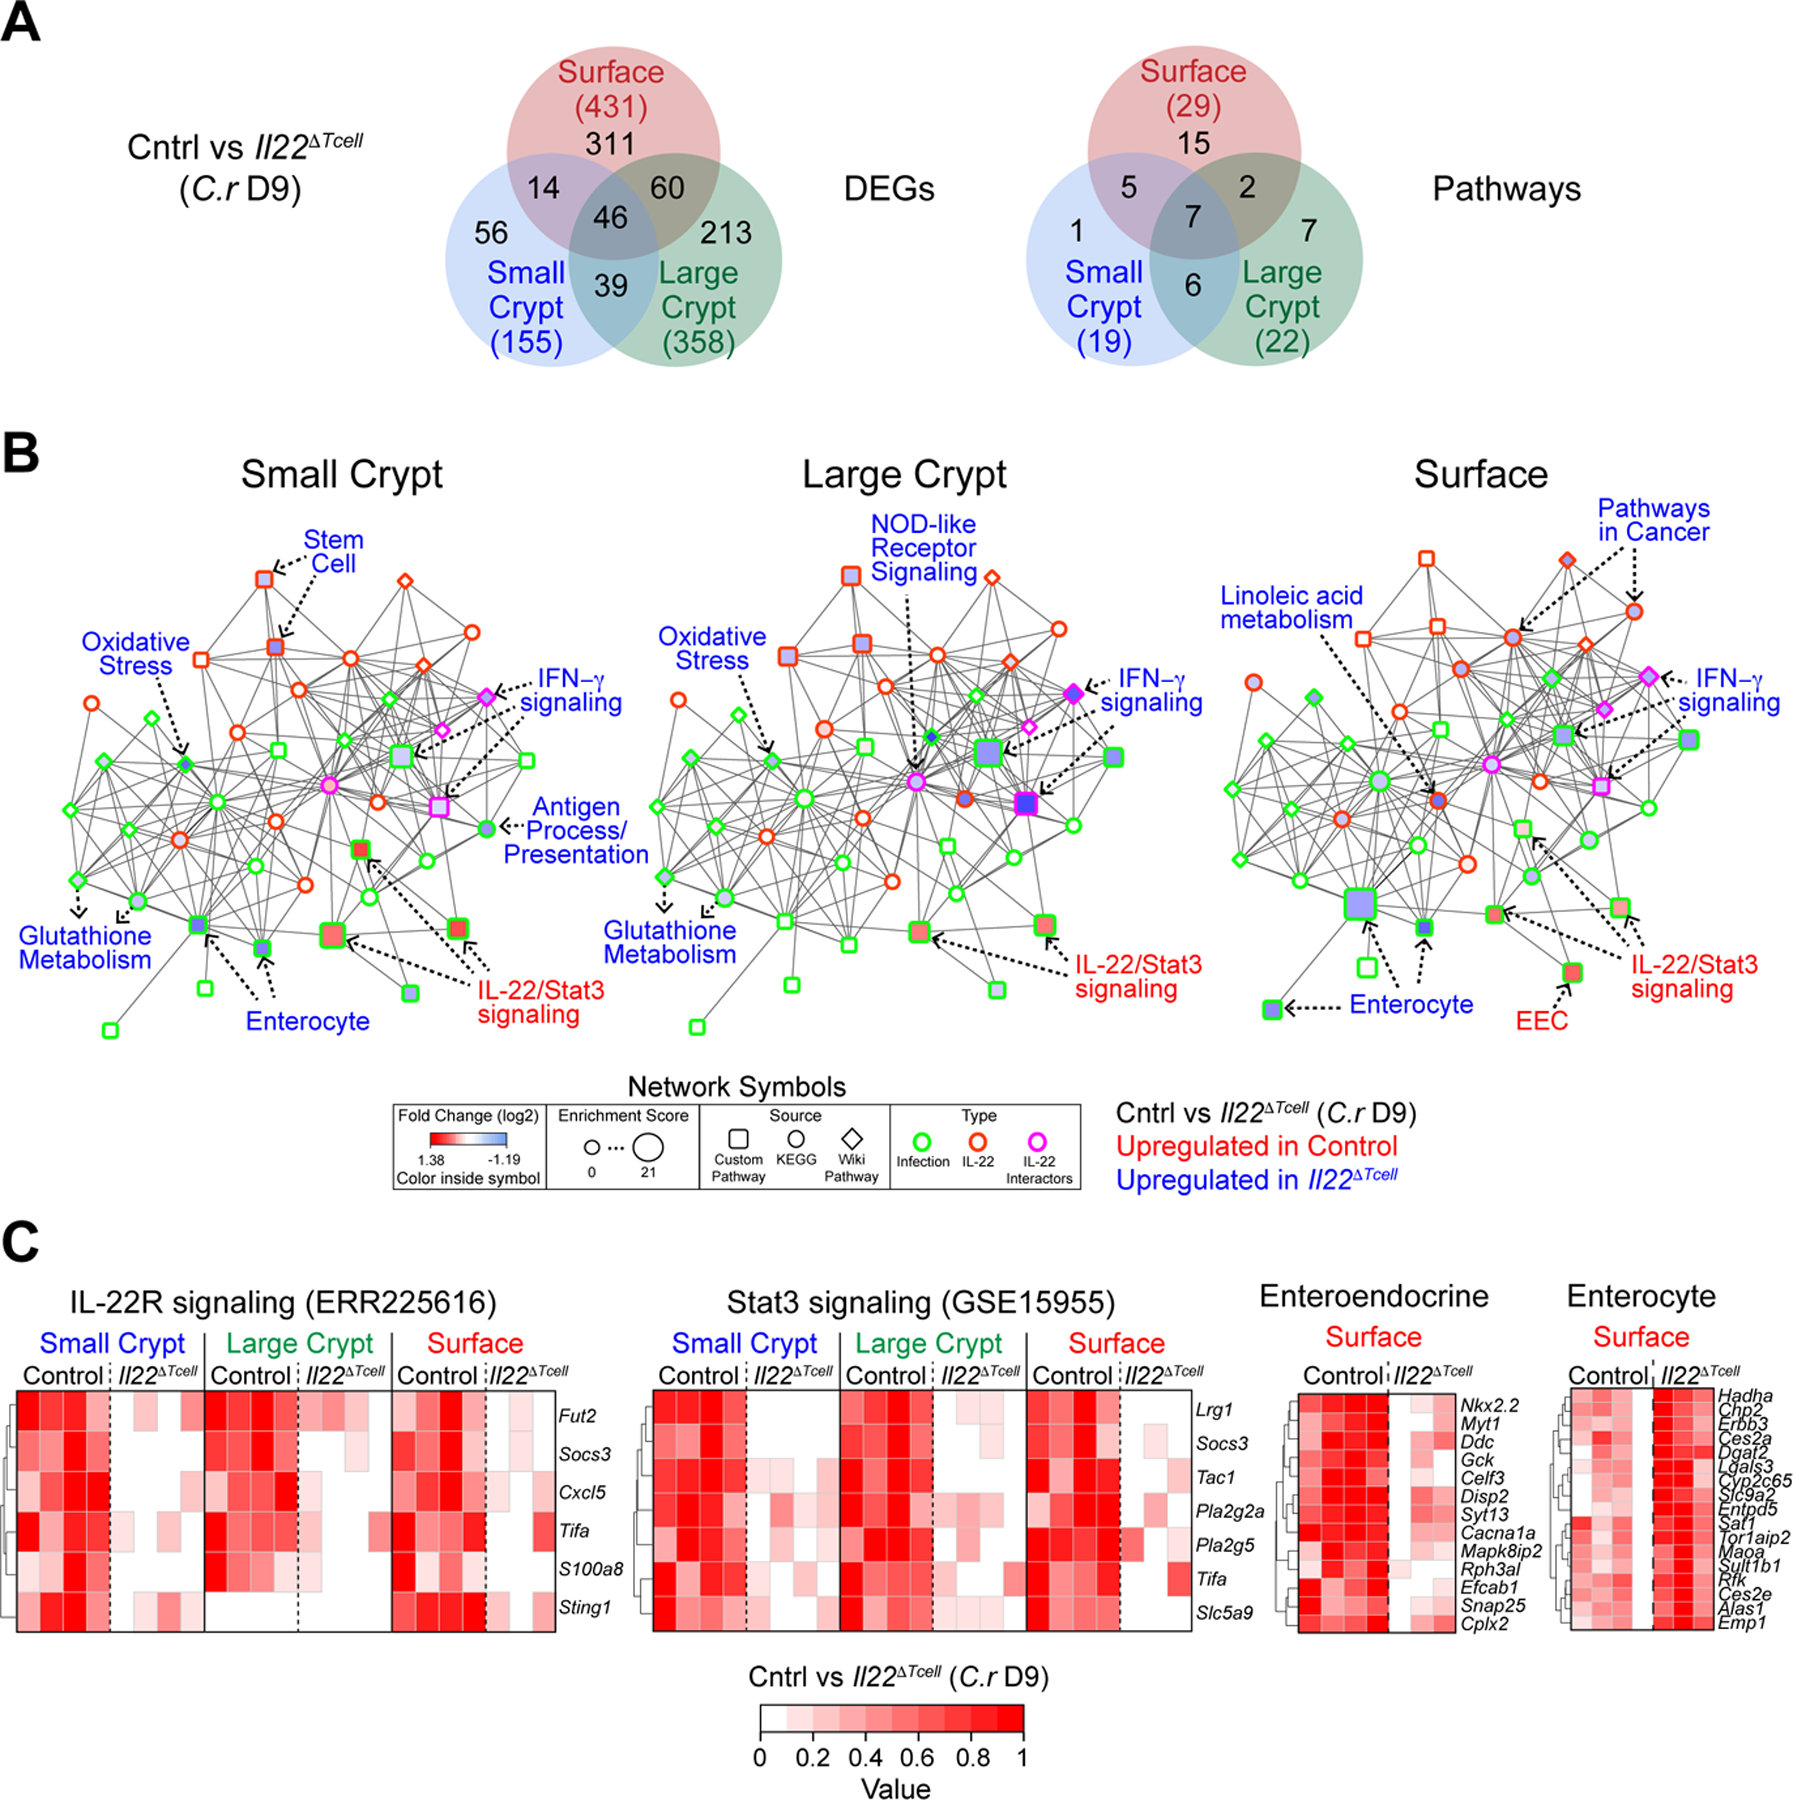
(A-C) RNA-seq of SC, LC and Srf IECs from mid/distal colons of day 9 C.r-infected Il22hCD4 and Il22∆Tcell mice.
(A) Venn diagram of DEGs and pathways in SC (red), LC (green) and Srf (red) IECs from day 9 C.r-infected Il22hCD4 and Il22∆Tcell. Total DEGs or Pathways (#).
(B) GNPA of SC, LC and Srf IECs from day 9 C.r-infected Il22hCD4 and Il22∆Tcell. Log2 fold change (symbol fill; up in Cntrl (red), down in Cntrl (blue)), Enrichment score (symbol size), Source: Custom Pathway (square), KEGG (circle), Wiki Pathway (diamond)), and Interaction: (symbol border; Infection (green), IL-22 (orange), IL-22 interactors (pink)).
(C) Heatmaps of top DEGs in IL-22R, STAT3 and custom IEC pathways.
2–3 mice per sample and 3–4 independent experiments per group. See also Figure S6.
T cell-derived IL-22 also amplified neutrophil-attractant chemokines and shifted mucin production and modification by IECs that contribute to host defense during C.r infection (Aujla et al., 2008; Bergstrom et al., 2008; Hopkins et al., 2019; Liang et al., 2010; Lindén et al., 2008; Lindén et al., 2009) (Figures 6D, 6E and S5E–S5G). Transcripts for Cxcl1, Cxcl2 and Cxcl5, which are recognized by neutrophils via CXCR2, were induced in both sIECs and cIECs, suggesting a central role for IL-22 signaling into IECs to regulate recruitment of neutrophils in the infected crypts, where they contribute to clearance of C.r (Kamada et al., 2015). Previous studies have identified an IL-22–induced shift in mucin production and its altered mucin fucosylation by IECs (Pham et al., 2014; Sugimoto et al., 2008; Turner et al., 2013), which we found was dependent on IL-22+ T cells. Thus, in addition to amplifying antimicrobial recognition and AMPs, T cell-derived IL-22 may also coordinate neutrophil recruitment to infected IECs and the colonic lumen, direct a shift in mucin production from Muc2 to Muc1 (Figures 6D, 6E, S5E–S5G and S4F), and alter mucin fucosylation, which may deprive C.r of an important energy source (Pham et al., 2014).
Genes repressed by T cell-derived IL-22 were a major component of the DEG profile (Figures 6D–6H and S5E–S5G). Notable from a combined gene set, network and pathway analysis (GNPA) were genes induced by tumor necrosis factor (TNF)α and interferon (IFN)γ (Figures 7A, 7B and S6). This included genes of the antigen processing and presentation (APP) pathway, particularly MHC class I and II genes, and the central transactivator of APP, Ciita (Martin et al., 1997; Steimle et al., 1993; Thelemann et al., 2014). Proinflammatory genes were also repressed (Figures 6D–6H, 7A–7B, S5E–S5G and S6A–S6B), including IFNγ-dependent chemokines Cxcl9 and Cxcl10, which recruit immune cells in type I responses, including Th1 cells. (Loetscher et al., 1996; Luster and Ravetch, 1987). Because IFNγ is required for GC loss and IEC proliferation during C.r infection (Chan et al., 2013), heightened IFNγ responses due to IL-22 deficiency may have contributed to enhanced GC hypoplasia and IEC damage, as well as increased crypt hyperplasia observed in Il22∆Tcell mice (Figures S4A–S4B). IL-22 is required to initiate DNA damage response (DDR) induced by ionizing radiation (Gronke et al., 2019); however, during C.r infection we found enhanced apoptosis and DDR in IECs from Il22∆Tcell mice (Figures S6D–S6E) perhaps reflective of elevated TNF and IFNγ responses. Moreover, DEGs repressed by IL-22 were characteristic of absorptive enterocytes (ECs; e.g., Ces2c, Cyp3a13, Ubd, Ugdh, Noct) (Figures 6D, 7B–7C, S5E–S5G and S6), as reflected in the enhanced EC signature by GNPA analysis (Figures 7B, 7C and S6). Many genes characteristic of mature ECs were enriched in Srf IECs from infected Il22∆Tcell mice compared to controls, suggesting T cell-derived IL-22 acts to repress maturation of ECs driven by IFNγ-driven hyperproliferation during infection, perhaps as a measure to deprive C.r of its cellular host for attachment and colonization. This was contrasted by enhancement of EEC gene signature in Srf IECs (e.g., Tac1, Adgrl1, Celf3, Myt1, Sct) (Figures 6D, 7B–7C, S5E–S5G and S6), implicating a regulatory role for T cell-derived IL-22 in programming EEC differentiation and/or function to alter local hormones. Collectively, these findings indicate that, in addition to shifting the type of mucus produced by IECs and enhancing expression of a select set of AMPs and chemokines, IL-22 provided by T cells plays an important role in modulating development of IECs that may restrain C.r invasion of the crypts—whether by promoting STAT3 activation to induce gene expression or repress aspects of IFN and TNF signaling.
Discussion
In this study we define a non-redundant role for IL-22+ T cells in antibacterial defense of colonic crypts. Our findings address a central, unresolved issue regarding the coordination of innate and adaptive immunity and specialization of ILCs and CD4 T cells. Since the discovery of ILC subsets and appreciation of their functional parallels with T-cell subsets (Bando and Colonna, 2016; Huntington et al., 2016; Song et al., 2015; Spits et al., 2013), it has been unclear what functions are unique to each immune cell population. Here we find that, despite their critical role in restraining bacterial colonization over the early course of enteropathogenic bacterial infection, ILC3s—and other IL-22-producing innate immune cells—induce weak STAT3 signaling that is limited to surface IECs. In contrast, T cells are charged with delivery of IL-22 to crypt and surface IECs as infection progresses, inducing robust, sustained STAT3 signaling in both IEC populations that is required to amplify gene expression programs essential for host defense against bacterial invasion.
Although the mechanisms by which IL-22–producing T cells achieve heightened activation of IECs are not yet fully defined, a major, if not sole, contributor would appear to be the geography of immune-cell positioning relative to the intestinal epithelium. Whereas most ILC3s are sequestered in lymphoid tissues and fail to increase their local numbers throughout infection (Ahlfors et al., 2014; Gasteiger et al., 2015), effector CD4 T cells generated in response to infection become the major population of IL-22+ cells in the inflamed mucosa and are positioned subjacent to IECs they are charged with protecting, most notably in the crypts. Here they activate IL-22/STAT3 signaling into cIECs and become the sole source for sustained activation of sIECs as the quality of these cells is altered by a shift in IEC maturation during infection. It will be important to determine whether this is due to increased local concentrations of IL-22, directed delivery of IL-22 to IECs in the context of MHCII-mediated non-classical antigen presentation, delivery of co-signals that amplify IL-22-mediated STAT3 activation, or a combination of these. Irrespective of mechanism, T cells would appear to deliver IL-22 to IECs on-site, whereas ILCs must deliver IL-22 long-range.
The host-protective effects of T cell-derived IL-22 on IECs are diverse and non-redundant. Consistent with a previous study showing IL-22 and not IL-6 activates IECs (Pickert et al., 2009), we found IL-22 induced STAT3 activation during each phase of C.r infection, reflective of IL-22’s critical role in antibacterial host defense (Basu et al., 2012; Sonnenberg et al., 2011a; Zheng et al., 2008). RNA-seq analyses revealed that T cell-derived IL-22 augments antimicrobial peptides (AMPs) and neutrophil-recruiting chemokines (Aujla et al., 2008; Boniface et al., 2005; Liang et al., 2010; Okita et al., 2016; Wittkopf et al., 2015; Wolk et al., 2006; Yamamoto et al., 2015; Zheng et al., 2008), alters mucin production and fucosylation (Pham et al., 2014; Sugimoto et al., 2008), and enhances expression of genes that restrain bacterial growth (e.g., Sting1, Lbp) (Aden et al., 2018; Wolk et al., 2006, 2007). Based on whole colon analyses from global IL-22–deficient mice, it has been proposed that IL-22–mediated host protection is due to upregulation of the Reg3 family of AMPs (Zheng et al., 2008) particularly Reg3β (Waldschmitt et al., 2019), which, unlike Reg3γ (Cash et al., 2006; Pham et al., 2014), has anti-microbial actions against Gram-negative bacteria (Miki et al., 2012; Stelter et al., 2011). Although we found that Reg3b and Reg3g transcripts were up-regulated in areas of C.r colonization—mid-distal colon—their expression was far greater in the proximal colon, which is not colonized during C.r infection (Basu et al., 2012; Wiles et al., 2004; data not shown). In contrast, IL-22-induced S100a family of AMPs and Lcn2 occurs in areas colonized by C.r. It is unclear if this reflects a particularly potent effect of IL-22–induced Reg3β in colonization resistance or rather a limited role for this AMP in protection against C.r, as has been shown for Reg3 γ (Pham et al., 2014). In this regard, we found that neither S100a9 nor IEC-derived Sting1 was required for crypt protection, leaving open the question of which factor, or combination of factors, induced by T cell-derived IL-22 support this critical function.
Invasion of colonic crypts by C.r has been observed in Cxcr2–/– mice, which have impaired neutrophil recruitment to the infected colon (Spehlmann et al., 2009). Our finding that T cell-derived IL-22 upregulated several CXCL chemokines that are ligands of CXCR2 (e.g., Cxcl1, Cxcl2, Cxcl5) provides a mechanism by which neutrophil recruitment during C.r infection may be orchestrated, and, in view of the important role for neutrophils in eradicating luminal bacteria (Kamada et al., 2015) suggests that this pathway may participate in antibacterial defense of crypts. Because neutrophils are themselves an important source of CXCL2 (Li et al., 2016), these findings implicate a possible feed-forward mechanism whereby recruitment of neutrophils to the infected mucosa is initiated by T cell-derived IL-22 activation of IECs and then amplified by incoming neutrophils. In preliminary studies, we have found Cxcl5 expression was limited to IECs (B.C., S.N.H., C.L.Z., and C.T.W., unpublished observation), suggesting that Cxcl5 may be important in directing neutrophils to sites of C.r-infected IECs. This will require further study. In any case, our findings identify a potential link between T cell-derived IL-22 and neutrophil recruitment that may aid in limiting C.r invasion of crypts. However, despite the important role for C.r-specific IgG responses in the ultimate clearance of infection (Bry and Brenner, 2004; Maaser et al., 2004)—thought to be due in part to antibody-dependent opsonization of the bacterium to enhance neutrophil-mediated phagocytosis (Kamada et al., 2015)—we found no requirement for antibody-dependent protection of the crypts. Thus, any actions of neutrophils in defense of colonic crypts may be adequate without requirement for IgG-mediated bacterial opsonization, although this, too, will require further study.
A major effect of T cell-derived IL-22 was its tempering of pro-inflammatory and developmental programming effects on IECs exerted by TNF and IFN signaling. The actions of IFN γ on IECs have been shown to result in acceleration of IEC proliferation (hyperplasia) and goblet cell loss thought to protect the crypts from bacterial incursion (Chan et al., 2013) and further distance ISCs in the crypt bases from invading pathogens and their products (Kaiko et al., 2016; Liang et al., 2017; Matsuki et al., 2013; Okada et al., 2013). However, we find that, in the absence of T-cell production of IL-22, the crypts are not protected despite unopposed actions of IFN signaling that result in increased goblet cell loss and crypt hyperplasia. Accordingly, the alterations in IEC developmental programming induced by IFNγ signaling are inadequate without coordinate actions of IL-22 delivered by T cells. Thus, IFNγ and IL-22 must cooperate in defense of the crypts as deficiency of either leads to bacterial invasion.
Deficiency of IL-22 resulted in enhanced IFNγ-dependent expression of Ciita and thus major components of the antigen processing and presentation pathway by IECs, raising the intriguing possibility that, in addition to its other actions, IFNγ acts to promote the function of IECs as non-classical APCs in order to recruit more potent, protective IL-22 signaling from Th17 and Th22 cells. Furthermore, IL-22 deficiency resulted in enhanced expression of IFNγ-induced IEC-derived chemokines (i.e. Cxcl9, Cxcl10) and enhanced recruitment of T cells to IECs. Together, these data suggest IFNγ–induced T cell recruitment and activation may potentiate protective IL-22 signals to crypt IECs resulting in a feedback loop in which IL-22 then controls IFN-γ signaling in IECs to limit damage caused by chronic stimulation. It was recently reported that antigen presentation by Lgr5+ ISCs in the small intestine elicits IL-10 from Foxp3+ Tregs that sustains homeostatic ISC self-renewal and during intestinal infections may recruit effector T cell cytokines that shift ISC programming to host-defensive IEC differentiation (Biton et al., 2018). Consistent with this—and extending it—we find that T cell-derived IL-22, also a member of the IL-10 cytokine family, drives strong STAT3 activation in all IECs, not just ISCs, thereby restraining IFNγ-induced IEC differentiation while promoting antimicrobial defense. Because we detect no STAT3 activation in colonic IECs at steady state, including ISCs, this suggests that, in contrast to the small intestine, neither IL-10 nor IL-22 has direct homeostatic actions on colonic IECs. In any case, in its non-redundant role to defend colonic crypts from bacterial invasion, T cell-derived IL-22, like IL-10, would appear to play an essential role in STAT3-dependent maintenance of ISCs to insure restitution of the epithelial barrier and preservation of mucosal integrity. Going forward, it will be important to determine whether it is the proximity of IL-22-producing T cells to the epithelium, their recognition of antigen presented on IECs, or both that underlie their unique ability to activate crypt IECs for antimicrobial defense.
Limitations of study
We show that IL-22+ innate immune cells signal to colonic superficial IECs to limit early C.r colonization, whereas IL-22+ CD4 T cells signal to colonic crypt IECs, thereby activating STAT3-dependent IEC programs that contribute to protection of colonic crypts from C.r invasion. Future studies will be needed to determine which gene or genes are required for crypt protection and through what mechanisms. In addition, it remains to be determined whether IFNγ-induced T cell trafficking to cIECs and/or upregulation of MHC CII on cIECs coordinates with IL-22-dependent STAT3 activation of cIECs for host protection during C.r infection. Moreover, future studies should include identification of the specific colonic IEC subsets that are targeted by CD4 T cells and response to IL-22 and IFNγ signals, and determine whether IEC reprogramming contributes to crypt protection.
STAR Methods
RESOURCE AVAILABILITY
Lead Contact
Further information and requests for resources and reagents should be directed to and will be fulfilled by the Lead Contact, Casey T. Weaver (cweaver@uab.edu).
Materials Availability
The mouse lines obtained from other laboratories are described below and may require a Material Transfer Agreement (MTA) with the providing scientists. Il22hCD4 mice generated in this study are available from our laboratory, also with an MTA.
Data and code availability
Raw and processed data files for RNA sequencing analysis have been deposited in the NCBI Gene Expression Omnibus under accession number GEO: GSE114338. Accession numbers are listed in the key resources table. This paper does not report original code but details are included in the method details section. Any additional information required to reanalyze the data reported in this paper is available from the lead contact upon request.
KEY RESOURCES TABLE
| REAGENT or RESOURCE | SOURCE | IDENTIFIER |
|---|---|---|
| Antibodies | ||
| Armenian hamster IgG FITC | Jackson ImmunoResearch | Cat# 127–095-099; RRID: AB_2338981 |
| CD28 (clone 37.51) – T cell culture | BD Biosciences | Cat# 553295; RRID: AB_394764 |
| CD3 unconjugated (clone 17A2) – Tissue stain | eBioscience/ThermoFisher | Cat# 14–0032-85; RRID: AB_467054 |
| CD3 (clone 145–11) – T cell culture | UAB Hybridoma Core | N/A |
| CEACAM1/CD66a PE (clone CC1) | eBioscience/ThermoFisher | Cat# 12–0661-80; RRID: AB_1311201 |
| E. coli Polyvalent 8 LPS | Accurate Chemical and Scientific Corp | Cat# YCC312–012 |
| EpCAM/CD326 PE-cy7 (clone G8.8) | eBioscience/ThermoFisher | Cat# 25–5791-80; RRID: AB_1724047 |
| EpCAM/CD326 FITC (clone G8.8) | eBioscience/ThermoFisher | Cat# 11–5791-82; RRID: AB_11151709 |
| EpCAM/CD326 Biotin (clone G8.8) | eBioscience/ThermoFisher | Cat# 13–5791-80; RRID: AB_1659715 |
| EpCAM/CD326 eFLuor 450 (clone G8.8) | eBioscience/ThermoFisher | Cat# 48–5791-82; RRID: AB_10717090 |
| CD16/CD32 (FcBlock; clone 2.4G2) | BD Biosciences | Cat# 553142; RRID: AB_394657 |
| CD45 eFluor 350 (clone 30-F11) | eBioscience/ThermoFisher | Cat# 48–0451-80; RRID: AB_1518807 |
| CD45 PE (clone 30-F11) | eBioscience/ThermoFisher | Cat# 12–0451-82; RRID: AB_465668 |
| CD45.2 FITC (clone 104) | eBioscience/ThermoFisher | Cat# 11–0454-82; RRID: AB_465061 |
| Fluorescein Alexa Fluor 488 | Invitrogen/ThermoFisher | Cat# A-11090; RRID: AB_221562 |
| GFP Alexa Fluor 488 | Invitrogen/ThermoFisher | Cat# A-11122; RRID: AB_221569 |
| hCD4 PEcy7 (clone RPA-T4) | eBioscience/ThermoFisher | Cat# 25–0049-41; RRID: AB_1659697 |
| hCD4 APC (clone RPA-T4) | eBioscience/ThermoFisher | Cat# 17–0049-42; RRID: AB_1272048 |
| IFNγ APC (clone XMG1.2) – Tissue stain | eBioscience/ThermoFisher | Cat# 17–7311-82; RRID: AB_469504 |
| IFNγ (clone XMG1.2) – T cell culture | UAB Hybridoma Core | N/A |
| IL-4 (clone 11B11) | UAB Hybridoma Core | N/A |
| IL-7R (CD127) AF700 (clone A7R34) | eBioscience/ThermoFisher | Cat# 56–1271-80; RRID: AB_657613 |
| IL-33R PerCP-eFluor 710 (clone RMST2–2) | eBioscience/ThermoFisher | Cat# 46–9335-80; RRID: AB_2573882 |
| IL-17A PerCP (clone TC11–18H10) | BD Biosciences | Cat# 560666; RRID: AB_1937311 |
| IL-22 PE (clone 1H8PWSR) | eBioscience/ThermoFisher | Cat# 12–7221-82; RRID: AB_10597428 |
| mCD4 PerCP (clone RM4–5) | eBioscience/ThermoFisher | Cat# 45–0042-82; RRID: AB_1107001 |
| mCD4 APC (clone RM4–5) | eBioscience/ThermoFisher | Cat# 17–0042-82; RRID: AB_469323 |
| mCD4 BV711 (clone RM4–5) | Biolegend | Cat# 100557; RRID: AB_2562607 |
| mCD4 PE-Cy7 (clone RM4–5) | BD Biosciences | Cat# 552775; RRID: AB_394461 |
| MHC CII (I-A/I-E) FITC (clone 114.15.2) | eBioscience/ThermoFisher | Cat# 11–5321-85; RRID: AB_465233 |
| MHC CII (I-A/I-E) eFluor 450 (clone 114.15.2) | eBioscience/ThermoFisher | Cat# 48–5321-80; RRID: AB_1272241 |
| Mouse Ig (H+L) unconjugated (Coating/ELISA) | Southern Biotech | Cat# 1010–01; RRID: AB_2794121 |
| Mouse IgG HRP labeled (Detection/ELISA) | Southern Biotech | Cat# 1030–05; RRID: AB_2619742 |
| Muc1 (clone MH1 (CT2)) | Invitrogen/ThermoFisher | Cat# MA5–11202; RRID: AB_11000874 |
| Muc2 (clone H-300) | Santa Cruz | Cat# sc-15334; RRID: AB_2146667 |
| NKp46/CD335 BV421 (clone 29A1.4) | Biolegend | Cat# 137611; RRID: AB_10915472 |
| Phospho-Stat3 (Tyr705; clone D3A7) | Cell Signaling | Cat# 9145; RRID: AB_2491009 |
| Rabbit Alexa Fluor 488 | Invitrogen/ThermoFisher | Cat# A11008; RRID: AB_143165 |
| Rabbit Alexa Fluor 594 | Invitrogen/ThermoFisher | Cat# A11037: RRID: AB_2534095 |
| Rat IgG Biotin | BD Biosciences | Cat# 554014; RRID: AB_395209 |
| TCRbeta FITC (clone H57–597) | eBioscience/ThermoFisher | Cat# 11–5961-85; RRID: AB_465324 |
| TCRbeta PE (clone H57–597) | Biolegend | Cat# 109208; RRID: AB_313431 |
| TCRbeta PE (clone H57–597) | eBioscience/ThermoFisher | Cat# 12–5961-82; RRID: AB_466066 |
| TCRbeta eFluor450 (clone H57–597) | eBioscience/ThermoFisher | Cat# 48–5961-82; RRID: AB_11039532 |
| TCRbeta APC (clone H57–597) | Biolegend | Cat# 109211; RRID: AB_313434 |
| TCRbeta APC (clone H57–597) | eBioscience/ThermoFisher | Ca# 17–5961-82; RRID: AB_469481 |
| TCRgamma/delta FITC (clone eBioGL3) | eBioscience/ThermoFisher | Cat# 11–5711-82; RRID: AB_465238 |
| TCRgamma/delta PE (clone eBioGL3) | eBioscience/ThermoFisher | Cat# 12–5711-82; RRID: AB_465934 |
| TCRgamma/delta APC (clone eBioGL3) | eBioscience/ThermoFisher | Cat# 17–5711-82; RRID: AB_842756 |
| Bacterial and virus strains | ||
| Citrobacter rodentium (C.r) DBS100 | ATCC | ATCC 51459 |
| C.r-GFP | B.A. Vallance | N/A |
| C.r-Lux ICC180 | G. Frankel and S. Wiles | N/A |
| SW102 (modified DH10B strain DY380) | NCI Frederick | https://notendur.hi.is/bmo/Recombineering Website.htm |
| Biological samples | ||
| Chemicals, peptides, and recombinant proteins | ||
| Mouse IL-22 BAC | CHORI | Cat# RP24–227B3 |
| 10% buffered formalin | Fisher Scientific | Cat# SF93–4 |
| 2-methyl butane | Sigma/Millipore | Cat# 270342 |
| 2N Sulfuric Acid | R&D/Fisher | Cat# DY994 |
| BamHI | NEB | Cat# R0136 |
| Bovine serum albumin | Sigma/Millipore | Cat# A7906 |
| Chloroform | Sigma/Millpore | Cat# C2432 |
| ClaI | NEB | Cat# R0197 |
| Collagenase IV | Sigma/Millipore | Cat# C5138 |
| DNase | Sigma/Millipore | Cat# DN25 |
| DTT | Sigma/Millipore | Cat# 43819 |
| EcoRI | NEB | Cat# R0101 |
| EDTA | Invitrogen/Fisher | Cat# AM9260G |
| Eosin | Fisher Scientific | Cat# SE23–500D |
| Ethanol | Fisher Scientific | Cat# BP2818–4 |
| Fetal Bovine Serum | Atlanta Biologicals | Cat# S11150 |
| Fluorescein-labeled UEA-1 | Vector Labs | Cat# FL-1061 |
| Glacial Acetic Acid | Fisher Scientific | Cat# A38–212 |
| L-Glutamine | Corning/Fisher | Cat# 25–005-Cl |
| HBSS | Corning/Fisher | Cat# MT21–021-CV |
| Hematoxylin | Fisher Scientific | Cat# CS401–1D |
| Hepes | Corning/Fisher | Cat# 25–060-Cl |
| Hydrochloric Acid | Fisher Scientific | Cat# A144–500 |
| 6xHis-tagged-Intimin-beta385 | A.D. O’Brien | N/A |
| Ionomycin | Sigma/Millipore | Cat# 407952 |
| Iscove’s DMEM, 1X | Corning/Fisher | Cat# 10–016-CV |
| Klenow | NEB | Cat# M0210 |
| Live/Dead (L/D) Fixable Near-IR dead cell dye | Invitrogen/ThermoFisher | Cat# L10119 |
| LongAmp Taq DNA polymerasae | NEB | Cat# M0323S |
| MEM Nonessential Amino acids | Corning/Fisher | Cat# 25–025-Cl |
| 2-Mercaptoethanol | Gibco/Fisher | Cat# 21–985-023 |
| Methanol, Histology grade | Fisher Scientific | Cat# A433S-4 |
| NaH2PO4 | Sigma/Millipore | Cat# S3139 |
| Na2HPO4 | Sigma/Millipore | Cat# S9390 |
| NotI | NEB | Cat# R0189 |
| OCT compound | Fisher Scientific | Cat# 14–373-65 |
| Paraformaldehyde EM grade | Fisher Scientific | Cat# 50–980-494 |
| PBS | Fisher | Cat# MT21–040-CM |
| Penicillin/Streptomycin (Pen/Strep) | Corning/Fisher | Cat# 30–002-Cl |
| Percol | Fisher | Cat# 45–001-747 |
| PKH26 reference microbeads | Sigma/Millipore | Cat# P4758 |
| PMA | Sigma/Millipore | Cat# P1585 |
| Prolong Gold Antifade Mountant | Invitrogen/ThermoFisher | Cat# P36934 |
| Prolong Gold Antifade Mountant with DAPI | Invitrogen/ThermoFisher | Cat# P36935 |
| Protease Inhibitor | Roche | Cat# 11836145001 |
| Proteinase K | NEB | Cat# P8107S |
| Purified Mouse IgG (Standard for ELISA) | Southern Biotech | Cat# 0107–01 |
| rmIL-23 | R&D systems/Fisher | Cat# 1887-ML-010 |
| rmIL-6 | R&D systems/Fisher | Cat# 406-ML-025 |
| RPMI 1640 | Corning/Fisher | Cat# 10–040-CM |
| Salmon Sperm DNA | Applied Biosystems/ThermoFisher | Cat# AM9680 |
| SA-Alexa Fluor 594 | Invitrogen/ThermoFisher | Cat# S-11227 |
| Sarcosyl (N-Lauroyl-Sarosine) | Sigma/Millipore | Cat# L9150 |
| SDS | Sigma/Millipore | Cat# L4390 |
| SignalStain Antibody Diluent | Cell Signaling | Cat# 8112L |
| Sodium chloride | Fisher Scientific | Cat# BP358–10 |
| Sodium hydroxide | Fisher Scientific | Cat# BP359–212 |
| Sodium pyruvate | Corning/Fisher | Cat# 25–000-Cl |
| Sucrose | Fisher Scientific | Cat# BP220–212 |
| T4 DNA ligase | NEB | Cat# M0202M |
| Target retrieval solution (10x) | Dako | Cat# S169984–2 |
| TMB solution | Invitrogen/ThermoFisher | Cat# 002023 |
| TO-PRO-3 | Invitrogen/ThermoFisher | Cat# T3605 |
| Tris Base | Fisher Scientific | Cat# BP152–5 |
| Trizol LS Reagent | Invitrogen/ThermoFisher | Cat# 10296028 |
| Tween-20 | Sigma/Millpore | Cat# P7949 |
| Xylene | Fisher Scientific | Cat# X5–4 |
| Critical commercial assays | ||
| Avidin/Biotin Blocking Kit | Vector Labs | Cat# SP-2001 |
| BD Cytofix/Cytoperm Kit | BD Biosciences | Cat# 555028 |
| High Prime labeling Kit | Roche | Cat# 11–585-592–001 |
| HisPur Ni-NTA Spin Purification Kit | Fisher/Thermo Scientific | Cat# PI88228 |
| mIL-22 Quantikine ELISA kit | R&D Systems | Cat# M2200 |
| iScript RT Supermix | Bio-Rad | Cat# 170–8841 |
| LCM Staining Kit | Ambion/ThermoFisher | Cat# AM1935 |
| MS Columns | Miltenyi Biotec | Cat# 130–042-201 |
| miRNeasy Micro Kit | Qiagen | Cat# 217084 |
| Naïve CD4+ T cell Isolation Kit, Mouse | Miltenyi Biotec | Cat# 130–104-453 |
| Nugen Universal Plus mRNA-seq library prep kit | Nugen | Cat# 0520 |
| SsoAdvanced Universal SYBR Green Supermix | Bio-Rad | Cat# 172–5275 |
| Deposited data | ||
| RNA sequencing data | This paper | GEO: GSE114338 |
| RNA sequencing data | Pham et al., 2014 | ENA: ERR225616 |
| Microarray data | Zheng et al., 2008 | GEO: GSE10010 |
| Microarray data | Pickert et al., 2009 | GEO: GSE15955 |
| Single cell RNA sequencing data | Haber et al., 2017 | GEO: GSE92332 |
| Experimental models: Cell lines | ||
| Experimental models: Organisms/strains | ||
| Mouse: Il22hCD4.fl | This paper | N/A |
| Mouse: Il22EIIa (EIIa-cre x Il22hCD4) | This paper | N/A |
| Mouse: Il22Plzf (Zbtb16/Plzf-cre x Il22hCD4) | This paper | N/A |
| Mouse: Il22∆Tcell (CD4-cre x Il22hCD4) | This paper | N/A |
| Mouse: Rorc/EGFP BAC reporter | G. Eberl | N/A |
| Mouse: Aicda–/–.µs–/– | F.E. Lund | N/A |
| Mouse: C57BL/6J | Jackson Laboratory | JAX: 000664 |
| Mouse: CD4-cre | Jackson Laboratory | JAX: 022071 |
| Mouse: Ella-cre | Jackson Laboratory | JAX: 003724 |
| Mouse: Zbtb16/Plzf-cre | Jackson Laboratory | JAX: 024529 |
| Mouse: B6 Albino | Charles River Laboratory | Crl: 022 |
| Mouse: CD1 (ICR) | Charles River Laboratory | Crl: 493 |
| Mouse: Actb-Flpe; backcrossed to B6 Albino | Jackson Laboratory | JAX: 003800 |
| Mouse: Rag1−/− | Jackson Laboratory | JAX: 002216 |
| Mouse: S100a9−/− | T. Vogl | N/A |
| Mouse: Sting1fl/fl | Jackson Laboratory | JAX: 031670 |
| Mouse: Sting1Villin(Villin-cre x Sting1fl/fl) | This paper | N/A |
| Mouse: Villin-cre | Jackson Laboratory | JAX: 021504 |
| Oligonucleotides | ||
| Muc2 qPCR primers: AAGTGGCATTGTGTGCCAACCA (forward), TGCAGCACTTGTCATCTGGGTT (reverse) | IDT | N/A |
| Scnn1a qPCR primers: TGGGCAGCTTCATCTTTAC (forward), CCAGAGATTGGAGTTGTTCTT (reverse) | IDT | N/A |
| Slc12a2 qPCR primers: CATACACTGCCGAGAGTAAAG (forward), CCACGATCCATGACAATCTAA (reverse) | IDT | N/A |
| Primers for southern blot 5’ Il22 probe: TCCACAGGACTGAGGAAAGAAGC (forward), CAGAAGGATTGATGTTGAAGGGC (reverse) | IDT | N/A |
| Primers for southern blot 3’ Il22 probe: TTTTCAATTTCCCCCTGTTGC (forward), GGAGGTGAGGTTTACAAAACGATCC (reverse) | IDT | N/A |
| Primers for genotyping Il22hCD4 homozygosity: GACAATCAGACATGGGAAACTGC (forward), ACTGACACGCAAATGCCTACATC (reverse); WT: 1019 bp (Il22) and 991 bp (Iltifb); Heterozygous: 1019 bp (Il22) and 991 bp (Iltifb) and 1051 bp (targeted Il22); Homozygous: 1051 bp (targeted Il22) and 991 bp (Iltifb) | IDT | N/A |
| Primers for genotyping Il22hCD4 floxed deletion: CCCATCCAGAGACAAGAATGAAGC (forward), TTTTAGAAGGCAGGAAGGAGCAG (reverse); Heterozygous or Homozygous: 654 bp | IDT | N/A |
| Primers for genotyping CD4-cre: CGAGTGATGAGGTTCGCAAG (forward); TGAGTGAACGAACCTGGTCG (reverse) | IDT | N/A |
| Primers for genotyping Plzf-cre: CTCCTCCATGCAGAAACACA (WT), CCCCAGGAAATAATCCAAGG (Common), TAGTGAAACAGGGGCAATGG (Mutant) | IDT | N/A |
| Primers for genotyping EIIa-cre: GCGGTCTGGCAGTAAAAACTATC (forward), GTGAAACAGCATTGCTGTCACTT (reverse) | IDT | N/A |
| Primers for 5’ arm of homology into PL451: ATAGCGGCCGCAACCTTTTTTTTCCAAC (forward), TCGGAATTCTTTTCTAGCTTCTTCTCGCTCAGAC (reverse) | IDT | N/A |
| Primers for 3’ arm of homology into PL451: GCTGGATCCGAAGAACTGCTCCTTCCTGCC (forward), ATAGCGGCCGCACACACACAAAACCACAG (reverse) | IDT | N/A |
| GalK primer to insert loxP into first intron: CTAATTTATAAAAAAAACTATTTCTTAAAATGAAAA GCAAACAGAGCACGCCTGTTGACAATTAATCATCGGCA (forward), TTCGCCATTCCACTCTGTACCTGCATGGTCAGAA CACCATGCTATAAATATCAGCACTGTCCTGCTCCT T (reverse) | IDT | N/A |
| Primers to Gap Repair into PL253: TAAGCGGCCGCCATCATCATCAACAAACTTCAAG (5’ forward arm), AGTGGATCCGTCTAAAAGCCCGACTGCGTGG (5’ reverse arm), ATTGGATCCAGCGGGCTTTGAACTACTG (3’ forward arm), GCATCTAGACAGCACTTAGGAGACAGAGAGAGGC (3’ reverse arm) | IDT | N/A |
| Recombinant DNA | ||
| IL-22 BAC clone | CHORI | Cat# RP24–227B3 |
| pMACS 4-IRES.II | Miltenyi Biotec | Cat# 130–091-888 |
| PL253 | NCI Frederick | https://notendur.hi.is/bmo/Recombineering Website.htm |
| PL451 | NCI Frederick | https://notendur.hi.is/bmo/Recombineering Website.htm |
| pGalK | NCI Frederick | https://notendur.hi.is/bmo/Recombineering Website.htm |
| Software and algorithms | ||
| FlowJo software v10.6.1 | FlowJo | https://www.flowjo.com/ |
| Nikon NIS-Elements AR 4.20 software | Nikon | https://www.nikon.com/ |
| Nikon NIS-Elements BR 4.5 software | Nikon | https://www.nikon.com/ |
| ImageJ software | NIH | https://imagej.nih.gov/ij/ |
| Adobe software (Photoshop, Illustrator) | Adobe | https://www.adobe.com/products/catalog.html |
| Prism 5 | GraphPad | http://www.graphpad.com/scientific-software/prism/ |
| Leica LMD software | Leica | https://www.leica.com/ |
| GSEA | Subramanian et al., 2005 | http://software.broadinstitute.org/gsea/index.jsp |
| STAR v2.5.3 | Dobin et al., 2013 | N/A |
| SAMtools v0.1.18 | Li et al., 2009 | N/A |
| HTSeq v0.7.2 | Anders et al., 2015 | N/A |
| DESeq2 v1.18.1 | Love et al., 2014 | N/A |
| ASHR algorithm | Stephens, 2017 | N/A |
| Fgsea R package v1.4.0 | Sergushichev, 2016 | N/A |
| MSigDB | Liberzon et al., 2015; 2011; Subramanian et al., 2005a | N/A |
| ggplot2 | Wickham, 2009 | N/A |
| limmaR package | Ritchie et al., 2015 | N/A |
| PAGER2.0 | Yue et al., 2018 | N/A |
| Other | ||
EXPERIMENTAL MODEL AND SUBJECT DETAILS
Mice
Il22hCD4.fl reporter and floxed mice were generated by targeting an IRES and truncated hCD4 gene into the fifth exon (between the stop codon and 3’ untranslated region), and loxP sites that flanked the entire Il22 gene (see Method Details below). B6 Albino (CRL 022) and CD-1 (CRL 493) used for generating chimeric mice were purchased from Charles River Laboratories (CRL). C57BL/6 (WT; JAX 000664), Actb-Flpe (JAX 003800), EIIa-cre (JAX 003724), Plzf-cre (JAX 024529), mCd4-cre (JAX 022071), Rag1–/– (JAX 002216), Sting1fl/fl (JAX 031670) and Villin-cre (JAX 021504) mice were purchased from Jackson Laboratory (JAX). RorcEGFP mice were kindly provided by Dr. Gerard Eberl (Lochner et al., 2008) (Instit Pasteur, France). Aicda–/–.µs–/– mice were kindly provided by Dr. Frances E. Lund (UAB). S100a9–/– mice were kindly provided by Dr. Thomas Vogl (Manitz et al., 2003) (Instit Immunology, Germany). In most experiments, littermates were used as controls and experimental adult animals (8–12 wk old) were co-caged in groups of 2–7 mice. Both sexes were used per experimental group whenever possible. All mouse strains were bred and maintained at UAB in accordance with IACUC guidelines.
Citrobacter rodentium Infections
Citrobacter rodentium (C.r) strain, DBS100 (ATCC 51459) was used for all survival and kinetics experiments. For whole-body imaging experiments, the bioluminescent C.r strain ICC180 (derived from DBS100) was used (Wiles et al., 2006) (generously provided by Drs. Gad Frankel and Siouxsie Wiles, Imperial College London). Animals were imaged for bioluminescence using an IVIS-100 Imaging System (Xenogen). For flow cytometry analysis and to track C.r in situ, a strain of C.r expressing GFP (derived from DBS100) was used (Bergstrom et al., 2010) (kindly provided by Dr. Bruce A. Vallance). A fresh, single colony was grown in 5 ml LB overnight at 37°C with agitation for 12–14 hrs. Next day, 1 ml of overnight culture was added to 250 ml LB, incubated at 37°C with agitation for 4–5 hrs and then stopped when OD600 reached 1.0 on GeneQuant Pro spectrophotometer. Bacteria was pelleted at 25°C, 3000 rpm for 15 minutes and then resuspended in 5 ml sterile 1x PBS. Mice were inoculated in a total volume of 100 µl via gastric gavage.
METHOD DETAILS
Generation of Il22hCD4 reporter and floxed mice
The BAC clone RP24–227B3, which contains the Il22 gene and Iltifb (Il22 pseudogene) was purchased from Children’s Hospital Oakland Research Institute (CHORI). Briefly, a targeting cassette containing an EMCV IRES, neomycinR cassette, truncated hCD4 gene (pMACS 4-IRES.II; Miltenyi Biotec) and 3’ loxP site flanked with arms of homology to exon 5 of the Il22 gene was recombineered into RP24–227B3 (see Figure S1A). First, 5’ arm of homology to exon 5 of the Il22 gene was cloned into NotI-EcoRI-digested pMACS 4-IRES.II (contains EMCV IRES and truncated hCD4) using T4 DNA Ligase (NEB). Second, 3’ arm of homology to exon 5 was cloned into BamH1-NotI-digested PL451 (contains Neomycin cassette and loxP; NCI Frederick) using T4 DNA Ligase (NEB). Third, Step 2 was digested with EcoRI (NEB), blunted with Klenow (NEB) and then digested with ClaI (NEB). Next, Step 3 was cloned into Step 4 with T4 DNA ligase (NEB) and then this recominbeering fragment (5’ arm of homology, EMCV IRES, truncated hCD4, Neo cassette, 3’ loxP site and 3’ arm of homology) was linearized with NotI (NEB) and recombineered into RP24–227B3 BAC clone that was transformed into SW102 strain by electroporation (186 ohms, 1.75 kV, 25 µF). Lastly, 5’ loxP site was added upstream of exon 1 using a galK cassette (NCI Frederick) that was PCR amplified with LongAmp Taq DNA polymerase (NEB), followed by recombineering-based gap repair using 5’ and 3’ arms of homology and cloning into PL253 (NCI Frederick) to generate an ES targeting construct. The Il22hCD4 targeting construct (100 ng) was linearized with NotI (NEB) and electroporated into Bruce4 mouse ES cells. Drug-resistant clones that were properly targeted for the Il22 gene and not the pseudogene was selected (based on Southern-blot analysis; see Figure S1B) and microinjected into albino C57BL/6 blastocysts at the UAB Transgenic and Genetically Engineered Models (TGEM) Core. Founder lines were established from chimeric mice, crossed to Actb-Flpe mice to remove the Neomycin cassette and then bred to homozygosity. See Oligonucleotide section in Key Resources Table for detailed primer information.
Southern Blot
Genomic DNA (gDNA) from ES clones (grown on 96-well plates) was prepared by first placing washed and aspirated plates at −80°C for 3 hours, followed by incubation in Lysis buffer (10 mM Tris (pH 7.5), 10 mM EDTA (pH 8.0), 10 mM NaCl, 0.5% Sarcosyl, 1 mg/ml Proteinase K) at 60°C overnight. The next day, 100 µl of cold Precipitation Solution (75 mM NaCl in 200 proof ethanol) was added per well and stored at RT for 1 hr to adhere DNA to the plate. Plates were then washed gently with 70% ethanol and air dried at RT for 1 hr. Plates were stored in a humidified chamber at 4°C. To screen the 5’ end of the targeting cassette, gDNA was digested with EcoRV (NEB) and for the 3’ end, gDNA was digested with BstXI (NEB) at 37°C for 3 hrs. gDNA was then separated on a 1% agarose gel in TBE buffer overnight at 35–40V. The gDNA/gel was then depurinated with 0.125M Hydrochloric acid (Fisher) for 10 min with gentle agitation, rinsed in deionized water, denatured in Denaturation buffer [0.5N NaOH and 1.5M NaCl (Fisher)] for 30 min with gentle agitation and then transferred to Hybond-XL membranes (GE Healthcare Amersham/Fisher). Synthesized DNA specific to regions of homologous recombination (see Oligonucleotide section in Key Resources Table) was labeled with 32P (Amersham) using the High Prime labeling kit (Roche) according to manufacturer’s instructions and unincorporated 32P was removed with G-50 Sephadex Quick Spin columns (Fisher). Prehybridization (30 min to 1 hr) followed by hybridization (overnight) were carried out at 65°C in Church buffer (25 ml 1M sodium phosphate buffer (pH 7.2), 17.5 ml 20% SDS, 0.1 ml 0.5M EDTA (pH 8.0), 0.5 ml salmon sperm DNA (10 mg/ml), 6.9 ml H20). Probes (5 × 10⁷ cpm) were boiled for 5 min prior to hybridization. Next day, blots were washed in Washing Solution (40 ml 1M sodium phosphate buffer (pH 7.2), 50 ml 20% SDS, 910 ml H20) at 60°C for 25 min, dried and placed in saran wrap in a phosphor cassette with an intensifying screen. The cassette was stored at −80°C for 1–3 days and then visualized with a Phosphorimager (Amersham). See details in Key Resources Table.
Isolation of Intestinal Cells and Bacteria
Intestinal tissues were flushed, opened longitudinally and then cut into strips of 1 cm length. Tissue pieces were incubated for 20 min at 37°C with 1mM DTT (Sigma), followed by 2 mM EDTA (Invitrogen) in H5H media (1x HBSS, 5% FBS, 20 µM Hepes, and 2.5 µM 2-β-ME). For analysis of C.r-GFP released from intestinal epithelial cells (IECs), supernatant from DTT/EDTA prep were first spun at 500 rpm for 5 min at 4°C to remove cell debris and then spun at 8000 rpm for 15 min at 4°C. GFP+ bacteria were enumerated by flow cytometry in log scale using PKH26 reference beads (Sigma). In separate experiments and for analysis of IELs and IECs, cells from the DTT/EDTA prep were spun down at 1500 rpm for 10 minutes at 4°C. For isolation of lamina propria (LP) cells, tissue pieces remaining after the DTT/EDTA step were chopped and incubated for 40 min at 37°C with Collagenase D (2 mg/ml; Sigma) and DNase (1 mg/ml; Sigma) in R10 media (1x RPMI 1640, 10% FBS, 1x Pen/Strep, 1x NEAA, 1mM, Sodium pyruvate and 2.5 mM 2-β-ME). IECs and LP cells were then purified on a 40%/75% Percoll gradient by centrifugation for 20 min at 25°C and 600g with no brake. See details in Key Resources Table.
Flow Cytometry and Cell Sorting
Colon cells were stained with Fc Block (Clone 2.4G2) followed by staining with fluorescent-labeled antibodies in FACS buffer (1x PBS and 2% FBS) on ice in 96 well round bottom plates. IECs were stained and sorted in 1x PBS with 5% FBS and 2mM EDTA to reduce cell clumping on ice in 1.5 ml microcentrifuge tubes. For intracellular staining, cells were fixed and permeabilized using BD Cytofix/Cytoperm kit (BD Bioscience). Samples were acquired on an LSRII flow cytometer (BD Biosciences) or Attune NxT flow cytometer (Life Technologies) and analyzed with FlowJo software. Cells were sorted on either a BD FACS Aria or Aria II (BD Biosciences). The following antibodies/reagents were used: anti-CD11b (M1/70), anti-CD45 (30-F11), anti-CD45.2 (104), anti-Ceacam1/CD66a (CC1), EpCAM/CD326 (G8.8), anti-human CD4 (RPA-T4), anti-mouse CD4 (RM4–5), anti-IFNγ (XMG1.2), anti-IL-7R/CD127 (A7R34), anti-IL-17A (TC11–18H10), anti-IL-22 (1H8PWSR), anti-IL-33R/ST2 (RMST2–2), anti-Ly6G (1A8), anti-MHC CII (I-A/I-E; 114.15.2), anti-NKp46/CD335 (29A1.4), anti-TCRβ (H57–597), anti-TCRγδ (eBioGL3), Live/Dead Fixable Near-IR dead cell dye and TO-PRO-3. See details in Key Resources Table.
Tissue Preparation
For immunostaining, LI tissues were either fixed in 2% PFA for 2 hrs at RT or in 4% PFA overnight at 4°C (for pSTAT3 stain). Tissue was then briefly rinsed in cold 1x PBS or put through several cold 1x PBS washes including an overnight incubation (for pSTAT3 stain), and then embedded in O.C.T. (Tissue-Tek) and frozen with 2-methyl butane chilled with liquid nitrogen. For pSTAT3 staining, tissue sections were permeabilized in cold methanol (Fisher) for 10–15 min at −20°C. Tissue sections were blocked at RT for 30 minutes with 10% mouse serum in 1x PBS and 0.05% Tween-20. Antibodies were diluted in 2% BSA/PBS/Tween-20 and incubated for 20–30 min at RT or ON’ at 4°C (pSTAT3 stain). For histological analysis, colons were segmented (proximal, middle, distal), cut longitudinally and immediately placed in 10% buffered formalin (Fisher) and processed for paraffin embedding and H&E staining. Histopathology scoring was performed in a double-blinded fashion according to published guidelines (Bleich et al., 2004). For mucin staining, colon tissue was placed in Carnoy’s fixative (60 ml ethanol, 10 ml glacial acetic acid, 30 ml chloroform) for 1 hr, followed by 95% ethanol for 1 hr and then 70% ethanol until embedded in paraffin. Antigen retrieval was performed for 15 min in the autoclave (250°F) using 1x Target antigen retrieval solution (Dako; S169984–2). All antibody steps were performed as described above. The following antibodies/reagents were used: anti-CD3 (17A2), anti-Ceacam1/CD66a (CC1), anti-EpCAM/CD326 (G8.8), anti-Muc1 (MH1 (CT2)), anti-Muc2 (H-300), anti-armenian hamster IgG FITC, anti-Fluorescein Alexa Fluor 488, anti-GFP Alexa Fluor 488, anti-rabbit Alexa Fluor 488, anti-rabbit Alexa Fluor 594, anti-rat Biotin, Streptavidin-Alexa Fluor 594, Prolong Gold antifade mountant with or without DAPI and UEA-1 lectin. See details in Key Resources Table.
CD4+ T-Cell Preparation and Culture
Naïve CD4+ T cells were purified from pooled spleen and lymph nodes with Naïve CD4+ T cell Isolation Kit and MS columns, according to manufacturer’s instructions (Miltenyi Biotec). CD4+ T cells were cultured at a ratio of 1:10 with irradiated feeder cells for 3 days in I10 (Iscove’s DMEM supplemented with 10% FBS, 100 IU/ml penicillin, 100 ug/ml streptomycin, 1 µM sodium pyruvate, 1 x nonessential amino acids, 20 µM Hepes, 2.5 µM β-mercaptoethanol and 2 µM L-glutamine). Th22 polarizations were supplemented with 40 ng/ml rmIL-6, 20 ng/ml rmIL-23, 2 µg/ml anti-CD28, 2.5 µg/ml anti-CD3 (clone 145–11), 10 µg/ml anti-IFNg (clone XMG1.2) and 10 mg/ml anti-IL-4 (clone 11B11). See details in Key Resources Table.
Microscopy
Confocal images were obtained using a Nikon A1 confocal microscope and Nikon NIS-Elements AR 4.20 program at the HRIF Imaging core at UAB. Epifluorescent and H&E images were taken using a Nikon Eclipse E800 microscope and either a Nikon Cool-SNAP Myo camera or SPOT camera, respectively. Cells and area measurements were enumerated using the Nikon NIS-Elements BR 4.5 software. LCM images were obtained using a DFC450C RGB CCD camera and Laser Microdissection LMD6 microscope (Leica Microsystems).
Laser Microdissection
Unfixed colon tissue was frozen in O.C.T. compound (Tissue-Tek) in liquid nitrogen-cooled 2-methyl butane (Sigma). Ten micron sections were melted onto PEN-membrane glass slides (Leica) and stained with Cresyl Violet dye (Ambion). Stained epithelial cells (150,000–250,000 µm2 per cap) were captured into microcentrifuge tubes using a Leica LMD6 instrument. RNA was extracted using the miRNeasy Micro RNA isolation kit (Qiagen). See details in Key Resources Table.
Real Time PCR
cDNA synthesis was performed with iScript reverse transcription (RT) Supermix (Bio-Rad) according to manufacturer’s instructions. cDNA amplification was analyzed with SsoAdvanced Universal SYBR Green Supermix (Bio-Rad) in a Biorad CFX qPCR instrument. The following primers (generated by IDT) were used: Muc2, AAGTGGCATTGTGTGCCAACCA (forward) and TGCAGCACTTGTCATCTGGGTT (reverse); Scnn1a, TGGGCAGCTTCATCTTTAC (forward) and CCAGAGATTGGAGTTGTTCTT (reverse); Slc12a2, CATACACTGCCGAGAGTAAAG (forward) and CCACGATCCATGACAATCTAA (reverse). See details in Key Resources Table.
Colony counts of C.r-GFP
Liver and spleen were removed under sterile conditions, placed in 2–3 ml H5H in Miltenyi M tubes, weighed, and homogenized using Miltenyi GentleMACS Dissociator using Program RNA_01. Homogenate was filtered through a 70 µm cell strainer and spun at low speed 500 x g for minutes to remove cellular debris and then spun at 8000 rpm for 15 minutes to pellet cells. Cell pellet was resuspended in 1x PBS and serially diluted and plated in duplicate on LB plates containing 30 µg/ml Chloramphenicol. Colonies were counted after 24 hr incubation at 37°C to determine the log10 CFU per gram of tissue. See details in Key Resources Table.
Fecal pellet Extracts
Fecal pellets were collected in 1x PBS with Complete protease inhibitor cocktail (Roche), vortexed and spun at 13,000 rpm for 10 minutes at 4°C to remove debris. Clarified supernatant was transferred to a clean microfuge tube and stored at −20°C. See details in Key Resources Table.
Purification of recombinant C. rodentium Intimin
E. coli were transformed with a plasmid encoding histidine-tagged Intimin385β (extracellular C-terminal 385 amino acids of Intimin from C. rodentium) kindly provided by Dr. Alison D. O’Brien (Sinclair and O’Brien, 2004). Recombinant Intimin protein was then purified by Ni-NTA affinity chromatography. See details in Key Resources Table.
ELISAs
For IgG ELISAs, a 96-well high-binding assay plate (Corning) was coated with either 10 µg/ml of unlabeled polyclonal anti-mouse Ig (H+L) for total IgG ELISA or 5 µg/ml of recombinant Intimin protein for C.r-specific IgG ELISA in 1x PBS overnight at 4°C. After 4 washes with 1x PBS, 1% BSA in 1x PBS Blocking solution was added to the plate and incubated at RT for 1 hr. After 4 washes with 1x PBS/Tween-20, samples were diluted in 1% BSA/PBS/Tween-20 and incubated at RT for 2 hrs. After 4 washes with 1x PBS/Tween-20, 1:4000 dilution of anti-mouse IgG (H+L)-HRP conjugated was incubated at RT for 2 hrs. After the final 4 washes, 100 µl of a TMB single solution (Life Tech) was added to the plate and the chemiluminescence signal was stopped with 2N Sulfuric acid and read at 450 nm. All samples were run in triplicate and IgG standards were included on all plates. The following antibodies purchased from Southern Biotech were used: anti-mouse Ig (H+L) unconjugated (for coating plate), purified mouse IgG (for standard) and anti-mouse IgG HRP labeled (for detection). For IL-22 protein quantitation, a mouse/rat IL-22 Quantikine ELISA kit (R&D Systems, M2200) was used according to manufacturer’s protocol. See details in Key Resources Table.
RNA-sequencing and Data Analysis
Three subsets of colonic epithelial cells were isolated from naïve and D9 C.r-infected Il22hCD4 (Control) and Il22∆Tcell (CD4 T cell-specific IL-22-deficient) mice. Tissue was pooled from 2–3 mice per condition and cells were sorted directly into Trizol LS. Total RNA was extracted using Trizol LS/Chloroform extraction (Invitrogen/ThermoFisher) and miRNeasy Micro2.5. Kit (Qiagen) according to the manufacturer’s protocol. Next, 30 ng of total RNA was used to prepare mRNA-seq library using the Nugen Universal Plus mRNA-seq library prep kit (Nugen), and libraries were sequenced on the SE50 Illumina 2500 in Rapid Run Mode. Single-end reads with lengths of 50 nucleotides (~20M reads per condition) were generated for subsequent bioinformatics analysis. Adaptors were trimmed and aberrant reads were removed using TrimGalore (version 0.4.5). The quality-controlled reads were mapped onto the mouse genome build GRCm38 (ENSEMBL.mus_musculus.release-75)(Hubbard et al., 2002) using STAR (version 2.5.3) (Dobin et al., 2013). BAM files were sorted using SAMtools (version 0.1.18) (Li et al., 2009), and reads were counted for each gene using HTSeq (version 0.7.2) (Anders et al., 2015). Differential expression analysis was performed using DESeq2 (version 1.18.1) (Love et al., 2014) using R (version 3.4.3). Dispersion shrinkage of fold changes was performed with the ASHR algorithm (Stephens, 2017). The fgsea R package (version 1.4.0) (Sergushichev, 2016) was used for gene set enrichment. Gene sets used include those from the mouse cell atlas of the small intestine (Haber et al., 2017) and MSigDB (Liberzon et al., 2011, 2015; Subramanian et al., 2005). Data is publicly available in GEO (Barrett et al., 2013) under GSE114338.
Extended Bioinformatics Methods
Pre-processing of RNA-sequencing data
The pre-processing pipeline was operated through the UNIX shell. Each raw fastq file was processed using the default settings of each analysis tool except as specified below. Standard Illumina adaptors were used to trim reads with TrimGalore. The ENCODE options for standard long RNA-seq were utilized for mapping using STAR, as defined in the STAR manual (Dobin et al., 2013). Quality of libraries was assessed by overall mapping rate, and libraries with less than 70% mapping rate were discarded from further analysis.
TrimGalore (version 0.4.5) --illumina
STAR (version2.5.3) --outSAMtype BAM SortedByCoordinate Unsorted --outFilterType BySJout --outFilterMultimapNmax 20 --alignSJoverhangMin 8 –alignSJDBoverhangMin 1 --outFilterMismatchNmax 999 --outFilterMismatchNoverReadLmax 0.04 -- alignIntronMin 20 --alignIntronMax 100000 --alignMatesGapMax 100000
HTSeq (version 0.7.2) --stranded=yes -t exon
Statistical analysis of RNA-sequencing data
The R software environment (version 3.4.3) with BioConductor (version 3.6) was used for statistical analysis. The random seed was set to 15144305.
Exploratory analysis and Quality Control
Gene counts were filtered for genes catalogued by ENSEMBL (ENSEMBL.mus_musculus.release-75) as protein_coding. We subjected cleaned sequencing data to a battery of exploratory analyses using the R package DESeq2 (version 1.18.1) (Love et al., 2014) in order to inform model selection for analysis of differential expression, including distance matrices and principal component plots of the top 500 differentially expressed genes after rlog transformation (Love et al., 2014). We visually inspected these together in order to identify low-quality samples, outliers, and unexpected trends relating to batch ID or other important covariates to be used in modeling. Additional QC measures were carried out as described in the DESeq2 vignette (http://bioconductor.org/packages/devel/bioc/vignettes/DESeq2/inst/doc/DESeq2.html).
Count Plots
Counts were normalized using the sequencing depth and plotted on the y-axis on a log10-scale (Figure 6E). In each count plot, different groups are plotted along the x-axis, while these normalized counts are plotted on the y-axis (log10-scale). The means of these groups were used to generate the endpoints for each line plotted; as such the lines visualize the mean difference in normalized expression between pairs of groups.
Differential Gene Expression Analysis
We tested for differential expression using a negative binomial generalized linear model as described previously (Love et al., 2014). We modeled the effect of IL-22-deficient T cells during infection in each location tested (small crypt cell samples, large crypt cell samples, surface cell samples) separately (1) and then pooled naive cells from all of these locations and examined the effect of IL-22-deficient T cells in pooled naive and infected intestinal epithelial cells (2). We also modeled the effect of infection itself (i.e., of naive versus infected cells) in small crypt samples (3), large crypt samples (4), surface samples (5), and pooled control samples (6) and pooled samples from D9 C.r-infected Il22∆Tcell (7). Next, we tested the effect of location on gene expression within the intestinal crypt (surface, small crypt, or large crypt) in naive (8) and infected cells (9). Finally, we were interested in whether cells from D9 C.r-infected Control and Il22∆Tcell mice demonstrate cell-type specific differences.
Generally, Wald Tests were selected in place of likelihood ratio tests and stratified analysis outperformed pooled analysis for most models. Final model specifications for each of these tests are available by reasonable request. We set alpha, our allowable type I error rate, at a 0.05 after correction for multiple testing using independent hypothesis weighting (Ignatiadis et al., 2016). For each model, we assessed model fit and model validity based on dispersion estimates, overall type I error rate, Cooks’ distances, inspection of count-dispersion plots and MA plots (log2 fold change versus log2 (base mean/normalized read counts) for competing models for each research question.
MA plots
MA plots were generated using ggplot2 (Wickham, 2009) (Figures S5E–G). Shrunken log2 fold change (y-axis) in gene expression attributable to the variable of interest were plotted against the mean of normalized counts for all the samples to generate MA plots. Ashr was used as shrinkage estimators in order to aid visualization of log fold change data (Love et al., 2014; Stephens, 2017). This was in turn used for the assessment of model validity and performance. For these plots, as elsewhere, coloration (in red) indicates that the adjusted p-value (from the linear modeling step, above) of an observation was less than alpha, set at an FDR of 0.05. Color saturation was also based on adjusted p-value; observations with padj < 0.05 were fully saturated, with saturation decreasing to 0.2 as padj increases to 1. Genes were labeled using the ggrepel package in R.
Gene Set Enrichment Analysis (GSEA)
To prepare data for gene set enrichment analysis, results of differential gene expression analysis were ranked by signed p-value. Gene sets from the small intestine mouse cell atlas (Haber et al., 2017) were curated by taking the union of signature marker genes for each cell type from droplet and plate-based datasets (Custom Pathways). Interferon and tumor necrosis factor gene sets were obtained from the Hallmark Gene Set Collection (Liberzon et al., 2015) and from the ImmGen interferon transcriptional network (Mostafavi et al., 2016). Additionally, three pathways that represent immune defense genes (GO_cellular_defense_response, GO_innate_immune_response, and GO_regulation_of_defense_response) were selected from the Gene Ontologies collection (Ashburner et al., 2000; The Gene Ontology Consortium, 2017). Publicly available datasets from experiments utilizing IL-22 in intestinal tissue were used to create custom IL-22-related gene sets. When possible, analyzed data from original publications were used to create gene sets; however, when this data was not available, raw transcriptomic data was analyzed in a manner consistent with the reported methods. The limma R package (Ritchie et al., 2015) was used to analyze data from GSE15955 (Pickert et al., 2009) and GSE10010 (Zheng et al., 2008) for differential expression. For GSE15955, up- and down-regulated genes were selected that had a fold-change greater than 2 and adjusted p-value less than 0.1. For GSE10010, the top 250 genes by adjusted p-value were selected and divided into up-regulated and down-regulated gene sets. Additionally, IL-22–regulated genes identified in Il22ra1–/– mice (Pham et al., 2014) were obtained from supplemental data to create a gene set of IL-22-induced genes.
A p-value quantifying the likelihood that a given gene set displays the observed level of enrichment for DE genes was calculated using Fast Gene Set Enrichment Analysis (fgsea, version 1.4.0) (Sergushichev, 2016) with 1 million permutations. Gene set enrichment p-values of Normalized Enrichment Scores (NES) were corrected with the Benjamini-Hochberg procedure (Benjamini and Hochberg, 1995).
Barcode Plots, Dot Plots, and 2-way Scatterplots
We used the plotEnrichment (Sergushichev, 2016) function from the fgsea package to generate barcode plots (Figure 6H). The Random Walk curves were recolored in Adobe Illustrator according to sign of NES value. We generated dot plots of NES values using ggplot2 (Wickham, 2009) (Figures 6F–G). Coloration of points was based on a continuous gradient from most negative to most positive NES, with the transition from blue to red coloration at NES = 0. The size of dots is directly proportional to -log10 of the adjusted p-value generated from the enrichment of each pathway for each comparison. 2-way plots were made by plotting DEGs (adjusted p-value < 0.01) on the x-axis (red), y-axis (blue) or significant in x-axis and y-axis (purple) (Figure 6D).
Pathway Enrichment analysis and network construction
Wikipathways, KEGG pathways and Custom pathways (see GSEA section above) were used for identifying DEGs and Pathways in D9 C.r-infected Il22∆Tcell vs D9 C.r-infected Il22hCD4 mice (Figure 7 and Figure S6). First, we performed an enrichment analysis using a hypergeometric test as implemented in PAGER 2.0 (Yue et al., 2015, 2018). The false discovery rate (FDR) was set to 0.05 using Benjamini–Hochberg procedure (Benjamini and Hochberg, 1995). Second, redundant pathways were identified using two metrics: pathway membership similarity and content similarity. Specifically, all pairs of pathways were tested for similarity of pathway membership using the Jaccard index, and the cutoff was set to 0.7. In addition, content similarity was assessed using the Jaccard index of pathway names’ bigrams, and the cutoff was again set to 0.7, retaining the pathway that contained a larger proportion of the genes. Following this, we established m-type pathway-to-pathway relationships using the hypergeometric test in PAGER 2.0 and set the FDR cutoff to 0.01, then these networks were visualized using Cytoscape software (Shannon et al., 2003). In order to annotate the m-type networks, we conducted an enrichment analysis. Interactors of IL-22 were identified by querying Protein-Protein Interactions in the STRING database (Szklarczyk et al., 2017) with a score ≥0.85. Then, we performed enrichment analysis using IL-22 and its interactors and set alpha at 0.05. By taking the union of enriched pathways from infected (C.r D9) and naive samples, we identified a network of pathways relevant to the infection. Finally, we evaluated the importance of each pathway by computing a final score (fs), which was set equal to the distance-based sum of all pairwise samples log2 fold change (aggregated at the pathway level) alongside the distance-based sum of the pairwise samples’ Enrichment Scores (ES).
QUANTIFICATION AND STATISTICAL ANALYSIS
All statistical tests were done with GraphPad Prism software. The appropriate statistical test for each experiment is noted in the figures. For all graphs, bars or lines mean and error bars indicate s.e.m. For data plotted on log scale, log-transformed data was compared. Statistical significance was calculated with either ANOVA or the nonparametric Mann-Whitney test. One-way ANOVAs were run with post-hoc Tukey tests. Two-way ANOVAs were run with Bonferroni posttests.
Supplementary Material
Highlights.
ILCs and T cells localize to distinct microanatomic niches during C.r infection
IL-22+ innate cells target surface IECs to limit early bacterial colonization
IL-22+ T cells target crypt IECs to prevent C.r dissemination into colonic crypts
IL-22+ T cells amplify IEC-derived host defense genes and repress IFN-induced genes
Acknowledgments
We thank R.A. Kesterson and UAB TGEM core for ES cell microinjection, UAB CFAR core for cell sorting, UAB CPL for FFPE tissue processing, S. Williams and UAB HRIF core for assistance with confocal microscopy, UAB LCM core for LC imaging and UAB SAIF core for animal imaging. This work was supported by grants from the NIH and Crohn’s and Colitis Foundation (C.T.W.), T32 training grant funds from NIH/NIAID and the UAB Training Program in Immunologic Diseases and Basic Immunology (C.L.Z., D.J.S.), UAB MSTP training grant funds (B.F.F., J.R.S) and NIH/NIDDK F30 grant (J.R.S).
Footnotes
Publisher's Disclaimer: This is a PDF file of an unedited manuscript that has been accepted for publication. As a service to our customers we are providing this early version of the manuscript. The manuscript will undergo copyediting, typesetting, and review of the resulting proof before it is published in its final form. Please note that during the production process errors may be discovered which could affect the content, and all legal disclaimers that apply to the journal pertain.
Declaration of Interests
The authors declare no competing interests.
References
- Aden K, Tran F, Ito G, Sheibani-Tezerji R, Lipinski S, Kuiper JW, Tschurtschenthaler M, Saveljeva S, Bhattacharyya J, Häsler R, et al. (2018). ATG16L1 orchestrates interleukin-22 signaling in the intestinal epithelium via cGAS–STING. J Exp Med 215, 2868–2886. [DOI] [PMC free article] [PubMed] [Google Scholar]
- Ahlfors H, Morrison PJ, Duarte JH, Li Y, Biro J, Tolaini M, Meglio PD, Potocnik AJ, and Stockinger B (2014). IL-22 Fate Reporter Reveals Origin and Control of IL-22 Production in Homeostasis and Infection. J Immunol 193, 4602–4613. [DOI] [PMC free article] [PubMed] [Google Scholar]
- Akdis M, Palomares O, van de Veen W, van Splunter M, and Akdis CA (2012). TH17 and TH22 cells: A confusion of antimicrobial response with tissue inflammation versus protection. J Allergy Clin Immun 129, 1438–1449. [DOI] [PubMed] [Google Scholar]
- Allen A, Hutton DA, and Pearson JP (1998). The MUC2 gene product: a human intestinal mucin. Int J Biochem Cell Biology 30, 797–801. [DOI] [PubMed] [Google Scholar]
- Anders S, Pyl PT, and Huber W (2015). HTSeq—a Python framework to work with high-throughput sequencing data. Bioinformatics 31, 166–169. [DOI] [PMC free article] [PubMed] [Google Scholar]
- Ashburner M, Ball CA, Blake JA, Botstein D, Butler H, Cherry JM, Davis AP, Dolinski K, Dwight SS, Eppig JT, et al. (2000). Gene Ontology: tool for the unification of biology. Nat Genet 25, 25–29. [DOI] [PMC free article] [PubMed] [Google Scholar]
- Aujla SJ, Chan YR, Zheng M, Fei M, Askew DJ, Pociask DA, Reinhart TA, McAllister F, Edeal J, Gaus K, et al. (2008). IL-22 mediates mucosal host defense against Gram-negative bacterial pneumonia. Nat Med 14, 275–281. [DOI] [PMC free article] [PubMed] [Google Scholar]
- Bando JK, and Colonna M (2016). Innate lymphoid cell function in the context of adaptive immunity. Nat Immunol 17, 783–789. [DOI] [PMC free article] [PubMed] [Google Scholar]
- Barker N, van Es JH, Kuipers J, Kujala P, van den Born M, Cozijnsen M, Haegebarth A, Korving J, Begthel H, Peters PJ, et al. (2007). Identification of stem cells in small intestine and colon by marker gene Lgr5. Nature 449, 1003–1007. [DOI] [PubMed] [Google Scholar]
- Barker N, van de Wetering M, and Clevers H (2008). The intestinal stem cell. Gene Dev 22, 1856–1864. [DOI] [PMC free article] [PubMed] [Google Scholar]
- Barrett T, Wilhite SE, Ledoux P, Evangelista C, Kim IF, Tomashevsky M, Marshall KA, Phillippy KH, Sherman PM, Holko M, et al. (2013). NCBI GEO: archive for functional genomics data sets—update. Nucleic Acids Res 41, D991–D995. [DOI] [PMC free article] [PubMed] [Google Scholar]
- Basu R, O’Quinn DB, Silberger DJ, Schoeb TR, Fouser L, Ouyang W, Hatton RD, and Weaver CT (2012). Th22 Cells Are an Important Source of IL-22 for Host Protection against Enteropathogenic Bacteria. Immunity 37, 1061–1075. [DOI] [PMC free article] [PubMed] [Google Scholar]
- Benjamini Y, and Hochberg Y (1995). Controlling the False Discovery Rate: A Practical and Powerful Approach to Multiple Testing. J Royal Statistical Soc Ser B Methodol 57, 289–300. [Google Scholar]
- Berger CN, Crepin VF, Roumeliotis TI, Wright JC, Carson D, Pevsner-Fischer M, Furniss RCD, Dougan G, Dori-Bachash M, Yu L, et al. (2017). Citrobacter rodentium Subverts ATP Flux and Cholesterol Homeostasis in Intestinal Epithelial Cells In Vivo. Cell Metab 26, 738–752. [DOI] [PMC free article] [PubMed] [Google Scholar]
- Berger T, Togawa A, Duncan GS, Elia AJ, You-Ten A, Wakeham A, Fong HEH, Cheung CC, and Mak TW (2006). Lipocalin 2-deficient mice exhibit increased sensitivity to Escherichia coli infection but not to ischemia-reperfusion injury. Proc National Acad Sci 103, 1834–1839. [DOI] [PMC free article] [PubMed] [Google Scholar]
- Bergstrom KSB, Guttman JA, Rumi M, Ma C, Bouzari S, Khan MA, Gibson DL, Vogl AW, and Vallance BA (2008). Modulation of Intestinal Goblet Cell Function during Infection by an Attaching and Effacing Bacterial Pathogen. Infect Immun 76, 796–811. [DOI] [PMC free article] [PubMed] [Google Scholar]
- Bergstrom KSB, Kissoon-Singh V, Gibson DL, Ma C, Montero M, Sham HP, Ryz N, Huang T, Velcich A, Finlay BB, et al. (2010). Muc2 protects against lethal infectious colitis by disassociating pathogenic and commensal bacteria from the colonic mucosa. Plos Pathog 6:e1000902, 1–25. [DOI] [PMC free article] [PubMed] [Google Scholar]
- Bergstrom KSB, Morampudi V, Chan JM, Bhinder G, Lau J, Yang H, Ma C, Huang T, Ryz N, Sham HP, et al. (2015). Goblet cell derived RELM- b recruits CD4+ T cells during infectious colitis to promote protective intestinal epithelial cell proliferation. PLoS Pathog 11, e1005108. [DOI] [PMC free article] [PubMed] [Google Scholar]
- Biton M, Haber AL, Rogel N, Burgin G, Beyaz S, Schnell A, Ashenberg O, Su C-W, Smillie C, Shekhar K, et al. (2018). T Helper Cell Cytokines Modulate Intestinal Stem Cell Renewal and Differentiation. Cell 175, 1307–1320. [DOI] [PMC free article] [PubMed] [Google Scholar]
- Bleich A, Mähler M, Most C, Leiter EH, Liebler–Tenorio E, Elson CO, Hedrich HJ, Schlegelberger B, and Sundberg JP (2004). Refined histopathologic scoring system improves power to detect colitis QTL in mice. Mamm Genome 15, 865–871. [DOI] [PubMed] [Google Scholar]
- Boniface K, Bernard F-X, Garcia M, Gurney AL, Lecron J-C, and Morel F (2005). IL-22 Inhibits Epidermal Differentiation and Induces Proinflammatory Gene Expression and Migration of Human Keratinocytes. J Immunol 174, 3695–3702. [DOI] [PubMed] [Google Scholar]
- Borenshtein D, Schlieper KA, Rickman BH, Chapman JM, Schweinfest CW, Fox JG, and Schauer DB (2009). Decreased expression of colonic Slc26a3 and carbonic anhydrase IV as a cause of fatal infectious diarrhea in mice. Infect. Imm 77, 3639–3650. [DOI] [PMC free article] [PubMed] [Google Scholar]
- Brandtzaeg P, Gabrielsen TO, Dale I, Müller F, Steinbakk M, and Fagerhol MK (1995). The leukocyte protein L1 (calprotectin): putative nonspecific defense factor at epithelial surfaces. Adv Exp Med Biol 371A, 201–206. [DOI] [PubMed] [Google Scholar]
- Bry L, and Brenner MB (2004). Critical Role of T Cell-Dependent Serum Antibody, but Not the Gut-Associated Lymphoid Tissue, for Surviving Acute Mucosal Infection with Citrobacter rodentium, an Attaching and Effacing Pathogen. J Immunol 172, 433–441. [DOI] [PubMed] [Google Scholar]
- Bry L, Brigl M, and Brenner MB (2005). CD4+ T Cell Effector Functions and Costimulatory Requirements Essential for Surviving Mucosal Infection with Citrobacter rodentium. Infect Immun 74, 673–681. [DOI] [PMC free article] [PubMed] [Google Scholar]
- Cash HL, Whitham CV, Behrendt CL, and Hooper LV (2006). Symbiotic Bacteria Direct Expression of an Intestinal Bactericidal Lectin. Science 313, 1126–1130. [DOI] [PMC free article] [PubMed] [Google Scholar]
- Cella M, Fuchs A, Vermi W, Facchetti F, Otero K, Lennerz JKM, Doherty JM, Mills JC, and Colonna M (2008). A human natural killer cell subset provides an innate source of IL-22 for mucosal immunity. Nature 457, 722–725. [DOI] [PMC free article] [PubMed] [Google Scholar]
- Cella M, Otero K, and Colonna M (2010). Expansion of human NK-22 cells with IL-7, IL-2, and IL-1β reveals intrinsic functional plasticity. Proc National Acad Sci 107, 10961–10966. [DOI] [PMC free article] [PubMed] [Google Scholar]
- Chan JM, Bhinder G, Sham HP, Ryz N, Huang T, Bergstrom KS, and Vallance BA (2013). CD4+ T Cells Drive Goblet Cell Depletion during Citrobacter rodentium Infection. Infect Immun 81, 4649–4658. [DOI] [PMC free article] [PubMed] [Google Scholar]
- Chang WWL, and Leblond CP (1971). Renewal of the epithelium in the descending colon of the mouse. I. Presence of three cell populations: Vacuolated‐columnar, mucous and argentaffin. Am J Anat 131, 73–99. [DOI] [PubMed] [Google Scholar]
- Chen F, Cao A, Yao S, Evans-Marin HL, Liu H, Wu W, Carlsen ED, Dann SM, Soong L, Sun J, et al. (2016). mTOR Mediates IL-23 Induction of Neutrophil IL-17 and IL-22 Production. J Immunol 196, 4390–4399. [DOI] [PMC free article] [PubMed] [Google Scholar]
- Clevers H (2013). The Intestinal Crypt, A Prototype Stem Cell Compartment. Cell 154, 274–284. [DOI] [PubMed] [Google Scholar]
- Clohessy PA, and Golden BE (1995). Calprotectin‐Mediated Zinc Chelation as a Biostatic Mechanism in Host Defence. Scand J Immunol 42, 551–556. [DOI] [PubMed] [Google Scholar]
- Collins JW, Keeney KM, Crepin VF, Rathinam VAK, Fitzgerald KA, Finlay BB, and Frankel G (2014). Citrobacter rodentium: infection, inflammation and the microbiota. Nat Rev Microbiol 12, 612–623. [DOI] [PubMed] [Google Scholar]
- Colonna M (2009). Interleukin-22-Producing Natural Killer Cells and Lymphoid Tissue Inducer-like Cells in Mucosal Immunity. Immunity 31, 15–23. [DOI] [PubMed] [Google Scholar]
- Colonna M (2018). Innate Lymphoid Cells: Diversity, Plasticity, and Unique Functions in Immunity. Immunity 48, 1104–1117. [DOI] [PMC free article] [PubMed] [Google Scholar]
- Constantinides MG, McDonald BD, Verhoef PA, and Bendelac A (2014). A committed precursor to innate lymphoid cells. Nature 508, 397–401. [DOI] [PMC free article] [PubMed] [Google Scholar]
- Croxen MA, Law RJ, Scholz R, Keeney KM, Wlodarska M, and Finlay BB (2013). Recent Advances in Understanding Enteric Pathogenic Escherichia coli. Clin Microbiol Rev 26, 822–880. [DOI] [PMC free article] [PubMed] [Google Scholar]
- Dobin A, Davis CA, Schlesinger F, Drenkow J, Zaleski C, Jha S, Batut P, Chaisson M, and Gingeras TR (2013). STAR: ultrafast universal RNA-seq aligner. Bioinformatics 29, 15–21. [DOI] [PMC free article] [PubMed] [Google Scholar]
- Donnenberg MS, Kaper JB, and Finlay BB (1997). Interactions between enteropathogenic Escherichia coli and host epithelial cells. Trends Microbiol 5, 109–114. [DOI] [PubMed] [Google Scholar]
- Duc C, Farman N, Canessa CM, Bonvalet JP, and Rossier BC (1994). Cell-specific expression of epithelial sodium channel alpha, beta, and gamma subunits in aldosterone-responsive epithelia from the rat: localization by in situ hybridization and immunocytochemistry. J Cell Biology 127, 1907–1921. [DOI] [PMC free article] [PubMed] [Google Scholar]
- Frankel G, Phillips AD, Rosenshine I, Dougan G, Kaper JB, and Knutton S (1998). Enteropathogenic and enterohaemorrhagic Escherichia coli: more subversive elements. Mol Microbiol 30, 911–921. [DOI] [PubMed] [Google Scholar]
- Gasteiger G, Fan X, Dikiy S, Lee SY, and Rudensky AY (2015). Tissue residency of innate lymphoid cells in lymphoid and nonlymphoid organs. Science 350, 981–985. [DOI] [PMC free article] [PubMed] [Google Scholar]
- Goetz DH, Holmes MA, Borregaard N, Bluhm ME, Raymond KN, and Strong, (2002). The Neutrophil Lipocalin NGAL Is a Bacteriostatic Agent that Interferes with Siderophore-Mediated Iron Acquisition. Mol Cell 10, 1033–1043. [DOI] [PubMed] [Google Scholar]
- Gronke K, Hernández PP, Zimmermann J, Klose CSN, Kofoed-Branzk M, Guendel F, Witkowski M, Tizian C, Amann L, Schumacher F, et al. (2019). Interleukin-22 protects intestinal stem cells against genotoxic stress. Nature 566, 249–253. [DOI] [PMC free article] [PubMed] [Google Scholar]
- Guo Y, Wu W, Cen Z, Li X, Kong Q, and Zhou Q (2014). IL-22-producing Th22 cells play a protective role in CVB3-induced chronic myocarditis and dilated cardiomyopathy by inhibiting myocardial fibrosis. Virol J 11, 1–12. [DOI] [PMC free article] [PubMed] [Google Scholar]
- Haber AL, Biton M, Rogel N, Herbst RH, Shekhar K, Smillie C, Burgin G, Delorey TM, Howitt MR, Katz Y, et al. (2017). A single-cell survey of the small intestinal epithelium. Nature 551, 333–339. [DOI] [PMC free article] [PubMed] [Google Scholar]
- Harwig SS, Tan L, Qu XD, Cho Y, Eisenhauer PB, and Lehrer RI (1995). Bactericidal properties of murine intestinal phospholipase A2. J Clin Invest 95, 603–610. [DOI] [PMC free article] [PubMed] [Google Scholar]
- Hasegawa M, Yada S, Liu MZ, Kamada N, Muñoz-Planillo R, Do N, Núñez G, and Inohara N (2014). Interleukin-22 Regulates the Complement System to Promote Resistance against Pathobionts after Pathogen-Induced Intestinal Damage. Immunity 41, 620–632. [DOI] [PMC free article] [PubMed] [Google Scholar]
- Hemrajani C, Berger CN, Robinson KS, Marchès O, Mousnier A, and Frankel G (2010). NleH effectors interact with Bax inhibitor-1 to block apoptosis during enteropathogenic Escherichia coli infection. Proc National Acad Sci 107, 3129–3134. [DOI] [PMC free article] [PubMed] [Google Scholar]
- Higgins LM, Frankel G, Douce G, Dougan G, and MacDonald TT (1999). Citrobacter rodentium infection in mice elicits a mucosal Th1 cytokine response and lesions similar to those in murine inflammatory bowel disease. Infect Immun 67, 3031–3039. [DOI] [PMC free article] [PubMed] [Google Scholar]
- Hopkins EGD, Roumeliotis TI, Mullineaux-Sanders C, Choudhary JS, and Frankel G (2019). Intestinal Epithelial Cells and the Microbiome Undergo Swift Reprogramming at the Inception of Colonic Citrobacter rodentium Infection. Mbio 10, e00062, 1–19. [DOI] [PMC free article] [PubMed] [Google Scholar]
- Hua G, Thin TH, Feldman R, Haimovitz–Friedman A, Clevers H, Fuks Z, and Kolesnick R (2012). Crypt Base Columnar Stem Cells in Small Intestines of Mice Are Radioresistant. Gastroenterology 143, 1266–1276. [DOI] [PMC free article] [PubMed] [Google Scholar]
- Hubbard T, Barker D, Birney E, Cameron G, Chen Y, Clark L, Cox T, Cuff J, Curwen V, Down T, et al. (2002). The Ensembl genome database project. Nucleic Acids Res 30, 38–41. [DOI] [PMC free article] [PubMed] [Google Scholar]
- Huntington ND, Carpentier S, Vivier E, and Belz GT (2016). Innate lymphoid cells: parallel checkpoints and coordinate interactions with T cells. Curr Opin Immunol 38, 86–93. [DOI] [PubMed] [Google Scholar]
- Ignatiadis N, Klaus B, Zaugg JB, and Huber W (2016). Data-driven hypothesis weighting increases detection power in genome-scale multiple testing. Nat Methods 13, 577–580. [DOI] [PMC free article] [PubMed] [Google Scholar]
- Kaiko GE, Ryu SH, Koues OI, Collins PL, Solnica-Krezel L, Pearce EJ, Pearce EL, Oltz EM, and Stappenbeck TS (2016). The Colonic Crypt Protects Stem Cells from Microbiota-Derived Metabolites. Cell 165, 1708–1720. [DOI] [PMC free article] [PubMed] [Google Scholar]
- Kamada N, Sakamoto K, Seo S-U, Zeng MY, Kim Y-G, Cascalho M, Vallance BA, Puente JL, and Núñez G (2015). Humoral Immunity in the Gut Selectively Targets Phenotypically Virulent Attaching-and-Effacing Bacteria for Intraluminal Elimination. Cell Host Microbe 17, 617–627. [DOI] [PMC free article] [PubMed] [Google Scholar]
- Kim CJ, Nazli A, Rojas OL, Chege D, Alidina Z, Huibner S, Mujib S, Benko E, Kovacs C, Shin LYY, et al. (2012). A role for mucosal IL-22 production and Th22 cells in HIV-associated mucosal immunopathogenesis. Mucosal Immunol 5, 670–680. [DOI] [PubMed] [Google Scholar]
- Kim M, Ashida H, Ogawa M, Yoshikawa Y, Mimuro H, and Sasakawa C (2010). Bacterial Interactions with the Host Epithelium. Cell Host Microbe 8, 20–35. [DOI] [PubMed] [Google Scholar]
- Kovalovsky D, Uche OU, Eladad S, Hobbs RM, Yi W, Alonzo E, Chua K, Eidson M, Kim H-J, Im JS, et al. (2008). The BTB–zinc finger transcriptional regulator PLZF controls the development of invariant natural killer T cell effector functions. Nat Immunol 9, 1055–1064. [DOI] [PMC free article] [PubMed] [Google Scholar]
- Lee JS, Cella M, McDonald KG, Garlanda C, Kennedy GD, Nukaya M, Mantovani A, Kopan R, Bradfield CA, Newberry RD, et al. (2012). AHR drives the development of gut ILC22 cells and postnatal lymphoid tissues via pathways dependent on and independent of Notch. Nat Immunol 13, 144–151. [DOI] [PMC free article] [PubMed] [Google Scholar]
- Lee Y-S, Yang H, Yang J-Y, Kim Y, Lee S-H, Kim JH, Jang YJ, Vallance BA, and Kweon M-N (2015). Interleukin-1 (IL-1) Signaling in Intestinal Stromal Cells Controls KC/CXCL1 Secretion, Which Correlates with Recruitment of IL-22-Secreting Neutrophils at Early Stages of Citrobacter rodentium Infection. Infect Immun 83, 3257–3267. [DOI] [PMC free article] [PubMed] [Google Scholar]
- Li H, Handsaker B, Wysoker A, Fennell T, Ruan J, Homer N, Marth G, Abecasis G, Durbin R, and Subgroup, 1000 Genome Project Data Processing (2009). The Sequence Alignment/Map format and SAMtools. Bioinformatics 25, 2078–2079. [DOI] [PMC free article] [PubMed] [Google Scholar]
- Li JL, Lim CH, Tay FW, Goh CC, Devi S, Malleret B, Lee B, Bakocevic N, Chong SZ, Evrard M, et al. (2016). Neutrophils Self-Regulate Immune Complex-Mediated Cutaneous Inflammation through CXCL2. J Invest Dermatol 136, 416–424. [DOI] [PubMed] [Google Scholar]
- Liang SC, Tan X-Y, Luxenberg DP, Karim R, Dunussi-Joannopoulos K, Collins M, and Fouser LA (2006). Interleukin (IL)-22 and IL-17 are coexpressed by Th17 cells and cooperatively enhance expression of antimicrobial peptides. J Exp Medicine 203, 2271–2279. [DOI] [PMC free article] [PubMed] [Google Scholar]
- Liang SC, Nickerson-Nutter C, Pittman DD, Carrier Y, Goodwin DG, Shields KM, Lambert A-J, Schelling SH, Medley QG, Ma H-L, et al. (2010). IL-22 Induces an Acute-Phase Response. J Immunol 185, 5531–5538. [DOI] [PubMed] [Google Scholar]
- Liang Y, Zhou H, Yao Y, Deng A, Wang Z, Gao B, Zhou M, Cui Y, Wang L, Zhou L, et al. (2017). 12-O-Tetradecanoylphorbol-13-acetate (TPA) increases murine intestinal crypt stem cell survival following radiation injury. Oncotarget 8, 45566–45576. [DOI] [PMC free article] [PubMed] [Google Scholar]
- Liberzon A, Subramanian A, Pinchback R, Thorvaldsdóttir H, Tamayo P, and Mesirov JP (2011). Molecular signatures database (MSigDB) 3.0. Bioinformatics 27, 1739–1740. [DOI] [PMC free article] [PubMed] [Google Scholar]
- Liberzon A, Birger C, Thorvaldsdóttir H, Ghandi M, Mesirov JP, and Tamayo P (2015). The Molecular Signatures Database Hallmark Gene Set Collection. Cell Syst 1, 417–425. [DOI] [PMC free article] [PubMed] [Google Scholar]
- Lindemans CA, Calafiore M, Mertelsmann AM, O’Connor MH, Dudakov JA, Jenq RR, Velardi E, Young LF, Smith OM, Lawrence G, et al. (2015). Interleukin-22 promotes intestinal-stem-cell-mediated epithelial regeneration. Nature 528, 560–564. [DOI] [PMC free article] [PubMed] [Google Scholar]
- Lindén SK, Florin THJ, and McGuckin MA (2008). Mucin Dynamics in Intestinal Bacterial Infection. Plos One 3: e3952, 1–14. [DOI] [PMC free article] [PubMed] [Google Scholar]
- Lindén SK, Sheng YH, Every AL, Miles KM, Skoog EC, Florin THJ, Sutton P, and McGuckin MA (2009). MUC1 Limits Helicobacter pylori Infection both by Steric Hindrance and by Acting as a Releasable Decoy. Plos Pathog 5, e1000617, 1–14. [DOI] [PMC free article] [PubMed] [Google Scholar]
- Lochner M, Peduto L, Cherrier M, Sawa S, Langa F, Varona R, Riethmacher D, Si-Tahar M, Santo JPD, and Eberl G (2008). In vivo equilibrium of proinflammatory IL-17+ and regulatory IL-10+ Foxp3+ RORγt+ T cells. J Exp Medicine 205, 1381–1393. [DOI] [PMC free article] [PubMed] [Google Scholar]
- Loetscher M, Gerber B, Loetscher P, Jones SA, Piali L, Clark-Lewis I, Baggiolini M, and Moser B (1996). Chemokine receptor specific for IP10 and mig: structure, function, and expression in activated T-lymphocytes. J Exp Medicine 184, 963–969. [DOI] [PMC free article] [PubMed] [Google Scholar]
- Love MI, Huber W, and Anders S (2014). Moderated estimation of fold change and dispersion for RNA-seq data with DESeq2. Genome Biol 15, 550. [DOI] [PMC free article] [PubMed] [Google Scholar]
- Lu Y, Cao X, Zhang X, and Kovalovsky D (2015). PLZF Controls the Development of Fetal-Derived IL-17+Vγ6+ γδ T Cells. J Immunol 195, 4273–4281. [DOI] [PMC free article] [PubMed] [Google Scholar]
- Luster AD, and Ravetch JV (1987). Biochemical characterization of a gamma interferon-inducible cytokine (IP-10). J Exp Medicine 166, 1084–1097. [DOI] [PMC free article] [PubMed] [Google Scholar]
- Ma C, Wickham ME, Guttman JA, Deng W, Walker J, Madsen KL, Jacobson K, Vogl WA, Finlay BB, and Vallance BA (2006). Citrobacter rodentium infection causes both mitochondrial dysfunction and intestinal epithelial barrier disruption in vivo: role of mitochondrial associated protein (Map). Cell. Microbiol 8, 1669–1686. [DOI] [PubMed] [Google Scholar]
- Maaser C, Housley MP, Iimura M, Smith JR, Vallance BA, Finlay BB, Schreiber JR, Varki NM, Kagnoff MF, and Eckmann L (2004). Clearance of Citrobacter rodentium Requires B Cells but Not Secretory Immunoglobulin A (IgA) or IgM Antibodies. Infect Immun 72, 3315–3324. [DOI] [PMC free article] [PubMed] [Google Scholar]
- Mangan PR, Harrington LE, O’Quinn DB, Helms WS, Bullard DC, Elson CO, Hatton RD, Wahl SM, Schoeb TR, and Weaver CT (2006). Transforming growth factor-β induces development of the TH17 lineage. Nature 441, 231–234. [DOI] [PubMed] [Google Scholar]
- Manitz M, Horst B, Seeliger S, Strey A, Skryabin BV, Gunzer M, Frings W, Schonlau F, Roth J, Sorg C, Nacken W (2003). Loss of S100A9 (MRP14) Results in Reduced Interleukin-8-Induced CD11b Surface Expression, a Polarized Microfilament System, and Diminished Responsiveness to Chemoattractants in Vitro. Mol and Cell Biol 23, 1034–1043. [DOI] [PMC free article] [PubMed] [Google Scholar]
- Martin BK, Chin K-C, Olsen JC, Skinner CA, Dey A, Ozato K, and Ting JP-Y (1997). Induction of MHC Class I Expression by the MHC Class II Transactivator CIITA. Immunity 6, 591–600. [DOI] [PubMed] [Google Scholar]
- Matsuki T, Pédron T, Regnault B, Mulet C, Hara T, and Sansonetti PJ (2013). Epithelial Cell Proliferation Arrest Induced by Lactate and Acetate from Lactobacillus casei and Bifidobacterium breve. Plos One 8: e63053, 1–8. [DOI] [PMC free article] [PubMed] [Google Scholar]
- Medzhitov R, Preston-Hurlburt P, and Janeway CA (1997). A human homologue of the Drosophila Toll protein signals activation of adaptive immunity. Nature 388, 394–397. [DOI] [PubMed] [Google Scholar]
- Miki T, Holst O, and Hardt W-D (2012). The Bactericidal Activity of the C-type Lectin RegIIIβ against Gram-negative Bacteria involves Binding to Lipid A. J Biol Chem 287, 34844–34855. [DOI] [PMC free article] [PubMed] [Google Scholar]
- Mostafavi S, Yoshida H, Moodley D, LeBoité H, Rothamel K, Raj T, Ye CJ, Chevrier N, Zhang S-Y, Feng T, et al. (2016). Parsing the Interferon Transcriptional Network and Its Disease Associations. Cell 164, 564–578. [DOI] [PMC free article] [PubMed] [Google Scholar]
- Mundy R, MacDonald TT, Dougan G, Frankel G, and Wiles S (2005). Citrobacter rodentium of mice and man. Cell Microbiol 7, 1697–1706. [DOI] [PubMed] [Google Scholar]
- Nougayrède J-P, Taieb F, Rycke JD, and Oswald E (2005). Cyclomodulins: bacterial effectors that modulate the eukaryotic cell cycle. Trends Microbiol 13, 103–110. [DOI] [PubMed] [Google Scholar]
- Okada T, Fukuda S, Hase K, Nishiumi S, Izumi Y, Yoshida M, Hagiwara T, Kawashima R, Yamazaki M, Oshio T, et al. (2013). Microbiota-derived lactate accelerates colon epithelial cell turnover in starvation-refed mice. Nat Commun 4:1654, 1–10. [DOI] [PubMed] [Google Scholar]
- Okita Y, Shiono T, Yahagi A, Hamada S, Umemura M, and Matsuzaki G (2016). Interleukin-22-Induced Antimicrobial Phospholipase A2 Group IIA Mediates Protective Innate Immunity of Nonhematopoietic Cells against Listeria monocytogenes. Infect Immun 84, 573–579. [DOI] [PMC free article] [PubMed] [Google Scholar]
- Papapietro O, Teatero S, Thanabalasuriar A, Yuki KE, Diez E, Zhu L, Kang E, Dhillon S, Muise AM, Durocher Y, et al. (2013). R-Spondin 2 sig- nalling mediates susceptibility to fatal infectious diarrhoea. Nat. Commun 4 (1898), 1–9. [DOI] [PMC free article] [PubMed] [Google Scholar]
- Peña-Münzenmayer G, Catalán M, Cornejo I, Figueroa CD, Melvin JE, Niemeyer MI, Cid LP, and Sepúlveda FV (2005). Basolateral localization of native ClC-2 chloride channels in absorptive intestinal epithelial cells and basolateral sorting encoded by a CBS-2 domain di-leucine motif. J Cell Sci 118, 4243–4252. [DOI] [PubMed] [Google Scholar]
- Pham TAN, Clare S, Goulding D, Arasteh JM, Stares MD, Browne HP, Keane JA, Page AJ, Kumasaka N, Kane L, et al. (2014). Epithelial IL-22RA1-Mediated Fucosylation Promotes Intestinal Colonization Resistance to an Opportunistic Pathogen. Cell Host Microbe 16, 504–516. [DOI] [PMC free article] [PubMed] [Google Scholar]
- Pickert G, Neufert C, Leppkes M, Zheng Y, Wittkopf N, Warntjen M, Lehr H-A, Hirth S, Weigmann B, Wirtz S, et al. (2009). STAT3 links IL-22 signaling in intestinal epithelial cells to mucosal wound healing. J Exp Medicine 206, 1465–1472. [DOI] [PMC free article] [PubMed] [Google Scholar]
- Poltorak A, He X, Smirnova I, Liu M-Y, Huffel CV, Du X, Birdwell D, Alejos E, Silva M, Galanos C, et al. (1998). Defective LPS Signaling in C3H/HeJ and C57BL/10ScCr Mice: Mutations in Tlr4 Gene. Science 282, 2085–2088. [DOI] [PubMed] [Google Scholar]
- Pugin J, Schürer-Maly CC, Leturcq D, Moriarty A, Ulevitch RJ, and Tobias PS (1993). Lipopolysaccharide activation of human endothelial and epithelial cells is mediated by lipopolysaccharide-binding protein and soluble CD14. Proc National Acad Sci 90, 2744–2748. [DOI] [PMC free article] [PubMed] [Google Scholar]
- Rankin LC, Girard-Madoux MJH, Seillet C, Mielke LA, Kerdiles Y, Fenis A, Wieduwild E, Putoczki T, Mondot S, Lantz O, et al. (2016). Complementarity and redundancy of IL-22-producing innate lymphoid cells. Nat Immunol 17, 179–186. [DOI] [PMC free article] [PubMed] [Google Scholar]
- Ritchie ME, Phipson B, Wu D, Hu Y, Law CW, Shi W, and Smyth GK (2015). limma powers differential expression analyses for RNA-sequencing and microarray studies. Nucleic Acids Res 43, e47–e47. [DOI] [PMC free article] [PubMed] [Google Scholar]
- Rothenberg ME, Nusse Y, Kalisky T, Lee JJ, Dalerba P, Scheeren F, Lobo N, Kulkarni S, Sim S, Qian D, et al. (2012). Identification of a cKit+ Colonic Crypt Base Secretory Cell That Supports Lgr5+ Stem Cells in Mice. Gastroenterology 142, 1195–1205. [DOI] [PMC free article] [PubMed] [Google Scholar]
- Sasaki N, Sachs N, Wiebrands K, Ellenbroek SIJ, Fumagalli A, Lyubimova A, Begthel H, van den Born M, van Es JH van, Karthaus WR, et al. (2016). Reg4+ deep crypt secretory cells function as epithelial niche for Lgr5+ stem cells in colon. Proc National Acad Sci 113, E5399–E5407. [DOI] [PMC free article] [PubMed] [Google Scholar]
- Satpathy AT, Briseño CG, Lee JS, Ng D, Manieri NA, KC W, Wu X, Thomas SR, Lee W-L, Turkoz M, et al. (2013). Notch2-dependent classical dendritic cells orchestrate intestinal immunity to attaching-and-effacing bacterial pathogens. Nat Immunol 14, 937–948. [DOI] [PMC free article] [PubMed] [Google Scholar]
- Savage AK, Constantinides MG, Han J, Picard D, Martin E, Li B, Lantz O, and Bendelac A (2008). The Transcription Factor PLZF Directs the Effector Program of the NKT Cell Lineage. Immunity 29, 391–403. [DOI] [PMC free article] [PubMed] [Google Scholar]
- Schletter J, Brade H, Brade L, Krüger C, Loppnow H, Kusumoto S, Rietschel ET, Flad HD, and Ulmer AJ (1995). Binding of lipopolysaccharide (LPS) to an 80-kilodalton membrane protein of human cells is mediated by soluble CD14 and LPS-binding protein. Infect Immun 63, 2576–2580. [DOI] [PMC free article] [PubMed] [Google Scholar]
- Sergushichev AA (2016). An algorithm for fast preranked gene set enrichment analysis using cumulative statistic calculation. Biorxiv 060012v1, 1–9.
- Shannon P, Markiel A, Ozier O, Baliga NS, Wang JT, Ramage D, Amin N, Schwikowski B, and Ideker T (2003). Cytoscape: A Software Environment for Integrated Models of Biomolecular Interaction Networks. Genome Res 13, 2498–2504. [DOI] [PMC free article] [PubMed] [Google Scholar]
- Silberger DJ, Zindl CL, and Weaver CT (2017). Citrobacter rodentium: a model enteropathogen for understanding the interplay of innate and adaptive components of type 3 immunity. Mucosal Immunol 10, 1108–1117. [DOI] [PMC free article] [PubMed] [Google Scholar]
- Simmons CP, Clare S, Ghaem-Maghami M, Uren TK, Rankin J, Huett A, Goldin R, Lewis DJ, MacDonald TT, Strugnell RA, et al. (2003). Central Role for B Lymphocytes and CD4+ T Cells in Immunity to Infection by the Attaching and Effacing Pathogen Citrobacter rodentium. Infect Immun 71, 5077–5086. [DOI] [PMC free article] [PubMed] [Google Scholar]
- Sinclair JF, and O’Brien AD (2004). Intimin Types α, β, and γ Bind to Nucleolin with Equivalent Affinity but Lower Avidity than to the Translocated Intimin Receptor. J Biol Chem 279, 33751–33758. [DOI] [PubMed] [Google Scholar]
- Song C, Lee JS, Gilfillan S, Robinette ML, Newberry RD, Stappenbeck TS, Mack M, Cella M, and Colonna M (2015). Unique and redundant functions of NKp46+ ILC3s in models of intestinal inflammation. J Exp Med 212, 1869–1882. [DOI] [PMC free article] [PubMed] [Google Scholar]
- Sonnenberg GF, Monticelli LA, Elloso MM, Fouser LA, and Artis D (2011a). CD4+ Lymphoid Tissue-Inducer Cells Promote Innate Immunity in the Gut. Immunity 34, 122–134. [DOI] [PMC free article] [PubMed] [Google Scholar]
- Sonnenberg GF, Fouser LA, and Artis D (2011b). Border patrol: regulation of immunity, inflammation and tissue homeostasis at barrier surfaces by IL-22. Nat Immunol 12, 383–390. [DOI] [PubMed] [Google Scholar]
- Sovran B, Loonen LMP, Lu P, Hugenholtz F, Belzer C, Stolte EH, Boekschoten MV, van Baarlen P, Kleerebezem M, de Vos P, et al. (2015). IL-22-STAT3 Pathway Plays a Key Role in the Maintenance of Ileal Homeostasis in Mice Lacking Secreted Mucus Barrier. Inflamm Bowel Dis 21, 531–542. [DOI] [PubMed] [Google Scholar]
- Spehlmann ME, Dann SM, Hruz P, Hanson E, McCole DF, and Eckmann L (2009). CXCR2-Dependent Mucosal Neutrophil Influx Protects against Colitis-Associated Diarrhea Caused by an Attaching/Effacing Lesion-Forming Bacterial Pathogen. J Immunol 183, 3332–3343. [DOI] [PMC free article] [PubMed] [Google Scholar]
- Spits H, Artis D, Colonna M, Diefenbach A, Santo JPD, Eberl G, Koyasu S, Locksley RM, McKenzie ANJ, Mebius RE, et al. (2013). Innate lymphoid cells — a proposal for uniform nomenclature. Nat Rev Immunol 13, 145–149. [DOI] [PubMed] [Google Scholar]
- Steimle V, Otten LA, Zufferey M, and Mach B (1993). Complementation cloning of an MHC class II transactivator mutated in hereditary MHC class II deficiency (or bare lymphocyte syndrome). Cell 75, 135–146. [PubMed] [Google Scholar]
- Stelter C, Käppeli R, König C, Krah A, Hardt W-D, Stecher B, and Bumann D (2011). Salmonella-Induced Mucosal Lectin RegIIIβ Kills Competing Gut Microbiota. Plos One 6:e20749, 1–10. [DOI] [PMC free article] [PubMed] [Google Scholar]
- Stephens M (2017). False discovery rates: a new deal. Biostatistics 18, 275–294. [DOI] [PMC free article] [PubMed] [Google Scholar]
- Subramanian A, Tamayo P, Mootha VK, Mukherjee S, Ebert BL, Gillette MA, Paulovich A, Pomeroy SL, Golub TR, Lander ES, et al. (2005). Gene set enrichment analysis: A knowledge-based approach for interpreting genome-wide expression profiles. Proc National Acad Sci 102, 15545–15550. [DOI] [PMC free article] [PubMed] [Google Scholar]
- Sugimoto K, Ogawa A, Mizoguchi E, Shimomura Y, Andoh A, Bhan AK, Blumberg RS, Xavier RJ, and Mizoguchi A (2008). IL-22 ameliorates intestinal inflammation in a mouse model of ulcerative colitis. J Clin Invest 118, 534–544. [DOI] [PMC free article] [PubMed] [Google Scholar]
- Szklarczyk D, Morris JH, Cook H, Kuhn M, Wyder S, Simonovic M, Santos A, Doncheva NT, Roth A, Bork P, et al. (2017). The STRING database in 2017: quality-controlled protein–protein association networks, made broadly accessible. Nucleic Acids Res 45, D362–D368. [DOI] [PMC free article] [PubMed] [Google Scholar]
- The Gene Ontology Consortium (2017). Expansion of the Gene Ontology knowledgebase and resources. Nucleic Acids Res 45, D331–D338. [DOI] [PMC free article] [PubMed] [Google Scholar]
- Thelemann C, Eren RO, Coutaz M, Brasseit J, Bouzourene H, Rosa M, Duval A, Lavanchy C, Mack V, Mueller C, et al. (2014). Interferon-γ Induces Expression of MHC Class II on Intestinal Epithelial Cells and Protects Mice from Colitis. Plos One 9, e86844, 1–10. [DOI] [PMC free article] [PubMed] [Google Scholar]
- Trifari S, Kaplan CD, Tran EH, Crellin NK, and Spits H (2009). Identification of a human helper T cell population that has abundant production of interleukin 22 and is distinct from TH-17, TH1 and TH2 cells. Nat Immunol 10, 864–871. [DOI] [PubMed] [Google Scholar]
- Turner J-E, Stockinger B, and Helmby H (2013). IL-22 Mediates Goblet Cell Hyperplasia and Worm Expulsion in Intestinal Helminth Infection. Plos Pathog 9:e1003698, 1–7. [DOI] [PMC free article] [PubMed] [Google Scholar]
- Vallance BA, Deng W, Knodler LA, and Finlay BB (2002). Mice Lacking T and B Lymphocytes Develop Transient Colitis and Crypt Hyperplasia yet Suffer Impaired Bacterial Clearance during Citrobacter rodentium Infection. Infect Immun 70, 2070–2081. [DOI] [PMC free article] [PubMed] [Google Scholar]
- van der Flier LG, and Clevers H (2009). Stem Cells, Self-Renewal, and Differentiation in the Intestinal Epithelium. Annu Rev Physiol 71, 241–260. [DOI] [PubMed] [Google Scholar]
- Waldschmitt N, Kitamoto S, Secher T, Zacharioudaki V, Boulard O, Floquet E, Delacre M, Lamas B, Pham H-P, Six A, et al. (2019). The regenerating family member 3 β instigates IL-17A-mediated neutrophil recruitment downstream of NOD1/2 signalling for controlling colonisation resistance independently of microbiota community structure. Gut 68, 1190–1199. [DOI] [PubMed] [Google Scholar]
- Wickham H (2009). ggplot2, Elegant Graphics for Data Analysis 9–26.
- Wiles S, Clare S, Harker J, Huett A, Young D, Dougan G, and Frankel G (2004). Organ specificity, colonization and clearance dynamics in vivo following oral challenges with the murine pathogen Citrobacter rodentium. Cell Microbiol 6, 963–972. [DOI] [PubMed] [Google Scholar]
- Wiles S, Pickard KM, Peng K, MacDonald TT, and Frankel G (2006). In Vivo Bioluminescence Imaging of the Murine Pathogen Citrobacter rodentium. Infect Immun 74, 5391–5396. [DOI] [PMC free article] [PubMed] [Google Scholar]
- Wittkopf N, Pickert G, Billmeier U, Mahapatro M, Wirtz S, Martini E, Leppkes M, Neurath MF, and Becker C (2015). Activation of Intestinal Epithelial Stat3 Orchestrates Tissue Defense during Gastrointestinal Infection. Plos One 10:e0118401, 1–14. [DOI] [PMC free article] [PubMed] [Google Scholar]
- Wolk K, Witte E, Wallace E, Döcke W, Kunz S, Asadullah K, Volk H, Sterry W, and Sabat R (2006). IL‐22 regulates the expression of genes responsible for antimicrobial defense, cellular differentiation, and mobility in keratinocytes: a potential role in psoriasis. Eur J Immunol 36, 1309–1323. [DOI] [PubMed] [Google Scholar]
- Wolk K, Witte E, Hoffmann U, Doecke W-D, Endesfelder S, Asadullah K, Sterry W, Volk H-D, Wittig BM, and Sabat R (2007). IL-22 Induces Lipopolysaccharide-Binding Protein in Hepatocytes: A Potential Systemic Role of IL-22 in Crohn’s Disease. J Immunol 178, 5973–5981. [DOI] [PubMed] [Google Scholar]
- Yamamoto K, Miki Y, Sato M, Taketomi Y, Nishito Y, Taya C, Muramatsu K, Ikeda K, Nakanishi H, Taguchi R, et al. (2015). The role of group IIF-secreted phospholipase A2 in epidermal homeostasis and hyperplasia. J Exp Med 212, 1901–1919. [DOI] [PMC free article] [PubMed] [Google Scholar]
- Yue Z, Kshirsagar MM, Nguyen T, Suphavilai C, Neylon MT, Zhu L, Ratliff T, and Chen JY (2015). PAGER: constructing PAGs and new PAG–PAG relationships for network biology. Bioinformatics 31, i250–i257. [DOI] [PMC free article] [PubMed] [Google Scholar]
- Yue Z, Zheng Q, Neylon MT, Yoo M, Shin J, Zhao Z, Tan AC, and Chen JY (2018). PAGER 2.0: an update to the pathway, annotated-list and gene-signature electronic repository for Human Network Biology. Nucleic Acids Res 46, D668–D676. [DOI] [PMC free article] [PubMed] [Google Scholar]
- Zenewicz LA, Yancopoulos GD, Valenzuela DM, Murphy AJ, Stevens S, and Flavell RA (2008). Innate and Adaptive Interleukin-22 Protects Mice from Inflammatory Bowel Disease. Immunity 29, 947–957. [DOI] [PMC free article] [PubMed] [Google Scholar]
- Zheng Y, Danilenko DM, Valdez P, Kasman I, Eastham-Anderson J, Wu J, and Ouyang W (2007). Interleukin-22, a T(H)17 cytokine, mediates IL-23-induced dermal inflammation and acanthosis. Nature 445, 648–651. [DOI] [PubMed] [Google Scholar]
- Zheng Y, Valdez PA, Danilenko DM, Hu Y, Sa SM, Gong Q, Abbas A, er R, Modrusan Z, Ghilardi N, et al. (2008). Interleukin-22 mediates early host defense against attaching and effacing bacterial pathogens. Nat Med 14, 282–289. [DOI] [PubMed] [Google Scholar]
- Zindl CL, Lai J-F, Lee YK, Maynard CL, Harbour SN, Ouyang W, Chaplin DD, and Weaver CT (2013). IL-22–producing neutrophils contribute to antimicrobial defense and restitution of colonic epithelial integrity during colitis. Proc National Acad Sci 110, 12768–12773. [DOI] [PMC free article] [PubMed] [Google Scholar]
Associated Data
This section collects any data citations, data availability statements, or supplementary materials included in this article.
Supplementary Materials
Data Availability Statement
Raw and processed data files for RNA sequencing analysis have been deposited in the NCBI Gene Expression Omnibus under accession number GEO: GSE114338. Accession numbers are listed in the key resources table. This paper does not report original code but details are included in the method details section. Any additional information required to reanalyze the data reported in this paper is available from the lead contact upon request.
KEY RESOURCES TABLE
| REAGENT or RESOURCE | SOURCE | IDENTIFIER |
|---|---|---|
| Antibodies | ||
| Armenian hamster IgG FITC | Jackson ImmunoResearch | Cat# 127–095-099; RRID: AB_2338981 |
| CD28 (clone 37.51) – T cell culture | BD Biosciences | Cat# 553295; RRID: AB_394764 |
| CD3 unconjugated (clone 17A2) – Tissue stain | eBioscience/ThermoFisher | Cat# 14–0032-85; RRID: AB_467054 |
| CD3 (clone 145–11) – T cell culture | UAB Hybridoma Core | N/A |
| CEACAM1/CD66a PE (clone CC1) | eBioscience/ThermoFisher | Cat# 12–0661-80; RRID: AB_1311201 |
| E. coli Polyvalent 8 LPS | Accurate Chemical and Scientific Corp | Cat# YCC312–012 |
| EpCAM/CD326 PE-cy7 (clone G8.8) | eBioscience/ThermoFisher | Cat# 25–5791-80; RRID: AB_1724047 |
| EpCAM/CD326 FITC (clone G8.8) | eBioscience/ThermoFisher | Cat# 11–5791-82; RRID: AB_11151709 |
| EpCAM/CD326 Biotin (clone G8.8) | eBioscience/ThermoFisher | Cat# 13–5791-80; RRID: AB_1659715 |
| EpCAM/CD326 eFLuor 450 (clone G8.8) | eBioscience/ThermoFisher | Cat# 48–5791-82; RRID: AB_10717090 |
| CD16/CD32 (FcBlock; clone 2.4G2) | BD Biosciences | Cat# 553142; RRID: AB_394657 |
| CD45 eFluor 350 (clone 30-F11) | eBioscience/ThermoFisher | Cat# 48–0451-80; RRID: AB_1518807 |
| CD45 PE (clone 30-F11) | eBioscience/ThermoFisher | Cat# 12–0451-82; RRID: AB_465668 |
| CD45.2 FITC (clone 104) | eBioscience/ThermoFisher | Cat# 11–0454-82; RRID: AB_465061 |
| Fluorescein Alexa Fluor 488 | Invitrogen/ThermoFisher | Cat# A-11090; RRID: AB_221562 |
| GFP Alexa Fluor 488 | Invitrogen/ThermoFisher | Cat# A-11122; RRID: AB_221569 |
| hCD4 PEcy7 (clone RPA-T4) | eBioscience/ThermoFisher | Cat# 25–0049-41; RRID: AB_1659697 |
| hCD4 APC (clone RPA-T4) | eBioscience/ThermoFisher | Cat# 17–0049-42; RRID: AB_1272048 |
| IFNγ APC (clone XMG1.2) – Tissue stain | eBioscience/ThermoFisher | Cat# 17–7311-82; RRID: AB_469504 |
| IFNγ (clone XMG1.2) – T cell culture | UAB Hybridoma Core | N/A |
| IL-4 (clone 11B11) | UAB Hybridoma Core | N/A |
| IL-7R (CD127) AF700 (clone A7R34) | eBioscience/ThermoFisher | Cat# 56–1271-80; RRID: AB_657613 |
| IL-33R PerCP-eFluor 710 (clone RMST2–2) | eBioscience/ThermoFisher | Cat# 46–9335-80; RRID: AB_2573882 |
| IL-17A PerCP (clone TC11–18H10) | BD Biosciences | Cat# 560666; RRID: AB_1937311 |
| IL-22 PE (clone 1H8PWSR) | eBioscience/ThermoFisher | Cat# 12–7221-82; RRID: AB_10597428 |
| mCD4 PerCP (clone RM4–5) | eBioscience/ThermoFisher | Cat# 45–0042-82; RRID: AB_1107001 |
| mCD4 APC (clone RM4–5) | eBioscience/ThermoFisher | Cat# 17–0042-82; RRID: AB_469323 |
| mCD4 BV711 (clone RM4–5) | Biolegend | Cat# 100557; RRID: AB_2562607 |
| mCD4 PE-Cy7 (clone RM4–5) | BD Biosciences | Cat# 552775; RRID: AB_394461 |
| MHC CII (I-A/I-E) FITC (clone 114.15.2) | eBioscience/ThermoFisher | Cat# 11–5321-85; RRID: AB_465233 |
| MHC CII (I-A/I-E) eFluor 450 (clone 114.15.2) | eBioscience/ThermoFisher | Cat# 48–5321-80; RRID: AB_1272241 |
| Mouse Ig (H+L) unconjugated (Coating/ELISA) | Southern Biotech | Cat# 1010–01; RRID: AB_2794121 |
| Mouse IgG HRP labeled (Detection/ELISA) | Southern Biotech | Cat# 1030–05; RRID: AB_2619742 |
| Muc1 (clone MH1 (CT2)) | Invitrogen/ThermoFisher | Cat# MA5–11202; RRID: AB_11000874 |
| Muc2 (clone H-300) | Santa Cruz | Cat# sc-15334; RRID: AB_2146667 |
| NKp46/CD335 BV421 (clone 29A1.4) | Biolegend | Cat# 137611; RRID: AB_10915472 |
| Phospho-Stat3 (Tyr705; clone D3A7) | Cell Signaling | Cat# 9145; RRID: AB_2491009 |
| Rabbit Alexa Fluor 488 | Invitrogen/ThermoFisher | Cat# A11008; RRID: AB_143165 |
| Rabbit Alexa Fluor 594 | Invitrogen/ThermoFisher | Cat# A11037: RRID: AB_2534095 |
| Rat IgG Biotin | BD Biosciences | Cat# 554014; RRID: AB_395209 |
| TCRbeta FITC (clone H57–597) | eBioscience/ThermoFisher | Cat# 11–5961-85; RRID: AB_465324 |
| TCRbeta PE (clone H57–597) | Biolegend | Cat# 109208; RRID: AB_313431 |
| TCRbeta PE (clone H57–597) | eBioscience/ThermoFisher | Cat# 12–5961-82; RRID: AB_466066 |
| TCRbeta eFluor450 (clone H57–597) | eBioscience/ThermoFisher | Cat# 48–5961-82; RRID: AB_11039532 |
| TCRbeta APC (clone H57–597) | Biolegend | Cat# 109211; RRID: AB_313434 |
| TCRbeta APC (clone H57–597) | eBioscience/ThermoFisher | Ca# 17–5961-82; RRID: AB_469481 |
| TCRgamma/delta FITC (clone eBioGL3) | eBioscience/ThermoFisher | Cat# 11–5711-82; RRID: AB_465238 |
| TCRgamma/delta PE (clone eBioGL3) | eBioscience/ThermoFisher | Cat# 12–5711-82; RRID: AB_465934 |
| TCRgamma/delta APC (clone eBioGL3) | eBioscience/ThermoFisher | Cat# 17–5711-82; RRID: AB_842756 |
| Bacterial and virus strains | ||
| Citrobacter rodentium (C.r) DBS100 | ATCC | ATCC 51459 |
| C.r-GFP | B.A. Vallance | N/A |
| C.r-Lux ICC180 | G. Frankel and S. Wiles | N/A |
| SW102 (modified DH10B strain DY380) | NCI Frederick | https://notendur.hi.is/bmo/Recombineering Website.htm |
| Biological samples | ||
| Chemicals, peptides, and recombinant proteins | ||
| Mouse IL-22 BAC | CHORI | Cat# RP24–227B3 |
| 10% buffered formalin | Fisher Scientific | Cat# SF93–4 |
| 2-methyl butane | Sigma/Millipore | Cat# 270342 |
| 2N Sulfuric Acid | R&D/Fisher | Cat# DY994 |
| BamHI | NEB | Cat# R0136 |
| Bovine serum albumin | Sigma/Millipore | Cat# A7906 |
| Chloroform | Sigma/Millpore | Cat# C2432 |
| ClaI | NEB | Cat# R0197 |
| Collagenase IV | Sigma/Millipore | Cat# C5138 |
| DNase | Sigma/Millipore | Cat# DN25 |
| DTT | Sigma/Millipore | Cat# 43819 |
| EcoRI | NEB | Cat# R0101 |
| EDTA | Invitrogen/Fisher | Cat# AM9260G |
| Eosin | Fisher Scientific | Cat# SE23–500D |
| Ethanol | Fisher Scientific | Cat# BP2818–4 |
| Fetal Bovine Serum | Atlanta Biologicals | Cat# S11150 |
| Fluorescein-labeled UEA-1 | Vector Labs | Cat# FL-1061 |
| Glacial Acetic Acid | Fisher Scientific | Cat# A38–212 |
| L-Glutamine | Corning/Fisher | Cat# 25–005-Cl |
| HBSS | Corning/Fisher | Cat# MT21–021-CV |
| Hematoxylin | Fisher Scientific | Cat# CS401–1D |
| Hepes | Corning/Fisher | Cat# 25–060-Cl |
| Hydrochloric Acid | Fisher Scientific | Cat# A144–500 |
| 6xHis-tagged-Intimin-beta385 | A.D. O’Brien | N/A |
| Ionomycin | Sigma/Millipore | Cat# 407952 |
| Iscove’s DMEM, 1X | Corning/Fisher | Cat# 10–016-CV |
| Klenow | NEB | Cat# M0210 |
| Live/Dead (L/D) Fixable Near-IR dead cell dye | Invitrogen/ThermoFisher | Cat# L10119 |
| LongAmp Taq DNA polymerasae | NEB | Cat# M0323S |
| MEM Nonessential Amino acids | Corning/Fisher | Cat# 25–025-Cl |
| 2-Mercaptoethanol | Gibco/Fisher | Cat# 21–985-023 |
| Methanol, Histology grade | Fisher Scientific | Cat# A433S-4 |
| NaH2PO4 | Sigma/Millipore | Cat# S3139 |
| Na2HPO4 | Sigma/Millipore | Cat# S9390 |
| NotI | NEB | Cat# R0189 |
| OCT compound | Fisher Scientific | Cat# 14–373-65 |
| Paraformaldehyde EM grade | Fisher Scientific | Cat# 50–980-494 |
| PBS | Fisher | Cat# MT21–040-CM |
| Penicillin/Streptomycin (Pen/Strep) | Corning/Fisher | Cat# 30–002-Cl |
| Percol | Fisher | Cat# 45–001-747 |
| PKH26 reference microbeads | Sigma/Millipore | Cat# P4758 |
| PMA | Sigma/Millipore | Cat# P1585 |
| Prolong Gold Antifade Mountant | Invitrogen/ThermoFisher | Cat# P36934 |
| Prolong Gold Antifade Mountant with DAPI | Invitrogen/ThermoFisher | Cat# P36935 |
| Protease Inhibitor | Roche | Cat# 11836145001 |
| Proteinase K | NEB | Cat# P8107S |
| Purified Mouse IgG (Standard for ELISA) | Southern Biotech | Cat# 0107–01 |
| rmIL-23 | R&D systems/Fisher | Cat# 1887-ML-010 |
| rmIL-6 | R&D systems/Fisher | Cat# 406-ML-025 |
| RPMI 1640 | Corning/Fisher | Cat# 10–040-CM |
| Salmon Sperm DNA | Applied Biosystems/ThermoFisher | Cat# AM9680 |
| SA-Alexa Fluor 594 | Invitrogen/ThermoFisher | Cat# S-11227 |
| Sarcosyl (N-Lauroyl-Sarosine) | Sigma/Millipore | Cat# L9150 |
| SDS | Sigma/Millipore | Cat# L4390 |
| SignalStain Antibody Diluent | Cell Signaling | Cat# 8112L |
| Sodium chloride | Fisher Scientific | Cat# BP358–10 |
| Sodium hydroxide | Fisher Scientific | Cat# BP359–212 |
| Sodium pyruvate | Corning/Fisher | Cat# 25–000-Cl |
| Sucrose | Fisher Scientific | Cat# BP220–212 |
| T4 DNA ligase | NEB | Cat# M0202M |
| Target retrieval solution (10x) | Dako | Cat# S169984–2 |
| TMB solution | Invitrogen/ThermoFisher | Cat# 002023 |
| TO-PRO-3 | Invitrogen/ThermoFisher | Cat# T3605 |
| Tris Base | Fisher Scientific | Cat# BP152–5 |
| Trizol LS Reagent | Invitrogen/ThermoFisher | Cat# 10296028 |
| Tween-20 | Sigma/Millpore | Cat# P7949 |
| Xylene | Fisher Scientific | Cat# X5–4 |
| Critical commercial assays | ||
| Avidin/Biotin Blocking Kit | Vector Labs | Cat# SP-2001 |
| BD Cytofix/Cytoperm Kit | BD Biosciences | Cat# 555028 |
| High Prime labeling Kit | Roche | Cat# 11–585-592–001 |
| HisPur Ni-NTA Spin Purification Kit | Fisher/Thermo Scientific | Cat# PI88228 |
| mIL-22 Quantikine ELISA kit | R&D Systems | Cat# M2200 |
| iScript RT Supermix | Bio-Rad | Cat# 170–8841 |
| LCM Staining Kit | Ambion/ThermoFisher | Cat# AM1935 |
| MS Columns | Miltenyi Biotec | Cat# 130–042-201 |
| miRNeasy Micro Kit | Qiagen | Cat# 217084 |
| Naïve CD4+ T cell Isolation Kit, Mouse | Miltenyi Biotec | Cat# 130–104-453 |
| Nugen Universal Plus mRNA-seq library prep kit | Nugen | Cat# 0520 |
| SsoAdvanced Universal SYBR Green Supermix | Bio-Rad | Cat# 172–5275 |
| Deposited data | ||
| RNA sequencing data | This paper | GEO: GSE114338 |
| RNA sequencing data | Pham et al., 2014 | ENA: ERR225616 |
| Microarray data | Zheng et al., 2008 | GEO: GSE10010 |
| Microarray data | Pickert et al., 2009 | GEO: GSE15955 |
| Single cell RNA sequencing data | Haber et al., 2017 | GEO: GSE92332 |
| Experimental models: Cell lines | ||
| Experimental models: Organisms/strains | ||
| Mouse: Il22hCD4.fl | This paper | N/A |
| Mouse: Il22EIIa (EIIa-cre x Il22hCD4) | This paper | N/A |
| Mouse: Il22Plzf (Zbtb16/Plzf-cre x Il22hCD4) | This paper | N/A |
| Mouse: Il22∆Tcell (CD4-cre x Il22hCD4) | This paper | N/A |
| Mouse: Rorc/EGFP BAC reporter | G. Eberl | N/A |
| Mouse: Aicda–/–.µs–/– | F.E. Lund | N/A |
| Mouse: C57BL/6J | Jackson Laboratory | JAX: 000664 |
| Mouse: CD4-cre | Jackson Laboratory | JAX: 022071 |
| Mouse: Ella-cre | Jackson Laboratory | JAX: 003724 |
| Mouse: Zbtb16/Plzf-cre | Jackson Laboratory | JAX: 024529 |
| Mouse: B6 Albino | Charles River Laboratory | Crl: 022 |
| Mouse: CD1 (ICR) | Charles River Laboratory | Crl: 493 |
| Mouse: Actb-Flpe; backcrossed to B6 Albino | Jackson Laboratory | JAX: 003800 |
| Mouse: Rag1−/− | Jackson Laboratory | JAX: 002216 |
| Mouse: S100a9−/− | T. Vogl | N/A |
| Mouse: Sting1fl/fl | Jackson Laboratory | JAX: 031670 |
| Mouse: Sting1Villin(Villin-cre x Sting1fl/fl) | This paper | N/A |
| Mouse: Villin-cre | Jackson Laboratory | JAX: 021504 |
| Oligonucleotides | ||
| Muc2 qPCR primers: AAGTGGCATTGTGTGCCAACCA (forward), TGCAGCACTTGTCATCTGGGTT (reverse) | IDT | N/A |
| Scnn1a qPCR primers: TGGGCAGCTTCATCTTTAC (forward), CCAGAGATTGGAGTTGTTCTT (reverse) | IDT | N/A |
| Slc12a2 qPCR primers: CATACACTGCCGAGAGTAAAG (forward), CCACGATCCATGACAATCTAA (reverse) | IDT | N/A |
| Primers for southern blot 5’ Il22 probe: TCCACAGGACTGAGGAAAGAAGC (forward), CAGAAGGATTGATGTTGAAGGGC (reverse) | IDT | N/A |
| Primers for southern blot 3’ Il22 probe: TTTTCAATTTCCCCCTGTTGC (forward), GGAGGTGAGGTTTACAAAACGATCC (reverse) | IDT | N/A |
| Primers for genotyping Il22hCD4 homozygosity: GACAATCAGACATGGGAAACTGC (forward), ACTGACACGCAAATGCCTACATC (reverse); WT: 1019 bp (Il22) and 991 bp (Iltifb); Heterozygous: 1019 bp (Il22) and 991 bp (Iltifb) and 1051 bp (targeted Il22); Homozygous: 1051 bp (targeted Il22) and 991 bp (Iltifb) | IDT | N/A |
| Primers for genotyping Il22hCD4 floxed deletion: CCCATCCAGAGACAAGAATGAAGC (forward), TTTTAGAAGGCAGGAAGGAGCAG (reverse); Heterozygous or Homozygous: 654 bp | IDT | N/A |
| Primers for genotyping CD4-cre: CGAGTGATGAGGTTCGCAAG (forward); TGAGTGAACGAACCTGGTCG (reverse) | IDT | N/A |
| Primers for genotyping Plzf-cre: CTCCTCCATGCAGAAACACA (WT), CCCCAGGAAATAATCCAAGG (Common), TAGTGAAACAGGGGCAATGG (Mutant) | IDT | N/A |
| Primers for genotyping EIIa-cre: GCGGTCTGGCAGTAAAAACTATC (forward), GTGAAACAGCATTGCTGTCACTT (reverse) | IDT | N/A |
| Primers for 5’ arm of homology into PL451: ATAGCGGCCGCAACCTTTTTTTTCCAAC (forward), TCGGAATTCTTTTCTAGCTTCTTCTCGCTCAGAC (reverse) | IDT | N/A |
| Primers for 3’ arm of homology into PL451: GCTGGATCCGAAGAACTGCTCCTTCCTGCC (forward), ATAGCGGCCGCACACACACAAAACCACAG (reverse) | IDT | N/A |
| GalK primer to insert loxP into first intron: CTAATTTATAAAAAAAACTATTTCTTAAAATGAAAA GCAAACAGAGCACGCCTGTTGACAATTAATCATCGGCA (forward), TTCGCCATTCCACTCTGTACCTGCATGGTCAGAA CACCATGCTATAAATATCAGCACTGTCCTGCTCCT T (reverse) | IDT | N/A |
| Primers to Gap Repair into PL253: TAAGCGGCCGCCATCATCATCAACAAACTTCAAG (5’ forward arm), AGTGGATCCGTCTAAAAGCCCGACTGCGTGG (5’ reverse arm), ATTGGATCCAGCGGGCTTTGAACTACTG (3’ forward arm), GCATCTAGACAGCACTTAGGAGACAGAGAGAGGC (3’ reverse arm) | IDT | N/A |
| Recombinant DNA | ||
| IL-22 BAC clone | CHORI | Cat# RP24–227B3 |
| pMACS 4-IRES.II | Miltenyi Biotec | Cat# 130–091-888 |
| PL253 | NCI Frederick | https://notendur.hi.is/bmo/Recombineering Website.htm |
| PL451 | NCI Frederick | https://notendur.hi.is/bmo/Recombineering Website.htm |
| pGalK | NCI Frederick | https://notendur.hi.is/bmo/Recombineering Website.htm |
| Software and algorithms | ||
| FlowJo software v10.6.1 | FlowJo | https://www.flowjo.com/ |
| Nikon NIS-Elements AR 4.20 software | Nikon | https://www.nikon.com/ |
| Nikon NIS-Elements BR 4.5 software | Nikon | https://www.nikon.com/ |
| ImageJ software | NIH | https://imagej.nih.gov/ij/ |
| Adobe software (Photoshop, Illustrator) | Adobe | https://www.adobe.com/products/catalog.html |
| Prism 5 | GraphPad | http://www.graphpad.com/scientific-software/prism/ |
| Leica LMD software | Leica | https://www.leica.com/ |
| GSEA | Subramanian et al., 2005 | http://software.broadinstitute.org/gsea/index.jsp |
| STAR v2.5.3 | Dobin et al., 2013 | N/A |
| SAMtools v0.1.18 | Li et al., 2009 | N/A |
| HTSeq v0.7.2 | Anders et al., 2015 | N/A |
| DESeq2 v1.18.1 | Love et al., 2014 | N/A |
| ASHR algorithm | Stephens, 2017 | N/A |
| Fgsea R package v1.4.0 | Sergushichev, 2016 | N/A |
| MSigDB | Liberzon et al., 2015; 2011; Subramanian et al., 2005a | N/A |
| ggplot2 | Wickham, 2009 | N/A |
| limmaR package | Ritchie et al., 2015 | N/A |
| PAGER2.0 | Yue et al., 2018 | N/A |
| Other | ||