Abstract
Objectives:
To investigate differences in presentation, pathology, and outcomes after resection of non–small cell lung cancer (NSCLC) in never-smokers versus ever-smokers.
Methods:
From January 2006 to July 2016, 172 never-smokers and 1376 ever-smokers with NSCLC underwent pulmonary resection. The 2 cohorts were matched on patient characteristics, histopathological cancer cell type, and pathological stage group using a weighted balancing score, and overall survival and cancer recurrence were compared by pathological stage. Random forests for survival was used to identify granular cancer characteristics with different survival and cancer recurrence importance between groups.
Results:
In never-smokers, the prevalence of NSCLC was more frequent in women than in men (63% [n = 109] vs 45% [n = 63]). Compared with ever-smokers, never-smokers had less upper-lobe disease (53% [n = 91] vs 62% [n = 855]) and more adenocarcinoma (88% [n = 151] vs 62% [n = 845]). Postoperative complications were similar. Never-smokers had a lower prevalence of non–lung cancer deaths than ever-smokers (13% vs 23% at 5 years; P = .006). Among matched pairs, never-smokers had better overall survival at 5 years in pathological stage I (96% vs 78%), but worse survival in stage II (54% vs 78%). Tumor size, N category, and histopathological cell type were more important drivers of mortality and cancer recurrence in never-smokers than in ever-smokers.
Conclusions:
NSCLC in never-smokers affects women more than men and presents with different anatomic and histopathological distributions. Matched never-smokers have better or equivalent outcomes than ever-smokers in pathological stage I cancer, but are less likely to survive and to be cured of cancer as tumor burden increases. These findings suggest that there might be unique tumor or host behaviors differentially impacting survival of never- and ever-smoking patients with NSCLC.
Keywords: risk factors, weighted propensity matching, pulmonary resection, cancer recurrence, survival analysis
Graphical Abstract
Survival after resection for non–small cell lung cancer in never-smokers and ever-smokers.
The proportion of never-smokers with non–small cell lung cancer (NSCLC) is rising1,2; moreover, NSCLC in never-smokers may represent a distinct clinical entity.1 Findings from genetic and proteomic analyses of NSCLC in never-versus ever-smokers3–6 suggest differences in epidermal growth factor receptor biomarkers,7 transcriptional patterns that appear stratified by tobacco use,8 and overall molecular profiles of the cancers.9
Despite sophisticated laboratory studies, clinical studies aimed at segregating NSCLC in never-smokers from that in ever-smokers have not been as informative. Cohort studies suggest that never-smokers survive longer, but this might be confounded by differing frequency of adenocarcinoma, female sex, race, performance status, comorbidities, and suboptimal clinical staging by positron emission tomography scanning in smokers.10–16 One matched study identified no differences in survival for never- versus ever-smokers with NSCLC, but this study was limited by underrepresentation of early-stage disease,16 whereas another study suggests an important difference.17 Finally, confounding of survival estimates by non–lung cancer deaths remains incompletely understood.10
Therefore, we reviewed our experience with resected NSCLC from never- and ever-smokers to characterize differences in demographics and clinical presentation, periresection outcomes, mortality, and cancer recurrence. We used matching based on a balancing score to account for differences in comorbidities associated with tobacco use, thereby isolating NSCLC-related differences, and machine learning to identify survival and cancer recurrence differences related to individual cancer characteristics, unrestrained by coarse stage grouping.
METHODS
Patients
From January 2006 to July 2016, 1548 patients underwent pulmonary resection for NSCLC at Cleveland Clinic. These patients included 172 (11%) never-smokers and 1376 (89%) ever-smokers (Table 1). Smoking status was abstracted from patients’ self-reported social history in the medical record. The Cleveland Clinic Institutional Review Board approved use of these data for research (approval no. 13–411; August 22, 2017), with patient consent waived.
TABLE 1.
Patient characteristics of ever-smokers and never-smokers before and after matching (N = 1548)
| Before matching | After matching | |||||||||
|---|---|---|---|---|---|---|---|---|---|---|
|
|
|
|||||||||
| Characteristic | Never-smokers (n = 172) | Ever-smokers (n = 1376) | Standardized difference, % | Never-smokers (n = 169) | Ever-smokers (n = 165) | Standardized difference, % | ||||
|
|
|
|
|
|||||||
| n* | No. (%) or 15th/50th/85th percentiles | n* | No. (%) or 15th/50th/85th percentiles | n* | No. (%) or 15th/50th/85th percentiles | n* | No. (%) or 15th/50th/85th percentiles | |||
|
| ||||||||||
| Demographics | ||||||||||
| Age, y | 172 | 53/68/78 | 1376 | 56/68/77 | −7.9 | 169 | 53/69/78 | 165 | 53/68/79 | −2.6 |
| Female sex | 172 | 109 (63) | 1376 | 623 (45) | 37 | 169 | 106 (63) | 165 | 103 (63) | 0.09 |
| Body surface area, m2 | 172 | 1.6/1.9/2.2 | 1376 | 1.7/1.9/2.2 | −28 | 169 | 1.6/1.9/2.2 | 165 | 1.6/1.9/2.2 | −1.4 |
| Body mass index, kg/m2 | 172 | 22/26/32 | 1372 | 22/27/33 | −15 | 169 | 22/26/32 | 165 | 22/26/32 | 0.73 |
| Race | ||||||||||
| Black | 169 | 10 (5.9) | 1323 | 134(10) | −16 | 166 | 9.7 (5.9) | 160 | 18(11) | −19 |
| White | 169 | 142 (84) | 1323 | 1169 (88) | −13 | 166 | 140 (85) | 160 | 139(87) | −6.7 |
| Other | 172 | 10 (5.8) | 1376 | 2(0.15) | 34 | 169 | 8.5 (5.1) | 165 | 1.0 (0.63) | 27 |
| Smoking | ||||||||||
| Pack-years | 172 | 1376 | — | 169 | 165 | — | ||||
| ≤10 | 172 (100) | 100 (7.3) | 169 (100) | 22(13) | ||||||
| 11–20 | 0(0) | 157 (11) | 0(0) | 29 (17) | ||||||
| 21–40 | 0(0) | 437 (32) | 0(0) | 58 (35) | ||||||
| 41–60 | 0(0) | 346 (25) | 0(0) | 31 (19) | ||||||
| ≥61 | 0(0) | 336 (24) | 0(0) | 26(16) | ||||||
| Lung function | ||||||||||
| FEV1, % of predicted | 159 | 73/92/110 | 1291 | 63/81/101 | 54 | 156 | 74/93/108 | 157 | 73/93/111 | −1.1 |
| Lung diffusion test, % of predicted | 121 | 72/89/106 | 999 | 56/74/93 | 80 | 120 | 72/89/106 | 119 | 66/85/112 | 8.8 |
| Comorbidities | ||||||||||
| Hypertension | 166 | 88 (53) | 1346 | 836 (62) | −18 | 163 | 87 (53) | 160 | 87 (55) | −2.2 |
| Steroids | 166 | 8 (4.8) | 1346 | 88 (6.5) | −7.4 | 163 | 8 (4.9) | 160 | 10 (6.3) | −6.1 |
| Coronary artery disease | 166 | 22 (13) | 1346 | 318 (24) | −27 | 163 | 22 (14) | 160 | 22(14) | 0.06 |
| Peripheral arterial disease | 166 | 9 (5.4) | 1346 | 144(11) | −19 | 163 | 8.7 (5.4) | 160 | 9.1 (5.7) | −1.4 |
| Prior cardiothoracic surgery | 166 | 28 (17) | 1345 | 223 (17) | 0.77 | 163 | 28 (17) | 160 | 27 (17) | −0.46 |
| Preoperative chemotherapy | 166 | 29 (17) | 1346 | 164 (12) | 15 | 163 | 28 (17) | 160 | 26 (16) | 2.5 |
| Preoperative radiation | 166 | 26 (16) | 1346 | 172(13) | 8.3 | 163 | 26 (16) | 160 | 26 (16) | −0.82 |
| Pharmacologically treated diabetes | 172 | 21 (12) | 1376 | 252(18) | −17 | 168 | 21 (13) | 165 | 21(13) | −1.6 |
FEV1, Forced expiratory volume in 1 second.
Patients with data available.
Cancer Staging
All cancers were pathologically staged according to the 8th edition of the American Joint Committee on Cancer’s AJCC Cancer Staging Manual18 (Table 2).
TABLE 2.
Clinical cancer characteristics of ever-smokers and never-smokers before and after matching
| Before matching | After matching | |||||||||
|---|---|---|---|---|---|---|---|---|---|---|
|
|
|
|||||||||
| Characteristic | Never-smokers (n = 172) | Ever-smokers (n = 1376) | Standardized difference, % | Never-smokers (n = 169) | Ever-smokers (n = 165) | Standardized difference, % | ||||
|
|
|
|
|
|||||||
| n* | No. (%) | n* | No. (%) | n* | No. (%) | n* | No. (%) | |||
|
| ||||||||||
| Tumor location | 172 | 1376 | 168 | 165 | ||||||
| Right upper | 51 (30) | 498 (36) | −14 | 50 (30) | 58 (35) | −11 | ||||
| Right middle | 5 (2.9) | 71 (5.1) | −11 | 5 (3.0) | 11 (6.4) | −16 | ||||
| Right lower | 45 (26) | 255 (19) | 18 | 45 (27) | 35 (21) | 13 | ||||
| Left upper | 40 (23) | 357 (26) | −6.2 | 38 (23) | 42 (26) | −6.3 | ||||
| Left lower | 28 (16) | 184 (13) | 8.2 | 27 (16) | 20 (12) | 11 | ||||
| Right central | 2 (1.2) | 14 (1.0) | 1.4 | 2 (1.2) | 0.95 (0.57) | 6.5 | ||||
| Left central | 2 (1.2) | 19 (1.4) | −1.9 | 2 (1.2) | 0.73 (0.44) | 8.3 | ||||
| Focality | 170 | 1373 | 0.55 | 167 | 165 | −4.0 | ||||
| Unifocal | 156 (92) | 1262 (92) | 154 (92) | 150 (91) | ||||||
| Multifocal | 14 (8.2) | 111 (8.1) | 13 (7.9) | 15 (9.0) | ||||||
| Histopathological type | 172 | 1373 | 169 | 165 | ||||||
| Adenocarcinoma | 151 (88) | 845 (62) | 63 | 148 (88) | 146 (89) | −3.0 | ||||
| Large cell | 2 (1.2) | 60 (4.4) | −20 | 2 (1.2) | 4.5 (2.8) | −11 | ||||
| Not otherwise specified | 0(0) | 18 (1.3) | −16 | 0(0) | 1.3 (0.76) | −12 | ||||
| Other | 9 (5.2) | 31 (2.3) | 16 | 9 (5.1) | 3.0 (1.8) | 18 | ||||
| Squamous | 10 (5.8) | 419 (31) | −68 | 10 (6.0) | 9.8 (6.0) | −0.15 | ||||
| Invasion and involved margins | ||||||||||
| Visceral pleural invasion | 167 | 55 (33) | 1360 | 386 (28) | −9.9 | 164 | 54 (33) | 163 | 44 (27) | 13 |
| Lymphovascular invasion | 128 | 54 (42) | 1049 | 426 (41) | 3.2 | 124 | 52 (42) | 126 | 53 (42) | −0.75 |
| Soft tissue margin involved | 120 | 7 (5.8) | 1040 | 35 (3.4) | 12 | 118 | 7 (5.9) | 123 | 4.0 (3.2) | 13 |
| Bronchial margin involved | 158 | 6 (3.8) | 1230 | 13(1.1) | 18 | 155 | 5.8 (3.8) | 151 | 0.69 (0.46) | 23 |
| Vascular margin involved | 161 | 3 (1.9) | 1222 | 15 (1.2) | 5.0 | 158 | 3 (1.9) | 150 | 0.75 (0.5) | 13 |
| Parenchymal margin involved | 103 | 1 (0.97) | 902 | 9 (1.0) | −0.27 | 101 | 1 (0.99) | 108 | 0.57 (0.53) | 5.3 |
| Pathological T category | 172 | 1376 | 169 | 165 | ||||||
| 1a | 7 (4.1) | 104 (7.6) | −15 | 7 (4.1) | 12 (7.1) | −13 | ||||
| 1b | 45 (26) | 379 (28) | −3.1 | 44 (26) | 47 (28) | −4.6 | ||||
| 1c | 47 (27) | 341 (25) | 5.8 | 46 (27) | 42 (26) | 3.3 | ||||
| 2a | 35 (20) | 212(15) | 13 | 34 (20) | 25 (15) | 13 | ||||
| 2b | 13 (7.6) | 116 (8.4) | −3.2 | 13 (7.7) | 14 (8.6) | −3.4 | ||||
| 3 | 13 (7.6) | 129 (9.4) | −6.5 | 13 (7.5) | 17 (10) | −9.0 | ||||
| 4 | 12 (7.0) | 95 (6.9) | 0.29 | 12 (7.1) | 8.3 (5.0) | 8.7 | ||||
| Pathological N category | 172 | 1376 | 169 | 165 | ||||||
| 0 | 116 (67) | 1007 (73) | −13 | 113 (67) | 116 (70) | −6.1 | ||||
| 1 | 35 (20) | 241 (18) | 7.2 | 35 (21) | 30 (18) | 5.8 | ||||
| 2 | 21 (12) | 126 (9.2) | 9.9 | 20 (12) | 19(11) | 1.95 | ||||
| 3 | 0(0) | 2 (0.15) | −5.4 | 0(0) | 0.13 (0.08) | −3.99 | ||||
| Pathological M category | 172 | 170 (99) | 1376 | 1353 (98) | −4.3 | 169 | 167 (99) | 165 | 163 (99) | −0.74 |
| Pathological stage group | 172 | 1376 | 11 | 169 | 165 | 7.3 | ||||
| IA1 | 4 (2.3) | 95 (6.9) | 4 (2.3) | 11 (6.5) | ||||||
| IA2 | 40 (23) | 317 (23) | 39 (23) | 36 (22) | ||||||
| IA3 | 29 (17) | 255 (19) | 28 (16) | 28 (17) | ||||||
| IB | 19(11) | 133 (9.7) | 19(11) | 14 (8.8) | ||||||
| IIA | 6 (3.5) | 63 (4.6) | 6 (3.6) | 8.2 (5.0) | ||||||
| IIB | 41 (24) | 252(18) | 41 (24) | 36 (22) | ||||||
| IIIA | 27 (16) | 203 (15) | 26 (16) | 25 (15) | ||||||
| IIIB | 4 (2.3) | 34 (2.5) | 4 (2.3) | 3.8 (2.3) | ||||||
| IIIC | 0(0) | 1 (0.07) | 0(0) | 0.03 (0.02) | ||||||
| IV | 2 (1.2) | 23 (1.7) | 2 (1.2) | 2.1 (1.3) | ||||||
Patients with data available.
Cancer Therapy
The majority of cancers were removed by lobectomy: 85% in never-smokers and 78% in ever-smokers (Table E1). A thoracoscopic approach was used for 84 (48%) never-smokers and 691 (50%) ever-smokers. For patients with locally advanced disease (cIIIA), concurrent chemotherapy (platinum doublet) and radiotherapy (45–60 Gy) were administered and completed 4 to 6 weeks before resection. Not all medical therapy was delivered at our center.
Endpoints
Primary endpoints were all-cause mortality from date of operation and cancer recurrence, death before NSCLC recurrence, which we assumed to represent non-NSCLC deaths, and death after cancer recurrence. Secondary endpoints were 30-day complications, as defined by the Society of Thoracic Surgeons National Database (https://www.sts.org/registries-research-center/sts-national-database). Cancer recurrence was confirmed by tissue diagnosis in many patients or by an overwhelming clinical diagnosis in others, particularly in those with systemic disease. For the latter patients, standard staging modalities included positron emission tomography scan, magnetic resonance imaging, or computed tomography scan of the brain.
Follow-up
Patients underwent clinical and radiographic surveillance at 6 months, then annually according to our institutional protocol. The date of recurrence was the date of the first radiographic evidence of cancer recurrence before tissue diagnosis. Fifty percent of survivors were followed for >3.2 years, 25% for >5.6 years, and 10% for >8 years.
Data Analysis
Analyses were performed using SAS version 9.4 (SAS Institute, Cary, NC) and R version 3.5.3 (R Foundation for Statistical Computing, Vienna, Austria). Continuous variables are summarized as mean ± standard deviation or equivalent 15th, 50th (median), and 85th percentiles if the distribution was skewed. Categorical data are summarized as frequencies and percentages. Uncertainty is expressed by 68% confidence limits equivalent to ±1 standard error. Standardized differences were calculated for comparisons of never- and ever-smokers.19
Overview of data analysis.
The primary data analyses focused on all-cause mortality and cancer recurrence. Two complementary analyses were performed for both outcomes. The first was a nonparametric Kaplan–Meier comparison of never- and ever-smokers whose clinical characteristics were statistically balanced using a weighted balancing score. The second was a machine learning investigation of differences in survival and cancer recurrence according to individual cancer characteristics, adjusted for clinical characteristics of the 2 cohorts of patients. Appendix E1 includes details of the statistical analyses that are described briefly in what follows.
Characterization of never- versus ever-smokers.
Multivariable logistic regression was performed to develop a parsimonious model of preoperative factors associated with being a never-smoker versus an ever-smoker. Variables considered in this analysis are listed in Appendix E2 and include demographics, lung function, histopathological cancer type and pathological stage group, and comorbidities.
Balancing score matching.
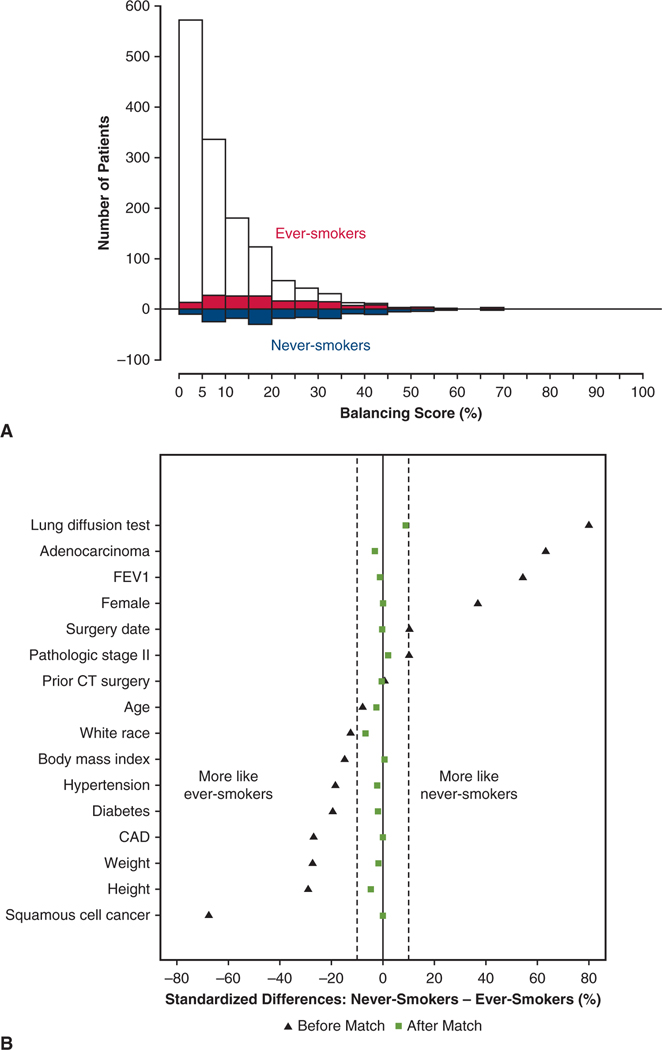
Unlike a treatment, smoking is a natural experiment and violates the exchangeability assumption of propensity scores that are thought to lead to causal inference.20 However, similar to comparing outcomes for a treatment, patient and cancer characteristics must be balanced. Thus, as originally noted by Rosenbaum and Rubin,20 a balancing score can be generated, similar to a propensity score. To accomplish this, we augmented the previously described parsimonious model with other variables marked in Appendix E2, to form a saturated model. We then applied the weighting analog of pair matching developed by Li and Greene for outcome comparisons.21,22 The effective population size was 168.5 patients (rounded to 169) for the matched never-smokers and 165.1 (rounded to 165) for the ever-smokers. The quality of matching is depicted in Figure E1. Outcomes between propensity-weighted groups were compared using either a bootstrap resampling method23 or weighted time-to-event analysis.24 To correctly estimate variance of the treatment effect and take into account uncertainty in the estimated balancing score, the bootstrap method was used.23
Unconstrained characterization of outcomes.
Machine learning was used to better understand survival and cancer recurrence differences according to pathological stage, using cancer characteristics unconstrained by classical TNM characterization and stage groupings. These characteristics included histopathological cell type, tumor size as a continuous variable, nodal status, tumor location, tumor laterality, and visceral pleural invasion, according to smoking status. Two random forests for survival (RF-S)25 models were developed for each outcome using the entire NSCLC dataset, one for the entire never-smoker cohort and one for the entire ever-smoker cohort. From these, we ascertained for each cancer characteristic the risk-adjusted importance of each variable and how it differed for never-smokers and ever-smokers.
Cancer Recurrence and Death Before Recurrence
Cancer recurrence and short- and long-term survival were assessed nonparametrically using the Kaplan–Meier method, stratified by never-smokers versus ever-smokers in the overall cohort and by groups within matched patients. Differences were tested using Cox proportional hazard regression and a bootstrap methodology.
RESULTS
Prevalence of Pulmonary Resections for NSCLC in Never-Smokers
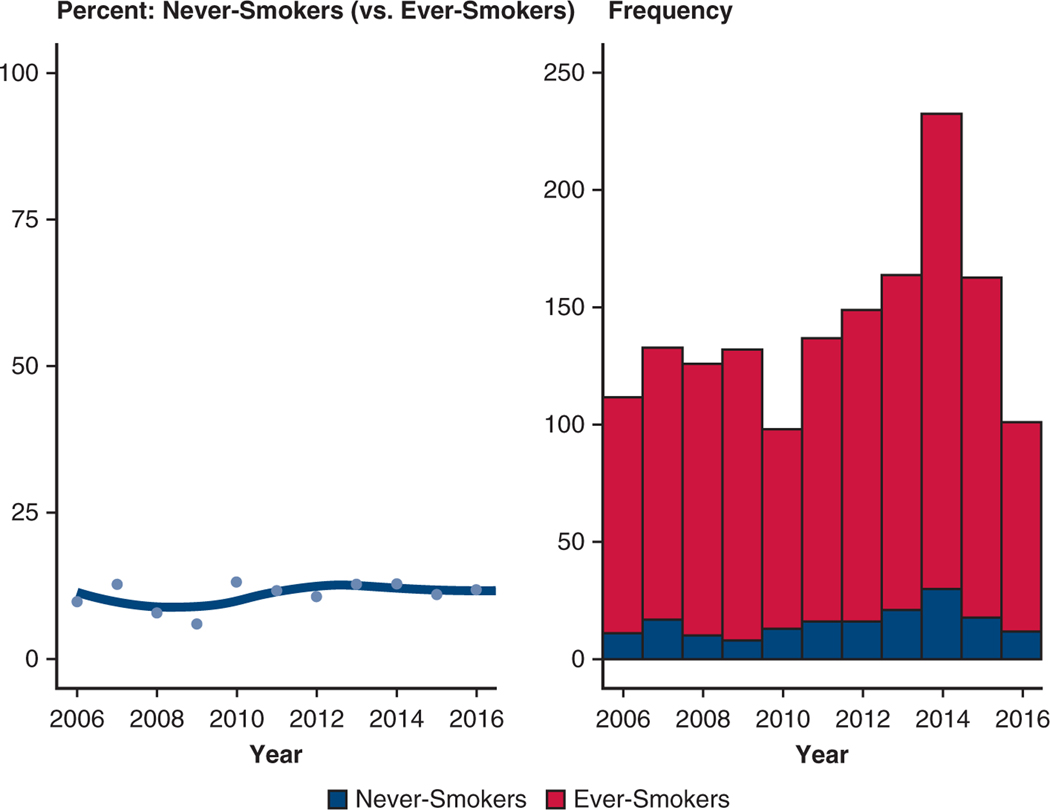
From 2006 to 2017, the proportion of never-smokers in the resected NSCLC cohort remained stable, between 10% and 12% annually (Figure E2).
Differences in Patient and Cancer Characteristics
Age was similar between never- and ever-smokers, but never-smokers were more often women (63% vs 45%), had higher forced expiratory volume in 1 second (FEV1, expressed as percentage of expected; median, 92% vs 81%), higher lung diffusion (expressed as percentage of expected; median, 89% vs 74%), and fewer comorbidities (see Table 1). Never-smokers were also more likely to have undergone induction therapy (21% vs 15%).
The distribution of characteristics and principal histopathological cell type of NSCLC differed between never-smokers and ever-smokers (Table 2). Never-smokers more often had adenocarcinoma (88% vs 62%; P < .0001) and less often squamous cell cancer (5.8% vs 31%; P < .0001). They also had less upper-lobe disease (53% vs 62%; P = .02). However, pathological stage at resection was similar in the 2 groups (P = .5).
Perioperative Mortality and Morbidity (Weighted Matched Cohorts)
Among matched patients, perioperative in-hospital mortality was 0.59% (n = 1) for never-smokers and 0.62% (n = 1) for ever-smokers (Table E2). Postoperative complications were similar for matched never- and ever-smokers within 30 days (27% vs 28%), including atrial arrhythmias (8.8% vs 12%), chest tube air leak (3.6% vs 3.0%), pulmonary embolus (1.2% vs 0.48%), pneumonia (1.2% vs 2.4%), and prolonged intubation (0.59% vs 0.25%).
Unadjusted Reference Survival and Cancer Recurrence
All-cause mortality.
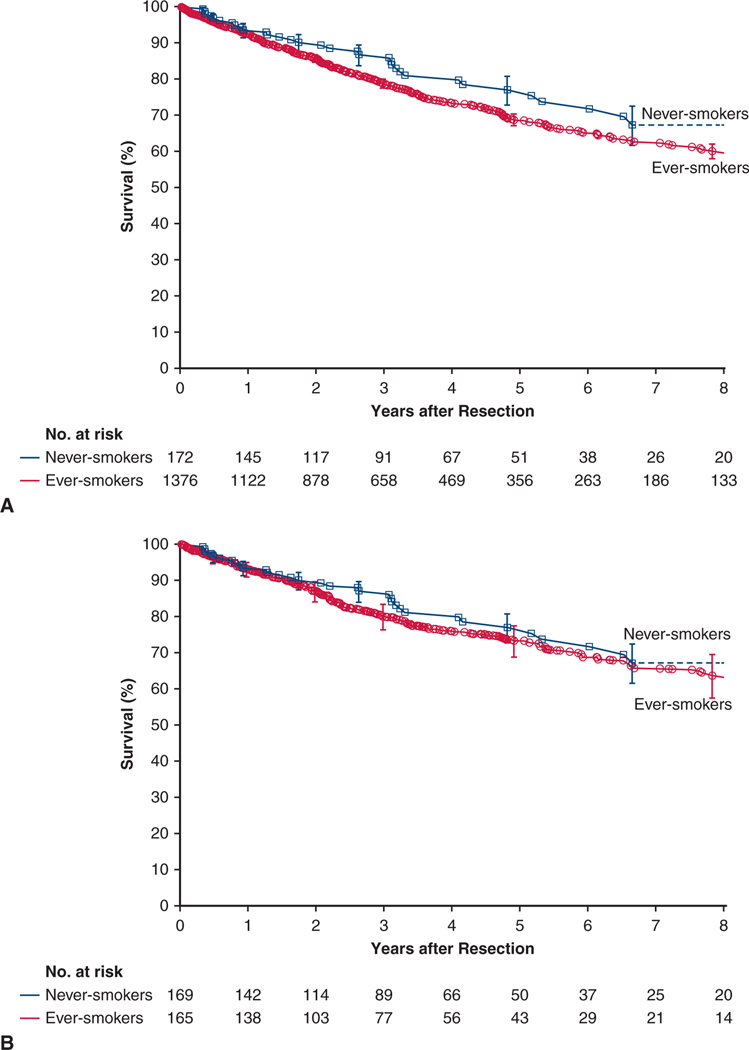
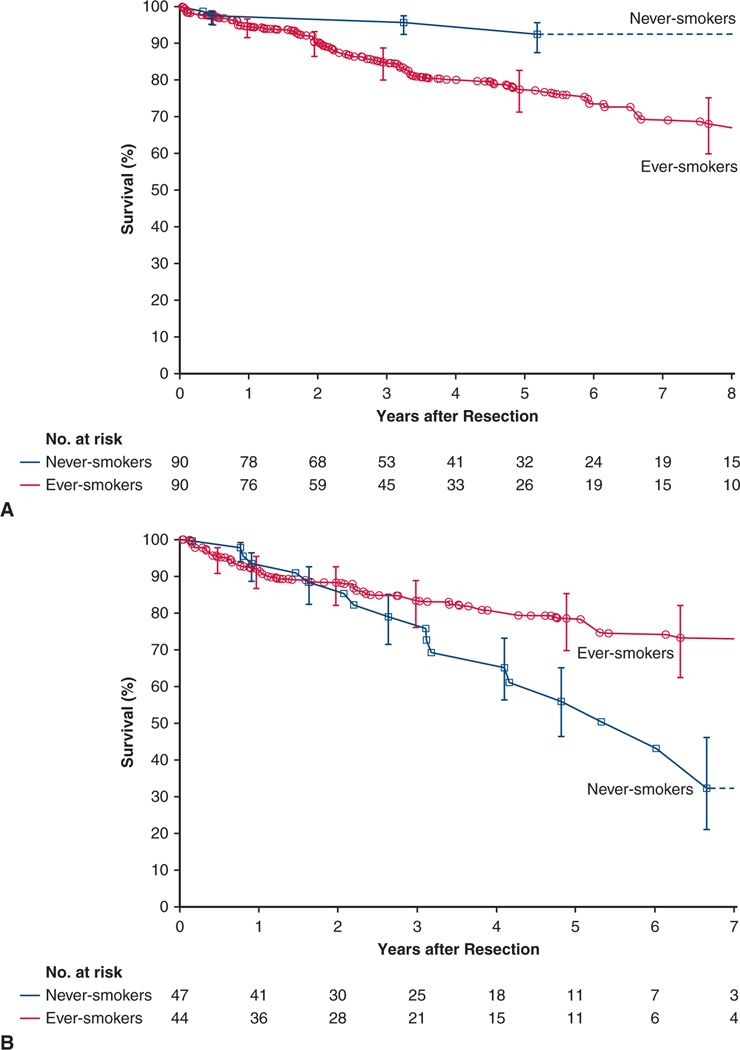
There were 381 deaths, 33 among never-smokers and 348 among ever-smokers. Survival among never-smokers at 1, 5, and 8 years was 93%, 77%, and 67%, respectively. For reference, among ever-smokers it was 93%, 69%, and 60%, respectively (Figure 1, A).
FIGURE 1.
Survival after resection of non–small cell lung cancer in never-smokers (blue line and squares) and ever-smokers (red line and circles). Each symbol represents a death, and vertical bars are asymmetric 68% confidence limits equivalent to ±1 standard error. Numbers below the horizontal axis are patients remaining at risk. A, Overall cohorts. B, Weighted matched cohorts.
Cancer recurrence.
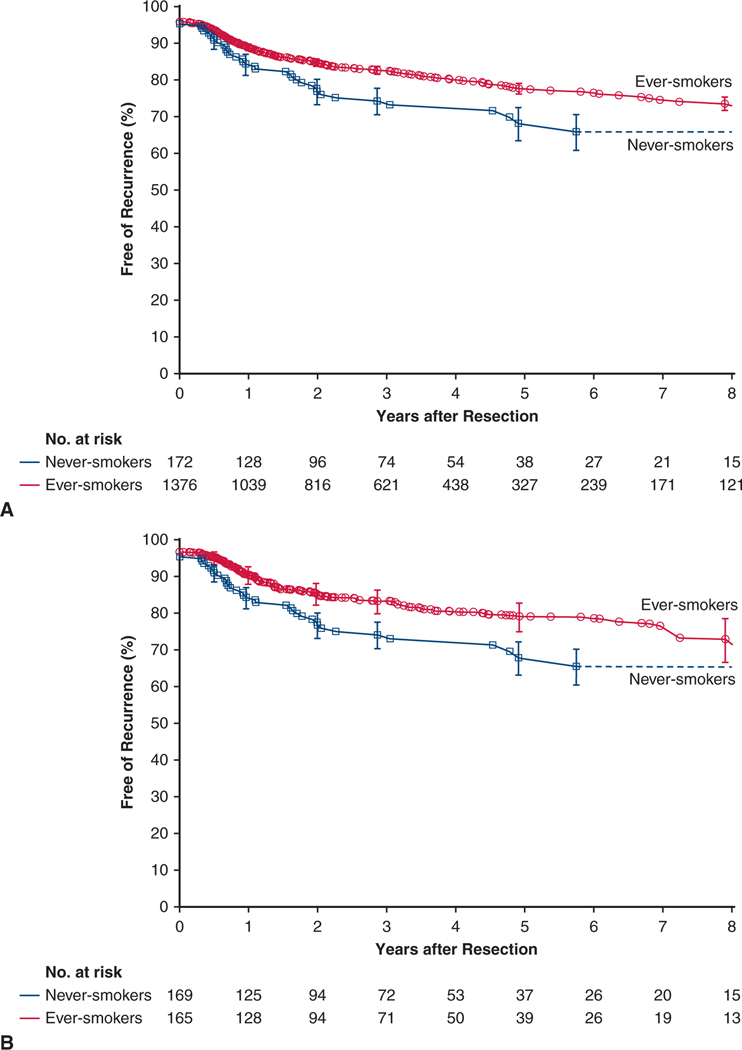
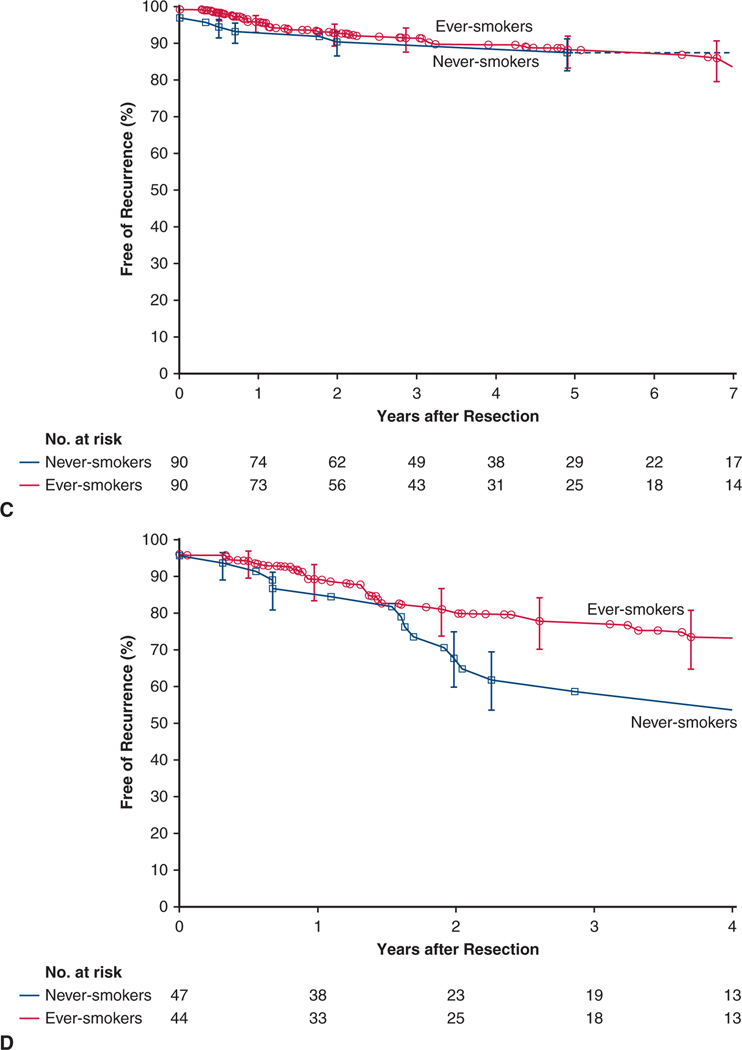
In the overall never-smoker cohort, estimated freedom from NSCLC recurrence was 68% at 5 years and, for reference, 78% among ever-smokers (Figure 2, A).
FIGURE 2.
Cancer persistence or recurrence after resection of non–small cell lung cancer in never-smokers (blue line and squares) and ever-smokers (red line and circles). Format is as in Figure 1. A, Overall cohorts. B, Weighted matched cohorts
Death before cancer recurrence.
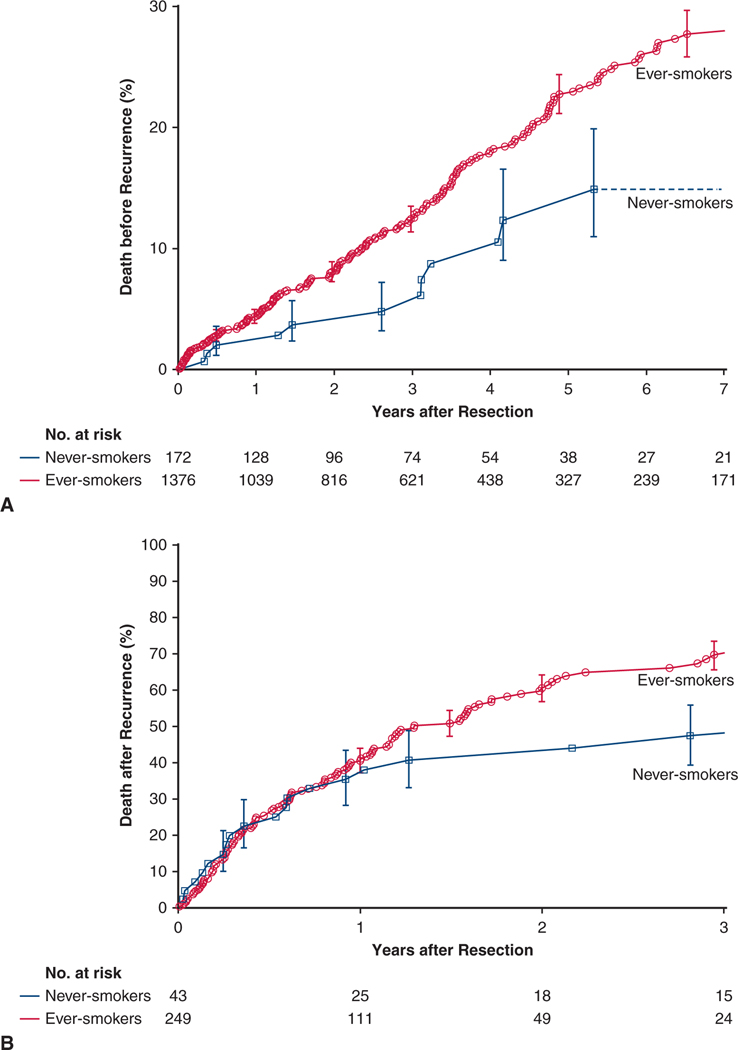
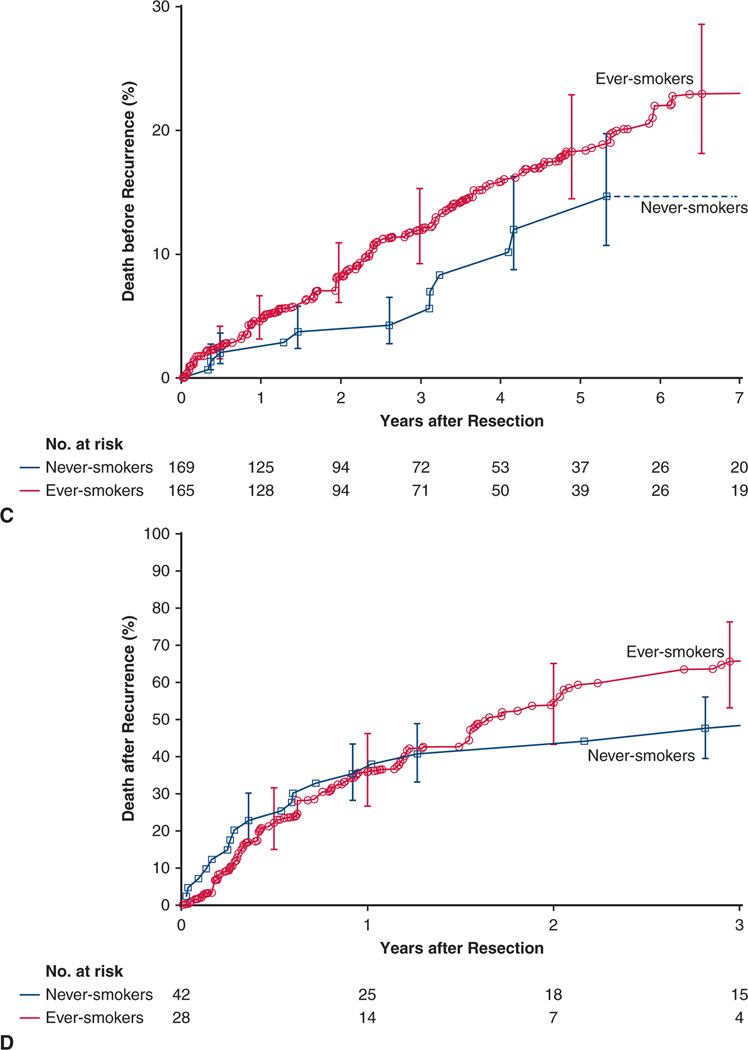
There were 227 non–NSCLC-related deaths, 12 among never-smokers and 215 among ever-smokers. At 5 years, death before recurrence among never-smokers was 13% and, for reference, 23% among ever-smokers (Figure 3, A).
FIGURE 3.
Death before and after cancer recurrence following resection of non–small cell lung cancer in never-smokers (blue line and squares) and ever-smokers (red line and circles). Format is as in Figure 1, except that the plots are inverted. A, Death before cancer recurrence in overall cohorts. B, Death after cancer recurrence in overall cohorts. C, Death before cancer recurrence in weighted matched cohorts. D, Death after cancer recurrence in weighted matched cohorts.
Death after cancer recurrence.
There were 154 deaths after cancer recurrence, 21 among never-smokers and 133 among ever-smokers. At 3 years, death after cancer recurrence among never-smokers was 48% and, for reference, 70% among ever-smokers (Figure 3, B).
Weighted Matched Outcomes
All-cause mortality.
Survival at 1, 5, and 8 years was 94%, 77%, and 67%, respectively, among matched never-smokers versus 93%, 74%, and 64%, respectively, among matched ever-smokers (P = .2) (Figure 1, B).
Survival by pathological stage.
Stage I.
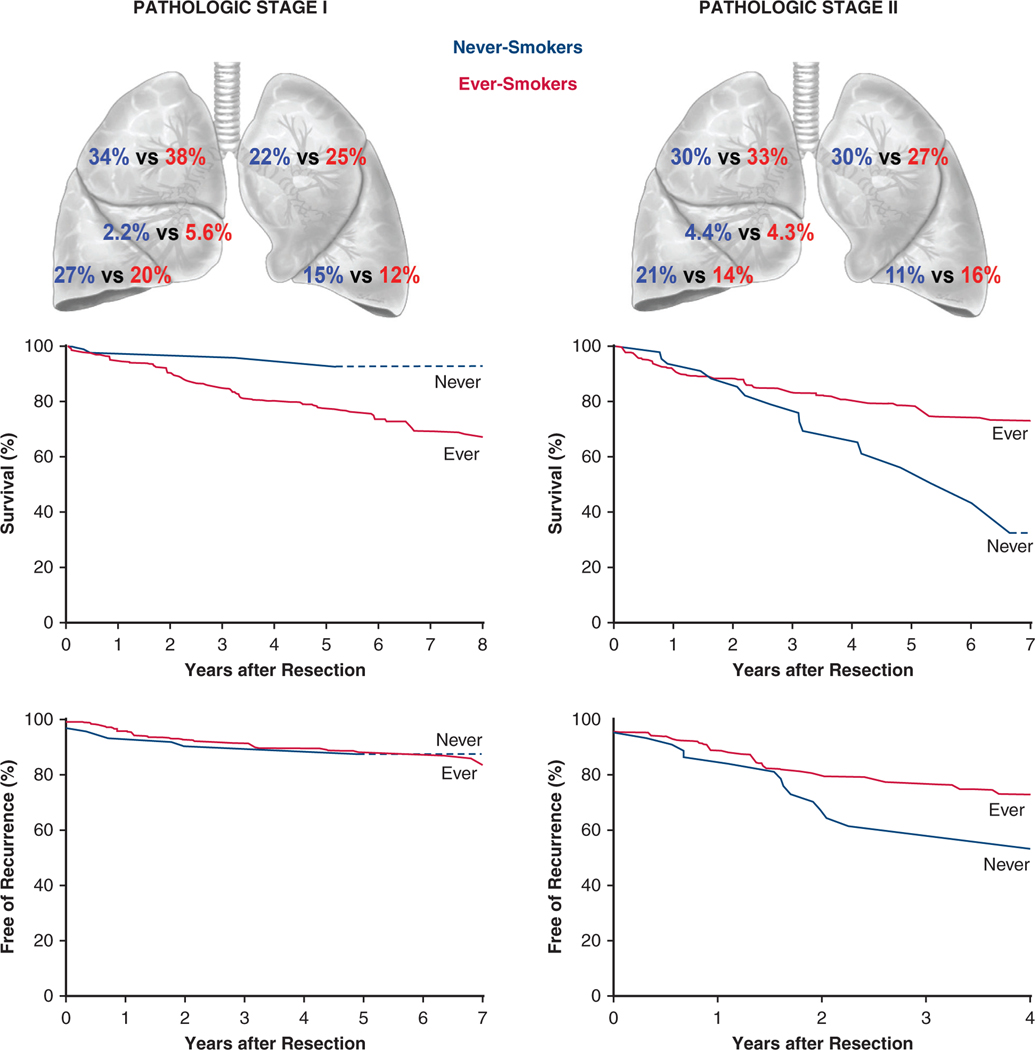
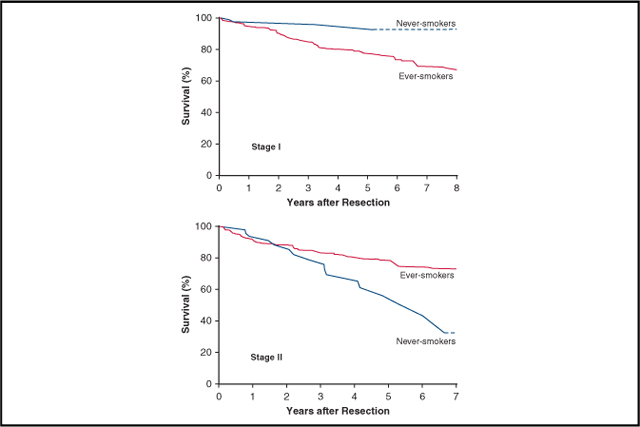
In a subset of 90 matched pairs of patients in pathological stage I, 5-year survival was 96% in never-smokers versus 78% in ever-smokers (Figure 4, A). Stage I cancers in matched never-smokers compared with matched ever-smokers were less likely to be pT1a, and thus patients were less likely to have pathological stage IA1 and more likely to have cancer in the left lower lobe and less likely to have it in the right middle lobe (Table E3).
FIGURE 4.
Survival and cancer recurrence after resection of pathological stage I and stage II non–small cell lung cancer in never-smokers (blue line and squares) and ever- smokers (red line and circles). Format is as in Figure 1. A, Survival in matched stage I cohorts. B, Survival in matched stage II cohorts. C, Freedom from cancer recurrence in matched stage I cohorts. D, Freedom from cancer recurrence in matched stage II cohorts.
Stage II.
In a subset of matched pairs of pathological stage II patients, the relationship was inverted to that of pathological stage I patients, with never-smokers having a 5-year survival of 54% versus 78% among ever-smokers (Figure 4, B). Stage II cancers of matched never-smokers compared with matched ever-smokers were more likely to have positive lymph nodes and be pathological stage IIB rather than IIA (Table E4).
Differential importance of risk factors for mortality.
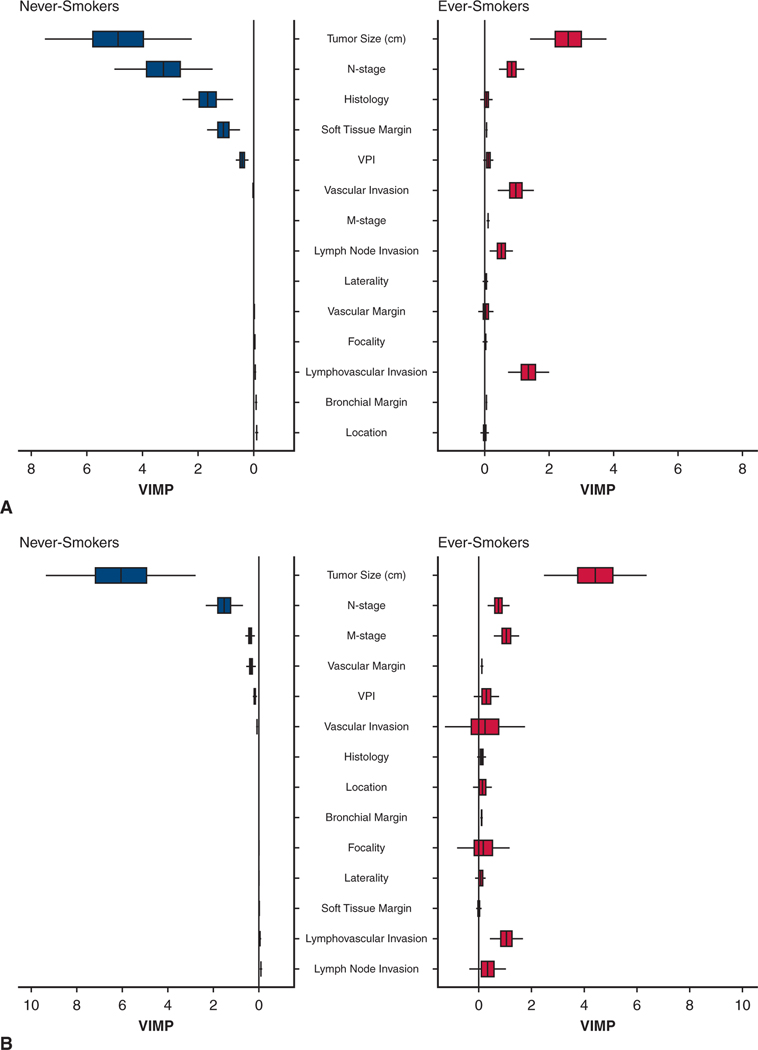
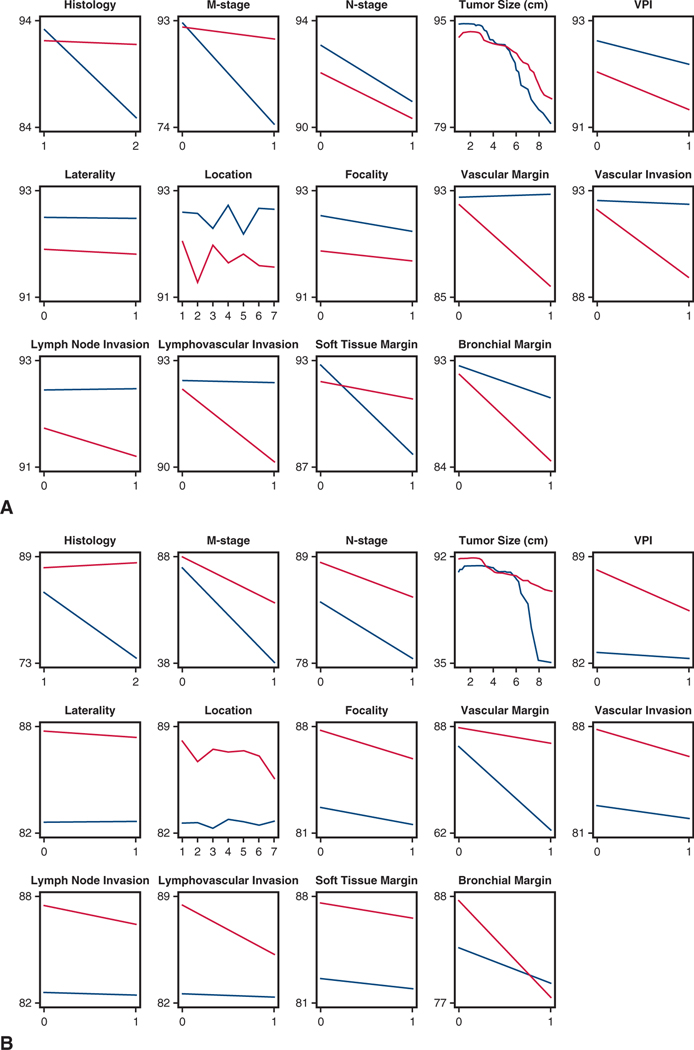
In an unconstrained analysis of detailed cancer and patient risk factors, 3 cancer variables played a more important role in predicting mortality among never-smokers than among ever-smokers: tumor size (as a continuous variable), pN stage, and histopathological type (Figure 5, A). The differential effect on survival of the variable with the greatest difference in importance—tumor size—became apparent after 5 cm (Figure E3, A).
FIGURE 5.
Mirrored histogram for never-smokers and ever-smokers of risk-adjusted normalized variable importance (VIMP) for survival and cancer recurrence, showing only cancer characteristics with 95% confidence intervals and median represented by a vertical bar. Presentation is in descending order of importance for the ever-smoker cohort. A, Survival. B, Cancer recurrence. VPI, Visceral pleural invasion.
Cancer recurrence.
At 5 years, estimated freedom from NSCLC recurrence for matched never-smokers versus ever-smokers was 68% versus 79% (P = .04) (Figure 2, B). Among matched patients, those with stage I NSCLC experienced similar cancer recurrence (Figure 4, C), but after 1–1/2 years, matched never-smokers with stage II NSCLC experienced more cancer recurrence than ever-smokers (Figure 4, D). Variables of importance for cancer recurrence mirrored those for mortality, with differential effects between never-smokers and ever-smokers even more pronounced (Figure 5, B, and Figure E3, B).
Death before cancer recurrence.
Among matched patients, 3-year mortality before NSCLC recurrence was 5% in never-smokers and 12% in ever-smokers (P = .05) (Figure 3, C).
Death after cancer recurrence.
Among matched patients, 3-year mortality after recurrence was 48% in never-smokers and 66% in ever-smokers (P = .3) (Figure 3, D).
DISCUSSION
Principal Findings
During the study period, the proportion of never-smokers among resected NSCLC patients remained stable at approximately 10%. Compared with ever-smokers, never-smokers were more often female and had more lower-lobe disease and adenocarcinoma (Figure 6). Perioperative outcomes after resection were similar in the 2 groups.
FIGURE 6.
Differences in non–small cell lung cancer (NSCLC) characteristics and outcomes in never-smokers versus ever-smokers. In both pathological stage I and stage II NSCLC, distribution of cancer differs, as does survival. Never-smokers with stage I cancer have better survival than ever-smokers, and never-smokers with stage II cancer have worse survival than ever-smokers. This may be partly related to the heterogeneity of cancer characteristics within pathological cancer stages, as well as to apparent differences in effect of risk factors for mortality and cancer recurrence, such as effect of tumor size and presence of positive lymph nodes in never-smokers versus ever-smokers.
However, ever-smokers were more likely than never-smokers to die from causes other than their cancer before cancer recurrence. In the subset of matched patients with similar comorbidities, pulmonary function, performance status, and histopathological cell type and pathological stage, survival was similar on average, but there were surprising differences between never-smokers and ever-smokers based on TNM-constrained and TNM-unconstrained variables. Never-smokers with stage I NSCLC had better survival than ever-smokers, whereas the inverse was true for stage II disease, with never-smokers having worse survival and more rapid cancer recurrence compared with ever-smokers. By unconstrained analysis, absolute tumor size incrementally and disproportionately affected survival and cancer recurrence in never-smokers compared with ever-smokers. Moreover, unique histopathological descriptors of the primary tumor also appeared to have had differential effects on survival and cancer recurrence between the 2 groups, and we have attempted to separate out the effects of these numerous differences in patient and cancer characteristics on survival and recurrence. Not surprisingly, we demonstrate heterogeneity within the current staging system and how this may affect generalized statements of prognosis and survival.
Study Design
The first aim of this study was to identify differences in cancer characteristics and comorbidities between never-smokers and ever-smokers receiving surgical management. The second aim was to discover survival and cancer recurrence differences between never-smokers and ever-smokers once differences in patient and cancer characteristics were balanced. Thus, we created a balancing score to mitigate confounding variables, such as demographics, comorbidities, pulmonary function, and cancer characteristic differences between the 2 groups. Finally, having observed differences in survival and cancer recurrence with respect to constrained stage groupings, we investigated cancer characteristics in an unconstrained manner to identify possible disproportionate effects on outcomes between never-smokers and ever-smokers.
NSCLC in Never-Smokers
NSCLC in never-smokers is the seventh leading cause of cancer death in the United States.17,26 Although tobacco use has decreased in the general population, lung cancer among never-smokers has increased, possibly due to environmental exposure or other incompletely identified variables. Never-smokers comprise 10% to 15% of all newly diagnosed lung cancers, and in women, the prevalence is comparable to that of cervical cancer.27 Despite this, public health efforts are lacking for lung cancer screening in never-smokers.
We were initially puzzled as to how and why early-stage disease seemed so treatable in never-smokers while locally advanced disease was so poorly affected. We were somewhat comforted by this paradox having been reported by others, although with less stringent matching.17 We had assumed that the patients from the never- and ever-smoking groups had been managed equivalently, independent of final pathological stage, and wanted to discount the possibility of stage migration. We considered the possibility of subtle differences and inadequacies in TNM staging of patients with stage II disease, whereby never-smokers might have had more T1–2N1 disease and less T2b-3N0 disease. Some of these differences were found.
We then attempted to uncouple unique tumor characteristics from cancer stage using machine learning to tease out at a more granular level the effect of cancer presentation on survival and cancer recurrence. Our findings corroborated the notion that never-smokers do less well with locally advanced disease compared with ever-smokers. Specifically, absolute size of the index cancer, independent of T classification of tumor size, was more highly predictive of mortality and cancer recurrence in never-smokers and, surprisingly, less so in ever-smokers.
Nevertheless, we still do not know why advanced cancers in never-smokers are more difficult to treat. Could these cancers be less responsive to chemotherapy? No doubt more granular genetic assessment might provide the answer. For example, epidermal growth factor receptor (EGFR) tyrosine kinase mutations and echinoderm microtubule-associated protein-like 4-anaplastic lymphoma kinase (EML4-ALK) gene rearrangements are more common in never-smokers and have been implicated in resistance to platinum-based chemotherapy.3,4 Because these 2 mutations have been identified, targeted therapies have become available: erlotinib, afatinib, gefitinib, and osimertinib for EGFR mutations; crizotinib, ceritinib, alectinib, and brigatinib for ALK gene rearrangements. In addition, the efficacy of immune checkpoint inhibitors such as pembrolizumab (PD-L1 inhibitor) in randomized controlled trials has differed based on the varying proportions of never-smokers enrolled.5 This is because never-smokers tend to have lower PD-L1 mutation loads, decreasing the likelihood that they will benefit from immune mediators.6
Limitations
Never-smokers were identified by self-report; thus, we depended on patients being truthful and remembering any smoking. Differences in objective measures of lung function at least partially support differentiating these 2 groups of never-smokers and ever-smokers. Nevertheless, it may be asked whether the differences observed in our study are reasonable or a statistical artifact. Indeed, might the cancer of those who have quit smoking also be different? There is no way to ethically design a large-scale randomized trial with decades-long follow-up to allay skepticism; likely, universal genetic testing of these cancers will be needed to produce the answers. However, genetic tests for these cancers were performed in only one-third of our patients, precluding incorporation of genetic findings as non-TNM variables in our analyses. Previously, it was our institutional practice to test for mutations after cancer recurrence; today, all tumors are tested for known activating mutations.
Our series of never-smokers with resected NSCLC is limited in size and does not represent all never-smokers with NSCLC, because we have captured only surgically treated patients who had earlier-stage disease. This could be why we see no increase in the proportion of cases.27 Vagaries of the staging system may have led to subtle differences in TNM staging between the groups, some of which we have identified and some of which we have not. These differences would not be balanced (we purposely matched patients on histopathological cell type and pathological stage only) and may have conspired to subtly confound our study. It is also conceivable that matching algorithms become less accurate when differential outcomes with respect to cancer characteristics are present. The random forest analyses confirmed these concerns.
Much as we would have liked to include histopathological subtypes, pathological sectioning and reporting has been sufficiently heterogeneous to preclude including these variables. This was also true of grade of differentiation.
When clinically indicated, diagnosis of cancer recurrence was confirmed histologically; however, this was not the case in every patient described as having recurrent disease. The latter patients were thoroughly assessed clinically and by radiographic findings and deemed to have recurrent disease. This may have added subtle biases to cancer recurrence findings.
Never-smokers were more likely to receive induction therapy, reflecting our institutional bias in selecting patients with higher performance status for induction therapy. Finally, our institutional reports of survival among patients undergoing resection of stage I disease seem higher than those typically reported. We have previously noted and published this observation,28 which we believe is attributable in part to stage purification based on careful and complete lymphadenectomy.
CONCLUSIONS
Thought to be a disease associated with smoking, NSCLC has a sizeable effect on the never-smoker population. Diagnosis may be delayed because of the relative rarity of the disease in this overall healthy population; however, is 10% to 15% that rare? The other reason for delayed diagnosis is that some ever-smokers, unlike never-smokers, are now offered screening, increasing the likelihood of identifying occult NSCLC. Moreover, in never-smokers, NSCLC survival and cancer recurrence are uniquely affected by cancer stage, local lymph node involvement, and size of the primary tumor compared with matched ever-smokers. Specifically, there is a heterogeneous effect of tumor size as a predictor of outcomes between never- and ever-smokers, with survival and cancer recurrence of never-smokers much more sensitive to subtle increases in size of the index tumor. Does this mean that smoking status should now be incorporated into future staging systems for NSCLC? One could imagine that as granularity and detail of cancer descriptors and patient variables progress, the bland (and somewhat arbitrary) TNM descriptors will become increasingly obsolete. New algorithms will have to be devised to more accurately predict optimal index treatment and refined indications for adjuvant therapy, with the goal of improving outcomes for a given patient as precision care evolves. It is clear that preexisting comorbidities, such as tobacco use, should be worked into future survival and prognostic algorithms.
PERSPECTIVE
Although never-smokers outlive their ever-smoking counterparts after resection of non–small cell lung cancer, in matched patients, never-smokers have better survival and equivalent cancer recurrence only for stage I disease, but worse outcomes for stage II disease. Surprisingly, advanced tumor size and increased lymph node burden have a greater adverse effect on outcomes in never-smokers compared with ever-smokers.
Acknowledgments
This study was supported in part by the Gus P. Karos Registry Fund, the Drs. Sidney and Becca Fleischer Heart and Vascular Education Chair, and the Daniel and Karen Lee Endowed Chair in Thoracic Surgery. Andrew Tang is a National Heart, Lung, and Blood Institute Clinical Research Scholar of the Cardiothoracic Surgical Trials Network (National Institutes of Health Grant U01 HL088955).
Abbreviation and Acronym
- NSCLC
non–small cell lung cancer
APPENDIX
Appendix
APPENDIX E1. DETAILED STATISTICAL METHODS
Characterization of Never-Smokers Versus Ever-Smokers
Multivariable logistic regression was performed to identify preoperative factors associated with being a never-versus ever-smoker. Variables considered in this analysis are listed in Appendix E2 and include demographics, lung function, cancer details, and comorbidities. Variable selection was based on 1000 bootstrap resampled datasets and automated stepwise data entry, with a P value for retention of .05. Then the frequency of occurrence was tabulated for single factors and closely related clusters of factors.E1 A parsimonious model was generated from variables appearing in 50% or more bootstrap models.E2
Missing values for some variables were managed before data analysis by 5-fold multiple imputation using chained equations (MICE).E3 One of the 5 imputed datasets was used for variable selection. Then, for each imputed complete dataset, we estimated regression coefficients and their variance–covariance matrix. Estimates from the 5 models were aggregated to yield final regression coefficient estimates, the variance–covariance matrix, and P values.
Balancing-Score Matching
Unlike a treatment, smoking is a natural experiment and violates the exchangeability assumption of propensity scores that are thought to lead to causal inference.E4 However, similar to comparing outcomes for a treatment, patient and cancer characteristics must be balanced. Thus, as originally noted by Rosenbaum and Rubin,E4 a balancing score can be generated, which for a binary variable is similar to a propensity score. Thus, we augmented the parsimonious model with other variables marked in Appendix E2, forming a saturated model (C-statistic = 0.75). From this, a balancing score was generated for each patient based on 20 variables (see Appendix E2). We then applied the weighting analog to pair matching developed by Li and colleagues for outcomes comparisons.E5,E6 This weighted matching method achieves close to 1:1 matching (without using any caliper width), but uses every patient in the datasets fractionally. It is a variant of inverse treatment probability weighting, but avoids the analytical issues usually encountered when the propensity score is near the probability boundary of 0 or 1. The effective population size was 168.5 patients (rounded to 169) for the matched never-smokers and 165.1 (rounded to 165) for the ever-smokers. The quality of matching is depicted in Figure E1.
Unconstrained Characterization of Survival
To better understand survival differences according to pathological stage, machine learning was employed using cancer characteristics unconstrained by classical TNM characterization and stage groupings. These characteristics included histopathological type, tumor size as a continuous variable, nodal status, tumor location, tumor laterality, and visceral pleural invasion, according to smoking status. Initially, missing values for variables were imputed using an “on-the-fly” method.E7 Then, 2 random forest for survival modelsE8 were developed using the entire NSCLC data set, with all-cause mortality as the outcome: one for the entire never-smoker cohort and one for the entire ever-smoker cohort. Computations were implemented using randomForestSRC R software with default settings using 1500 trees.E8 Each tree was analyzed using a bootstrap sample of the original data. On average, each sample contains approximately two-thirds of the patients, meaning that unselected patients were available to assess prediction error for that tree. To assess the predictive importance of each variable, only the data for those unselected patients were used. Values for each variable were randomly permuted, and prediction error before and after random permutation calculated in this manner and averaged over all trees, generating a variable importance metric and 95% confidence intervals.E9,E10 From these, we ascertained for each cancer characteristic the risk-adjusted variable importance of each variable and how it differed for never-smokers and ever-smokers.
Cancer Recurrence and Death Before Recurrence
Cancer recurrence and short- and long-term survival were assessed nonparametrically by the Kaplan–Meier method, stratified by never- versus ever-smokers in the overall cohort and by groups within matched patients. Differences were tested by the log-rank statistic before applying the matching weight. Statistical significance of differences was tested using the log-rank test before applying the matching weight and a bootstrap methodology using Cox proportional hazard regression after applying the matching weight.
APPENDIX E2. VARIABLES CONSIDERED IN THE ANALYSES
Demographics
Female,* age (y),* race (black, white,* other), weight (kg), height (cm), weight/height ratio, body surface area (m2), body mass index (kg/m2)*
Lung Function
Forced expiratory volume in 1 second (% of predicted),* lung diffusion test (% of predicted)*
Cancer Details
Histopathological type (squamous,* adenocarcinoma*), pathological stage group (0, IA, IB, IIA, IIB, IIIA, IIIB, IV),* tumor size (cm), pathological N stage, tumor location, laterality, visceral pleural invasion, grade, unifocal (vs multifocal), invasion (vascular, lymph node, lymphovascular), margin (vascular, soft tissue, bronchial)
Comorbidities
Hypertension,* steroid use,* heart failure, prior cardiothoracic surgery,* coronary artery disease,* peripheral arterial disease,* diabetes mellitus,* pharmacologically treated diabetes,* insulin-treated diabetes, non–insulin-treated diabetes (including diet),* chronic obstructive pulmonary disease, renal disease, weight loss over past 3 months (kg), preoperative creatinine (mg/dL),* preoperative hemoglobin (g/dL), cerebrovascular disease
Cancer Therapy
Preoperative chemotherapy,* preoperative radiation*
Surgical Details
Open procedure, video-assisted thoracoscopic surgery, lobectomy
Interval
Interval: 1/1/2006 to index operation*
FIGURE E1.
Quality of matching of never- and ever-smoker patient pairs. A, Mirrored histogram of distribution of balancing scores for never-smokers (bars below zero line) and ever-smokers (bars above zero line). Shaded area represents matched patient pairs. B, Standardized differences of selected variables before and after matching. Vertical dashed lines at −10% and +10% indicate boundaries of desirable matching. Black triangles represent standardized differences before propensity score–based matching, with positive values indicating a variable is more common in the never-smoker group and negative values indicating variables more common in the ever-smoker group. Green squares represent characteristics after matching. FEV1, Forced expiratory volume in 1 second; CT, cardiothoracic; CAD, coronary artery disease.
FIGURE E2.
Prevalence of never-smokers in the resected non–smallcell lung cancer (NSCLC) cohort by calendar year. (Left) Proportion of never-smokers in the population of resected NSCLCs. The solid line is a smoothing spline curve, and dots represent the percentage of never-smokers each year. (Right) Stacked histogram of frequency of ever-smokers (red) and never-smokers (blue). Note: Numbers for 2016 go to July 2016 (half-year).
FIGURE E3.
Risk-adjusted partial dependency plots of 1-year survival and cancer recurrence after lung resection for non–small cell lung cancer. Never-smokers are represented by blue lines; ever-smokers, by red lines. Parallel lines represent similar survival trajectories for never- and ever-smokers. Diverging or crossing lines represent differences in survival implications for never- and ever-smokers, such as for histopathological type, presence of metastatic disease, crossing lines for tumor size, vascular margin and invasion, and lymphovascular invasion. Histology: 1 = adenocarcinoma, 2 = squamous cell cancer; focality: 0 = unifocal, 1 = multifocal; laterality: 0 = right, 1 = left; location: 1 = right upper, 2 = right middle, 3 = right lower, 4 = left upper, 5 = left lower, 6 = right central, 7 = left central. A, Survival. B, Freedom from cancer recurrence. VPI, Visceral pleural invasion.
TABLE E1.
Surgical procedures in ever-smokers and never-smokers before and after matching
| Before matching | After matching | |||||
|---|---|---|---|---|---|---|
|
|
|
|||||
| Procedure* | Never-smokers (n = 172) No. (%) | Ever-smokers (n = 1376) No. (%) | Standardized difference, % | Never-smokers (n = 169) No. (%) | Ever-smokers (n = 165) No. (%) | Standardized difference, % |
|
| ||||||
| Wedge resection | 8 (4.7) | 91 (6.6) | −8.5 | 7.5 (4.4) | 9.4 (5.7) | −5.8 |
| Thoracoscopic wedge resection | 14(8.1) | 152 (11) | −10 | 14 (8.3) | 16 (9.6) | −4.7 |
| Segmentectomy | 5 (2.9) | 50 (3.6) | −4.1 | 4.9 (2.9) | 3.8 (2.3) | 3.5 |
| Thoracoscopic segmentectomy | 6 (3.5) | 28 (2.0) | 8.9 | 6 (3.6) | 3.3 (2.0) | 9.6 |
| Lobectomy | 94 (55) | 726 (53) | 3.8 | 92 (54) | 87 (53) | 3.1 |
| Thoracoscopic lobectomy | 54 (31) | 354 (26) | 13 | 52 (31) | 52 (31) | −0.61 |
| Pneumonectomy | 12 (7.0) | 115 (8.4) | −5.2 | 12 (7.0) | 9.4 (5.7) | 5.6 |
Procedures are not mutually exclusive.
TABLE E2.
Perioperative outcomes in matched ever-smokers versus never-smokers
| Outcome | Never-smokers (n = 169) | Ever-smokers (n = 165) | P value† | ||
|---|---|---|---|---|---|
|
|
|
||||
| n* | No. (%) | n* | No. (%) | ||
|
| |||||
| Hospital death | 169 | 1 (0.59) | 165 | 1 (0.62) | >.9 |
| Atrial arrhythmia | 169 | 15 (8.8) | 165 | 19 (12) | .3 |
| Ventricular arrhythmia | 169 | 1 (0.59) | 165 | 0 (0) | — |
| Myocardial infarction | 169 | 0 (0) | 165 | 0.05 (0.03) | — |
| Deep vein thrombosis | 169 | 4 (2.4) | 165 | 1.3 (0.78) | .17 |
| Pulmonary embolus | 169 | 2 (1.2) | 165 | 0.79 (0.48) | — |
| Atelectasis | 169 | 1 (0.59) | 165 | 1.7 (1.1) | .5 |
| Pneumonia | 169 | 2 (1.2) | 165 | 4 (2.4) | .2 |
| Pneumothorax | 161 | 2 (1.2) | 155 | 0.78 (0.50) | — |
| Ventilator>48 h | 169 | 1 (0.59) | 165 | 0.41 (0.25) | — |
| Reintubation | 162 | 2 (1.2) | 155 | 3 (2.0) | .5 |
| Acute respiratory distress syndrome | 169 | 0 (0) | 165 | 0.79 (0.48) | — |
| Chest tube air leak | 169 | 6 (3.6) | 165 | 5 (3.0) | .7 |
| Bronchopleural fistula | 169 | 0 (0) | 165 | 0.17 (0.10) | — |
| Empyema | 169 | 0 (0) | 165 | 0.35 (0.21) | — |
| Chylothorax surgery | 143 | 0 (0) | 139 | 0.01 (0) | — |
| Tracheostomy | 169 | 3 (1.8) | 165 | 3 (1.8) | >.9 |
| Central nervous system event | 169 | 1 (0.59) | 165 | 0.37 (0.22) | — |
| Paresis or paralysis | 169 | 0 (0) | 165 | 1.3 (0.8) | — |
| Gastrointestinal ileus | 169 | 1 (0.59) | 165 | 0.69 (0.42) | .8 |
| Other G.I. complication | 169 | 4.5 (2.7) | 165 | 1.6 (0.94) | .16 |
| Return to ICU | 161 | 3 (1.9) | 156 | 7.1 (4.5) | .06 |
| Sepsis | 169 | 0 (0) | 165 | 0.28 (0.17) | — |
| Renal failure | 143 | 1 (0.70) | 139 | 0.18 (0.13) | — |
| Urinary retention | 150 | 2 (1.3) | 146 | 1.9 (1.3) | >.9 |
| Urinary tract infection | 169 | 3 (1.8) | 165 | 2.2 (1.3) | .7 |
| Discharged with Foley catheter | 150 | 2 (1.3) | 146 | 0.45 (0.31) | — |
| Other infectious complications | 161 | 0 (0) | 155 | 0.89 (0.57) | — |
| Wound infection | 143 | 1 (0.7) | 139 | 0.06 (0.04) | — |
| Return to operating room | 161 | 4.5 (2.8) | 155 | 4.4 (2.8) | .9 |
| Reoperation for bleeding | 135 | 0 (0) | 130 | 0.73 (0.56) | — |
| Any of above complications | 169 | 45 (27) | 165 | 45 (28) | .8 |
| Postoperative LOS, d‡ | 169 | 3/4/6 | 165 | 3/4/7 | .4 |
GI, Gastrointestinal; ICU, intensivecare unit; LOS, length of stay.
Patients with data available.
Outcomes with frequency too low for weighted estimation of P value.
15th/50th/85th percentiles.
TABLE E3.
Characteristics of pathological stage I non–small cell lung cancer in never-smokers versus ever-smokers
| Before matching | After matching | |||||||||
|---|---|---|---|---|---|---|---|---|---|---|
|
|
|
|||||||||
| Characteristic | Never-smokers (n = 92) | Ever-smokers (n = 800) | Standardized difference, % | Never-smokers (n = 90) | Ever-smokers (n = 90) | Standardized difference, % | ||||
|
|
|
|
|
|||||||
| n* | No. (%) | n* | No. (%) | n* | No. (%) | n* | No. (%) | |||
|
| ||||||||||
| Tumor location | 92 | 800 | 90 | 90 | ||||||
| Right upper | 31 (34) | 302 (38) | −8.4 | 30 (34) | 32 (36) | −3.4 | ||||
| Right middle | 2 (2.2) | 45 (5.6) | −18 | 2 (2.2) | 6.5 (7.2) | −23 | ||||
| Right lower | 25 (27) | 156 (19) | 18 | 25 (28) | 22 (24) | 7.7 | ||||
| Left upper | 20 (22) | 203 (26) | −8.6 | 18 (21) | 22 (25) | −10 | ||||
| Left lower | 14 (15) | 94 (12) | 10 | 14 (15) | 7.9 (8.8) | 20 | ||||
| Right central | 0(0) | 2 (0.25) | −7.1 | 0(0) | 0.03 (0.03) | −2.5 | ||||
| Left central | 0(0) | 1 (0.13) | −5.0 | 0(0) | 0.03 (0.03) | −2.5 | ||||
| Focality | 91 | 798 | 6.6 | 89 | 90 | −2.9 | ||||
| Unifocal | 84 (92) | 750 (94) | 83 (93) | 83 (92) | ||||||
| Multifocal | 7 (7.7) | 48 (6.0) | 6.1 (6.9) | 6.8 (7.6) | ||||||
| Histopathological type | 92 | 797 | 90 | 90 | ||||||
| Adenocarcinoma | 85 (92) | 534 (67) | 66 | 83 (92) | 82 (92) | 2.7 | ||||
| Large cell | 0(0) | 33 (4.1) | −29 | 0(0) | 2.4 (2.7) | −23 | ||||
| Not otherwise specified | 0(0) | 9(1.1) | −15 | 0(0) | 0.78 (0.87) | −13 | ||||
| Other | 4 (4.3) | 15 (1.9) | 14 | 3.9 (4.4) | 0.65 (0.73) | 23 | ||||
| Squamous | 3 (3.3) | 206 (26) | −68 | 3 (3.4) | 3.7 (4.2) | −4.3 | ||||
| Invasion and involved margins | ||||||||||
| Visceral pleural invasion | 90 | 16 (18) | 796 | 168 (21) | −8.4 | 88 | 16 (18) | 90 | 18 (20) | −5.4 |
| Lymphovascular invasion | 69 | 15 (22) | 600 | 151 (25) | −8.1 | 67 | 14 (20) | 70 | 17 (24) | −9.1 |
| Soft tissue margin involved | 75 | 2 (2.7) | 643 | 14 (2.2) | 3.2 | 73 | 2 (2.7) | 71 | 2 (2.8) | −0.61 |
| Bronchial margin involved | 83 | 3 (3.6) | 681 | 2 (0.29) | 24 | 81 | 3 (3.7) | 78 | 0.12 (0.15) | 26 |
| Vascular margin involved | 86 | 1 (1.2) | 678 | 1 (0.15) | 13 | 84 | 1 (1.2) | 78 | 0.02 (0.02) | 15 |
| Parenchymal margin involved | 54 | 0(0) | 540 | 5 (0.93) | −14 | 52 | 0(0) | 60 | 0.26 (0.43) | −9.2 |
| Pathological T category | 92 | 800 | 90 | 90 | ||||||
| 1a | 4 (4.4) | 95 (12) | −28 | 4 (4.5) | 11 (12) | −27 | ||||
| 1b | 40 (43) | 317 (40) | 7.8 | 39 (44) | 36 (41) | 6.5 | ||||
| 1c | 29 (32) | 255 (32) | −0.76 | 28 (31) | 28 (31) | −1.4 | ||||
| 2a | 19 (21) | 133 (17) | 10 | 19 (21) | 14 (16) | 13 | ||||
| Pathological N category | 92 | 800 | 90 | 90 | ||||||
| 0 | 92 (100) | 800 (100) | — | 90 (100) | 90 (100) | — | ||||
| Pathological M category | 92 | 92 (100) | 800 | 800 (100) | — | 90 | 90 (100) | 90 | 90 (100) | — |
| Pathological stage group | 92 | 800 | 17 | 90 | 90 | 19 | ||||
| IA1 | 4 (4.4) | 95 (12) | 4 (4.5) | 11 (12) | ||||||
| IA2 | 40 (43) | 317 (40) | 39 (43) | 36 (41) | ||||||
| IA3 | 29 (32) | 255 (32) | 28 (31) | 28 (31) | ||||||
| IB | 19 (21) | 133 (17) | 19 (21) | 14 (16) | ||||||
Patients with data available.
TABLE E4.
Characteristics of pathological stage II non–small cell lung cancer in never-smokers versus ever-smokers
| Before matching | After matching | |||||||||
|---|---|---|---|---|---|---|---|---|---|---|
|
|
|
|||||||||
| Characteristic | Never-smokers (n = 47) | Ever-smokers (n = 315) | Standardized difference, % | Never-smokers (n = 47) | Ever-smokers (n = 44) | Standardized difference, % | ||||
|
|
|
|
|
|||||||
| n* | No. (%) | n* | No. (%) | n* | No. (%) | n* | No. (%) | |||
|
| ||||||||||
| Tumor location | 47 | 315 | 47 | 44 | ||||||
| Right upper | 14 (30) | 103 (32) | −6.3 | 14 (30) | 14 (31) | −3.4 | ||||
| Right middle | 2 (4.3) | 14 (4.4) | −0.92 | 2 (4.3) | 2.9 (6.5) | −9.6 | ||||
| Right lower | 10 (21) | 45 (14) | 18 | 10 (21) | 7.5 (17) | 11 | ||||
| Left upper | 14 (30) | 86 (27) | 5.5 | 14 (30) | 12 (27) | 7.0 | ||||
| Left lower | 5(11) | 50 (16) | −15 | 4.8 (10) | 7.7 (17) | −20 | ||||
| Right central | 1 (2.1) | 7 (2.2) | −0.64 | 1 (2.2) | 0.23 (0.53) | 14 | ||||
| Left central | 1 (2.1) | 13 (4.1) | −11 | 1 (2.2) | 0.53 (1.2) | 7.4 | ||||
| Focality | 46 | 314 | −28 | 46 | 44 | −25 | ||||
| Unifocal | 45 (98) | 288 (92) | 45 (98) | 41 (92) | ||||||
| Multifocal | 1 (2.2) | 26 (8.3) | 1 (2.2) | 3.3 (7.5) | ||||||
| Histopathological type | 47 | 315 | 47 | 44 | ||||||
| Adenocarcinoma | 37 (79) | 158 (50) | 62 | 37 (79) | 37 (84) | −12 | ||||
| Large cell | 1 (2.1) | 15 (4.8) | −14 | 1 (2.2) | 1.6 (3.7) | −9.2 | ||||
| Not otherwise specified | 0(0) | 3 (0.95) | −14 | 0(0) | 0.11 (0.25) | −7.0 | ||||
| Other | 4 (8.5) | 9 (2.9) | 24 | 3.7 (8.0) | 1.2 (2.8) | 23 | ||||
| Squamous | 5(11) | 130 (41) | −74 | 5(11) | 4.2 (9.5) | 4.1 | ||||
| Invasion and involved margins | ||||||||||
| Visceral pleural invasion | 46 | 22 (48) | 309 | 94 (30) | 36 | 46 | 22 (48) | 43 | 12 (28) | 40 |
| Lymphovascular invasion | 36 | 22 (61) | 249 | 135 (54) | 14 | 36 | 22 (61) | 35 | 21 (60) | 1.2 |
| Soft tissue margin involved | 27 | 2 (7.4) | 234 | 7 (3.0) | 20 | 27 | 2 (7.5) | 32 | 0.45 (1.4) | 29 |
| Bronchial margin involved | 45 | 3 (6.7) | 305 | 5 (1.6) | 25 | 45 | 2.8 (6.3) | 43 | 0.3 (0.69) | 31 |
| Vascular margin involved | 44 | 1 (2.3) | 302 | 8 (2.7) | −2.4 | 44 | 1 (2.3) | 43 | 0.48 (1.1) | 9.1 |
| Parenchymal margin involved | 29 | 0(0) | 203 | 0(0) | — | 29 | 0(0) | 29 | 0(0) | — |
| Pathological T category | 47 | 315 | 47 | 44 | ||||||
| 1a | 1 (2.1) | 6(1.9) | 1.6 | 1 (2.2) | 0.37 (0.84) | 11 | ||||
| 1b | 4 (8.5) | 31 (9.8) | −4.6 | 4 (8.6) | 4.9 (11) | −8.1 | ||||
| 1c | 10 (21) | 56 (18) | 8.8 | 10 (21) | 9.1 (21) | 2.1 | ||||
| 2a | 11(23) | 50 (16) | 19 | 11 (24) | 6.4 (15) | 23 | ||||
| 2b | 11(23) | 96 (30) | −16 | 11 (24) | 12 (28) | −10 | ||||
| 3 | 10 (21) | 76 (24) | −6.8 | 9.6 (21) | 11(25) | −9.9 | ||||
| Pathological N category | 47 | 315 | 47 | 44 | ||||||
| 0 | 16 (34) | 139 (44) | −21 | 16 (33) | 19 (43) | −20 | ||||
| 1 | 31 (66) | 176 (56) | 21 | 31 (67) | 25 (57) | 20 | ||||
| Pathological M category | 47 | 47 (100) | 315 | 315 (100) | — | 90 | 90 (100) | 90 | 90 (100) | — |
| Pathological stage group | 47 | 315 | 20 | 47 | 44 | 16 | ||||
| IIA | 6(13) | 63 (20) | 6(13) | 8.2 (19) | ||||||
| IIB | 41(87) | 252 (80) | 41 (87) | 36 (81) | ||||||
Patients with data available.
Footnotes
CENTRAL MESSAGE
Survival and cancer recurrence differences, particularly related to tumor size, between never-smokers and ever-smokers with non–small cell lung cancer suggest unique tumor or host behaviors.
The Journal policy requires editors and reviewers to disclose conflicts of interest and to decline handling or reviewing manuscripts for which they may have a conflict of interest. The editors and reviewers of this article have no conflicts of interest.
Conflict of Interest Statement
The authors reported no conflicts of interest.
References
- 1.Yano T, Haro A, Shikada Y, Maruyama R, Maehara Y. Non–small-cell lung cancer in never smokers as a representative “non-smoking-associated lung cancer”: epidemiology and clinical features. Int J Clin Oncol. 2011;16:287–93. [DOI] [PubMed] [Google Scholar]
- 2.Noronha V, Dikshit R, Raut N, Joshi A, Pramesh CS, George K, et al. Epidemiology of lung cancer in India: focus on the differences between non-smokers and smokers: a single-centre experience. Indian J Cancer. 2012;49:74–81. [DOI] [PubMed] [Google Scholar]
- 3.Subramanian J, Govindan R. Molecular profile of lung cancer in never smokers. EJC Suppl. 2013;11:248–53. [DOI] [PMC free article] [PubMed] [Google Scholar]
- 4.Pao W, Miller V, Zakowski M, Doherty J, Politi K, Sarkaria I, et al. EGF receptor gene mutations are common in lung cancers from “never smokers” and are associated with sensitivity of tumors to gefitinib and erlotinib. Proc Natl Acad Sci U S A. 2004;101:13306–11. [DOI] [PMC free article] [PubMed] [Google Scholar]
- 5.Gandhi L, Rodríguez-Abreu D, Gadgeel S, Esteban E, Felip E, De Angelis F, et al. Pembrolizumab plus chemotherapy in metastatic non–small-cell lung cancer. N Engl J Med. 2018;378:2078–92. [DOI] [PubMed] [Google Scholar]
- 6.Calles A, Liao X, Sholl LM, Rodig SJ, Freeman GJ, Butaney M, et al. Expression of PD-1 and its ligands, PD-L1 and PD-L2, in smokers and never smokers with KRAS-mutant lung cancer. J Thorac Oncol. 2015;10:1726–35. [DOI] [PubMed] [Google Scholar]
- 7.Dutu T, Michiels S, Fouret P, Penault-Llorca F, Validire P, Benhamou S, et al. Differential expression of biomarkers in lung adenocarcinoma: a comparative study between smokers and never-smokers. Ann Oncol. 2005;16:1906–14. [DOI] [PubMed] [Google Scholar]
- 8.Staaf J, Jönsson G, Jönsson M, Karlsson A, Isaksson S, Salomonsson A, et al. Relation between smoking history and gene expression profiles in lung adenocarcinomas. BMC Med Genomics. 2012;5:22. [DOI] [PMC free article] [PubMed] [Google Scholar]
- 9.Szymanowska-Narloch A, Jassem E, Skrzypski M, Muley T, Meister M, Dienemann H, et al. Molecular profiles of non–small cell lung cancers in cigarette smoking and never–smoking patients. Adv Med Sci. 2013;58:196–206. [DOI] [PubMed] [Google Scholar]
- 10.Hanagiri T, Sugio K, Mizukami M, Ichiki Y, Sugaya M, Yasuda M, et al. Significance of smoking as a postoperative prognostic factor in patients with non–small cell lung cancer. J Thorac Oncol. 2008;3:1127–32. [DOI] [PubMed] [Google Scholar]
- 11.Kawaguchi T, Takada M, Kubo A, Matsumura A, Fukai S, Tamura A, et al. Performance status and smoking status are independent favorable prognostic factors for survival in non–small cell lung cancer: a comprehensive analysis of 26,957 patients with NSCLC. J Thorac Oncol. 2010;5:620–30. [DOI] [PubMed] [Google Scholar]
- 12.Sawabata N, Miyoshi S, Matsumura A, Ohta M, Maeda H, Sueki H, et al. Prognosis of smokers following resection of pathological stage I non–small-cell lung carcinoma. Gen Thorac Cardiovasc Surg. 2007;55:420–4. [DOI] [PubMed] [Google Scholar]
- 13.Bryant A, Cerfolio RJ. Differences in epidemiology, histology, and survival between cigarette smokers and never-smokers who develop non–small cell lung cancer. Chest. 2007;132:185–92. [DOI] [PubMed] [Google Scholar]
- 14.Bryant AS, Cerfolio RJ. The clinical stage of non–small cell lung cancer as assessed by means of fluorodeoxyglucose-positron emission tomographic/computed tomographic scanning is less accurate in cigarette smokers. J Thorac Cardiovasc Surg. 2006;132:1363–8. [DOI] [PubMed] [Google Scholar]
- 15.Cerfolio RJ, Bryant AS, Scott E, Sharma M, Robert F, Spencer SA, et al. Women with pathologic stage I, II, and III non–small cell lung cancer have better survival than men. Chest. 2006;130:1796–802. [DOI] [PubMed] [Google Scholar]
- 16.Subramanian J, Velcheti V, Gao F, Govindan R. Presentation and stage-specific outcomes of lifelong never-smokers with non–small cell lung cancer (NSCLC). J Thorac Oncol. 2007;2:827–30. [DOI] [PubMed] [Google Scholar]
- 17.Stiles BM, Rahouma M, Kamel-Hussein M, Nasar A, Nguyen AB, Harrison S, et al. Never smokers with resected lung cancer: different demographics, similar survival. Eur J Cardiothorac Surg. 2018;53:842–8. [DOI] [PubMed] [Google Scholar]
- 18.Rami-Porta R, Asamura H, Travis WD, Rusch VW. Chapter 36: lung. In: Amin MB, Edge S, Greene F, Byrd DR, Brookland RK, Washington MK, et al. , eds. AJCC Cancer Staging Manual. 8th ed. New York: Springer International; 2017:431–56. [Google Scholar]
- 19.Austin PC, Mamdani MM. A comparison of propensity score methods: a case-study estimating the effectiveness of post-AMI statin use. Stat Med. 2006;25: 2084–106. [DOI] [PubMed] [Google Scholar]
- 20.Rosenbaum PR, Rubin DB. The central role of the propensity score in observational studies for causal effects. Biometrika. 1983;70:41–55. [Google Scholar]
- 21.Li L, Greene T. A weighting analogue to pair matching in propensity score analysis. Int J Biostat. 2013;9:215–34. [DOI] [PubMed] [Google Scholar]
- 22.Mao H, Li L, Greene T. Propensity score weighting analysis and treatment effect discovery. Stat Methods Med Res. 2019;28:2439–54. [DOI] [PubMed] [Google Scholar]
- 23.Efron B, Tibshirani RJ. An Introduction to the Bootstrap. New York: Chapman and Hall/CRC; 1994. [Google Scholar]
- 24.Blackstone EH, Naftel DC, Turner ME Jr. The decomposition of time-varying hazard into phases, each incorporating a separate stream of concomitant information. J Am Stat Assoc. 1986;81:615–24. [Google Scholar]
- 25.Ishwaran H, Kogalar UB. RandomForestSRC: Fast unified random forests for survival, regression, and classification (RF-SRC). R package version 2.1.0; 2016. Available at: http://cran.r-project.org. [Google Scholar]
- 26.Rivera GA, Wakelee H. Lung cancer in never smokers. Adv Exp Med Biol. 2016; 893:43–57. [DOI] [PubMed] [Google Scholar]
- 27.Wakelee HA, Chang ET, Gomez SL, Keegan TH, Feskanich D, Clarke CA, et al. Lung cancer incidence in never smokers. J Clin Oncol. 2007;25:472–8. [DOI] [PMC free article] [PubMed] [Google Scholar]
- 28.Murthy SC, Reznik SI, Ogwudu UC, Farver CF, Arrossi A, Batizy LH, et al. Winning the battle, losing the war: the noncurative “curative” resection for stage I adenocarcinoma of the lung. Ann Thorac Surg. 2010;90: 1067–74. [DOI] [PubMed] [Google Scholar]
E-References
- E1.Rajeswaran J, Blackstone EH Identifying risk factors: challenges of separating signal from noise. J Thorac Cardiovasc Surg. 2017;153:1136–8. [DOI] [PubMed] [Google Scholar]
- E2.Breiman L. Bagging predictors. Mach Learn. 1996;24:123–40. [Google Scholar]
- E3.Rubin DB Multiple Imputation for Non-Response in Surveys. New York: Wiley; 1987. [Google Scholar]
- E4.Rosenbaum PR, Rubin DB The central role of the propensity score in observational studies for causal effects. Biometrika. 1983;70:41–55. [Google Scholar]
- E5.Li L, Greene T. A weighting analogue to pair matching in propensity score analysis. Int J Biostat. 2013;9:215–34. [DOI] [PubMed] [Google Scholar]
- E6.Mao H, Li L, Greene T. Propensity score weighting analysis and treatment effect discovery. Stat Methods Med Res. 2019;8:2439–54. [DOI] [PubMed] [Google Scholar]
- E7.Tang F, Ishwaran H. Random forest missing data algorithms. Stat Anal Data Min. 2017;10:363–77. [DOI] [PMC free article] [PubMed] [Google Scholar]
- E8.Ishwaran H, Kogalar UB RandomForestSRC: Fast unified random forests for survival, regression, and classification (RF-SRC). R package version 2.1.0; 2016. Available at: http://cran.r-project.org. [Google Scholar]
- E9.Ishwaran H. Variable importance in binary regression trees and forests. Electron J Stat. 2007;1:519–37. [Google Scholar]
- E10.Ishwaran H, Lu M. Standard errors and confidence intervals for variable importance in random forest regression, classification, and survival. Stat Med. 2019; 38:558–82. [DOI] [PMC free article] [PubMed] [Google Scholar]


