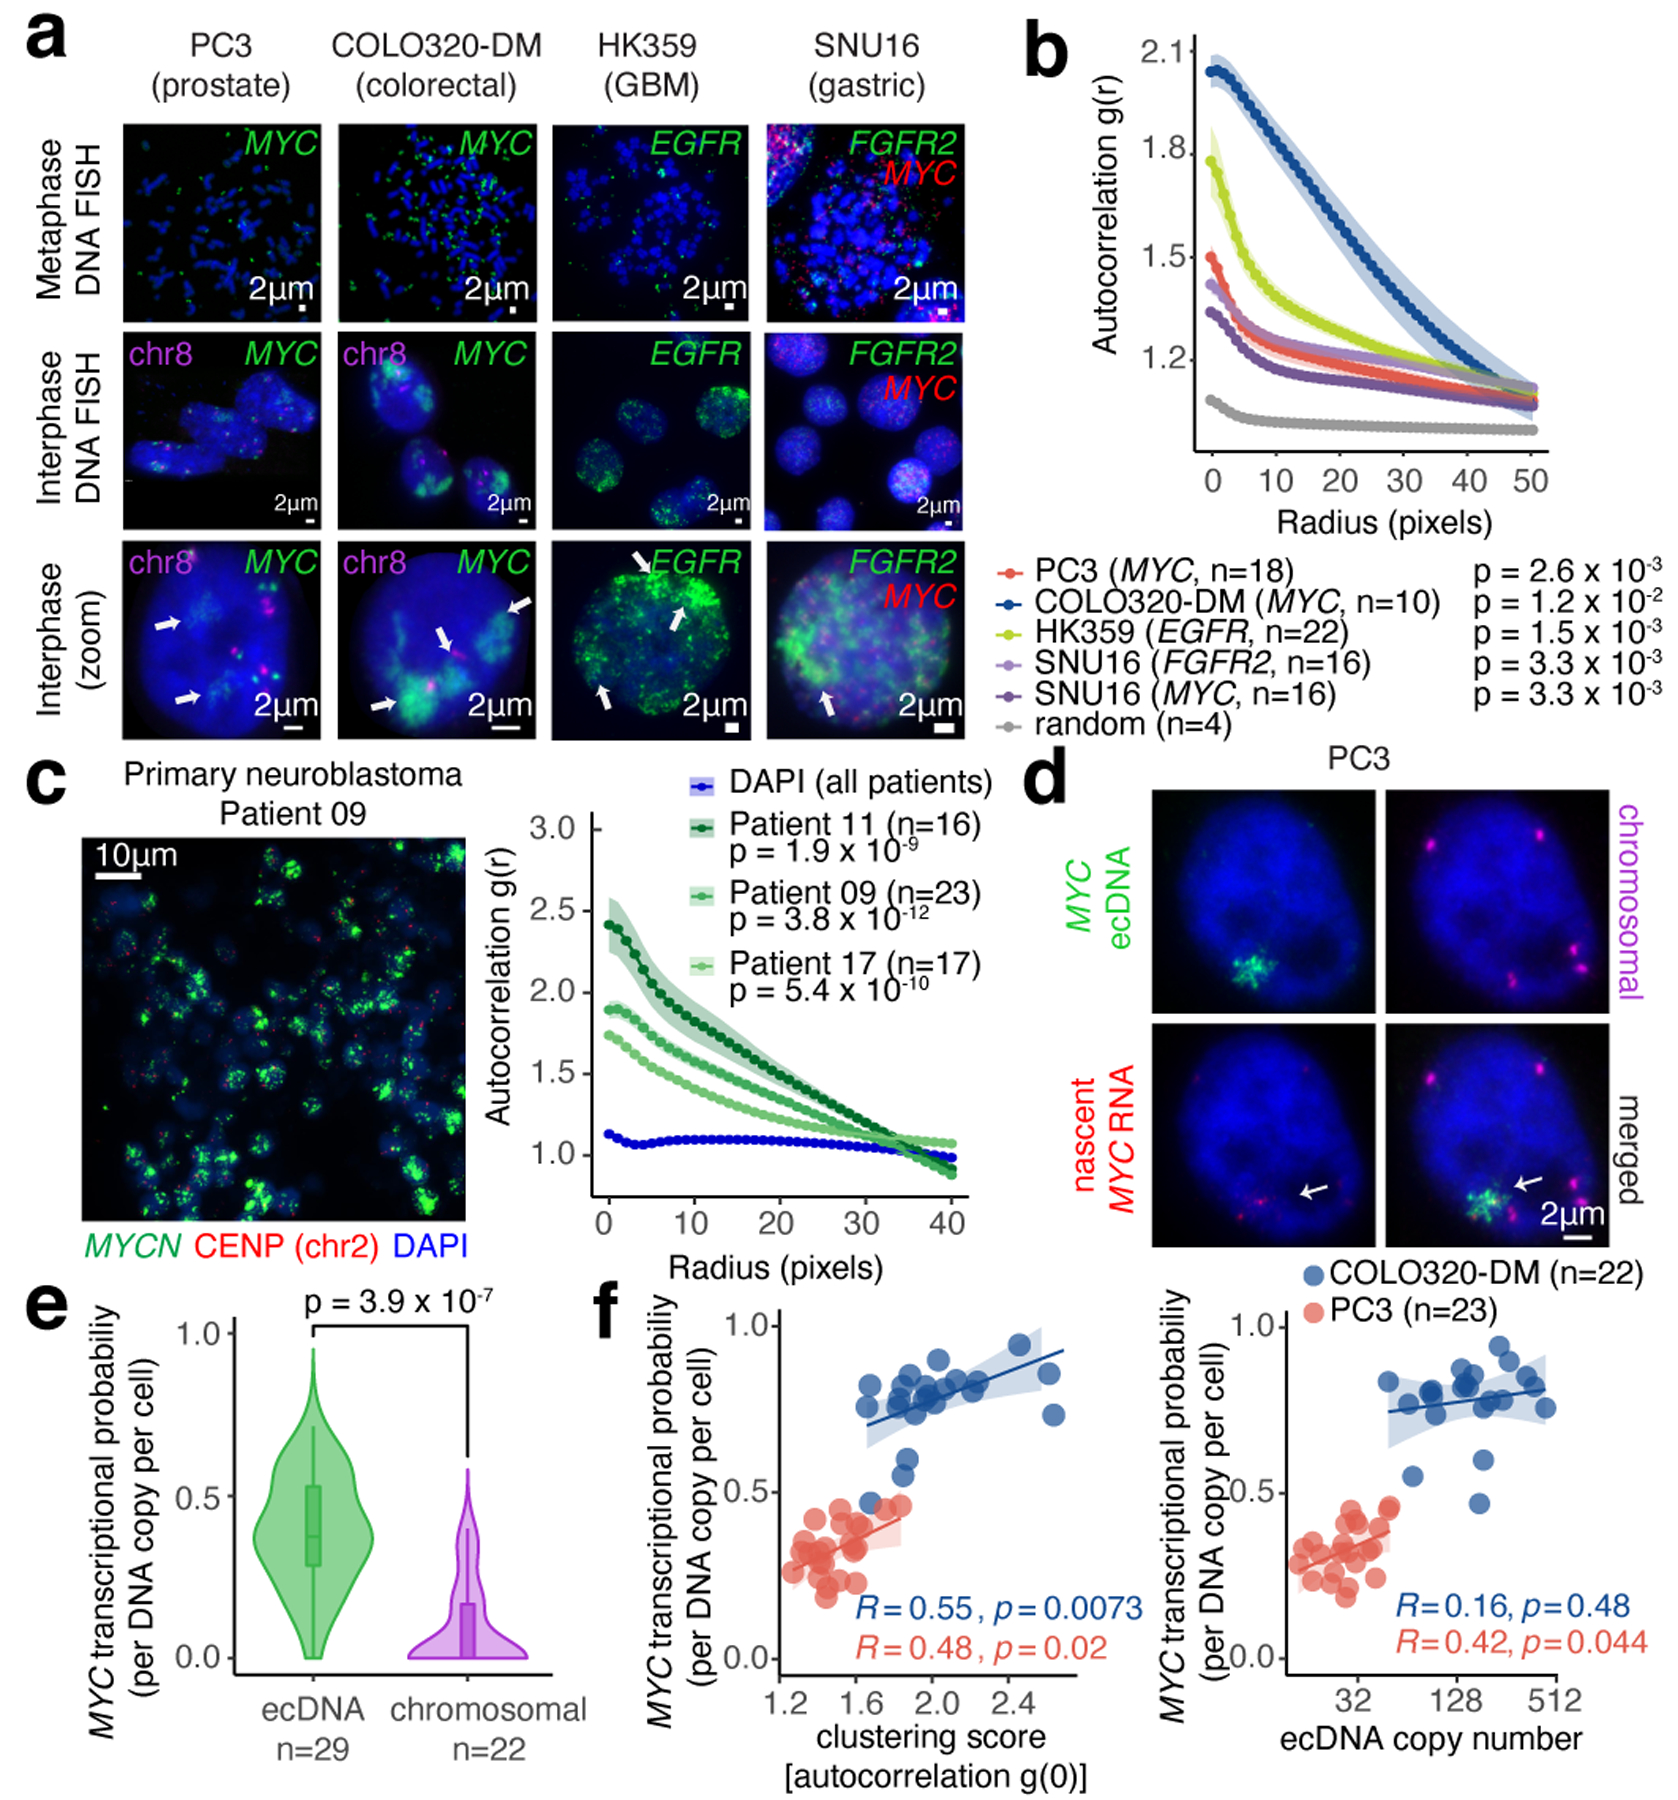
Figure 1. ecDNA imaging correlates ecDNA clustering with transcriptional bursting.

(a) Representative FISH images of interphase ecDNA clustering. A chromosomal control was included for PC3 and COLO320-DM. (b) Interphase ecDNA clustering by autocorrelation g(r) (Methods). Data are mean ± SEM. P-values determined by two-sided Wilcoxon test at r=0 compared to random distribution. (c) Representative FISH image showing ecDNA clustering in a primary neuroblastoma tumor (MYCN ecDNA and chromosomal control, left). ecDNA clustering in three primary tumors using autocorrelation (right). Data are mean ± SEM. P-values determined by two-sided Wilcoxon test at r=0 compared to DAPI. (d) Representative image from combined DNA FISH for ecDNA, chromosomal control, and nascent RNA FISH in PC3 cells. (e) MYC transcription probability measured by joint DNA/RNA FISH (RNA normalized to DNA copy number; box center line, median; box limits, upper and lower quartiles; box whiskers, 1.5x interquartile range). P-values determined by two-sided Wilcoxon test. (f) Correlation between MYC transcription probability and ecDNA copy number or clustering (joint DNA/RNA FISH; clustering scores are autocorrelation at r = 0; Pearson’s R, two-sided test).
