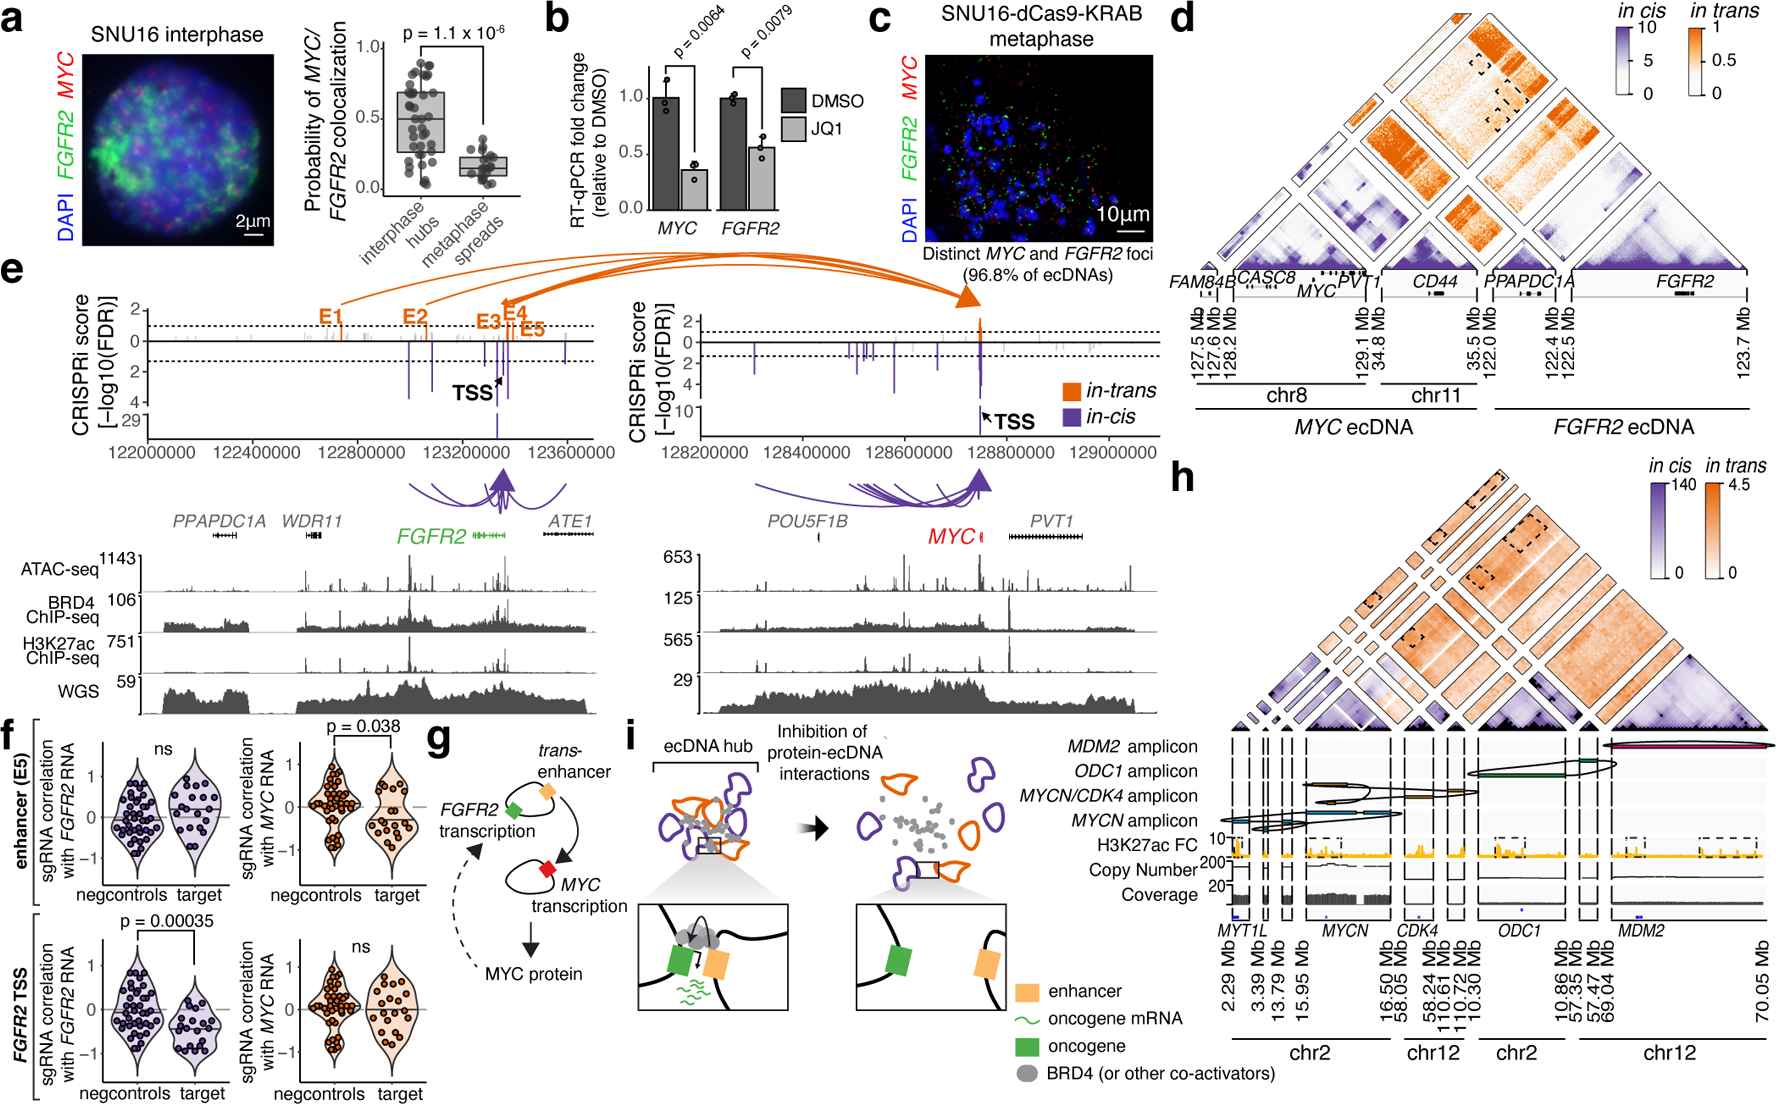
Figure 4. ecDNA hubs mediate intermolecular enhancer-gene interactions.

(a) Representative DNA FISH image showing clustering of MYC and FGFR2 ecDNAs in interphase SNU16 (left). MYC and FGFR2 colocalization in SNU16 (right; box center line, median; box limits, upper and lower quartiles; box whiskers, 1.5x interquartile range). P-value determined by two-sided Wilcoxon test. (b) Oncogene RNA measured by RT-qPCR in SNU16 treated with DMSO or 500 nM JQ1 for 6 hours. Data are mean ± SD between 3 biological replicates. P-value determined by two-sided student’s t-test. (c) Representative metaphase FISH image in SNU16-dCas9-KRAB. Quantification summarizes 30 cells from one experiment. (d) H3K27ac HiChIP contact matrix (10 kb resolution, KR-normalized read counts) in SNU16-dCas9-KRAB showing cis- and trans- interactions. (e) Top: significance of enhancer CRISPRi effects on oncogene repression (Benjamini-Hochberg adjusted; n=40 negative control sgRNAs, n=20 target sgRNAs; Methods, Extended Data Figure 8). Dashed lines mark FDR < 0.05 for cis-interactions and FDR < 0.1 for trans-interactions; significant enhancers are colored and connected to target genes by loops (E1, FDR = 0.048; E2, FDR = 0.052; E3, FDR = 0.048; E4, FDR = 0.052; E5, FDR = 0.052). All datasets contain two independent experiments except the in-trans dataset for the MYC-targeting sgRNA pool, which contains one independent experiment. Bottom: ATAC-seq, BRD4 ChIP-seq, H3K27ac ChIP-seq, and WGS tracks. (f) Correlations between individual sgRNAs and oncogene expression (Methods). P-values determined by lower-tailed t-test compared to negative controls. Each dot represents an independent sgRNA (n=40 negative control sgRNAs, n=20 target sgRNAs). (g) Cross-regulation between MYC and FGFR2 elements in ecDNA hubs. (h) Top to bottom: Hi-C contact map (KR-normalized read counts in 25kb bins) showing cis- and trans- contacts, reconstructed amplicons, H3K27ac ChIP-seq (mean fold-change over input), copy number and WGS in TR14. (i) ecDNA hub model for intermolecular cooperation.
