Abstract
The current study diligently analyzes the physical characteristics of halide perovskites AGeF3 (A = K, Rb) under hydrostatic pressure using density functional theory. The goal of this research is to reduce the electronic band gap of AGeF3 (A = K, Rb) under pressure in order to improve the optical characteristics and assess the compounds’ suitability for optoelectronic applications. The structural parameters exhibit a high degree of precision, which correlates well with previously published work. In addition, the bond length and lattice parameters decrease significantly leading to a stronger interaction between atoms. The bonding between K(Rb)–F and Ge–F reveal ionic and covalent nature, respectively, and the bonds become stronger under pressure. The application of hydrostatic pressure demonstrates remarkable changes in the optical absorption and conductivity. The band gap becomes lower with the increment of pressure, resulting in better conductivity. The optical functions also predict that the studied materials might be used in a variety of optoelectronic devices operating in the visible and ultraviolet spectrum. Interestingly, the compounds become more suitable to be used in optoelectronic applications under pressure. Moreover, the external pressure has profound dominance on the mechanical behavior of the titled perovskites, which make them more ductile and anisotropic.
Subject terms: Condensed-matter physics, Theory and computation
Introduction
Cubic perovskites have obtained substantial preference from researchers and scientists over the last few years. The versatile applicability of these perovskites in multiple sectors, e.g., semiconductors, sensors, superconductivity, photovoltaic cells, optoelectronic devices, and LEDs (light-emitting devices)1–3 puts them in the center of attention. As a result, the researchers conducted both experimental and theoretical studies4–7 on the physical behavior of perovskite materials to create new possibilities for their applications in various optoelectronic fields. Interestingly, the improvement of perovskite solar cells (PSCs) has been accelerated, resulting in power conversion efficiency (PCE) of 22.1%8. Till now, the best PCE of 25.2% is recorded for Pb-based perovskite solar cells9 but have less life span caused by humidity, moisture, temperature, and UV light10. On the other hand, the lead-free tin halide perovskite incorporated with ethylammonium iodide exhibited the PCE of ~ 13%11. At initial stages, metallic Pb2+-based organic PSCs i.e., CH3NH3PbI3 (or MAPbX3) were developed12–14. But the toxicity of these organic compounds created major disadvantages. Pb is a recognized toxin, creating a number of obstacles15. In addition, organic MA+ cations cause serious environmental drawbacks, making the manufacturing process extremely risky and harmful16. In order to nullify the toxicity, non-toxic cations, like Ge2+ and Sn2+ have replaced Pb2+ cation, and/or K+, Rb+, and Cs+ cations have used to replace the organic counterpart15,17–19. Therefore, a new formation of ABX3 has appeared in which A, B, and C denote the monovalent cation, divalent cation, and halogen anion, respectively. Inorganic perovskites based on Ge have emerged as a possible alternative of Pb, because they possess superior optical absorption and conductivity as compared to Pb-based perovskites20. At ambient temperature, Ge-based perovskites do not exhibit any phase transformation21,22. Besides, K and Rb have shown promising potential for photo-voltaic applications23. Jain et al.24 have utilized the first-principle calculations on RbSn(Cl,Br)3 perovskites to evaluate prominent band gap suitable for photovoltaics. The monovalent cation K+-based perovskites have potential to be utilized in solar cells because of high absorption and configurable band gap20,22,25. In recent studies, the inorganic halide perovskites have been recognized as a reliable material for solar cell applications25,26. For the purpose of enhancing physical properties of halide perovskites, the application of hydrostatic pressure has demonstrated tremendous results27–32. Usually, hydrostatic pressure modifies the lattice parameters33, displacement of cation and anion34,35, rotation of octahedral cages36, phase transitions37,38, etc. In the case of metal halides, structural properties, like lattice constants and unit cell volume decrease with increasing pressure29,32. Identical behavior can be detected in halide perovskites as well. In recent works, inorganic halide perovskites, such as KCaCl339, CsGeI330, RbYbF340, and CsGeI341 have shown reduction in band gap under hydrostatic pressure, resulting an improvement of conductivity. In addition, the application of pressure can remarkably develop the optical parameters of halide perovskites, enhancing the functionality in optoelectronic fields. Therefore, the motive of present work is to evaluate and examine the changes of various physical features of halide perovskites AGeF3 (A = K, Rb) after applying hydrostatic pressure. More specifically, this study has analyzed the structural, electronic, optical, and mechanical properties of AGeF3 (A = K, Rb) using first-principle calculations to observe whether the application of hydrostatic pressure has made them more appealing to optoelectronic fields or not.
Results and discussion
Structural properties
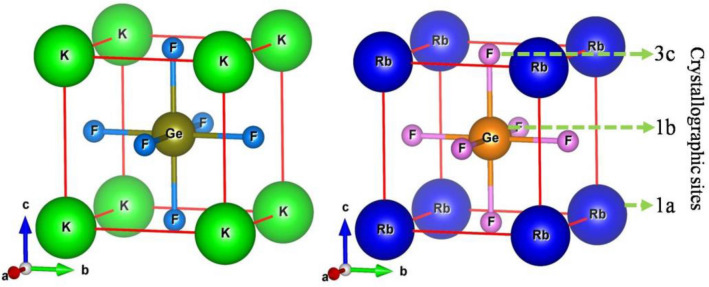
The geometry optimization states that the selected compounds AGeF3 (A = K, Rb) under study crystallized in cubic cell that have the space group Pm-3m (#221). In the unit cell, the A (= K, Rb), Ge, and F atoms are located at the corner, body center, and face center, respectively, with the Wyckoff positions 1a (0, 0, 0), 1b (0.5, 0.5, 0.5), and 3c (0, 0.5, 0.5), respectively. The optimized crystal structure of AGeF3 (A = K, Rb) with crystallographic sites is illustrated in Fig. 1. The evaluated lattice constant of KGeF3 at ambient pressure is 4.451 Å (Table 1), which is relatively closer to the reference study (4.46 Å)20. The deviation value of 0.2% presents the high accuracy of this study. For RbGeF3, the lattice constant is 4.490 Å (Table 1), showing no deviation from the previous work (4.49 Å)20. The hydrostatic pressure ranging from 0 to 30 GPa is applied on both compounds to calculate the structural parameters as given in Table 1. The application of pressure demonstrates a significant effect on the structural parameters. The changes of relative lattice constants and unit cell volume with respect to the hydrostatic pressure are illustrated in Fig. S1a,b, respectively. The plotted graphs reveal the reduction of both lattice constant and unit cell volume under linear ascending of applied pressure. This decreasing tendency of lattice parameters under hydrostatic pressure indicates the reduction of bond length (Table 2) within the compounds. In order to justify the phase stability of AGeF3 (A = K, Rb) under pressure, the formation energy (ΔEf) is calculated using the following equation and recorded in Table 1.
| 1 |
Here, Es(A), Es(Ge), and Es(F) are the energy of A (= K, Rb), Ge, and F atoms, respectively, whereas, Etot(AGeF3) represents the unit cell total energy of AGeF3, and N is the number of atoms in the unit cell. The negative values of ΔEf at all applied pressures reveal the thermodynamic stability of titled halide systems42.
Figure 1.
The optimized crystal structure of halide perovskites KGeF3 and RbGeF3.
Table 1.
Calculated lattice constant (a), unit cell volume (V), and formation energy (ΔEf) of AGeF3 (A = K, Rb) at various applied pressures.
| Compound | Calculated data | Pressure (GPa) | |||
|---|---|---|---|---|---|
| 0 | 10 | 20 | 30 | ||
| KGeF3 | a (Å) | 4.451 [This work] | 4.243 | 4.117 | 4.023 |
| 4.4631 | |||||
| V (Å3) | 88.18 | 76.37 | 69.78 | 65.11 | |
| ΔEf (eV/atom) | − 4.63 | − 4.57 | − 4.44 | − 4.30 | |
| RbGeF3 | a (Å) | 4.490 [This work] | 4.281 | 4.154 | 4.061 |
| 4.4931 | |||||
| V (Å3) | 90.52 | 78.46 | 71.68 | 66.97 | |
| ΔEf (eV/atom) | − 4.62 | − 4.55 | − 4.43 | − 4.28 | |
Table 2.
Estimated bond lengths in AGeF3 (A = K, Rb) at various applied pressures.
| Pressure (GPa) | Bond length (Å) | |||
|---|---|---|---|---|
| KGeF3 | RbGeF3 | |||
| Ge–F | K–F | Ge–F | Rb–F | |
| 0 | 3.14714 | 2.22537 | 3.17491 | 2.24500 |
| 10 | 3.00043 | 2.12162 | 3.02725 | 2.14059 |
| 20 | 2.91083 | 2.05827 | 2.93745 | 2.07709 |
| 30 | 2.84527 | 2.01191 | 2.87188 | 2.03072 |
Electronic properties
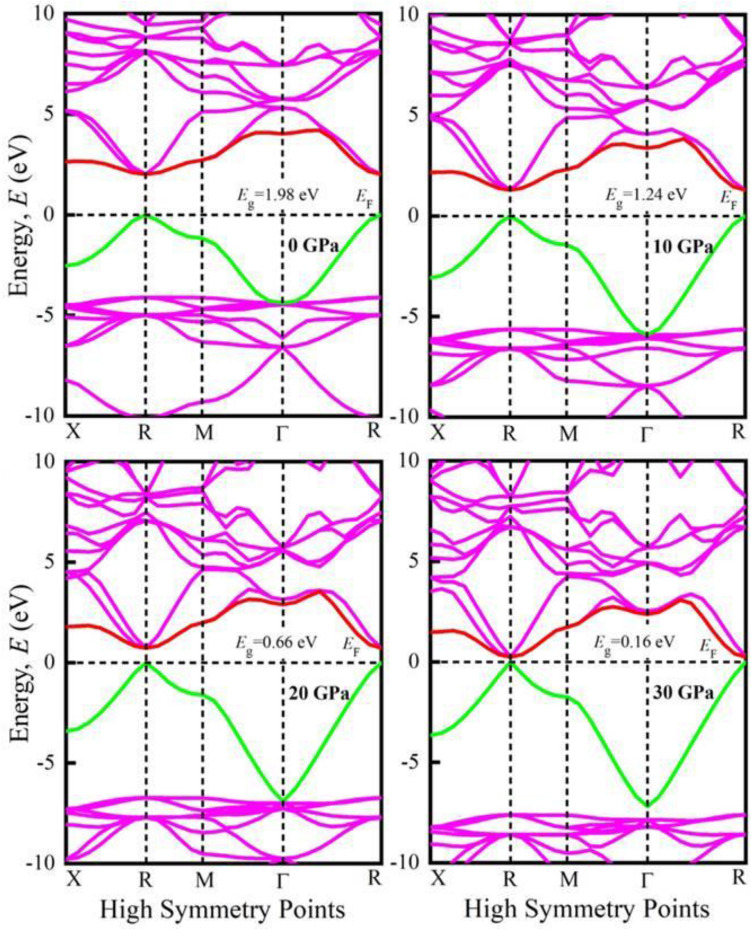
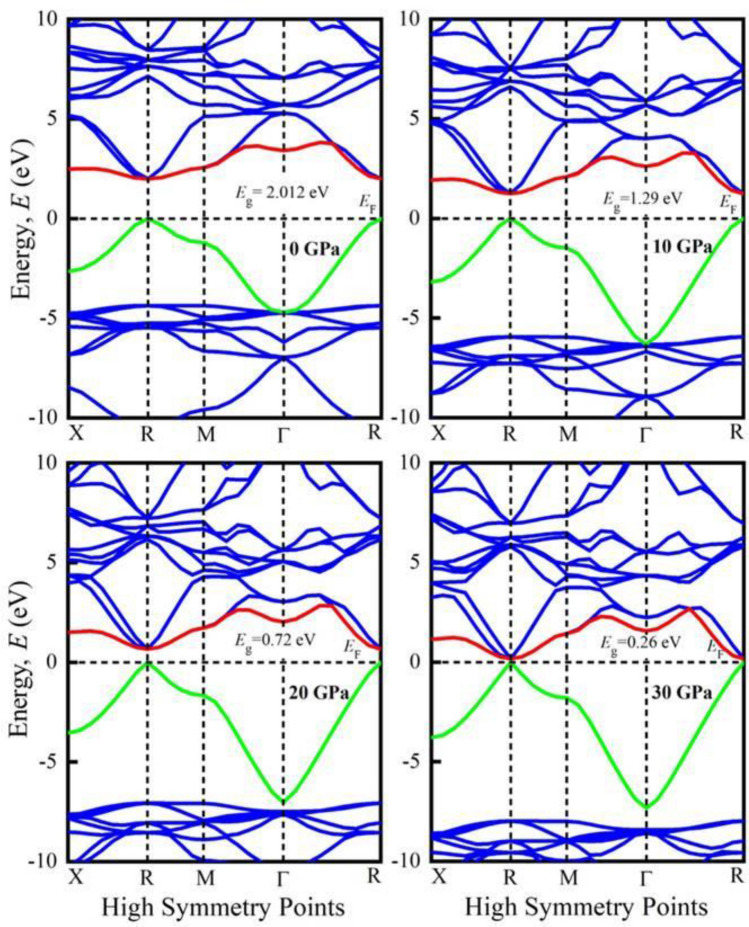
The assessment a material’s electronic nature requires the understanding of its band structure and density of states. The band structures of KGeF3 and RbGeF3 at different applied pressures are shown in Figs. 2 and 3, respectively. The horizontal dotted line at 0 eV denotes the Fermi level (EF). At 0 GPa, the valence band maximum (VBM) and conduction band minimum (CBM) indicated by green and red lines, respectively, of both compounds are noticed at R point of the Brillouin zone. Therefore, a direct band gap (Eg) of 1.98 eV is found for KGeF3, while it is 2.012 eV for RbGeF3. The Eg values found for AGeF3 (A = K, Rb) are quite consistent with the theoretical values obtained using the GGA-PBE approximation19. With increasing pressure, the CBM of both compounds begin to move towards the EF, resulting in a reduction of Eg. At 30 GPa, the Eg of KGeF3 falls to 0.16 eV, while it is 0.26 eV for RbGeF3. The reduction of Eg under pressure for both compounds is graphically presented in Fig. S2. There exists an inverse relationship between band gap and external pressure43, which can increase the potential between electron and ion responsible for reducing lattice parameters (Table 1). The band gap at the Brillouin zone symmetry point shrinks when the lattice parameter is reduced. The reduction of Eg allows easy transport of electrons from valence band to conduction band. As a result, the optical absorption and conductivity may become higher beneficial for optoelectronic applications.
Figure 2.
Band structures of KGeF3 under applied pressure.
Figure 3.
Band structures of RbGeF3 under applied pressure.
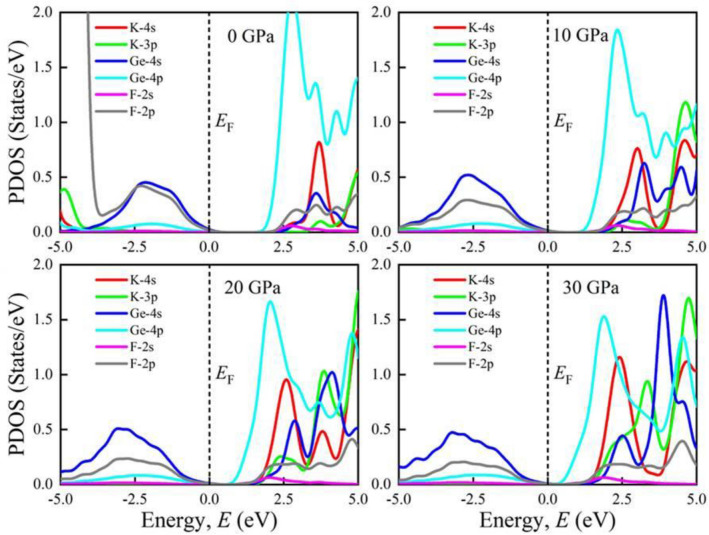
Furthermore, the total density of states (TDOS) of AGeF3 (A = K, Rb) are computed and illustrated in Fig. S3a,b to explicate the band structures. The vertical dashed line at 0 eV denotes the EF. There observe no TDOS value at EF for both compounds under all applied pressures, which also reflects the semiconducting nature of them. There is a significant pressure influence on TDOS in the conduction band, where all the sharp peaks gradually move towards the EF as pressure increases. This peak shifting is responsible for the band gap shrinking under pressure, which is also appeared in the band structures at R point. However, the partial density of states (PDOS) is crucial to obtain the atomic contribution of a material for making its band structure. It is evident from Figs. 4 and 5 that the valence band of both compounds near the EF mostly originate from Ge-4s and F-2p orbitals with small amount of Ge-4p orbital. On the other hand, the conduction band results from K-4s (Rb-5s), K-4p (Rb-4p), Ge-4s, Ge-4p, and F-2p states. It is apparent that the Ge-4p orbital is mainly responsible for narrowing the Eg in both compounds. The hybridization between Ge-4p and F-2p is promoted by raising external pressure, which raises the conduction bands towards the EF and reduces the band gap. Furthermore, the shortening of Ge–F bond length in response to pressure (Table 2) could improve the hybridization between Ge-4p and F-2p orbitals in the conduction band, which lowers the CBM at R point of the Brillouin zone (Figs. 2, 3). Hence, the band gap of KGeF3 (RbGeF3) reduces from 1.98 (2.012 eV) to 0.16 eV (0.26 eV).
Figure 4.
Partial density of states of KGeF3 under applied pressure.
Figure 5.
Partial density of states of RbGeF3 under applied pressure.
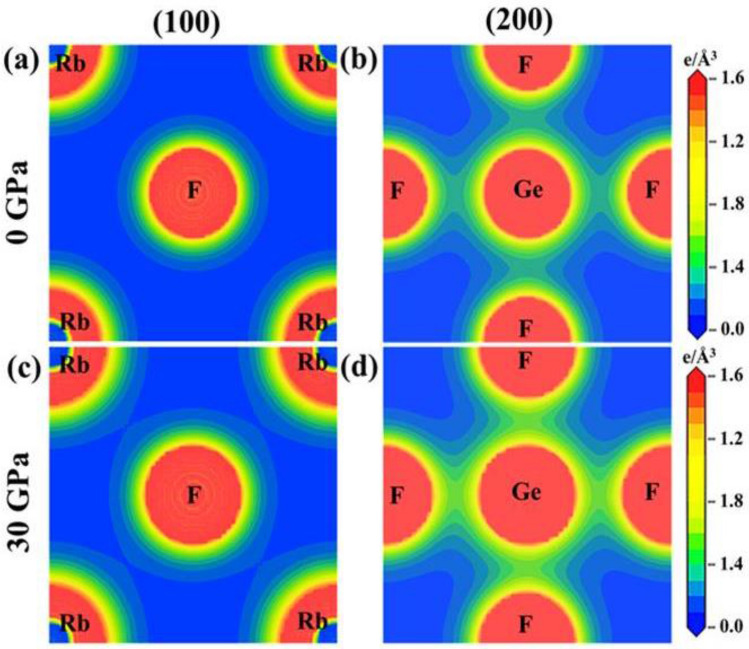
Charge density mapping helps to visualize the charge distribution around atoms and bonding nature of the compounds. Figures 6 and 7 illustrate the charge density mapping of AGeF3 (A = K, Rb) along the crystallographic planes (100) and (200). The right side scales indicate the electron density, in which low and high intensity are imparted by blue and red colors, respectively. At ambient pressure, K(Rb) and F atoms exhibit spherical charge contours along the (100) plane, manifesting the existence of ionic bonding between them (Figs. 6a, 7a). In addition, a covalent bonding nature of Ge–F is predicted, as the elliptical shape of charge distribution is observed around Ge and F atoms along the (200) plane (Figs. 6b, 7b). Charge density is also estimated at an applied pressure of 30 GPa to understand the effect of pressure on charge distribution. There is no noticeable difference in the spherical charge contours around K(Rb) and F atoms along the (100) plane (Figs. 6c, 7c). However, the contours around Ge and F atoms become more elliptical along the (200) plane, intensifying the covalent bonding of Ge–F (Figs. 6d, 7d). The bond length of Ge–F is longer than that of K(Rb)–F (Table 1), indicating strong bonding between K(Rb) and F atoms than that of bonding between Ge and F atoms. Therefore, the weaker covalent bond of Ge–F and stronger ionic bond of K(Rb)–F are exhibited in the crystal structure of AGeF3 (A = K, Rb), which validates the estimated results predicted by charge density maps. The bond length decreases monotonically as pressure increases (Fig. S4a,b) and hence, the ionic/covalent bonds become stronger.
Figure 6.
Charge density plots of KGeF3 at 0 GPa and 30 GPa pressure.
Figure 7.
Charge density plots of RbGeF3 at 0 GPa and 30 GPa pressure.
Optical properties
Metal halides without lead (non-toxic) have served as a source of interest due to their outstanding optical characteristics. They demonstrate much appreciated performance in optoelectronic devices and photovoltaic cells. This section deeply analyzes and discusses a few optical characteristics, namely absorption, conductivity, reflectivity, reflective index, and dielectric function. The findings are presented using an electronic polarization vector of [100] at 0 GPa and 30 GPa pressures.
It is necessary to determine dielectric function to obtain rest of the optical functions44. It can be represented as ε(ω) = ε1(ω) + iε2(ω); where ε1(ω) and ε2(ω) denote the real and imaginary parts of dielectric function, respectively45. According to Kramers–Kronig relation46, ε1(ω) is written as,
On the other hand, ε2(ω) may also calculate using the momentum tensors between the occupied and unoccupied wave functions47,48.
Here, ω signifies the light frequency. and denote the conduction and valance band wave function at k, respectively, e is the electronic charge, Ω represents the unit cell volume, and U indicates the unit vector along the polarization of the incident electric field. The delta function ensures energy and momentum conservation during a transition between occupied and unoccupied electronic states through the emission or absorption of photon energy, E. and denote the energy of electrons at a certain k-vector in the conduction and valence bands, respectively. The rest of the optical parameters are calculated using the expressions given elsewhere49.
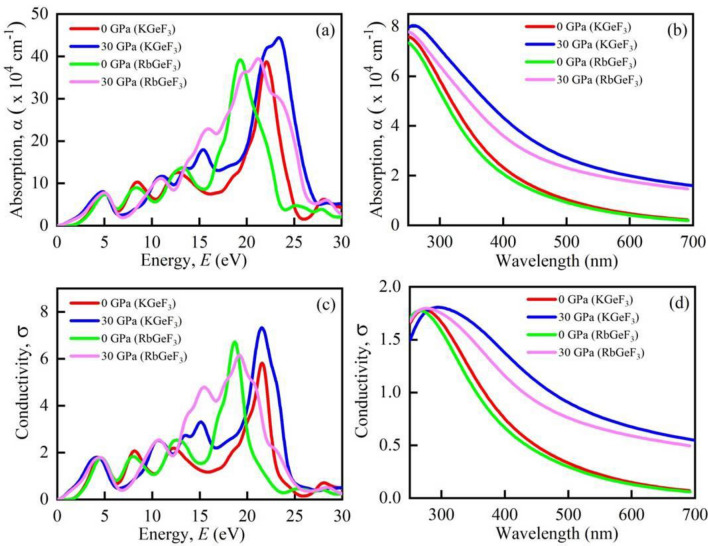
The optical absorption coefficient (α) denotes the amount of energy absorbed by a substance per unit length. The efficiency of a material's optimal solar energy conversion can simply be described by it. From Fig. 8a, the absorption does not begin at 0 eV, since both KGeF3 and RbGeF3 contain a band gap at ambient pressure. In the ultraviolet region, KGeF3 and RbGeF3 show three sharp peaks in the range of ~ 8–22 eV and ~ 8–18 eV, respectively. So, both compounds work as good absorbers in the ultraviolet region at 0 GPa. When 30 GPa pressure is applied both compounds also show peaks within the ultraviolet region similar that exhibit at 0 GPa. In this case, both compounds show an additional peak at ~ 15 eV. Interestingly, the absorption spectra almost start from 0 eV (but not 0 eV due to having very small band gap) at 30 GPa (inset of Fig. 8a). The absorption in the visible light region is explicitly shown in Fig. 8b. The absorption of both compounds in the visible region is explicitly higher at 30 GPa than that observed at 0 GPa. As a result, the studied perovskites are expected to use visible light energy for photovoltaic conversion at a pressure of 30 GPa, potentially increasing the efficiency of solar cells.
Figure 8.
Calculated pressure induced optical (a) absorption vs. energy, (b) absorption vs. wavelength, (c) conductivity vs. energy, and (d) conductivity vs. wavelength of AGeF3 (A = K, Rb).
Photoconductivity is another term of optical conductivity (σ). It refers to the conductivity of photons in a substance50. Figure 8c illustrates the σ of AGeF3 (A = K, Rb) at 0 GPa and 30 GPa pressures. At 0 GPa, the perovskites exhibit σ in the visible area. The σ achieves its maximum value at negative ε1(ω) (Fig. 9c). Therefore, KGeF3 and RbGeF3 show maximum σ in the energy region ~ 22–24 eV and ~ 18–22 eV, respectively. At 30 GPa, both compounds show increased σ in the visible region (Fig. 8d). Just like at 0 GPa, the highest σ peak of KGeF3 is in the energy region ~ 22–24 eV. But the highest σ peak slightly shifts to the energy range ~ 19–21 eV for RbGeF3. However, the σ of both compounds significantly increases in the visible region under pressure as can be seen in Fig. 8d because of increased absorption.
Figure 9.
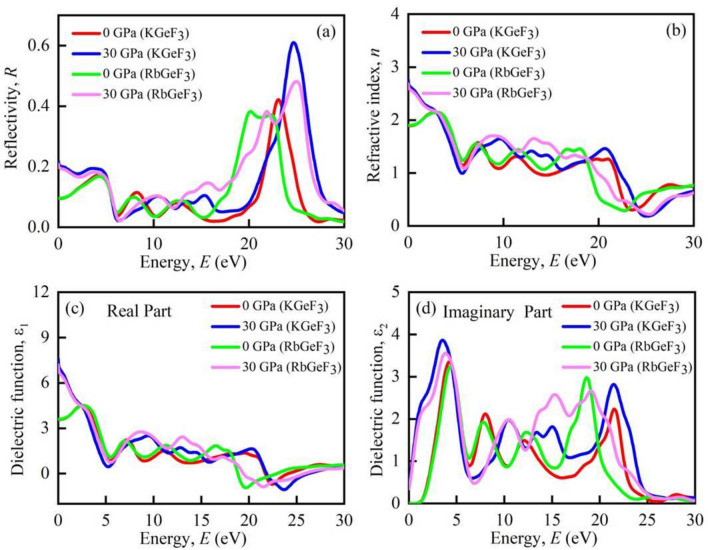
Calculated pressure induced spectra of optical (a) reflectivity, (b) refractive index, (c) real part of dielectric function, and (d) imaginary part of dielectric function of AGeF3 (A = K, Rb).
The reflectivity (R) is a critical optical feature for material’s photovoltaic applications. When exposed to photon with very low energy, KGeF3 and RbGeF3 reflect around 10% of the incident light (Fig. 9a). It rises for both substances when they transit from the infrared to the visible range. After transiting to the ultraviolet region, KGeF3 and RbGeF3 exhibit their highest R peak at ~ 23 eV and ~ 20 eV, where the dielectric function’s real part is negative. Under 30 GPa pressure, the R of both compounds spikes to 20% at zero energy. The application of pressure increases the R of both materials throughout almost whole energy regions. However, the relatively lower R (with or without the application of pressure) at low energy region indicates the potentiality of both compounds in solar cell applications. Additionally, both compounds should be applied as coating material to minimize solar heating because of their higher R at high energy region51.
The refractive index (n) is used to determine the amount of light bent or refracted as it enters into a substance. Furthermore, the phase velocity of an electromagnetic wave in a medium can also be calculated by n. According to Fig. 9b, both compound’s n is prominent at low energy and showing a fluctuating nature in the high energy region. When 30 GPa pressure is applied, the n of both compounds significantly enhances at 0 eV. This implies that AGeF3 (A = K, Rb) should be preferable for optical devices, like photonic crystals and waveguides52.
The dielectric function characterizes the interaction of a material with incoming electromagnetic radiation. As a result, it is critical to have knowledge about dielectric function for optoelectronic device applications. The real (ε1) and imaginary (ε2) parts of dielectric function of AGeF3 (A = K, Rb) are shown in Fig. 9c,d, respectively. The static dielectric function, ε1 (0) is an important quantity, which measures the efficiency of an optoelectronic device15. A material with a greater ε1 (0) has a lower rate of charge recombination, which results in improved performance of optoelectronic devices52. At ambient pressure, both compounds show identical ε1 low energy, which enhances in the infrared–visible region and declines upon entering into the ultraviolet region. In addition, both KGeF3 and RbGeF3 show negative ε1 at energy ranging from ~ 22 to 24 eV to ~ 18 to 22 eV, respectively. This implies that the compounds show high reflectivity at that energy region, which is evident in Fig. 9a. When 30 GPa pressure is applied, the ε1 (0) is remarkably increased owing to the lower recombination of charges, which makes the compounds even more suitable for optoelectronic devices applications. At 0 GPa, the ε2 is higher in the visible and early ultraviolet region, conveying high absorption at that regions53. But the spectrum of the ε2 shifts to the low energy region at high pressure. Specifically, the larger ε1 and ε2 at low energy together with smaller ε1 and ε2 at high energy areas evident the feasibility of both compounds in microelectronics and integrated circuits39, and the superiority is greatly enhanced under pressure.
Mechanical properties
The elastic constants (Cij) are usually used to determine the structural stability and mechanical characteristics of a material. The elastic nature describes how a material deforms under strain before recovering and returning to its original shape once the load is removed. It is important to reveal information about the binding properties between adjoining atomic planes, the anisotropic nature, and structural stability54. A cubic compound has three independent elastic constants: C11, C12, and C44. Table 3 lists the computed C11, C12, C44, and Cauchy pressure (C12 − C44) for these two compounds under pressure. The elastic constants at ambient pressure are comparable with reported study20 but rise linearly as pressure increases (Fig. S5a). Since the well-known Born stability requirements (C44 > 0, C11 − C12 > 0, and C11 + 2C12 > 0)55 are nicely matched by all the calculated elastic constants, both the studied compounds are mechanically stable even under applied pressure. In addition, C12 − C44 can identify the brittleness and ductility of materials. If C12 − C44 possesses a positive (negative) value, the material should be ductile (brittle)56. Therefore, the titled compounds are expected to be ductile because of having positive values of C12 − C44 (Table 3). However, KGeF3 is slightly more ductility than that of RbGeF3 (Table 3).
Table 3.
Calculated elastic constants Cij (GPa) and Cauchy pressure C12 − C44 (GPa) of AGeF3 (A = K, Rb) at various applied pressures.
| Pressure (GPa) | Compound | C11 | C12 | C44 | C12 − C44 |
|---|---|---|---|---|---|
| 031 | KGeF3 | 80.67 | 35.57 | 5.96 | 29.61 |
| RbGeF3 | 82.61 | 34.28 | 12.53 | 21.75 | |
| 0 | KGeF3 | 93.66 | 30.17 | 13.07 | 17.10 |
| RbGeF3 | 91.35 | 33.25 | 16.53 | 16.72 | |
| 10 | KGeF3 | 165.95 | 52.47 | 10.22 | 42.25 |
| RbGeF3 | 163.40 | 57.57 | 16.45 | 41.12 | |
| 20 | KGeF3 | 233.93 | 77.25 | 6.66 | 70.59 |
| RbGeF3 | 227.88 | 81.06 | 15.51 | 65.55 | |
| 30 | KGeF3 | 293.88 | 98.42 | 2.51 | 95.91 |
| RbGeF3 | 292.15 | 107.79 | 13.99 | 93.80 |
Various essential mechanical characteristics, such as bulk modulus (B), shear modulus (G), Young’s modulus (E), Poisson’s ratio (v), Pugh’s ratio (B/G), and Zener anisotropy index (A) of AGeF3 (A = K, Rb) are determined using the estimated Cij and presented in Table 4 with available reported data20. The B and G are determined using the Voigt–Reuss scheme. The Voigt and Reuss coefficients describe the upper and lower bounds of the effective modulus, respectively. For cubic lattices, the Voigt bulk modulus (BV) and Voigt shear modulus (GV) as well as the Reuss bulk modulus (BR) and Reuss shear modulus (GR) are described by the well-known expressions57,58. According to Hill’s theory59, the B and G are the arithmetic mean of Voigt and Reuss expressions. Furthermore, the E and v are provided by the equations reported elsewhere59. The B and G stand for fracture resistant and plastic deformation, respectively. Because of having greater B and G, RbGeF3 is more fracture and plastic deformation resistant than KGeF3 (Fig. S5b). E is a measure of material’s stiffness and has proportional relationship. As a result, RbGeF3 will be stiffer than KGeF3. However, the application of pressure induces more resistance to fracture and plastic deformation as well as makes them stiffer than that exhibited by the compounds without pressure. The variation of elastic moduli under applied pressure is graphically represented in Fig. S5b.
Table 4.
The calculated bulk modulus B (GPa), shear modulus G (GPa), Young’s modulus E (GPa), Poisson’s ratio v, Pugh’s ratio B/G, and Zener anisotropy index A of AGeF3 (A = K, Rb) at various applied pressures.
| Pressure (GPa) | Compound | B | G | E | B/G | v | A |
|---|---|---|---|---|---|---|---|
| 031 | KGeF3 | 50.61 | 10.52 | 29.53 | 4.81 | 0.40 | 0.26 |
| RbGeF3 | 50.39 | 16.35 | 44.27 | 3.08 | 0.35 | 0.52 | |
| 0 | KGeF3 | 51.34 | 18.81 | 50.30 | 2.73 | 0.366 | 0.412 |
| RbGeF3 | 52.62 | 20.76 | 55.03 | 2.49 | 0.326 | 0.569 | |
| 10 | KGeF3 | 90.30 | 22.01 | 61.08 | 4.10 | 0.387 | 0.180 |
| RbGeF3 | 92.97 | 26.85 | 73.47 | 3.46 | 0.368 | 0.311 | |
| 20 | KGeF3 | 129.4 | 22.92 | 64.93 | 5.65 | 0.416 | 0.085 |
| RbGeF3 | 130.00 | 30.67 | 85.29 | 4.24 | 0.391 | 0.211 | |
| 30 | KGeF3 | 163.57 | 22.35 | 64.14 | 7.32 | 0.434 | 0.026 |
| RbGeF3 | 169.24 | 33.22 | 93.55 | 5.09 | 0.407 | 0.152 |
The critical value of v to distinguish a materials’ ductile or brittle nature is 0.2660. A material is said to be ductile if v is larger than 0.26. Thus, both KGeF3 and RbGeF3 are concluded as ductile materials (Table 4). Another essential feature is B/G, which has a crucial value of 1.75 to divide solid materials into ductile or brittle61. The calculated values of B/G also reveal the ductile behavior of both compounds (Table 4). However, the ductility of KGeF3 is slightly higher than that of RbGeF3. The ductility of the studied compounds at 0 GPa has previously been predicted20, which is consistent with this study. It seen from Figs. S6a,b that both v and B/G, respectively, are increased with increasing pressure, which exhibit more ductile nature of the studied compounds under pressure. Interestingly, the outcome of v and B/G completely resemblances the data of C12 − C44 (Tables 3, 4).
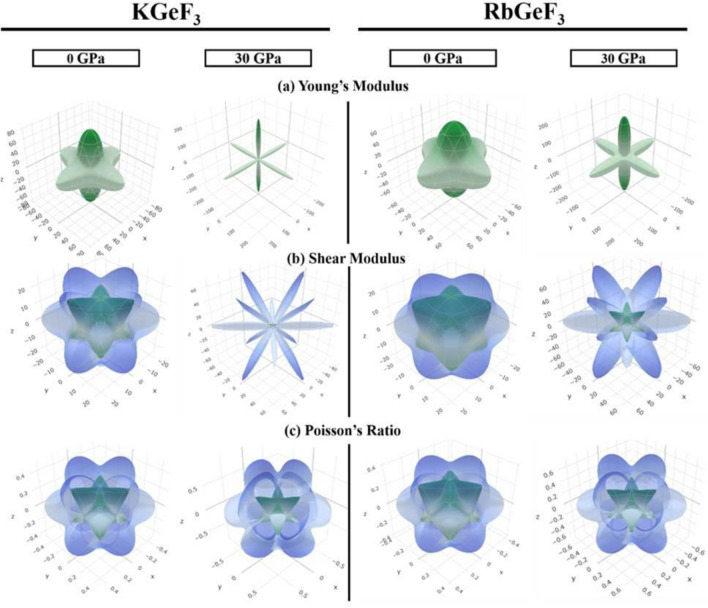
In applied engineering, the ability to observe the influence of elastic anisotropy on these features is critical62. The properties of a system may be directionally dependent and anisotropic index is used to calculate it. For example, the shear anisotropic factor is utilized to determine the degree of anisotropy in the bonding strength of atoms along different crystallographic planes. Three shear anisotropic factors A1, A2, and A3 have been found along the (100), (010), and (001) planes, respectively63. For cubic systems, these are similar to the Zener anisotropy factor (A) and can be determined by the empirical formula64. An isotropic material must have the unit value of A and the departure of unity denotes anisotropy65. Both the compounds exhibit anisotropic nature, which are enhanced under pressure (Table 4). However, KGeF3 show more anisotropy as compared to KGeF3. Figure 10a–c show the direction dependence of E, G, and v, respectively, at 0 and 30 GPa pressure to highlight the anisotropic character of KGeF3 and RbGeF3. The isotropy of is represented by the spherical 3D plots, whereas anisotropy is revealed by non-spherical plots7. The elastic anisotropy of studied perovskites is appeared in all directions, as indicated by the non-spherical 3D contour plots. The deviation of spherical plots is more extreme at 30 GPa pressure than that exhibited at 0 GPa pressure, manifesting that the applied pressure may promote the anisotropy of AGeF3 (A = K, Rb).
Figure 10.
Anisotropic 3D representation of (a) Young’s modulus, (b) shear modulus, and (c) Poisson’s ratio of AGeF3 (A = K, Rb) at 0 and 30 GPa pressure.
Conclusions
The physical characteristics of lead-free halide perovskites AGeF3 (A = K, Rb) under hydrostatic pressure are investigated using DFT. The lattice constant and cell volume reveal similarities with available studies, but decrease with the application of pressure. With increased pressure, the band gap narrows considerably, resulting in improving optical functions and make the compounds suitable for solar cell applications. The ionic/covalent bonds in the compounds also become stronger under pressure. Both compounds exhibit ductile nature at ambient pressure, as determined by their Cauchy pressure, Poisson’s ratio, and Pugh’s ratio. The compounds become more ductile because of pressure effect. The anisotropic nature of both compounds demonstrates similar nature as ductility. At last, it can be expected that this literature will shed fresh light on the improvement of perovskite solar cells and their prospective applications.
Computational method
The present computations are done by Cambridge Serial Total Energy Package (CASTEP) grounded on density functional theory (DFT)66. The orbital shape approximations are not taken into account in the CASTEP code67. Though the compounds KGeF3 and RbGeF3 are yet to synthesize their crystal structure is constructed by taking the reported crystallographic data determined by the theoretical investigation20. Houari et al.20 predicted that both compounds may have cubic perovskite-type structure with the space group Pm-3m (#221) as well as the lattice constant is 4.46 Å and 4.49 Å for KGeF3 and RbGeF3, respectively. The generalized gradient approximation (GGA) combined with Perdew–Berke–Emzerhof (PBE) functional is chosen to perform the exchange–correlation effect68. To evaluate the electron–ion interaction, the Vanderbilt-type ultrasoft pseudopotential is selected69. The cut off energy is 900 eV following a k-point grid of 12 × 12 × 12. To sample the Brillouin zone, the Monkhorst–Pack scheme70 is considered. The convergence tolerance factors are set as 5 × 10⁻⁶ eV/atom for total energy, 5 × 10⁻⁴ Å for maximum displacement, 0.01 eV/Å for maximum force, and 0.02 GPa for maximum stress. The Broyden–Fletcher–Goldferb–Shanno (BFGS) algorithm71 is employed to optimize the crystal structure. The relatively similar approximations were also employed to optimize the crystal structure of experimentally synthesized Pb-based and Pb-free cubic halide perovskites39,72–74. In this study, the hydrostatic pressure up to 30 GPa with an interval of 10 GPa is applied during structural optimization. The optimized crystal structure is constructed by VESTA software75. The electronic and optical properties are calculated by using the same parameters that are utilized in structural optimization. The elastic constants and elastic moduli are determined by “stress–strain” method76 embodied in the CASTEP code. The ELATE program77 is used to create the three-dimensional (3D) anisotropic contour plots of Young’s modulus, shear modulus, and Poisson’s ratio.
Supplementary Information
Author contributions
M.S.A.: Investigation, methodology, data curation, writing the original draft. M.S.: Formal analysis, conceptualization, writing the original draft, supervision, reviewing, and editing. A.B., T.A., A.S.: Formal analysis, data curation. K.M.H.: Formal analysis, validation, writing the original draft, supervision, reviewing, and editing.
Data availability
The datasets generated and/or analyzed in this study are available from the corresponding author upon reasonable request.
Competing interests
The authors declare no competing interests.
Footnotes
Publisher's note
Springer Nature remains neutral with regard to jurisdictional claims in published maps and institutional affiliations.
Contributor Information
Md Saiduzzaman, Email: msaiduzzaman@mse.kuet.ac.bd.
Khandaker Monower Hossain, Email: monower37@gmail.com.
Supplementary Information
The online version contains supplementary material available at 10.1038/s41598-022-12713-4.
References
- 1.Bisquert J. The Physics of Solar Cells: Perovskites, Organics, and Photovoltaic Fundamentals. CRC Press; 2017. [Google Scholar]
- 2.He T, et al. Superconductivity in the non-oxide perovskite MgCNi3. Nature. 2001;411:54–56. doi: 10.1038/35075014. [DOI] [PubMed] [Google Scholar]
- 3.Eperon GE, et al. Inorganic caesium lead iodide perovskite solar cells. J. Mater. Chem. A. 2015;3:19688–19695. doi: 10.1039/C5TA06398A. [DOI] [Google Scholar]
- 4.Saiduzzaman M, et al. Hydrothermal synthesis and crystal structure of a (Ba0.54K0.46)4Bi4O12 double-perovskite superconductor with onset of the transition Tc ∼ 30 K. Inorg. Chem. 2019;58:11997–12001. doi: 10.1021/acs.inorgchem.9b01768. [DOI] [PubMed] [Google Scholar]
- 5.Hossain KM, Saiduzzaman M, Kumada N, Takei T, Yamane H. Hydrothermal synthesis and crystal structure of a novel double-perovskite-type bismuth oxide with 3:1 ordering at the B-site. New J. Chem. 2022;46:3595–3601. doi: 10.1039/D1NJ05648D. [DOI] [Google Scholar]
- 6.Hossain KM, Hasan MZ, Ali ML. Narrowing bandgap and enhanced mechanical and optoelectronic properties of perovskite halides: Effects of metal doping. AIP Adv. 2021;11:015052. doi: 10.1063/5.0039308. [DOI] [Google Scholar]
- 7.Biswas A, et al. Effects of Bi and Mn codoping on the physical properties of barium titanate: Investigation via DFT method. Appl. Phys. A. 2021;127:939. doi: 10.1007/s00339-021-05094-4. [DOI] [Google Scholar]
- 8.Yangb WS, et al. Iodide management in formamidinium-lead-halide-based perovskite layers for efficient solar cells. Science. 2017;356:1376–1379. doi: 10.1126/science.aan2301. [DOI] [PubMed] [Google Scholar]
- 9.NREL. Pv Research Cell Record Efficiency. Chart (2019).
- 10.Ava TT, Mamun AA, Marsillac S, Namkoong G. A review: Thermal stability of methylammonium lead halide based perovskite solar cells. Appl. Sci. 2019;1:188. doi: 10.3390/app9010188. [DOI] [Google Scholar]
- 11.Nishimura K, et al. Lead-free tin-halide perovskite solar cells with 13% efficiency. Nano Energy. 2020;74:104858. doi: 10.1016/j.nanoen.2020.104858. [DOI] [Google Scholar]
- 12.Yuan Y, et al. Nature of the band gap of halide perovskites ABX3 (A = CH3NH3, Cs; B = Sn, Pb; X = Cl, Br, I): First-principles calculations. Chin. Phys. B. 2015;24:116302. doi: 10.1088/1674-1056/24/11/116302. [DOI] [Google Scholar]
- 13.Zhao T, Zhang S, Guo Y, Wang Q. TiC2: A new two-dimensional sheet beyond MXenes. Nanoscale. 2016;8:233–242. doi: 10.1039/C5NR04472C. [DOI] [PubMed] [Google Scholar]
- 14.Roknuzzaman M, et al. Insight into lead-free organic-inorganic hybrid perovskites for photovoltaics optoelectronics: A first-principles study. Org. Electron. 2018;59:99–106. doi: 10.1016/j.orgel.2018.04.051. [DOI] [Google Scholar]
- 15.Zuo X, et al. Bubble-template-assisted synthesis of hollow fullerene-like MoS2 nanocages as a lithium ion battery anode material. J. Mater. Chem. A. 2016;4:51–58. doi: 10.1039/C5TA06869J. [DOI] [Google Scholar]
- 16.Berhe TA, et al. Organometal halide perovskite solar cells: Degradation and stability. Energy Environ. Sci. 2016;9:323–356. doi: 10.1039/C5EE02733K. [DOI] [Google Scholar]
- 17.Protesescu L, et al. Nanocrystals of cesium lead halide perovskites (CsPbX3, X = Cl, Br, I): Novel optoelectronic materials showing bright emission with wide color gamut. Nano Lett. 2015;15:3692–3696. doi: 10.1021/nl5048779. [DOI] [PMC free article] [PubMed] [Google Scholar]
- 18.Swarnkar A, et al. Quantum dot-induced phase stabilization of α-CsPbI3 perovskite for high-efficiency photovoltaics. Science. 2016;354:92–95. doi: 10.1126/science.aag2700. [DOI] [PubMed] [Google Scholar]
- 19.Kovalsky A, Wang L, Marek GT, Burda C, Dyck JS. Thermal conductivity of CH3NH3PbI3 and CsPbI3: Measuring the effect of the methylammonium ion on phonon scattering. J. Phys. Chem. C. 2017;121:3228–3233. doi: 10.1021/acs.jpcc.6b12231. [DOI] [Google Scholar]
- 20.Houari M, et al. Semiconductor behavior of halide perovskites AGeX3 (A = K, Rb, Cs; X = F, Cl, Br): First principles calculations. Indian J. Phys. 2020;94:455–467. doi: 10.1007/s12648-019-01480-0. [DOI] [Google Scholar]
- 21.Stoumpos CC, et al. Hybrid germanium iodide perovskite semiconductors: Active lone pairs, structural distortions, direct indirect energy gaps, and strong nonlinear optical properties. J. Am. Chem. Soc. 2015;137:6804–6819. doi: 10.1021/jacs.5b01025. [DOI] [PubMed] [Google Scholar]
- 22.Hamideddine I, Zitouni H, Tahiri N, El Bounagui O, Ez-Zahraouy H. A DFT study of the electronic structure, optical, thermoelectric properties of halide perovskite KGeI3-xBrx materials: Photovoltaic applications. Appl. Phys. A. 2021;127:443. doi: 10.1007/s00339-021-04600-y. [DOI] [Google Scholar]
- 23.Mao X, et al. First-principles screening of all-inorganic lead-free ABX3 perovskites. J. Phys. Chem. C. 2018;14:7670–7675. doi: 10.1021/acs.jpcc.8b02448. [DOI] [Google Scholar]
- 24.Jiang J, Onwudinanti CK, Hatton RA, Bobbert PA, Tao S. Stabilizing lead-free all-inorganic tin halide perovskites by ion exchange. J. Phys. Chem. C. 2018;122:17660–17667. doi: 10.1021/acs.jpcc.8b04013. [DOI] [PMC free article] [PubMed] [Google Scholar]
- 25.Khan K, Sahariya J, Soni A. Structural, electronic optical modeling of perovskite solar materials ASnX3 (A = Rb, K; X = Cl, Br): First principle investigations. Mater. Chem. Phys. 2021;262:124284. doi: 10.1016/j.matchemphys.2021.124284. [DOI] [Google Scholar]
- 26.Mahmood Q, et al. The first-principle study of mechanical, optoelectronic and thermoelectric properties of CsGeBr3 and CsSnBr3 perovskites. Mater. Res. Express. 2019;6:045901. doi: 10.1088/2053-1591/aaf997. [DOI] [Google Scholar]
- 27.Wang Y, et al. Pressure induced phase transformation, reversible amorphization, and anomalous visible light response in organolead bromide perovskite. J. Am. Chem. Soc. 2015;137:11144–11149. doi: 10.1021/jacs.5b06346. [DOI] [PubMed] [Google Scholar]
- 28.Wang L, Wang K, Zou B. Pressure-induced structural and optical properties of organometal halide perovskite-based formamidinium lead bromide. J. Phys. Chem. Lett. 2016;7:2556–2562. doi: 10.1021/acs.jpclett.6b00999. [DOI] [PubMed] [Google Scholar]
- 29.Yuan G, Qin S, Wu X, Ding H, Lu A. Pressure-induced phase transformation of CsPbI3 by X-ray diffraction and Raman spectroscopy. Phase Transit. 2018;91:38–47. doi: 10.1080/01411594.2017.1357180. [DOI] [Google Scholar]
- 30.Liu D, Li Q, Jing H, Wu K. Pressure-induced effects in the inorganic halide perovskite CsGeI3. RSC Adv. 2019;9:3279–3284. doi: 10.1039/C8RA10251A. [DOI] [PMC free article] [PubMed] [Google Scholar]
- 31.Huang Y, Wang L, Ma Z, Wang F. Pressure-induced band structure evolution of halide perovskites: A first-principles atomic and electronic structure study. J. Phys. Chem. C. 2019;123:739–745. doi: 10.1021/acs.jpcc.8b11500. [DOI] [Google Scholar]
- 32.Swainson IP, Tucker MG, Wilson DJ, Winkler B, Milman V. Pressure response of an organic-inorganic perovskite: Methylammonium lead bromide. Chem. Mater. 2007;19:2401–2405. doi: 10.1021/cm0621601. [DOI] [Google Scholar]
- 33.Zhao Q, et al. Size-dependent lattice structure and confinement properties in CsPbI3 perovskite nanocrystals: Negative surface energy for stabilization. ACS Energy Lett. 2020;5:238–247. doi: 10.1021/acsenergylett.9b02395. [DOI] [Google Scholar]
- 34.Talanov MV, Shirokov VB, Talanov VM. Anion order in perovskites: A grouptheoretical analysis. Acta. Crystallogr. A Found. Adv. 2016;72:222–235. doi: 10.1107/S2053273315022147. [DOI] [PubMed] [Google Scholar]
- 35.King G, Woodward PM. Cation ordering in perovskites. J. Mater. Chem. 2010;20:5785. doi: 10.1039/b926757c. [DOI] [Google Scholar]
- 36.Wang F, Tan M, Li C, Niu C, Zhao X. Unusual pressure-induced electronic structure evolution in organometal halide perovskite predicted from first-principles. Org. Electron. 2019;67:89–94. doi: 10.1016/j.orgel.2019.01.003. [DOI] [Google Scholar]
- 37.Ter-Oganessian NV, Sakhnenko VP. Effect of pressure on the order-disorder phase transitions of B cations in AB′1/2B′′1/2O3 perovskites. Acta Crystallogr. B Struct. Sci. Cryst. Eng. Mater. 2019;75:1034–1041. doi: 10.1107/S2052520619013350. [DOI] [PubMed] [Google Scholar]
- 38.Lin J, et al. Pressure-induced semiconductor-to-metal phase transition of a charge-ordered indium halide perovskite. PNAS. 2019;116:23404–23409. doi: 10.1073/pnas.1907576116. [DOI] [PMC free article] [PubMed] [Google Scholar]
- 39.Haq MA, Saiduzzaman M, Asif TI, Shuvo IK, Hossain KM. Ultra-violet to visible band gap engineering of cubic halide KCaCl3 perovskite under pressure for optoelectronic applications: Insights from DFT. RSC Adv. 2021;11:36367–36378. doi: 10.1039/D1RA06430D. [DOI] [PMC free article] [PubMed] [Google Scholar]
- 40.Ullah R, et al. Structural, electronic and optical properties of cubic perovskite RbYbF3 under pressure: A first principles study. Mater. Res. Express. 2019;6:125901. doi: 10.1088/2053-1591/ab540e. [DOI] [Google Scholar]
- 41.Islam MA, Islam J, Islam MN, Sen SK, Hossain AKMK. Enhanced ductility and optoelectronic properties of environment-friendly CsGeCl3 under pressure. AIP Adv. 2021;11:045014. doi: 10.1063/5.0048849. [DOI] [Google Scholar]
- 42.Pan Y, Chen S. Influence of alloying elements on the mechanical and thermodynamic properties of ZrB2 boride. Vacuum. 2022;198:110898. doi: 10.1016/j.vacuum.2022.110898. [DOI] [Google Scholar]
- 43.Gillani SSA, et al. Effect of external pressure on the structural stability, electronic structure, band gap engineering and optical properties of LiNbO3: An ab-initio calculations. Mater. Today Commun. 2020;23:100919. doi: 10.1016/j.mtcomm.2020.100919. [DOI] [Google Scholar]
- 44.Mubarak AA. The first-principle study of the electronic, optical thermoelectric properties of XTiO3 (X = Ca, Sr, Ba) compounds. Int. J. Mod. Phys. B. 2016;30:1650141. doi: 10.1142/S0217979216501411. [DOI] [Google Scholar]
- 45.Babu KE, Veeraiah A, Swamy DT, Veeraiah V. First-principles study of electronic structure optical properties of cubic perovskite CsCaF3. Chin. Phys. Lett. 2012;29:117102. doi: 10.1088/0256-307X/29/11/117102. [DOI] [Google Scholar]
- 46.Green MA, Jiang Y, Soufiani AM, Ho-Baillie A. Optical properties of photovoltaic organic–inorganic lead halide perovskites. J. Phys. Chem. Lett. 2015;6:4774–4785. doi: 10.1021/acs.jpclett.5b01865. [DOI] [PubMed] [Google Scholar]
- 47.Draxl CA, Sofo JO. Linear optical properties of solids within the full-potential linearized augmented plane wave method. Comput. Phys. Commun. 2006;175:1–14. doi: 10.1016/j.cpc.2006.03.005. [DOI] [Google Scholar]
- 48.Smith NV. Photoelectron energy spectra the band structures of the noble metals. Phys. Rev. B. 1971;3:1862–1878. doi: 10.1103/PhysRevB.3.1862. [DOI] [Google Scholar]
- 49.Hadi MA, Vovk RV, Chroneos A. Physical properties of the recently discovered Zr2(Al1−x Bix)C MAX phases. J. Mater. Sci. Mater. Electron. 2016;27:11925–11933. doi: 10.1007/s10854-016-5338-z. [DOI] [Google Scholar]
- 50.Yu G, Lee CH, Heeger AJ, Cheong SW. Photoconductivity optical conductivity in lightly doped Nd2CuO4−δ. Phys. C Supercond. 1992;203:419–425. doi: 10.1016/0921-4534(92)90051-D. [DOI] [Google Scholar]
- 51.Li S, Ahuja R, Barsoum MW, Jena P, Johansson B. Optical properties of Ti3SiC2 and Ti4AlN3. Appl. Phys. Lett. 2008;92:221907. doi: 10.1063/1.2938862. [DOI] [Google Scholar]
- 52.Rahaman MZ, Hossain AKMA. Effect of metal doping on the visible light absorption, electronic structure mechanical properties of non-toxic metal halide CsGeCl3. RSC Adv. 2018;8:33010–33018. doi: 10.1039/C8RA06374E. [DOI] [PMC free article] [PubMed] [Google Scholar]
- 53.Rahaman MZ, Rahman MA. Investigation of the physical properties of two laves phase compounds HRh2 (H = Ca, La): A DFT study. Int. J. Mod. Phys. B. 2018;32:1850149. doi: 10.1142/S0217979218501497. [DOI] [Google Scholar]
- 54.Litimein F, Khenata R, Bouhemadou A, Al-Douri Y, Omran SB. First-principle calculations to investigate the elastic thermodynamic properties of RBRh3 (R = Sc, Y, La) perovskite compounds. Mol. Phys. 2012;110:121–128. doi: 10.1080/00268976.2011.635607. [DOI] [Google Scholar]
- 55.Mouhat F, Coudert FX. Necessary sufficient elastic stability conditions in various crystal systems. Phys. Rev. B. 2014;90:224104. doi: 10.1103/PhysRevB.90.224104. [DOI] [Google Scholar]
- 56.Pettifor DG. Theoretical predictions of structure related properties of intermetallics. Mater. Sci. Technol. 1992;8:345–349. doi: 10.1179/mst.1992.8.4.345. [DOI] [Google Scholar]
- 57.Naher MI, Naqib SH. Structural, elastic, electronic, bonding, optical properties of topological CaSn3 semimetal. J. Alloys Compd. 2020;829:154509. doi: 10.1016/j.jallcom.2020.154509. [DOI] [PMC free article] [PubMed] [Google Scholar]
- 58.Al-Fahdi M, Rodriguez A, Ouyang T, Hu M. High-throughput computation of new carbon allotropes with diverse hybridization ultrahigh hardness. Curr. Comput.-Aided Drug Des. 2021;11:783. [Google Scholar]
- 59.Hill R. The elastic behaviour of a crystalline aggregate. Proc. Phys. Soc. A. 1952;65:349–354. doi: 10.1088/0370-1298/65/5/307. [DOI] [Google Scholar]
- 60.Frantsevich IN, Voronov FF, Bakuta SA. Handbook on Elastic Constants and Moduli of Elasticity for Metals and Nonmetals. Naukova Dumka; 1982. [Google Scholar]
- 61.Pugh SF. Relations between the elastic moduli and the plastic properties of polycrystalline pure metals. Lond. Edinb. Dublin Philos. Mag. J. Sci. 1954;45:823–843. doi: 10.1080/14786440808520496. [DOI] [Google Scholar]
- 62.Kube CM. Elastic anisotropy of crystals. AIP Adv. 2016;6:095209. doi: 10.1063/1.4962996. [DOI] [Google Scholar]
- 63.Gao X, Jiang Y, Zhou R, Feng J. Stability elastic properties of Y-C binary compounds investigated by first principles calculations. J. Alloys Compd. 2014;587:819–826. doi: 10.1016/j.jallcom.2013.11.005. [DOI] [Google Scholar]
- 64.Zener CM, Siegel S. Elasticity and anelasticity of metals. J. Phys. Colloid Chem. 1949;53:1468. doi: 10.1021/j150474a017. [DOI] [Google Scholar]
- 65.Mitro SK, Saiduzzaman M, Biswas A, Sultana A, Hossain KM. Electronic phase transition and enhanced optoelectronic performance of lead-free halide perovskites AGeI3 (A = Rb, K) under pressure. Mater. Today Commun. 2022;31:103532. doi: 10.1016/j.mtcomm.2022.103532. [DOI] [Google Scholar]
- 66.Payne MC, Teter MP, Allan DC, Arias TA, Joannopoulos JD. Iterative minimization techniques for ab initio total-energy calculations: Molecular dynamics and conjugate gradients. Rev. Mod. Phys. 1992;64:1045. doi: 10.1103/RevModPhys.64.1045. [DOI] [Google Scholar]
- 67.Segall MD, et al. First-principles simulation: Ideas, illustrations and the CASTEP code. J. Phys. Condens. Matter. 2002;14:2717–2744. doi: 10.1088/0953-8984/14/11/301. [DOI] [Google Scholar]
- 68.Perdew JP, Burke K, Ernzerhof M. Generalized gradient approximation made simple. Phys. Rev. Lett. 1996;77:3865–3868. doi: 10.1103/PhysRevLett.77.3865. [DOI] [PubMed] [Google Scholar]
- 69.Vanderbilt D. Soft self-consistent pseudopotentials in a generalized eigenvalue formalism. Phys. Rev. B. 1990;41:7892–7895. doi: 10.1103/PhysRevB.41.7892. [DOI] [PubMed] [Google Scholar]
- 70.Monkhorst J, Pack JD. Special points for Brillouin-zone integrations. Phys. Rev. B. 1976;13:5188–5192. doi: 10.1103/PhysRevB.13.5188. [DOI] [Google Scholar]
- 71.Fischer TH, Almlof J. General methods for geometry wave function optimization. J. Phys. Chem. 1992;96:9768–9774. doi: 10.1021/j100203a036. [DOI] [Google Scholar]
- 72.Roknuzzaman M, Ostrikov K, Wang H, Du A, Tesfamichael T. Towards lead-free perovskite photovoltaics and optoelectronics by ab-initio simulations. Sci. Rep. 2017;7:14024. doi: 10.1038/s41598-017-13172-y. [DOI] [PMC free article] [PubMed] [Google Scholar]
- 73.Shuvo IK, Saiduzzaman M, Asif TI, Haq MA, Hossain KM. Band gap shifting of halide perovskite CsCaBr3 from ultra-violet to visible region under pressure for photovoltaic applications. Mater. Sci. Eng. B. 2022;278:115645. doi: 10.1016/j.mseb.2022.115645. [DOI] [Google Scholar]
- 74.Molla MR, Saiduzzaman M, Asif TI, Dujana WA, Hossain KM. Electronic phase transition from semiconducting to metallic in cubic halide CsYbCl3 perovskite under hydrostatic pressure. Physica B. 2022;630:413650. doi: 10.1016/j.physb.2021.413650. [DOI] [Google Scholar]
- 75.Momma K, Izumi F. VESTA 3 for three-dimensional visualization of crystal, volumetric and morphology data. J. Appl. Crystallogr. 2011;44:1272–1276. doi: 10.1107/S0021889811038970. [DOI] [Google Scholar]
- 76.Boekelheide Z, et al. Antiferromagnetism in Cr3Al relation to semiconducting behavior. Phys. Rev. B. 2012;85:094413. doi: 10.1103/PhysRevB.85.094413. [DOI] [Google Scholar]
- 77.Gaillac R, Pullumbi P, Coudert FX. ELATE: An open-source online application for analysis and visualization of elastic tensors. J. Phys. Condens. Matter. 2016;28:275201. doi: 10.1088/0953-8984/28/27/275201. [DOI] [PubMed] [Google Scholar]
Associated Data
This section collects any data citations, data availability statements, or supplementary materials included in this article.
Supplementary Materials
Data Availability Statement
The datasets generated and/or analyzed in this study are available from the corresponding author upon reasonable request.


