

SUMMARY
Translocation renal cell carcinoma (tRCC) is a poorly-characterized subtype of kidney cancer driven by MiT/TFE gene fusions. Here, we define the landmarks of tRCC through an integrative analysis of 152 patients with tRCC identified across genomic, clinical trial, and retrospective cohorts. Most tRCCs harbor few somatic alterations apart from MiT/TFE fusions and homozygous deletions at chromosome 9p21.3 (19.2% of cases). Transcriptionally, tRCCs display a heightened NRF2-driven antioxidant response that is associated with resistance to targeted therapies. Consistently, we find that outcomes for patients with tRCC treated with vascular endothelial growth factor receptor inhibitors (VEGFR-TKI) are worse than those treated with immune checkpoint inhibition (ICI). Using multiparametric immunofluorescence, we find that the tumors are infiltrated with CD8+ T cells, though the T cells harbor an exhaustion immunophenotype distinct from that of clear cell RCC. Our findings comprehensively define the clinical and molecular features of tRCC and may inspire new therapeutic hypotheses.
Keywords: Translocation renal cell carcinoma, genomics, TFE3, TFEB, MITF, NRF2, VEGFR, immune checkpoint inhibition, immunotherapy, oxidative stress
INTRODUCTION
Translocation renal cell carcinoma (tRCC) is an aggressive subtype of non-clear cell kidney cancer that comprises up to 5% of all RCCs in adults and up to 50% of RCCs in children (Kauffman et al., 2014; Moch et al., 2016). Prior case series have suggested that tRCC has a demographic profile that is distinct from more common subtypes of kidney cancer, with a younger age at diagnosis, advanced stage at presentation, and a female predominance (Argani et al., 2007; Caliò et al., 2019; Xu et al., 2015). Biologically, tRCCs are driven by activating gene fusions involving transcription factors in the MiT/TFE gene family (Baba et al., 2019a; Clark et al., 1997; Linehan, 2012; Linehan et al., 2019; Sidhar et al., 1996; The Cancer Genome Atlas Network, 2016; Zhong et al., 2010). There are currently no molecularly-targeted therapies specific to tRCC and effective treatments for this aggressive cancer remain a major unmet medical need.
A significant barrier to the development of mechanism-inspired therapeutics for tRCC is an incomplete understanding of the molecular landscape and clinical features of the disease. Owing to the rarity of tRCC, prior genomic profiling studies have been limited in scope. While MiT/TFE fusions are universal in tRCC, it remains unclear whether there are co-occurring genetic alterations or transcriptional programs that represent additional defining features of the disease (Malouf et al., 2013, 2014; Marcon et al., 2020). Like the molecular landscape, the clinical treatment landscape in tRCC is also largely undefined, with no established standard of care. As a result, patients with tRCC are typically treated with therapies originally developed for clear cell RCC (ccRCC) (Choueiri and Motzer, 2017), including vascular endothelial growth factor receptor inhibitors (VEGFR-TKI), multikinase inhibitors (cabozantinib), mTOR inhibitors, or immune checkpoint inhibitors (ICIs). Although some responses to each of these classes of agents have been reported in tRCC, outcomes have been variable between series, and it remains unclear which class(es) of therapeutics are best suited to the biology of tRCC (Ambalavanan and Geller, 2019; Boilève et al., 2018; Chanzá et al., 2019; Choueiri et al., 2010; Damayanti et al., 2018; Malouf et al., 2010; Rua Fernández et al., 2018).
An intriguing feature of tRCC is that it can exhibit diverse histologic features that may mimic almost all other subtypes of RCC (Hayes et al., 2015; Wang et al., 2018). As a result, tRCC cases have been retrospectively identified within ccRCC and papillary RCC (pRCC) sequencing cohorts (Chen et al., 2016a; Ricketts et al., 2018a; The Cancer Genome Atlas Network, 2016). In this study, we leveraged this “histologic overlap” between tRCC and other RCC subtypes to identify tRCC cases from across multiple genomic, clinical trial, and retrospective datasets. We combined these cases with profiling of prospectively identified patients with tRCC to comprehensively characterize the molecular landscape, clinical features, and treatment outcomes for this disease.
RESULTS
Identification of tRCC Cases in Large-scale Clinical and Genomic Datasets
To comprehensively characterize both the molecular and clinical features of tRCC, we interrogated RCC cases across multiple large-scale datasets. In a retrospective analysis of patients with metastatic RCC from the Dana-Farber/Harvard Cancer Center (Harvard cohort), we identified 734 patients with ccRCC, 97 patients with pRCC, 23 patients with chromophobe RCC (chRCC), and 19 patients with tRCC. Patients with tRCC were identified on the basis of positive TFE3 fluorescence in situ hybridization (FISH) or strongly positive TFE3 immunohistochemistry with FISH not available. Among this cohort, we observed that patients with tRCC had significantly worse outcomes than did patients with the other major histologies of RCC (Figure 1A), a trend that held in an independent metastatic RCC dataset (International Metastatic RCC Database Consortium, IMDC; Figure S1A). Similarly, patients with localized tRCC trended towards the shortest progression-free interval after nephrectomy (Figure 1A). Consistent with smaller case series (Argani et al., 2007; Xu et al., 2015), we used data from three large independent cohorts (Harvard, IMDC, TCGA) to confirm that tRCCs are female-predominant (Figure S1B), present at a younger age (Figure S1C), higher stage (Figure S1D), and are associated with worse clinical prognostic groups in metastatic disease (Figure S1E) as compared with the other major histologies of RCC. Collectively, these data establish tRCC as a disease that predominantly impacts young female patients and is more aggressive than other forms of RCC in both the localized and metastatic settings.
Figure 1 |. Identification of tRCC cases in multiple clinical and molecular datasets.

A,Top, Kaplan-Meier curves for time-to-treatment failure in metastatic ccRCC, pRCC, chrRCC, or tRCC (Harvard cohort). Bottom, Kaplan-Meier curves for progression-free interval for localized ccRCC, pRCC, chrRCC, or tRCC (TCGA cohort). P-values were calculated by pairwise log-rank test. B, Representative H&E micrographs (x10) of cases originally included in the TCGA ccRCC or pRCC sequencing cohorts. The right case in each pair was subsequently found to have a TFE3 gene fusion on RNA-Seq. Scale bar: 100 μm. C, Aggregation of tRCC cases from across 9 independent NGS datasets. The data type(s) analyzed are indicated for each dataset. tRCC cases were identified based on the presence of a fusion involving an MiT/TFE family member (see STAR Methods). The number and proportion of tRCC samples as well as number of total RCC samples is indicated for each dataset.
To aggregate tRCC cases for genomic analysis, we leveraged the fact that tRCCs have been reported to share overlapping histologic features with the most frequent histologic subtypes of kidney cancer (ccRCC and pRCC) (Sukov et al., 2012). As a result, a small number of tRCC cases – harboring defining MiT/TFE fusions – have been inadvertently included in several RCC genomic datasets (Chen et al., 2016a; Durinck et al., 2015; Gao et al., 2018; Motzer et al., 2020; Sato et al., 2013). As an example, tRCC cases with histopathologic features indistinguishable from ccRCC and pRCC were included in the Cancer Genome Atlas (TCGA) effort (Chen et al., 2016a; Gao et al., 2018) (Figure 1B and Table S1). Building on this observation, we interrogated fusion calls and/or FISH results for 2818 RCCs across 9 independent datasets profiled by DNA sequencing (exome, genome, or panel sequencing) and/or RNA sequencing (Figure 1C). We identified a total of 90 tRCCs with genomic (DNA) or transcriptomic (RNA) profiling data (42 with only genomic data, 16 with only transcriptomic data, 32 with both, Figure S1F).
Somatic Mutational and Copy Number Alterations in tRCC
We analyzed the 74 tRCC cases on which DNA profiling data were available to elucidate the genomic landscape of tRCC. Among these cases, 36 were profiled via WES, 3 via WGS, and 35 via panel sequencing (STAR Methods) and 60 samples were from primary tumors, 13 were from metastasis samples and 1 was unknown. tRCC cases showed few mutations overall, with a median (interquartile range) tumor mutational burden of 0.82 (0.43 – 1.28) per megabase (on WES), a rate significantly lower than ccRCC and pRCC and comparable to chRCC (Figure S2A), with similar trends for all (Figure S2B) and frameshift (Figure S2C) indels. Of the most frequently mutated genes in tRCC, none exceeded a frequency of 10% (Figure 2 and Figure S2D). These included genes involved in the DNA Damage response (ATM (8.1%), BRCA2 (8.1%), and WRN (4.4%)), genes involved in ATP-dependent chromatin remodeling via the SWItch/Sucrose Non-Fermentable (SWI/SNF) complex (ARID1A (5.4%), SMARCA4 (5.4%)), and mutations in TERT (6.8%; primarily non-coding mutations in the TERT promoter) (Huang et al., 2013). Among the 52 cases with gene-level copy number profiling data available, the only recurrent focal alteration in tRCC was homozygous deletion at the CDKN2A/2B locus (9p21.3), found in 19.2% of cases. Notably, 50.0% (37/74) of cases in our cohort showed no detectable somatic alterations in either the most frequently mutated tRCC genes or genes that are significantly mutated in clear cell, papillary, or chromophobe RCC (Figure 2 and Figure S2D) (Ricketts et al., 2018a). Analysis of the burden of copy number alterations in tRCC (as quantified by TCGA’s aneuploidy score and MSK-IMPACT’s fraction of genome altered) also showed that tRCCs have a significantly lower burden of copy number alterations compared to ccRCC, pRCC, and chRCC (Figure S2E). Analysis of arm-level copy number alterations among 17 tRCC cases in the TCGA cohort (Taylor et al., 2018) revealed the most frequent alterations to be hemizygous loss of chromosome 3p (28.6%; though markedly less frequent versus ccRCC 86.8%; p<0.001), chromosome 9p (23.5%), chromosome 18 (29.4%), and chromosome 22q (18.8%), as well as gain of 17q (20.0%) (Figure S2F). Several of these alterations are defining features of other tumor types of neural/neuroendocrine origin, including monosomy 18 in small intestinal neuroendocrine tumors (Cunningham et al., 2011), 17q gain in neuroblastoma (Brady et al., 2020), and 22q loss in pediatric ependymoma (Suarez-Merino et al., 2005).
Figure 2 |. Landscape of genomic alterations in tRCC.

CoMut plot of mutational and copy number alterations in tRCC across all datasets. Genes listed are those previously reported as significantly mutated in ccRCC, pRCC, and chrRCC (Ricketts et al., 2018a) (indicated in the left track). Greyed out squares indicate genes were not assessed in the bait set of the version of the panel used for that sample (see STAR Methods). Gray annotations for sample type and MiT/TFE indicate missing values.
We next conducted an enrichment analysis of driver gene alteration frequencies between tRCC and other RCC subtypes. We computed pairwise enrichment (tRCC versus ccRCC, pRCC, and chRCC separately) for each locus within each dataset, then used a random-effects meta-analysis to obtain a pooled estimate of gene alteration enrichment or depletion in tRCC versus comparator RCC histologies across datasets (see STAR Methods). We found that the genes most frequently altered in tRCC – most notably CDKN2A/2B locus (9p21.3) deletions – are highly enriched in tRCC versus other RCC histologies. In contrast, mutations in genes that are significantly mutated in ccRCC, pRCC, and chRCC tended to be depleted in tRCC (Figure S2G). Thus, while tRCCs are genomically quiet overall (with a lower mutational and copy number alteration burden than other RCC histologies), a subset harbor recurrent alterations -- distinct in profile from those seen in other RCCs -- that may cooperate with the MiT/TFE fusion to drive cancer.
Structure of MiT/TFE fusions in tRCC
We next turned our attention to further analysis of the MiT/TFE fusion, the defining genetic lesion in tRCC. Across the combined tRCC cohort, we found that the vast majority of cases (78 cases; 88.6%) harbored TFE3 fusions, while the remainder harbored TFEB (8 cases; 9.1%) or MITF (2 cases; 2.3%) fusions (Figure 3A). Seventeen different MiT/TFE fusion partners were observed across the cohort and the spectrum of fusion partners was largely distinct between TFE3, TFEB, and MITF (Figure S3A). The most common TFE3 fusion partners were ASPSCR1, SFPQ, PRCC, and NONO. Interestingly several chromosomes harbored multiple potential MiT/TFE fusion partners (chr1, chr17, chrX) (Figure 3B). MiT/TFE fusion partners showed an enrichment for ontology terms involving RNA processing and RNA splicing, and this was driven predominantly by TFE3 fusion partners (Figure 3C and Figure S3B–C). Analysis of fusion breakpoints revealed that all fusions preserved the C-terminal helix-loop-helix/leucine zipper domain (HLH-LZ) of the MiT/TFE transcription factor, the region of the protein critical for dimerization and DNA binding (Hershey and Fisher, 2004); the activation domain was variably preserved in the fusion product (Figure 3D and Table S2). Interestingly, large N-terminal portions of most TFE3 fusion partners were included in the fusion, including, domains with RNA-binding potential in cases where the fusion partner was an RNA binding protein. In contrast, TFEB and MITF fusion partners tended to preserve less of the N-terminal fusion partner in the fusion product (Figure 3E). Overall, our results point to a coherent logic to the structure of MiT/TFE fusions despite great diversity in fusion partners and breakpoints.
Figure 3 |. Structure of MiT/TFE fusions in tRCC.

A, Number and percentage of tRCC cases displaying gene fusions involving TFE3, TFEB, or MITF across all datasets analyzed. B, Genomic location of MiT/TFE fusion partners. Stroke thickness is proportional to the number of times a given gene was observed to be an MiT/TFE fusion partner across all datasets analyzed. C, Gene ontology terms (GO Biological Process) enriched amongst MiT/TFE fusion partners. P-values computed using Fisher’s exact test using Enrichr (Xie et al., 2021). D, Breakpoints observed within TFE3, TFEB, or MITF across all samples analyzed. Solid portion represents the portion of the MiT/TFE gene retained within the oncogenic fusion product. Fusion partner genes observed to join at a given breakpoint are listed. Functional domains within each MiT/TFE gene are indicated (legend in Table S2). E, Breakpoints observed within MiT/TFE partner genes. Solid portion represents the portion of each partner gene retained within the oncogenic fusion product. Genes are grouped by whether they were observed to fuse with TFE3 (top), TFEB (middle), or MITF (bottom). Functional domains within each MiT/TFE partner gene are indicated (legend in Table S2).
Distinctive transcriptional features of tRCC
Given our observation that most tRCCs harbor few genomic alterations aside from the MiT/TFE fusion, we next sought to determine whether the transcriptional program of tRCC is largely driven by the fusion. We ectopically expressed either wild type (WT) TFE3 or four of the most common TFE3 fusions (ASPSCR1-TFE3, NONO-TFE3, PRCC-TFE3, SFPQ-TFE3) in 293T cells and performed RNA-Seq (Figure 4A and Table S3). We derived a 139-gene transcriptional signature based on genes differentially expressed upon TFE3 fusion, but not WT TFE3, expression (Figure S4A, Table S4 and STAR Methods). Subsequently, we performed unsupervised hierarchical clustering using this fusion-specific signature. We observed that tRCC samples clustered tightly together across four independent datasets (Campbell et al., 2020; Hoadley et al., 2018; Motzer et al., 2020; Wang et al., 2020) (Figure 4B and Figure S4B). Clustering based on our fusion-derived signature resulted in superior grouping of tRCCs than did clustering based on the 1000 most variable genes in each dataset (Figure S4C). We then performed differential expression analysis to identify a consensus set of genes overexpressed in tRCC as compared with all comparator tumor types. In each dataset, we performed pairwise comparisons between tRCC and each comparator tumor type to identify genes selectively overexpressed in tRCC (q-value <0.05; Figure S4D–E). We identified a consensus list of 76 genes that were selectively overexpressed in tRCC (q-value <0.05) in 9/13 or more pairwise comparisons (Figure 4C and Figure S4E). Notably, several of these have been previously annotated as MITF target genes (Hoek et al., 2008; Lachmann et al., 2010) on the basis of prior ChIP-Seq studies and include genes involved in neuronal development (SNCB, TRIM67, IRX6) (Boyer et al., 2018; Canela et al., 2012; Star et al., 2012), ion flux and the antioxidant stress response (SQSTM1, TMEM64, SLC39A1) (Kim et al., 2013; Rezaei et al., 2008; Star et al., 2012), and lysosomal function/mTORC1 signaling (RAB7A, RHEB, RRAGC, ATP6V1C1) (Groenewoud and Zwartkruis, 2013; McConnell et al., 2015; Sun et al., 2020). We performed gene set enrichment analysis (GSEA) (Subramanian et al., 2005) using hallmark gene sets (Liberzon et al., 2015) to identify pathways selectively activated in tRCC. This revealed a strong enrichment for gene sets pertaining to reactive oxidative species (ROS) sensing and the response to oxidative stress and xenobiotics (top tRCC-enriched gene sets shown in Figure 4D). In sum, the transcriptional program of tRCC appeared to be driven by the MiT/TFE fusion and resulted in overexpression of genes implicated in mTORC1 signaling, antioxidant stress response, ROS sensing, and the response to oxidative stress and xenobiotics.
Figure 4 |. Distinctive transcriptional features of tRCC.
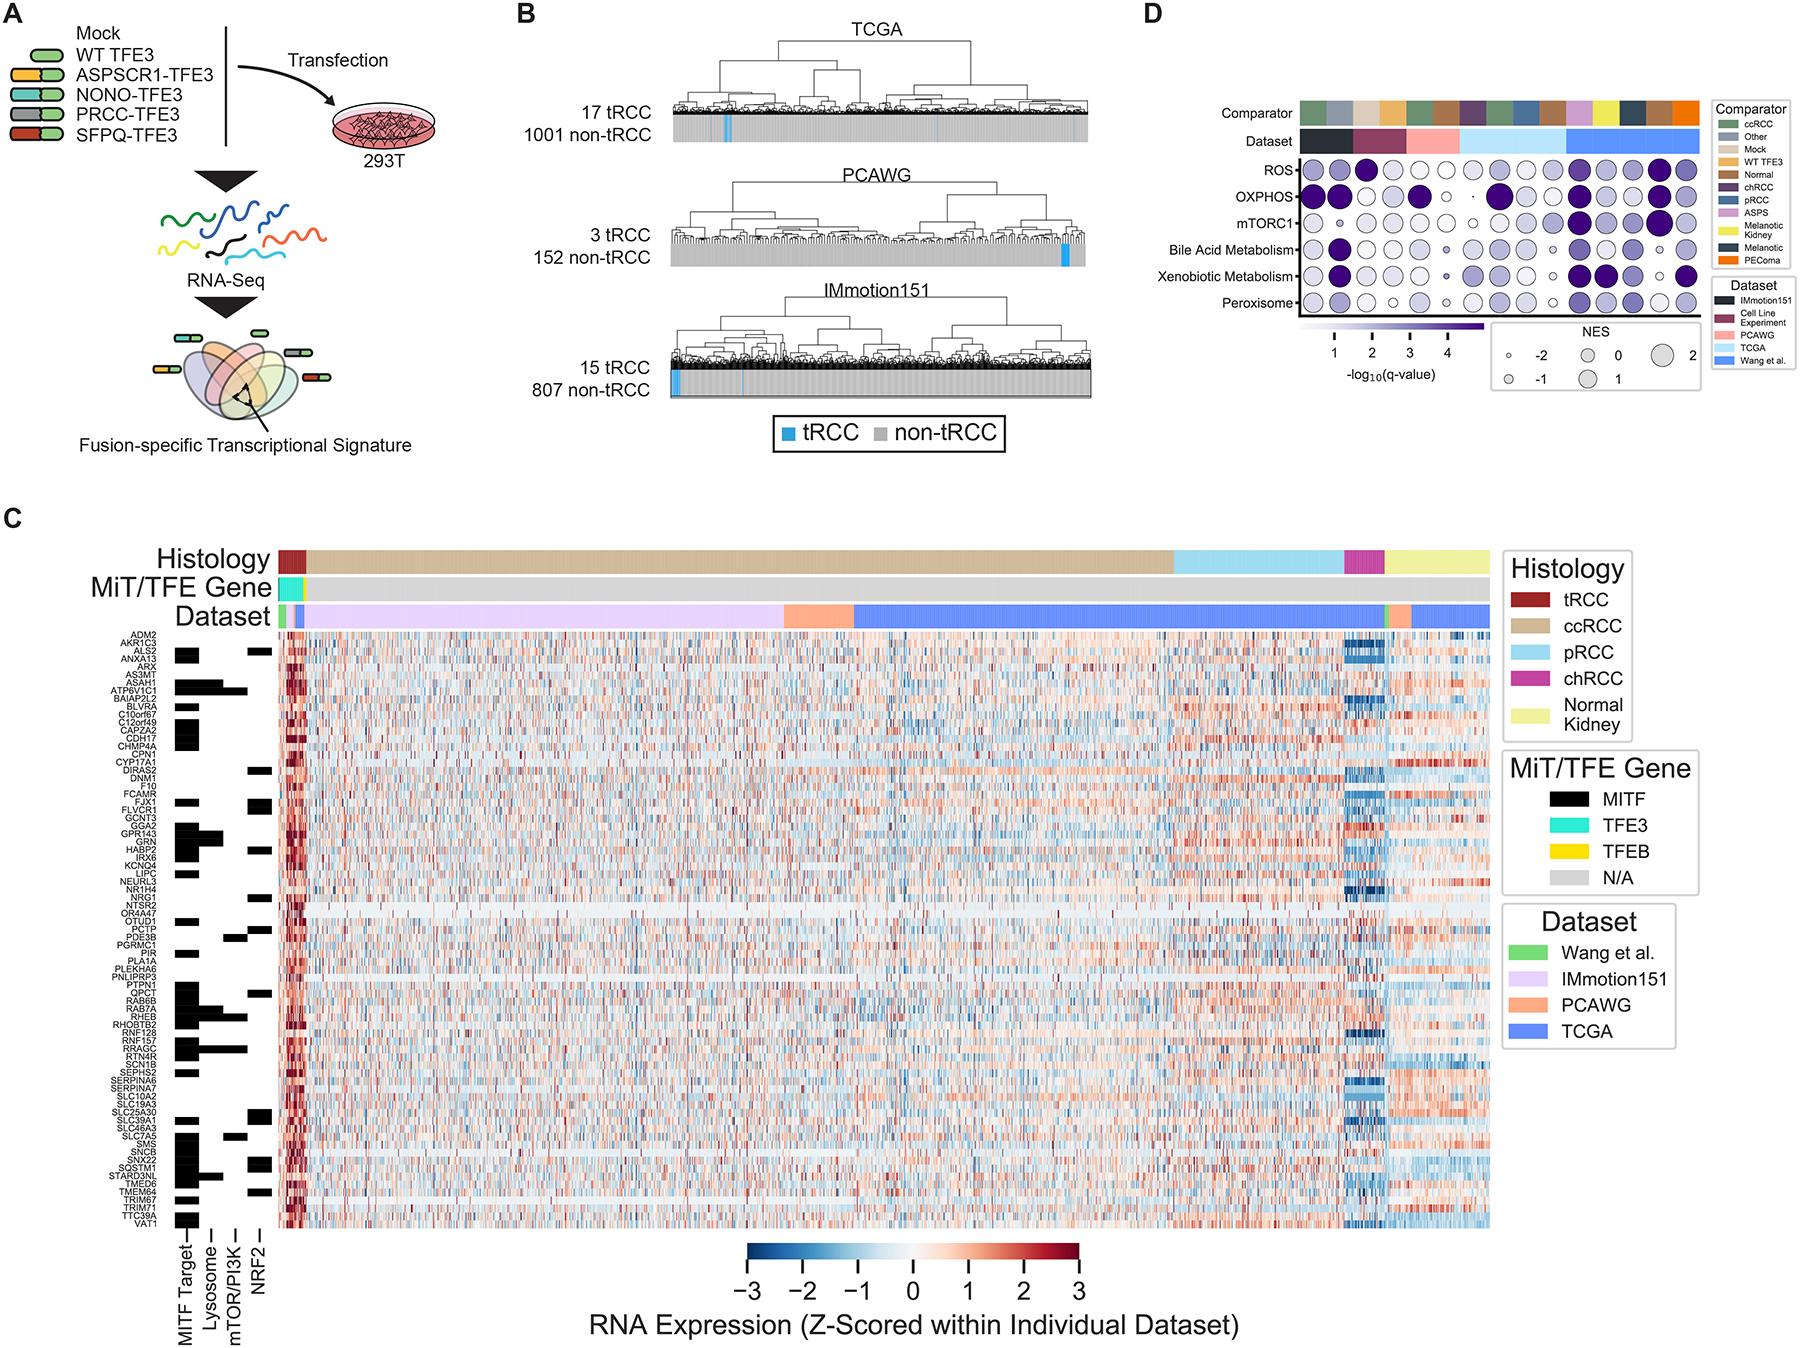
A, Schematic of in vitro experiment used to derive TFE3-fusion-specific transcriptional signature. B, Transcriptome sequencing data from three independent datasets (TCGA, PCAWG, IMmotion151) were subjected to unsupervised hierarchical clustering using the fusion-specific signature derived in (A). Blue bars indicate MiT/TFE-fusion-positive cases within each dataset. Gray bars indicate other RCC histologic subtypes or normal kidney. C, Heatmap of genes overexpressed in tRCC as compared with other RCC subtypes or normal kidney, across all datasets (see Figure S4). Membership of genes in key pathways related to tRCC pathogenesis is indicated in the track at left. D, Gene set enrichment analysis showing top enriched Hallmark pathways in tRCC samples versus comparators across all datasets analyzed. Dataset and pairwise comparison across which the GSEA was performed is indicated in the track at the top of each column. Dot size is proportional to normalized enrichment score (NES) in tRCC versus comparator; dot color reflects -log10(q-value) for the enrichment. The q-value was calculated using the false-discovery rate correction of the phenotype permutation-based two-sided test p-value used with GSEA.
An antioxidant response signature associated with resistance to targeted therapies in tRCC
The transcription factor NRF2 (nuclear factor erythroid-derived-2-like 2, NFE2L2) is a master regulator of the cellular antioxidant response and controls the expression of genes involved in the response to xenobiotics and oxidative stress (Menegon et al., 2016). Notably, activation of the NRF2 pathway has been reported in certain subsets of RCC via diverse mechanisms that include somatic alteration or hypermethylation of NRF2 pathway members (Clerici and Boletta, 2020) and the production of oncometabolites that modify and inhibit KEAP1, a negative regulator of NRF2 (Linehan et al., 2019; Ricketts et al., 2018a; The Cancer Genome Atlas Network, 2016). Given evidence of activated ROS-sensing in tRCC (Figure 4C–D), we derived an NRF2 activity score using single sample GSEA (ssGSEA) (Hänzelmann et al., 2013) (based on a 55-gene NRF2 signature (Takahashi et al., 2020)) across all RCC samples with available transcriptome profiling data (46 total tRCC samples across 4 datasets; NRF2 activity calculated and Z-scored separately within each individual dataset). We observed that NRF2 activity was universally high amongst tRCC samples as compared with other RCC types and normal kidney tissue (Figure 5A).
Figure 5 |. tRCC displays activated NRF2 pathway signaling and a relative resistance to targeted therapies.
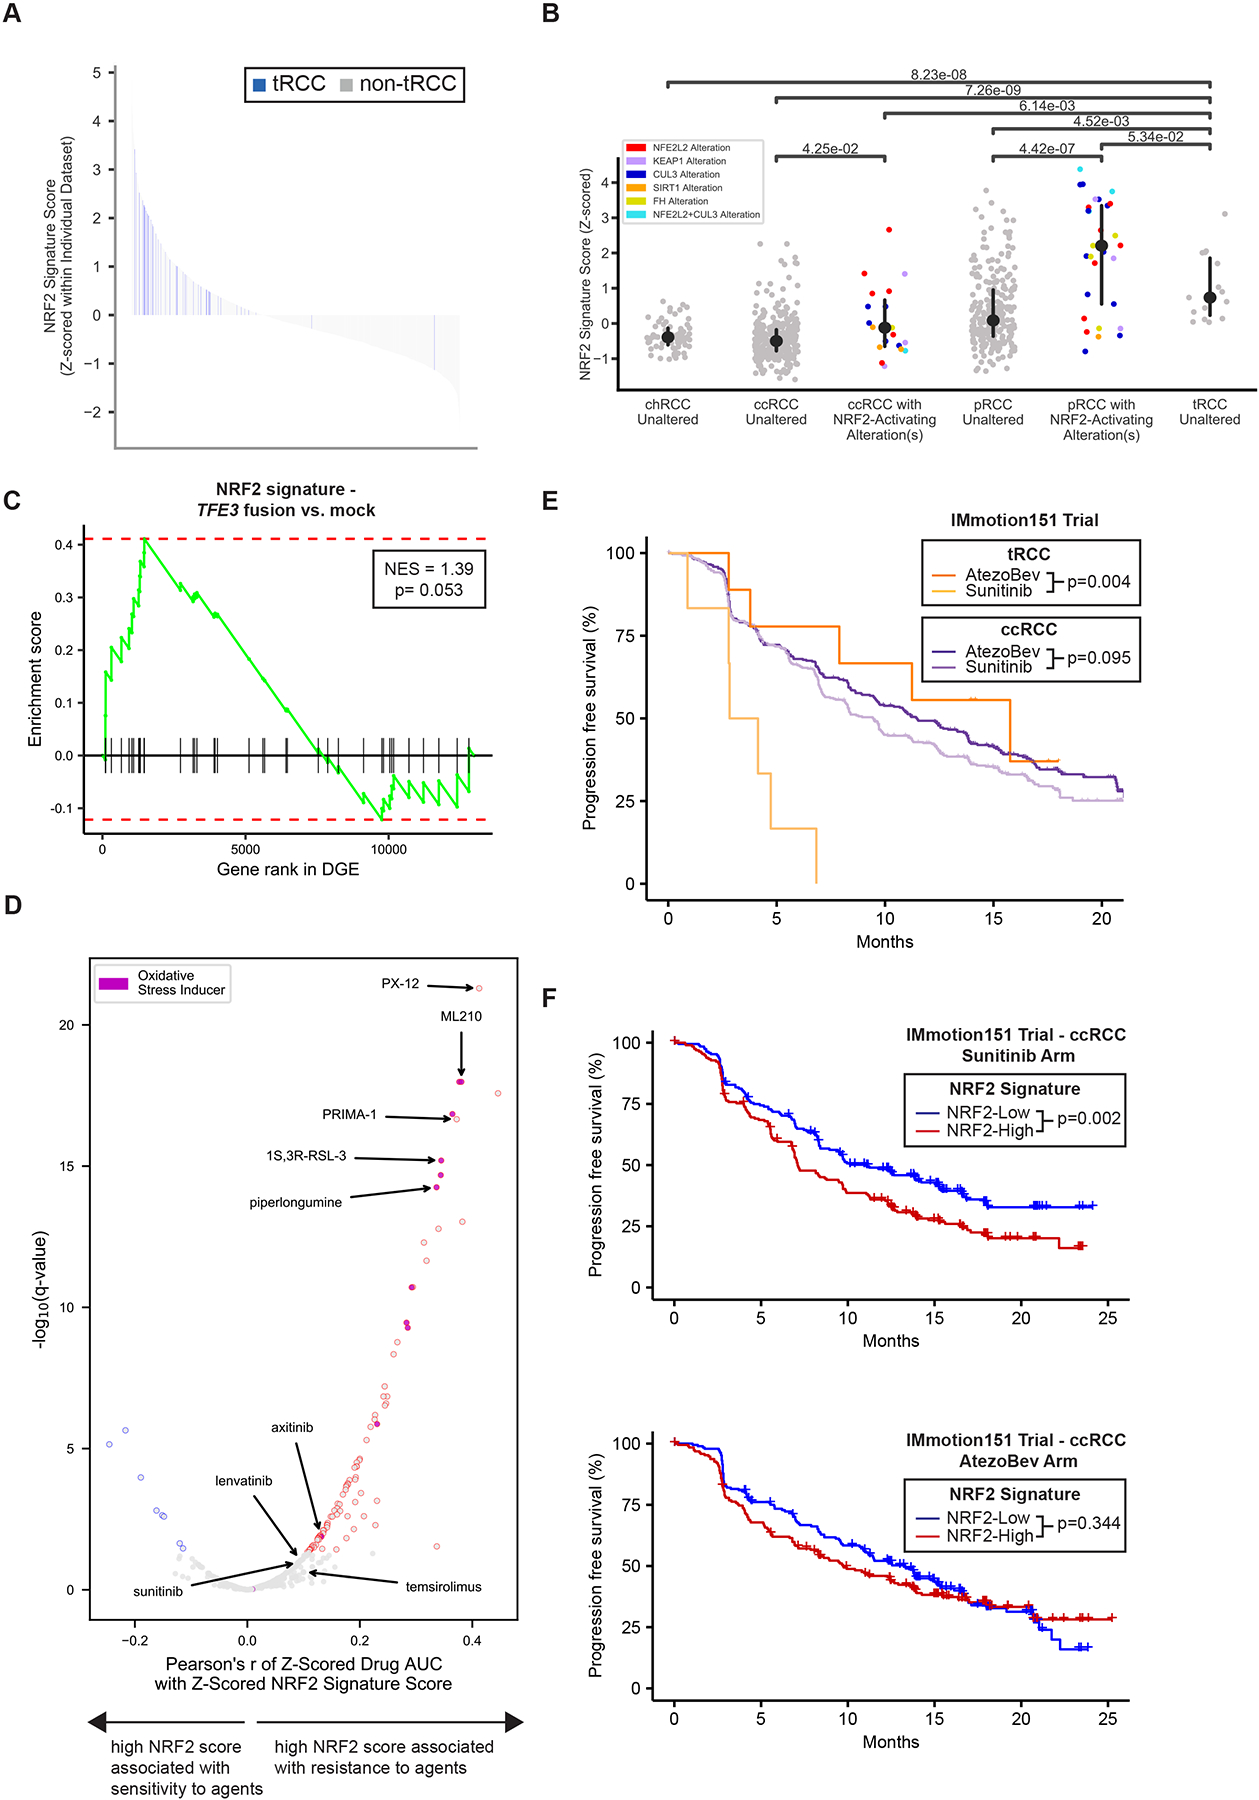
A, Waterfall plot showing NRF2 signature score for all RCC samples across all datasets analyzed. tRCC samples are depicted in blue (n=46); other samples (ccRCC, pRCC, chRCC, normal kidney, or other tumors) are shown in gray (n=1999). B, NRF2 signature score for TCGA RCC samples of the indicated histologies. For each histology, samples with somatic alterations in the NRF2 pathway are shown separately. No chRCC or tRCC samples displayed somatic alterations in the NRF2 pathway P-values are reported and are derived using a Wilcoxon rank-sum test. C, Gene set enrichment analysis showing enrichment of NRF2 gene signature in 293T cells expressing TFE3 fusions (4 conditions with 3 replicates each) versus mock (untransfected, 3 replicates) control condition. D, Volcano plot showing correlation of NRF2 signature score with drug sensitivity in the Broad Institute Cancer Therapeutics Response Portal dataset (Rees et al., 2016). A high NRF2 signature score is significantly associated with resistance to the agents shown in red. Agents annotated to act through the induction of oxidative stress or ferroptosis are colored in purple. Selected targeted agents used in the treatment of kidney cancer are labeled. The q-values represent Benjamini-Hochberg corrected p-values which were generated as reported in STAR Methods. E, Progression-free survival curves for patients with tRCC (dark and light orange) or ccRCC (dark and light purple) treated with either atezolizumab and bevacizumab (AtezoBev) or sunitinib in the randomized Phase III IMmotion151 trial. P-values were calculated by log-rank test. F, Progression-free survival curves for patients with ccRCC with high (red) or low (blue) NRF2 signature score treated with either sunitinib (top) or atezolizumab + bevacizumab (AtezoBev, bottom) on the IMmotion151 trial. P-values were calculated by log-rank test. For E-F, NRF2 signature score was dichotomized at the median in each arm.
We next investigated whether high NRF2 activity in tRCC was attributable to somatic alterations in this pathway. We observed that somatic alterations in the NRF2 pathway (most commonly KEAP1 or NFE2L2 alteration) were associated with an increased NRF2 activity score in ccRCC and pRCC, as was a CpG island methylator phenotype (CIMP), consistent with prior reports (Figure 5B and Figure S5A) (Ricketts et al., 2018a). Interestingly, however, tRCC samples showed uniformly elevated NRF2 activity, comparable to ccRCC/pRCC samples with somatic alterations in the NRF2 pathway (Figure 5B), despite having no detectable NRF2 pathway alterations. The expression of strong oncogenes has been linked to NRF2 pathway activation (DeNicola et al., 2011) and our transcriptomic analyses revealed overlapping targets between NRF2 and MITF (Figure 4C, hypergeometric one-tailed p-value< 0.001). Consistently, we observed that the NRF2 gene signature was enriched upon ectopic expression of all TFE3 fusions in 293T cells as compared to the mock treatment condition, suggesting that expression of the TFE3 fusion may be directly linked to activation of the NRF2 pathway (Figure 5C).
Activation of the NRF2 pathway has been associated with resistance to a number of ROS-producing drugs, including inducers of ferroptosis, a regulated form of iron-dependent oxidative cell death (Harris et al., 2019; Takahashi et al., 2020; Xue et al., 2020). We calculated a correlation between NRF2 activity score and drug sensitivity across 593 cell lines and 481 compounds assayed in the Cancer Therapeutics Response Portal (Rees et al., 2016). Strikingly, high NRF2 activity was associated with relative resistance to almost all agents assayed, including several targeted therapies used in the treatment of RCC (e.g. sunitinib, axitinib, lenvatinib, temsirolimus), and most notably, to multiple compounds known to induce electrophilic stress and oxidative cell death (e.g. PRIMA-1, PX-12, piperlongumine, ML-210, RSL-3) (Figure 5D) (Viswanathan et al., 2017). In order to uncover potential vulnerabilities of this otherwise drug-resistant state, we next surveyed pooled genetic (shRNA and CRISPR) screening data generated as part of the Cancer Dependency Map effort (Ghandi et al., 2019; Tsherniak et al., 2017) . In both the CRISPR and shRNA datasets, we found that the outlier dependency of NRF2-high cells is NFE2L2 itself (Figure S5B). Although tRCC cell lines are not currently included among those assayed in the Cancer Dependency Map effort, we separately validated that three tRCC cell lines all demonstrated variable levels of dependency on NFE2L2 knockdown, consistent with the notion that direct inhibition of NRF2 is a vulnerability of the NRF2-high state observed in tRCC (Figure S5C).
Next, to determine whether elevated NRF2 activity might be associated with resistance to targeted therapies in patients, we evaluated molecular data from the IMmotion151 trial (NCT02420821), a Phase III trial of 915 patients with RCC with clear cell or sarcomatoid histology who were randomized to either sunitinib (multitargeted kinase inhibitor against VEGFRs and PDGFRs) or the combination of atezolizumab (monoclonal antibody targeting PD-L1) and bevacizumab (monoclonal antibody targeted VEGF-A) (Rini et al., 2019). RNA-Seq performed on tumor biopsies from patients enrolled on this trial revealed 15 patients with TFEB/TFE3 translocations among 822 with available RNA-seq data (Figure 1C), of which 6 were treated on the sunitinib arm and 9 were treated on the atezolizumab + bevacizumab (AtezoBev) arm (Motzer et al., 2020). While AtezoBev showed a modest benefit over sunitinib in progression-free survival (PFS) in the overall study and amongst patients with ccRCC, we observed that patients with tRCC receiving sunitinib did dramatically worse than those receiving AtezoBev (median PFS 3.5 months with sunitinib vs. 15.8 months with AtezoBev; log-rank p=0.004). Consistent with this observation, the extent of benefit derived from AtezoBev as compared with sunitinib, in patients with tRCC vs. ccRCC, was significantly greater (histology-by-treatment arm interaction Cox p-value=0.008) (Figure 5E). When patients with ccRCC treated with sunitinib were dichotomized based on NRF2 activity score, those with high-NRF2 scores had shorter PFS compared to with low-NRF2 scores (median PFS 7.1 months for high-NRF2 vs. 11.1 months for low-NRF2; log-rank p=0.002). In contrast, NRF2 activity score was not associated with a significant difference in outcome in patients with ccRCC treated on the AtezoBev arm (Figure 5F). In the CheckMate cohort including 311 patients with ccRCC with available RNA-seq data (pooled analysis of the CheckMate 009 [NCT01358721], 010 [NCT01354431], and 025 [NCT01668784] clinical trials) (Braun et al., 2020), a similar signal was observed whereby patients with ccRCC with a high NRF2 activity score experienced shorter PFS than did those with a low NRF2 activity score (Figure S5D), on the everolimus arm (median PFS 9.7 months for high-NRF2 vs. 14.3 months for low-NRF2; log-rank p= 0.031), but not the nivolumab arm (Motzer et al., 2015). Together, these results indicate that high NRF2 activity – a defining feature of tRCC – is associated with resistance to targeted agents used in the treatment of RCC, but may not preclude responses to ICI.
Response to immune checkpoint inhibition in tRCC
We sought to further explore the possibility that tRCC may be responsive to ICI. Analysis of responses from the IMmotion151 study showed that patients with tRCC derived significantly greater clinical benefit (CB) on AtezoBev than on sunitinib (77.8% with AtezoBev vs. 16.7% with sunitinib; Fisher p-value= 0.041). However, patients with tRCC tended to not derive clinical benefit (no clinical benefit; NCB) from sunitinib as compared with AtezoBev (11.1% with AtezoBev vs. 50.0% with sunitinib; Fisher p-value= 0.235). In contrast, patients with ccRCC tended to have similar CB (65.1% with AtezoBev vs. 64.0% with sunitinib; Fisher p-value= 0.767) and NCB (15.6% with AtezoBev vs. 16.0% with sunitinib; Fisher p-value= 0.923) rates whether they received AtezoBev or sunitinib (Figure 6A).
Figure 6 |. Immunogenomic features of tRCC associated with responses to immune checkpoint inhibition.

A, Percentage of patients with tRCC showing clinical benefit (CB), intermediate clinical benefit (ICB), or no clinical benefit (NCB) to either AtezoBev or sunitinib on the IMmotion151 trial. P-values were calculated by pairwise Fisher’s exact test. B, Swimmer plot showing response types and response times to immune checkpoint inhibitor-based regimens in patients with tRCC in the combined IMDC and Harvard retrospective cohort. Line (L) in which ICI was received as well as specific ICI regimen is indicated to the right of each patient. C, Sample purity in tRCC, ccRCC, chRCC, and pRCC in the TCGA cohort. P-values were calculated by pairwise Wilcoxon’s rank-sum test. D, CD8+ T cell infiltration imputed from gene expression (CIBERSORTx) in tRCC, ccRCC, chRCC, and pRCC in the TCGA cohort. P-values were calculated by pairwise Wilcoxon’s rank-sum test. E, Multiparametric immunofluorescence (x80) for CD8, TIM3, LAG3, and PD1 in representative tRCC cases (top two rows) and ccRCC cases (bottom two rows). Red arrows indicate CD8+PD1+LAG3+TIM3− tumor-infiltrating T cells in tRCC cases. Yellow arrows indicate CD8+PD1+LAG3−TIM3+ tumor-infiltrating T cells in ccRCC cases. F, Quantification of CD8+ T-cell density (top), percentage of CD8+PD1+TIM3−LAG3+ T cells (middle), and percentage of CD8+PD1+TIM3+LAG3− T cells (bottom) in tRCC (n= 11), ccRCC (n= 11), and adjacent normal tissue (from ccRCC cases, n= 10). The immunofluorescence results for the ccRCC and normal (ccRCC adjacent) control samples were reported in a prior study (Braun et al., 2021b). P-values were calculated by pairwise Wilcoxon’s rank-sum test. Scale bar: 25 μm.
In a combined analysis of the IMDC and Harvard datasets, we identified 12 patients with metastatic tRCC who had received ICI in any line of therapy as well as 10 tRCCs that had been treated by TKIs (n=8 sunitinib; n= 2 pazopanib). Among this cohort, 5 achieved either partial response (n=3) or stable disease (n=2) on an ICI-containing regimen, with several ongoing responses (Figure 6B and Figure S6A–B). Overall, in this retrospective combined cohort of patients with tRCC, the response rate (25.0% with ICI and 0% with TKI; Fisher p-value=0.220) and overall survival (OS; median OS 62.4 months with ICI and median OS 10.3 months with TKI; log-rank p-value= 0.267) tended to be increased on ICI-based regimens compared to TKIs (Figure S6C–D), corroborating the result that patients with tRCC may derive greater benefit from ICI-based therapies than VEGF-targeted therapies.
We next examined whether immunogenomic features of tRCC could explain responses to ICI in this RCC subtype, despite a low burden of mutations and CNAs (Figure 2A and Figure S2). In the TCGA cohort, tumor purity (which is inversely correlated to immune cell infiltration), was lower in tRCC than chRCC (a classically ICI-resistant subtype(McDermott et al., 2021; McGregor et al., 2020)) (Wilcoxon p-value< 0.001), similar to pRCC (Wilcoxon p-value= 0.160), and higher than ccRCC (Wilcoxon p-value= 0.005) (Figure 6C). Consistently, immune deconvolution analyses (CIBERSORTx (Newman et al., 2019)) showed that the inferred percentage of cluster of differentiation 8 (CD8)+ T cells was higher in tRCC than in chRCC (Wilcoxon p-value< 0.001), and comparable to that seen in ccRCC (Wilcoxon p-value= 0.190) and pRCC (Wilcoxon p-value=0.150) (Figure 6D). Additionally, PD-L1 protein levels on tumor-infiltrating immune cells, as assessed by IHC, in patients on the IMmotion151 trial, were comparable between patients with tRCC and ccRCC (41.8% with ccRCC vs. 33.3% with tRCC; Fisher p-value= 0.604) (Figure S6E).
Finally, we sought to more carefully characterize the CD8+ tumor-infiltrating T cells in tRCC via multiparametric immunofluorescence (Ficial et al., 2021; Pignon et al., 2019). We examined 11 tRCC cases for T cells expressing CD8 or the immune checkpoint markers PD1, T-cell immunoglobulin and mucin-domain containing-3 (TIM3), and lymphocyte activation protein-3 (LAG3), and compared the immune infiltrate to that of 11 ccRCC cases (including 10 with adjacent normal tissue) whose immunofluorescence results had originally been reported in the study by Braun et al. (Braun et al., 2021b). While the overall CD8+ T cell density tended to be lower in tRCC samples than in ccRCC samples (Wilcoxon p-value = 0.065) (Figure 6E–F), the percentage of CD8+PD1+TIM3−LAG3− cells (the subset predictive of a response to PD1/PD-L1-based ICI (Ficial et al., 2021; Pignon et al., 2019)) was not significantly different between tRCC and ccRCC (Figure S6F). Moreover, the profile of immune checkpoint markers differed significantly between ccRCC and tRCC; tRCC cases displayed a higher percentage of CD8+PD1+TIM3−LAG3+ T cells (Wilcoxon p-value = 0.009) whereas ccRCC cases displayed a higher percentage of CD8+PD1+TIM3+LAG3− T cells (Wilcoxon p-value = 0.040) (Figure 6E–F). Altogether, our results are consistent with the notion that tRCCs may benefit from ICI as a result of a permissive immune microenvironment characterized by a tumor-infiltrating T cell profile distinct from that observed in ccRCC.
DISCUSSION
We performed a comprehensive and multicenter characterization of the molecular and clinical features of 152 tRCCs. While prior studies have identified some genomic and transcriptional features of tRCC, the broader extensibility of these findings, their clinical actionability, as well as an understanding of how they compare to other subtypes of RCC have remained unclear (Malouf et al., 2013, 2014; Marcon et al., 2020). Our integrative analysis spans genomic and transcriptomic data, immunophenotypic analysis, functional validation, and clinical outcome data from both retrospective cohorts and randomized clinical trials. From these efforts, an increasingly well-defined landscape of tRCC emerges.
The defining – and often singular – genomic alteration in tRCC is the MiT/TFE fusion. Our results show that TFE3 is by far the most frequently involved MiT/TFE gene. While there exists a great diversity of MiT/TFE fusion partners, these partners are highly enriched on certain chromosomes (chr1, chr17, chrX), raising intriguing questions about whether patterns of spatial genome organization underlie these recurrent translocations (Engreitz et al., 2012; Lin et al., 2009; Roix et al., 2003). Moreover, our analysis of breakpoint locations across fusions highlights that the vast majority of TFE3 fusions arise via in-frame events that preserve functional domains from both TFE3 and its partner protein (most of which are RNA binding proteins); this opens the possibility that TFE3 fusion partners may confer neomorphic activity to the fusion product. In contrast, much smaller regions of TFEB and MITF partner genes appear to be involved in the fusion product. The enrichment of genes involved in RNA splicing and processing in the fusions suggests that alternative splicing may be playing a key role in tRCC oncogenesis, which merits further study. Whether differences in fusion structure translate to histologic and/or phenotypic differences between TFE3-, TFEB-, and MITF-translocation RCC warrants further investigation (Inamura et al., 2012; Kauffman et al., 2014; Xia et al., 2018). While we could not formally assess the clonality of the MiT/TFE fusion in this study, the MiT/TFE fusion has been previously shown to be sufficient for tRCC tumorigenesis in a mouse model (Baba et al., 2019b) and the nuclear expression of the TFE3 protein by IHC has been observed to be diffuse in tRCC (Trpkov et al., 2021), further suggesting that the MiT/TFE fusion is an early clonal event in tRCC.
Overall, tRCCs are genomically quiet tumors with a low mutational and copy number alteration burden, a reduced frequency of alterations in genes known to be significantly mutated in other RCC subtypes, and few recurrent alterations aside from the MiT/TFE fusion. Interestingly, despite the significant histologic overlap of tRCC with ccRCC and pRCC, true gnomically defined tRCC shares very little molecular overlap with either ccRCC or pRCC, which illustrates the limitations of conventional Hematoxylin-Eosin (H&E) staining in distinguishing tumor types with different molecular drivers. This phenomenon has previously been observed with pRCC itself (Chen et al., 2016b; Ricketts et al., 2018b; The Cancer Genome Atlas Network, 2016; Trpkov et al., 2021), non-small cell lung cancer (Sequist and Neal, 2021), and other tumors. A notable exception is homozygous loss at chromosome 9p21.3, which harbors the CDKN2A/2B genes, and is found in 19.2% of tRCC cases. Loss of CDKN2 proteins may be associated with high CDK4/6 activity and may sensitize to CDK4/6 inhibitors (Álvarez-Fernández and Malumbres, 2020). Co-deletion of MTAP, which is located in close proximity to CDKN2A, may sensitize to PRMT5 inhibitors (Kryukov et al., 2016; Mavrakis et al., 2016). Mutations in TERT (primarily in the promoter region) were also found in 6.8% of cases. Notably, both CDKN2A/B loss and TERT promoter mutations are defining genetic features of malignant melanoma, a cancer type driven by activated MITF signaling (Garraway et al., 2005; Huang et al., 2013; Liu et al., 1999; Walker et al., 1998). Less frequent alterations in the cohort included multiple genes involved in the DNA damage response (ATM, BRCA2, WRN), though the lack of specific variant information, the absence of matched normal-based filtering of mutation calls for some samples, and low alteration frequency preclude drawing strong conclusions about this class of mutations.
We identified a heightened response to oxidative stress as a transcriptional hallmark of tRCC. Activated NRF2 signaling has been linked to oncogenesis and resistance to chemotherapies in various contexts (Sporn and Liby, 2012). Prior studies have indicated that small subsets of both ccRCC and pRCC display heightened NRF2 signaling, generally linked to somatic alterations or DNA methylation in the NRF2 pathway (Li et al., 2013; Ricketts et al., 2018a; The Cancer Genome Atlas Network, 2016). Interestingly, our results suggest that NRF2 signaling is uniformly activated in tRCC in the absence of detectable somatic alterations in the NRF2 pathway. Notably, multiple NRF2 target genes are also annotated as MiT/TFE targets (Figure 4C), suggesting a direct link between MiT/TFE fusions and the NRF2 pathway in tRCC. Our results may explain why tRCCs (and ccRCCs with elevated NRF2 signaling) display worse outcomes with sunitinib than with ICI in clinical datasets, and are consistent with in vitro data suggesting that NRF2 confers resistance to sunitinib and other TKIs (Clerici and Boletta, 2020; Huang et al., 2019; Ji et al., 2019). Whether this signal holds for extended spectrum kinase inhibitors such as cabozantinib and lenvatinib remains to be determined, as patients receiving these therapies were not represented in our retrospective cohort. We validate that NFE2L2 represents a genetic dependency of the NRF2-high state, and suggest that specific NRF2 pathway inhibitors, if developed, may be effective in tRCC (Menegon et al., 2016; Romero et al., 2020). Interestingly, some non-fusion positive RCC tumors appear to have a transcriptional program that resembles tRCCs (Figure 4B and 4C), these non-fusion positive RCC tumors merit further investigation since they are likely activating a MiT/TFE-related transcriptional program through non-fusion-related molecular mechanisms and may share biological characteristics with tRCC.
Responses to ICI in tRCC are notable given the apparent lack of potential sources of tumor-associated antigens (i.e. low burden of mutations and indels). Our immune deconvolution analyses and immunofluorescence studies both support the notion that tRCCs do contain an appreciable density of tumor-infiltrating CD8+ T cells. The tumor neoantigens recruiting T cells in tRCC may be derived from the fusion junction, as has also been reported for other fusion-driven malignancies (Marcon et al., 2020; Yang et al., 2019). Interestingly, there is no significant difference in the percentage of CD8+PD1+TIM3−LAG3− T cells – the activated non-exhausted T-cell subset that is implicated in an effective antitumor response – between ccRCC (a classically ICI-responsive tumor) and tRCC (Braun et al., 2021a; Jansen et al., 2019; Pignon et al., 2019). The immunophenotype of exhausted T cells also appears to differ between ccRCC and tRCC: CD8+PD1+TIM3−LAG3+ T cells are predominant in tRCC while CD8+PD1+TIM3+LAG3− T cells are predominant in ccRCC. Both TIM3 and LAG3 have been proposed as immune checkpoints that can be targeted in combination with PD-1/PD-L1. Notably, several trials combining LAG3 blockade with PD1 blockade are currently underway (and include patients with RCC) (Braun et al., 2021a) and this combination has recently shown to have efficacy in patients with previously untreated metastatic melanoma (Lipson et al., 2021). Our immunophenotypic data provide rationale for the development of this therapeutic combination in tRCC. Our findings are corroborated by two other studies that have shown responses in a few tRCCs treated with an ICI-based regimen (Lee et al., 2021; McGregor et al., 2020). Our results are also consistent with those of prior studies that have shown that tumors with constitutive NRF2 activation may be responsive to ICIs. This includes FH-mutated pRCCs (Adam et al., 2011; Ooi et al., 2011) and alveolar soft part sarcoma (ASPS), which is characterized by a TFE3-ASPSCR1 fusion (that is also one of the most common tRCC fusions) and was found to have a 37.2% response rate on single agent atezolizumab (a PD-L1 inhibitor) in a phase II trial (Naqash et al., 2021). In addition, a study using a lung adenocarcinoma mouse model showed that activated NRF2 and PI3K/mTOR signaling can lead to changes in the immune microenvironment that are permissive to ICI response (Best et al., 2018). In tRCC, our results suggest that both the PI3K/AKT/mTOR pathway and NRF2 may be activated downstream of MiT/TFE fusions (Figure 4C) (Damayanti et al., 2018).
LIMITATIONS OF THE STUDY
Our study does have several limitations. First, the cohort is heterogeneous in terms of stage of disease (localized and metastatic), sequencing platform used, and data types available for analysis. While the heterogeneity of the cohort is inevitable given the rarity of the disease, the analysis methods we apply account for dataset-specific biases (STAR Methods) and the scale of this study has enabled us to uncover multiple insights. However, the subgroups of tRCC that make up this cohort could not be meaningfully evaluated individually (such as by stage of disease or type of sample) given the relatively small sample sizes of each subgroup. In addition, genomic covariates such as general and local background mutation signatures could not be accounted for in the mutational analyses given the inclusion of different sequencing platforms (panel, exome, and genome) across the different datasets. Second, tRCCs are themselves a heterogeneous group of tumors with respect to fusion partners, biology, and prognosis (Zhong et al., 2012). Larger studies or more homogeneous cohorts comprised of prospectively collected samples will be required to draw strong conclusions about how the specific MiT/TFE gene or its fusion partner influence disease biology. Third, some of our clinical data are retrospective, which has inherent limitations. Nonetheless, we suggest that the signals observed from misclassified patients with tRCC enrolled on randomized clinical trials for ccRCC, and the corroboration of these signals by translational and retrospective clinical data, may have important implications for the treatment of tRCC.
Altogether, we demonstrate the power of integrative clinico-genomic analysis to illuminate the molecular underpinnings and clinical features of tRCC. Our work inspires multiple hypotheses that can be pursued in future studies to further dissect the biology of this rare cancer. These data also lay the framework for the development and testing of mechanism-driven therapeutic regimens in tRCC.
STAR METHODS
RESOURCE AVAILABILITY
Lead contact
Further information and requests for resources and reagents should be directed to and will be fulfilled by the lead contact, Srinivas R. Viswanathan (srinivas.viswanathan@dfci.harvard.edu).
Materials availability
This study did not generate new unique reagents.
Data and code availability
RNA-seq data have been deposited in the Gene Expression Omnibus (GEO) and are publicly available as of the date of publication. Accession numbers are listed in the key resources table.
The list of samples used (including the data types available) and sequencing platform used for DNA-sequencing (WGS, WES, or panel) are provided in Table S1. The expression matrix (RSEM expected counts and TPMs) derived from the RNA-sequencing of the cell lines in the in vitro experiment represented in Figure 4A is provided in Table S3. For the OncoPanel cohort, sample-level data (mutation, copy number, and clinical metadata) are provided in Table S5. Sample-level data from the multiparametric immunofluorescence cohort are provided in Table S6.
This paper analyzes existing, publicly available data, links to the datasets used are listed in the key resources table.
All other data reported in this paper will be shared by the lead contact upon request.
Algorithms used for data analysis are all publicly available from the indicated references in the STAR Methods section. This paper does not report original code.
Any additional information required to reanalyze the data reported in this paper is available from the lead contact upon request.
KEY RESOURCES TABLE
EXPERIMENTAL MODEL AND SUBJECT DETAILS
Clinical tRCC cohorts
The comparison of baseline characteristics and clinical outcomes was done using data from patients included in two retrospective cohorts of consecutive patients: (1) Harvard cohort (n= 734 ccRCC, n= 97 pRCC, n= 23 chRCC, n= 19 tRCC), a retrospective cohort from the Dana-Farber/Harvard Cancer Center including patients from Dana-Farber Cancer Institute, Beth Israel Deaconess Medical Center, and Massachusetts General Hospital (n= 235 female and n= 638 male, mean age 58.7 [SD= 10.3]) and (2) IMDC cohort (n= 6107 ccRCC, n= 396 pRCC, n= 107 chRCC, n= 40 tRCC): a retrospective multi-center cohort of metastatic RCC that includes more than 40 international cancer centers and more than 10,000 patients with metastatic RCC (n= 1904 female and n= 4746 male, mean age 59.9 [SD= 11.0]) (Heng et al., 2013). All patients consented to an institutional review board (IRB) approved protocol to have their clinical data retrospectively collected for research purposes and the analysis was performed under a secondary use protocol, approved by the Dana-Farber Cancer Institute IRB. For the Harvard cohort, patients with tRCC were defined as: (1) positive TFE3 FISH test or (2) positive TFE3 test by IHC along with a strongly suggestive clinico-pathologic history and no FISH testing results available (missing). For the IMDC cohort, patients were included as tRCCs if they (1) had a positive TFE3 FISH test, (2) had a positive TFE3 IHC test and suggestive clinico-pathologic history and no FISH testing data available (missing), or (3) no TFE3 FISH or TFE3 IHC test results available but suggestive clinico-pathologic history. Clinico-pathologic diagnoses were used to define comparator RCC histologies (ccRCC, pRCC, and chRCC). For the IMDC cohort, comparator histologies (controls) were only used from clinical sites that contributed tRCC cases.
Genomic tRCC cohorts
For genomic datasets, tRCCs were identified based on RNA-seq-based fusion calls, a positive TFE3 FISH test, or DNA-based fusion calls derived from panel data (MSK-IMPACT or OncoPanel). Clinico-pathologic diagnoses were used to define the cases of other RCC histologies (ccRCC, pRCC, chRCC, normal kidney, or other). Data for the Memorial-Sloan Kettering (MSK) cohort was obtained from the study by Marcon et al. (Marcon et al., 2020) and Zehir et al. (Zehir et al., 2017) (n= 101 female and n= 239 male, age not available). Fusion calls for the TCGA cohort (n= 319 female and n= 622 male, mean age 59.7 [SD= 12.7]) were obtained from the study by Gao et al. (Gao et al., 2018), clinico-pathologic data was obtained from Genomic Data Commons (https://gdc.cancer.gov/about-data/publications/pancanatlas), and the pathology slides used in Figure 1B were obtained from https://portal.gdc.cancer.gov/. Data for the PCAWG (n= 54 female and n= 89 male, mean age 60.3 [SD= 10.5]) (Campbell et al., 2020) cohort were obtained from the ICGC data portal (https://dcc.icgc.org/releases/PCAWG). Data for the IMmotion151 (n= 233 female and n= 602 male, mean age 60.5 [SD= 10.1], NCT02420821, Motzer at al.) (Motzer et al., 2020), Wang et al. (age and sex not available) (Wang et al., 2020), Durinck et al. (n= 35 female, n= 50 male and 14 unknown, mean age 60.1 [SD= 13.4]) (Durinck et al., 2015), Malouf et al. (n= 2 female and n= 1 male, mean age 29.3 [SD= 15.4]) (Malouf et al., 2014), and Sato et al. (n= 28 female and n= 78 male, mean age 63.4 [SD= 12.1]) (Sato et al., 2013) cohorts were obtained from the corresponding studies. For the OncoPanel cohort (n= 129 female and n= 300 male, mean age 58.6 [SD= 11.3]), DNA extraction, sequencing, and mutation and copy number calling were performed as previously described for the OncoPanel gene panel assay (Garcia et al., 2017). The OncoPanel assay is an institutional analytic platform that is certified for clinical use and patient reporting under the Clinical Laboratory Improvement Amendments (CLIA) Act. The panel includes 275 to 447 cancer genes (versions 1 to 3 of the panel). Sample-level data for the OncoPanel cohort (mutations, gene-level CNA, and clinical metadata) are provided in Table S5. The data types available for each dataset are illustrated in Figure 1C, but not all data types were available for all samples in each cohort. The full list of samples used (including the data types available) and sequencing platform used for DNA-sequencing (WGS, WES, or panel) are provided in Table S1.
Cell lines
293T cells were obtained from the American Type Culture Collection. UOK109 and UOK146 cells were a kind gift of Dr. W. Marston Linehan (National Cancer Institute). FU-UR-1 cells were a kind gift of Dr. Masako Ishiguro (Fukuoka University School of Medicine). Cell lines were grown in base media of DMEM (293T, UOK109, UOK146) or DMEM/F12 (FU-UR-1), supplemented with 10% FBS, 100 U mL−1 penicillin, 100 μg mL−1 streptomycin, 2 mM L-glutamine, and 100 μg mL−1 Normocin (Invivogen).
METHOD DETAILS
Analysis of mutation and copy number variants in genomic tRCC cohorts
Mutation calls (all aligned to human genome reference build hg19) were obtained as detailed above. Specifically, for the MSK cohort (Marcon et al., 2020; Zehir et al., 2017), WES-based calls were used where available and panel-based data were otherwise used for tRCC samples. For the TCGA cohort, the mc3 MAF calls (Ellrott et al., 2018) (https://gdc.cancer.gov/about-data/publications/pancanatlas) were used. For the Durinck et al. (Durinck et al., 2015) and Malouf et al. cohort (Malouf et al., 2014), only samples from patients that had mutation calling based on matched normal sequencing were included. For the Sato et al. cohort (Sato et al., 2013), only the WES calls were used. All mutations were annotated uniformly using Oncotator v1.9.3.0 (Ramos et al., 2015) (except for the IMmotion151 cohort, for which a MAF was not available). In order to filter out potential germline mutations in the OncoPanel cohort, mutations present at an allelic frequency of 0.5% in one of the superpopulations from the 1000 Genomes Project (1000 Genomes Project Consortium et al., 2015) (https://www.internationalgenome.org/data) were excluded from all downstream analyses. For the IMmotion151 cohort, supplemental germline filtering was not possible because the full MAF was not available. However, the Foundation T7 assay used in the IMmotion151 cohort (Motzer et al., 2020) includes germline filtering in this FDA-approved clinical assay. For the enrichment analyses, mutations were included if they were truncating (nonsense or splice site), insertions-deletions (indels), missense mutations, or TERT promoter mutations. For the IMmotion151 cohort, mutations were included if they were short-variants or truncating. The mutation load was computed as the number of all non-synonymous mutations per sample. The indel load was computed as the number of all indels per sample (either all indels or only frameshift indels). For the OncoPanel and MSK-IMPACT samples, the mutation and indel loads were normalized to the bait sets of the version of the panel used. The bait sets (Vokes et al., 2019) for OncoPanel were: v1, 0.753334 Megabases [Mb]; v2, 0.826167 Mb; and v3, 1.315078 Mb. For MSK-IMPACT, the bait sets were: IMPACT341, 0.896665; IMPACT410, 1.016478; and IMPACT468, 1.139322 Mb.
Gene-level copy number data calls were available for the MSK cohort (Zehir et al., 2017), IMmotion151 cohort (Motzer et al., 2020), OncoPanel cohort (Table S5B), PCAWG (https://dcc.icgc.org/releases/PCAWG/consensus_cnv/GISTIC_analysis/all_thresholded.by_genes.rmcnv.pt_170207.txt), and TCGA (http://firebrowse.org/; KIPAN dataset). For all gene-level analyses only focal events (deep deletions and high amplifications) were considered. As measures of the copy number alteration burden, the aneuploidy score and fraction genome altered were obtained for the TCGA (Taylor et al., 2018) and MSK (Zehir et al., 2017) cohorts, respectively. Arm-level calls were obtained for the TCGA cohort (Taylor et al., 2018).
Genomic enrichment analyses
In order to account for the inherent differences between the included cohorts and to maximize the power of the study to detect differences in mutations and copy number alterations in tRCC versus other RCC histologies, a meta-analytic approach was adopted for all gene-level enrichment analyses, as has been done in prior studies (Bakouny et al., 2021; Turajlic et al., 2018). First, Fisher’s exact tests were used to evaluate the enrichment of gene alterations (mutations and copy number alterations separately) within each cohort (combined WES cohort, IMmotion151, PCAWG, OncoPanel, and MSK-IMPACT). For panel-based cohorts, this enrichment took into account the bait set of each version of the panel used for sequencing (i.e. a gene was counted as missing, and not non-mutated, if not included in the bait set of a version of the panel). The conditional maximal likelihood estimate of the odds ratio and its 95% confidence interval were computed using the fisher.test() function from the stats package in R. For each gene, we then obtained pooled estimates of the odds ratio and its 95% confidence interval using a random-effects model with the Paule-Mandel estimator for tau, with treatment arm continuity correction and Knapp-Hartung adjustment. The meta-analysis was performed using the metabin() function from the meta package in R (Efthimiou, 2018; Harrer et al., 2019; Veroniki et al., 2016). The enrichment analysis was performed pairwise between tRCC and each comparator RCC histology separately (ccRCC, pRCC, and chRCC). Genes were included in the enrichment analysis if: (1) they were altered in at least two different cohorts; (2) alteration frequency in tRCC was 3% or more or in the control RCC tumor type (either ccRCC, pRCC, or chRCC) at 5% or more; and (3) were Tier 1 cancer genes as defined in the Cancer Gene Census (accessed on February 17 2021) (Sondka et al., 2018). Genes that had been previously reported to be significantly mutated in ccRCC, pRCC, and chRCC (Ricketts et al., 2018a) were also included in the analysis. For all analyses, samples that were originally part of the TCGA and PCAWG cohorts were only included in one of the two cohorts as part of the enrichment analyses (cohort assignment reported in Table S1). The CoMut plot was generated using the CoMut package in Python (Crowdis et al., 2020) and genes that were not assessed in specific samples (i.e. not included in the bait sets of the gene panel used) are shown as gray boxes; the corresponding alteration frequency (bar graph at the right-hand side of the CoMut) was adjusted accordingly and reflects only samples in which a particular gene was assessable for alteration. Arm-level comparisons (TCGA cohort) were performed pairwise with RCC histologies using Fisher’s exact tests. The mutation and indel loads, as well as the aneuploidy score and fraction genome altered, were compared pairwise with each RCC histology (ccRCC, pRCC, and chRCC) using Wilcoxon rank-sum tests. The genes included in each version of the gene panels used are listed by panel version at https://github.com/mskcc/voyager_resources/tree/master/targets for MSK-IMPACT, in Supplementary Data 13 of the study by Bakouny et al. (Bakouny et al., 2021) for OncoPanel, and the 395 genes of the Foundation T7 assay (Motzer et al., 2020).
MiT/TFE fusion identification and characterization
Fusion calls were obtained as detailed under “Genomic tRCC cohorts” above. In particular, for the MSK cohort, determination of fusion partners was based on MSK-IMPACT and/or RNA-seq (Marcon et al., 2020; Zehir et al., 2017) and fusion breakpoints were based on MSK-IMPACT and available for a subset of samples (Zehir et al., 2017). For the OncoPanel cohort, fusion partners and breakpoints were based on an in-house fusion calling pipeline and were available for a subset of samples. For the TCGA, PCAWG, Wang et al., Sato et al., Durinck et al., and Malouf et al. cohorts, fusion partners were based on RNA-seq. Of those, the fusion breakpoints were available for the TCGA, PCAWG, Sato et al., and Durinck et al. cohorts. For the Malouf et al. cohort, fusion breakpoint locations were inferred based on the reported fusion breakpoint sequences using BLAT (https://genome.ucsc.edu/cgi-bin/hgBlat). All breakpoint locations were aligned to human genome reference build hg19, except for the TCGA breakpoints which had been originally mapped to hg38 and were converted to hg19, for the purposes of this analysis, using liftOver (https://genome.ucsc.edu/cgi-bin/hgLiftOver). The Circos Perl package (Krzywinski et al., 2009) was used to represent the chromosomal locations of fusions in a circos plot. The Enrichr (Xie et al., 2021) tool was used to evaluate enrichment of Gene Ontology (GO) terms among the MiT/TFE partner genes. In order to annotate the fusion protein products based on the breakpoints, breakpoints were first aligned to human genome GRCH37.p13 on NCBI Genome Data viewer. Functional domains were then annotated using UniPort Protein knowledgebase UniProtKB/Swiss-Prot And NCBI Conserved Domain Database (Marchler-Bauer et al., 2015) (CDD v3.19). The presence of Prion-Like domains (PLD) was analyzed using Prion-Like Amino Acid Composition (PLAAC) web-based program (Lancaster et al., 2014). Illustrations were made using Illustrator for Biological Sequences (IBS) (Liu et al., 2015) version 1.0. Annotated functional domains with abbreviations are provided in Table S2.
TFE3 fusion-specific signature
For TFE3 fusion overexpression experiments, 293T cells were seeded in 6-well plates at 2 × 10⁵ cells per well and after 24 hours were transfected with 500 ng of plasmids encoding ASPSCR1-TFE3, NONO-TFE3, PRCC-TFE3, SFPQ-TFE3, wild type (WT) TFE3, or an empty vector control (all in pLX313). All transfections were performed in three biological replicates. Cells were harvested 48 hours after transfection and total RNA was collected using the RNeasy Plus Mini Kit (QIAGEN, #74136). Sample concentrations were measured using a NanoDrop 8000 Spectrophotometer (Thermo Fisher Scientific) and sequencing libraries were prepared with poly(A) selection. Libraries were pooled and paired-end 150 bp RNA-sequencing was performed on an Illumina HiSeq. Paired-end sequencing reads were aligned to the human genome reference build hg38 using STAR v2.7.2 (Dobin et al., 2013) and quantified using RSEM v1.3.2(Li and Dewey, 2011). Transcripts were filtered based on read support (sum of expected read counts across three biological replicates > 30) prior to gene-level differential expression analysis using the voom transformation in limma v3.40.6 (Ritchie et al., 2015). Transcripts-per-million (TPMs) were used for visualization and clustering. Expected count and TPM matrices are provided in Table S3.
In order to derive a transcriptional signature that is specific to the TFE3 fusion, we performed differential gene expression of each of the fusion conditions (ASPSCR1-TFE3, NONO-TFE3, PRCC-TFE3, SFPQ-TFE3) versus the WT TFE3 condition. Genes that were significantly upregulated (q<0.05 and log2(fold-change)>0) or significantly downregulated (q<0.05 and log2(fold-change)>0) across all four comparisons defined a TFE3 fusion-specific signature (Table S4). In order to evaluate the relevance of the in vitro-derived signature to tRCC tumor samples, we performed clustering on 4 independent RNA-seq datasets that included tRCC samples. The normalized expression matrices used for clustering were those obtained from TCGA (https://gdc.cancer.gov/about-data/publications/pancanatlas), PCAWG (https://dcc.icgc.org/releases/PCAWG), IMmotion151, and Wang et al. as described under “Genomic tRCC cohorts” above. Clustering was performed in each dataset independently using the Heatmap function from the ComplexHeatmap (Gu et al., 2016) package in R, using hierarchical clustering with ward.D2 as the clustering method and the Kendall correlation distance metric. The average intra-tRCC distance was used as a metric for density of clustering of tRCCs and was compared to the distance obtained from clustering using the 1000 most variable genes within each dataset (Figure S4).
Differential gene expression analysis
Pairwise differential gene expression analysis was performed between tRCC and each other sample type, within each dataset independently (TCGA, PCAWG, IMmotion151, Wang et al., and 293T cell line experiment). Differential gene analysis for the cell line experiment was performed as described above using the limma package. For the tumor datasets, differential gene expression was performed using pairwise Wilcoxon rank-sum tests. For all tests, the Benjamini-Hochberg correction was used to compute q-values and a q-value<0.05 was taken as statistically significant. In order to define a transcriptional signature specific to tRCC, an Upset plot was computed using the UpsetR package (Conway et al., 2017). The 76 genes that were found to be significantly upregulated in 9 or more of the 14 pairwise comparisons were plotted in a heatmap (Figure 4C), which included tRCC samples and comparator samples. Gene pathway annotations were obtained from Enrichr (Xie et al., 2021). Overlap between the NRF2 and MITF target genes was evaluated using a one-tailed hypergeometric test. In order to adjust for potential RNA-seq batch effects between datasets in visualization, gene expression was Z-scored within each dataset independently. For volcano plots, log2(fold-change) of the mean expression of genes in each group was used.
Gene set enrichment analysis
Pre-ranked gene set enrichment analysis (GSEA) was performed pairwise between tRCC and each comparator, within each dataset independently, using the using -log10(q-value) signed by the sign of the log2(fold-change) of mean gene expression. GSEA was used on the Hallmark gene sets v7.1 from the Molecular Signatures Database (MSigDB) (Liberzon et al., 2015) and a previously defined 55-gene NRF2 signature (Takahashi et al., 2020). For the Hallmark analysis, the gene sets were ranked by the number of pairwise comparisons that had a normalized enrichment score (NES)>1 in tRCC vs the other comparators (with the top gene sets visualized as a dot plot) (Figure 4D).
In addition, single sample GSEA (ssGSEA) scores were computed for the 55-gene NRF2 signature using the GSVA package (Hänzelmann et al., 2013) in R to infer the level of activity of NRF2 in each sample. In order to adjust for potential RNA-seq batch effects in visualization, NRF2 signature scores were Z-scored within dataset prior to visualization as a waterfall plot (Figure 5A). Comparison of ssGSEA scores between tumor types in the TCGA cohort was performed using Wilcoxon rank-sum tests. To examine the relationship of the NRF2 signature with survival outcomes, the NRF2 score was dichotomized at the median in each treatment arm of each cohort.
Analysis of CTRP and DepMap datasets
RNAi genetic dependence scores were obtained from the DEMETER2 Data v6 dataset (McFarland et al., 2018), CRISPR genetic dependence scores were obtained from the CRISPR (Avana) Public 21Q1 dataset (Dempster et al., 2019; Meyers et al., 2017) and drug area under the curve (AUC) values were obtained from the CTRP v2.0 2015 CTD2 dataset (Rees et al., 2016; Seashore-Ludlow et al., 2015). Cell lines were excluded if they had multiple AUC values for each drug. All datasets were downloaded from the DepMap Data Download Portal (https://depmap.org/portal/download/). NRF2 ssGSEA scores were calculated from the Broad Institute CCLE RNA-seq dataset. Expression values were upper quartile normalized prior to analysis. For each drug (or gene), drug AUCs (or gene dependence scores) were Z-scored and the NRF2 ssGSEA scores were Z-scored, amongst samples having data for both data types. Pearson’s correlation coefficient was used to assess the association between drug AUC Z-score and NRF2 ssGSEA Z-score as well as between gene dependence Z-score and NRF2 ssGSEA Z-score. For each correlation, t-statistics were computed (t = r•((n-2)/(1-r2))0.5), a two-tailed Student’s t-distribution was used to determine p-values, and q-values were computed using a Benjamini-Hochberg correction.
Colony forming assays
shRNAs were cloned into a doxycycline-inducible lentiviral vector as previously described (Viswanathan et al., 2018). The indicated cell lines were transduced with lentivirus expressing doxycycline-inducible shRNA (shRNA target sequence: CCGGCATTTCACTAAACACAA) and selected with 500 μg/mL of G418 prior to seeding at equal densities with or without the addition of 1 μg/mL doxycycline. Cell densities ranged from 500–1500 cells per well of 12-well plate depending on the cell line. Fresh complete culture media with/without doxycycline was replaced every two days prior to fixation and staining with crystal violet after 12–20 days. Colony areas were quantified using Image J v1.53.
Multiplex immunofluorescence and image analysis
Cluster of differentiation (CD8), programmed death 1 (PD1), T cell immunoglobulin and mucin domain-3 (TIM3), and Lymphocyte-activation gene 3 (LAG3) multiplex immunofluorescence (IF) was performed as previously described (Braun et al., 2021b). Briefly, we used the Perkin Elmer Opal tyramide signal system on a Bond RX Autostainer (Leica Biosystems). The anti-CD8 antibody (1:5,000, C8/144B, mouse monoclonal antibody, Agilent) was detected using the Opal 520 fluorophore (1:150, FITC); the anti-TIM3 antibody (1:1,000, AF2365 goat monoclonal antibody, R&D Systems) was detected using the Opal 540 fluorophore (1:50, Cy3); the anti-LAG3 antibody (1/10,000, 17B4 mouse monoclonal antibody, LifeSpan Biosciences) was detected using the Opal 560 fluorophore (1:150, Texas Red); the validated anti-PD-1 antibody (1:5,000, EH33 mouse monoclonal antibody, Dr. Freeman laboratory, Dana-Farber Cancer Institute, Boston, MA) was detected using the Opal 690 fluorophore (1:50, Cy5). Whole slide images were acquired at 10x using the Vectra 3 automated quantitative pathology imaging system (PerkinElmer). Subsequently, at least 5 stamps of 931×698 um were selected per slide in areas of high immune infiltration (hotspots) using Perkin Elmer Phenochart v1.0 software. Each stamp was then acquired at 20x using the Vectra 3. Inform v2.2 software was then used in order to deconvolute the multispectral images, as previously described (Pignon et al., 2019). Hotspot deconvoluted images in .tiff format were uploaded into Indica Lab HALO platform version 3.0. For each hotspot, the tumor area was manually annotated by a pathologist (TD). CD8 cells were phenotyped according to the expression of PD1, TIM3 and LAG3 using the Indica Lab High-Plex FL v2.0 module, using DAPI-based nuclear segmentation and detection of FITC (CD8), Cy3 (TIM3), Texas Red (LAG3), Cy5 (PD1) positive cells by adapting a dye cytoplasm positive threshold for each slide. A unique algorithm was created for each whole slide, and each group of hotspots and its accuracy was validated through visual inspection by two pathologists (TD, SS). Sample-level results of the multiplex immunofluorescence analysis are provided in Table S6. Comparisons between tRCC (n= 11), ccRCC (n= 11), and normal (ccRCC adjacent, (n= 10)) were performed using Wilcoxon rank-sum tests. All tRCC samples were either (1) TFE3 FISH positive or (2) positive TFE3 test by IHC along with a strongly suggestive clinico-pathologic history and no FISH testing results available (missing). The immunofluorescence results for the ccRCC and normal (ccRCC adjacent) control samples have been reported in a prior study (Braun et al., 2021b). For each T cell subset, T cell subset density was calculated as the number of T cells per mm2. Percentage of a T cell subset was defined as the density of the T cell subset divided by the density of CD8+ T cells in the sample.
Immune deconvolution and immune analyses
CIBERSORTx (Newman et al., 2019) (Job type: “Impute cell fractions”), in absolute mode, with B mode batch correction, with quantile normalization disabled, and in 1000 permutations was used on the LM22 signature in order to infer the immune cell composition of samples from RNA-seq in the TCGA cohort. All samples which had a p-value for deconvolution >0.05 were considered to have failed deconvolution and were therefore discarded from all downstream analyses. Relative cell proportions were obtained by normalizing the CIBERSORTx output to the sample-level sum of cell counts (in order to obtain percentages of immune infiltration). Purity estimates for the TCGA cohort were obtained for the TCGA cohort from the Taylor et al. study (Taylor et al., 2018). CD8+ T cell density and purity were compared pairwise between tRCC and each other RCC histology (ccRCC, pRCC, and chRCC) using Wilcoxon rank-sum tests. Sample-level PD-L1 protein expression by IHC on tumor-infiltrating immune cells (PD-L1≥ 1%) for the IMmotion151 trial were obtained from the Motzer et al. study (Motzer et al., 2020) and compared using a Fisher’s exact test between tRCC and ccRCC.
Clinical and survival analyses
Tumor stage was obtained from Genomic Data Commons (https://gdc.cancer.gov/about-data/publications/pancanatlas) for the TCGA cohort and was defined using American Joint Committee on Cancer (AJCC) 8th edition for the IMDC and Harvard cohorts. IMDC risk groups (a previously validated prognostic model for patients with metastatic RCC) were defined as previously described (Heng et al., 2009). Tumor stage (I/II vs III/IV), IMDC risk groups (favorable, intermediate, poor), and sex were compared pairwise between tRCC and each other RCC histology (ccRCC, pRCC, and chRCC) using Fisher’s exact test. Age at initial RCC diagnosis was compared between tRCC and each other RCC histology (ccRCC, pRCC, and chRCC) using Wilcoxon rank-sum tests. Sankey diagrams for the Harvard and IMDC cohorts were computed using the ggalluvial package in R.
For all survival endpoints, the Kaplan-Meier method was used to summarize survival distributions. For the TCGA cohort, progression-free interval (PFI) was defined as the period from the date of diagnosis until the date of the first occurrence of a new tumor event (includes disease progression, locoregional recurrence, distant metastasis, new primary tumor, or death with tumor). Patients were censored if they were alive without any of these events at last follow-up or had died without tumor (Liu et al., 2018). Overall survival (OS) was defined as the period from the start of systemic therapy until death. Patients were censored if they were alive at last follow-up. Time-to-treatment failure (TTF) was defined from the start of the line of systemic therapy to the end of that line of therapy or death from any cause. Since assessment of responses in retrospective cohorts (Harvard and IMDC cohorts) was not subject to radiological review specifically for the purpose of this study, responses were defined based on RECIST v1.1 criteria (Eisenhauer et al., 2009) as available by retrospective review. Patients were censored if they were alive and still on the line of therapy at last follow-up. Progression-free survival (PFS) was defined (in the CheckMate and IMmotion151 cohorts) from the time of randomization or start of first dose until disease progression or death. Patients were censored if they were alive at last follow-up. For all survival endpoints, pairwise comparisons were performed using log-rank tests. In the IMmotion151 cohort, a Cox model that included an interaction term (histology-by-treatment arm) was used to evaluate the difference in the extent of benefit derived with atezolizumab + bevacizumab versus sunitinib in tRCC versus ccRCC. In the Harvard/IMDC pooled cohort, all patients who got ICI-based therapies were included in the ICI group. If patients received multiple lines of ICI-based therapies, the first ICI-based regimen was used for the analysis of clinical outcomes. All other patients had received TKIs and were assigned to the TKI group. If patients received multiple lines of TKIs, the first TKI regimen was used for the analysis of clinical outcomes.
Clinical benefit (CB) was defined as an objective response (complete response or partial response) or stable disease with PFS of at least 6 months. No clinical benefit (NCB) was defined as progressive disease with PFS less than 3 months. All other patients (not meeting criteria for CB or NCB) were classified as having intermediate clinical benefit (ICB). In the IMmotion151 cohort, rates of CB and NCB were compared between the atezolizumab + bevacizumab and sunitinib arms, in patients with tRCC and ccRCC separately, using Fisher’s exact test.
QUANTIFICATION AND STATISTICAL ANALYSIS
All downstream analyses were done using R v3.6.1, Python v3.8.5 (on Spyder v4.1.5), Circos v0.69.9, or GraphPad PRISM 9. For boxplots, the upper and lower hinges represent the 75th and 25th percentiles, respectively. The whiskers extend in both directions until the largest or lowest value not further than 1.5 times the interquartile range from the corresponding hinge. All tests were two-tailed (unless otherwise specified) and considered statistically significant if p< 0.05 or q< 0.05. All statistical details are reported in the figure legends.
ADDITIONAL RESOURCES
Data from the following previously reported clinical trials were utilized in this study: IMmotion151 (NCT02420821) (Motzer et al., 2020) as well as CheckMate 009 (NCT01358721), 010 (NCT01354431), and 025 (NCT01668784) (Braun et al., 2020).
Supplementary Material
Related to Figure 3. List and legend of functional domains used in the annotation of MiT/TFE and partners genes in Figures 3D-E.
Related to Figure 6. Sample-level data for the multiparametric immunofluorescence cohort.
Related to Figure 1. List of samples in the NGS datasets included in the analysis.
Related to Figure 4. List of genes that are in the TFE3-fusion-specific transcriptional signature developed in Figure 4A.
Related to STAR Methods. Sample-level MAF (Table S5B) and gene-level copy number (Table S5B) data for the OncoPanel cohort.
Related to Figure 4. RSEM expected counts (Table S3A) and transcript-per-million (TPM; Table S3B) derived from the RNA-sequencing of the cell lines in the in vitro experiment represented in Figure 4A.
Acknowledgements
We thank the OncoPanel study team and the patients who contributed their data to research and participated in clinical trials. We thank all contributors to The International Metastatic Renal-Cell Carcinoma Database Consortium for their data contributions. This work was supported in part by The Friends of Dana-Farber (S.R.V.), Claudia Adams Barr Program for Innovative Cancer Research (S.R.V.), Clinician-Scientist Development Award from the Doris Duke Charitable Foundation (S.R.V.), Department of Defense Kidney Cancer Research Program (W81XWH-19-1-0815) (S.R.V.), an Independent Investigator Grant from the Rally Foundation for Childhood Cancer Research (S.R.V), and the Dana-Farber / Harvard Cancer Center Kidney Cancer SPORE (P50-CA101942) (D.A.B., D.F.M., S.S., T.K.C., S.R.V.). T.K.C. is supported by the Kohlberg Chair at Harvard Medical School and the Trust Family, Michael Brigham, and Loker Pinard Funds for Kidney Cancer Research at DFCI. J.N. acknowledges support by NIH F31 CA250136. N.I.V. is supported by the Damon Runyon Mark Foundation for Cancer Research Physician-Scientist Training Award, Conquer Cancer Foundation YIA, SITC Genentech Award. J.L. is supported by a fellowship from the National Cancer Center. S.A. is supported by a DoD KCRP Postdoctoral fellowship (W81XWH-21-1-0302). D.A.B. is supported by the Dana-Farber / Harvard Cancer Center Kidney Cancer SPORE Career Enhancement Program (NCI P50CA101942-15), DoD CDMRP (KC170216, KC190130), and the DoD Academy of Kidney Cancer Investigators (KC190128).
Declaration of Interests
The following authors report competing interests (all outside of the submitted work):
Z.B.: Research funding from Bristol-Myers Squibb & Genentech/imCORE; Honoraria from UpToDate.
X.G.: Advisory board for Exelixis, Bayer, Guardant Health.
D.A.B.: Nonfinancial support from Bristol Myers Squibb, honoraria from LM Education/Exchange Services, advisory board fees from Exelixis and Aveo, and consulting/personal fees from Octane Global, Defined Health, Dedham Group, Adept Field Solutions, Slingshot Insights, Blueprint Partnerships, Charles River Associates, Trinity Group, and Insight Strategy, outside of the submitted work.
N.I.V.: Advisory board to Sanofi/Genzyme, Oncocyte, and Lilly.
M.S.H.: Consultant, Janssen Pharmaceuticals; UpToDate.
R.H.: Research funding from Novartis.
B.A.M.: Consultant for Bayer, Astellas, AstraZeneca, Seattle Genetics, Exelixis, Nektar, Pfizer, Janssen, Genentech, Eisai, Dendreon, Bristol Myers Squibb, Calithera, and EMD Serono. Research funding to the institution from Bristol Myers Squibb, Calithera, Exelixis, and Seattle Genetics.
A.S.F.: Olympus America, Inc - Consultant; Roche, Janssen - Honoraria; Vessi Medical - Advisory Board.
C.J.W.: Equity holder of BioNTech, Inc; Research funding from Pharmacyclics.
D.F.M.: Honoraria from BMS, Pfizer, Merck, Alkermes, Inc., EMD Serono, Eli Lilly and Company, Iovance, Eisai Inc., Werewolf Therapeutics, and Calithera Biosciences; Research Support from BMS, Merck, Genentech, Pfizer, Exelixis, X4 Pharma, and Alkermes, Inc.
D.Y.C.H.: Consultancies and research funding from Pfizer, Novartis, BMS, Merck, Eisai, Ipsen, Exelixis.
S.S.: Grants from Exelixis, grants from Bristol-Myers Squibb, personal fees from Merck, grants and personal fees from AstraZeneca, personal fees from CRISPR Therapeutics, personal fees from NCI, and personal fees from AACR; a patent for Biogenex with royalties paid.
E.M.V.A.: Advisory/Consulting: Tango Therapeutics, Genome Medical, Invitae, Enara Bio, Janssen, Manifold Bio, Monte Rosa; Research support: Novartis, BMS; Equity: Tango Therapeutics, Genome Medical, Syapse, Enara Bio, Manifold Bio, Microsoft, Monte Rosa; Patents: Institutional patents filed on chromatin mutations and immunotherapy response, and methods for clinical interpretation.
T.K.C.: Research (Institutional and personal): Alexion, Analysis Group, AstraZeneca, Aveo, Bayer, Bristol Myers-Squibb/ER Squibb and sons LLC, Calithera, Cerulean, Corvus, Eisai, Exelixis, F. Hoffmann-La Roche, Foundation Medicine Inc., Genentech, GlaxoSmithKline, Ipsen, Lilly, Merck, Novartis, Peloton, Pfizer, Prometheus Labs, Roche, Roche Products Limited, Sanofi/Aventis, Takeda, Tracon; Consulting/honoraria or Advisory Role: Alexion, Analysis Group, AstraZeneca, Aveo, Bayer, Bristol Myers-Squibb/ER Squibb and sons LLC, Cerulean, Corvus, Eisai, EMD Serono, Exelixis, Foundation Medicine Inc., Genentech, GlaxoSmithKline, Heron Therapeutics, Infinity Pharma, Ipsen, Jansen Oncology, IQVIA, Lilly, Merck, NCCN, Novartis, Peloton, Pfizer, Pionyr, Prometheus Labs, Roche, Sanofi/Aventis, Surface Oncology, Tempest, Up-to-Date. CME-related events (e.g.: OncLIve, PVI, MJH Life Sciences). NCI GU Steering Committee; Stock ownership: Pionyr, Tempest; Patents filed, royalties or other intellectual properties: related to biomarkers of immune checkpoint blockers and ctDNA; Travel, accommodations, expenses, medical writing in relation to consulting, advisory roles, or honoraria; No speaker’s bureau.
S.R.V.: Consulting, MPM Capital and Vida Ventures. Spouse is an employee of and holds equity in Kojin Therapeutics.
All other authors report no competing interests.
REFERENCES
- 1000 Genomes Project Consortium, Auton A, Brooks LD, Durbin RM, Garrison EP, Kang HM, Korbel JO, Marchini JL, McCarthy S, McVean GA, et al. (2015). A global reference for human genetic variation. Nature 526, 68–74. [DOI] [PMC free article] [PubMed] [Google Scholar]
- Adam J, Hatipoglu E, O’Flaherty L, Ternette N, Sahgal N, Lockstone H, Baban D, Nye E, Stamp GW, Wolhuter K, et al. (2011). Renal Cyst Formation in Fh1-Deficient Mice Is Independent of the Hif/Phd Pathway: Roles for Fumarate in KEAP1 Succination and Nrf2 Signaling. Cancer Cell 20, 524–537. [DOI] [PMC free article] [PubMed] [Google Scholar]
- Álvarez-Fernández M, and Malumbres M (2020). Mechanisms of Sensitivity and Resistance to CDK4/6 Inhibition. Cancer Cell 37, 514–529. [DOI] [PubMed] [Google Scholar]
- Ambalavanan M, and Geller JI (2019). Treatment of advanced pediatric renal cell carcinoma. Pediatr Blood Cancer 66, e27766. [DOI] [PubMed] [Google Scholar]
- Argani P, Olgac S, Tickoo SK, Goldfischer M, Moch H, Chan DY, Eble JN, Bonsib SM, Jimeno M, Lloreta J, et al. (2007). Xp11 Translocation Renal Cell Carcinoma in Adults: Expanded Clinical, Pathologic, and Genetic Spectrum. The American Journal of Surgical Pathology 31, 1149–1160. [DOI] [PubMed] [Google Scholar]
- Baba M, Furuya M, Motoshima T, Lang M, Funasaki S, Ma W, Sun H-W, Hasumi H, Huang Y, Kato I, et al. (2019a). TFE3 Xp11.2 Translocation Renal Cell Carcinoma Mouse Model Reveals Novel Therapeutic Targets and Identifies GPNMB as a Diagnostic Marker for Human Disease. Mol Cancer Res 17, 1613–1626. [DOI] [PMC free article] [PubMed] [Google Scholar]
- Baba M, Furuya M, Motoshima T, Lang M, Funasaki S, Ma W, Sun H-W, Hasumi H, Huang Y, Kato I, et al. (2019b). TFE3 Xp11.2 Translocation Renal Cell Carcinoma Mouse Model Reveals Novel Therapeutic Targets and Identifies GPNMB as a Diagnostic Marker for Human Disease. Mol Cancer Res 17, 1613–1626. [DOI] [PMC free article] [PubMed] [Google Scholar]
- Bakouny Z, Braun DA, Shukla SA, Pan W, Gao X, Hou Y, Flaifel A, Tang S, Bosma-Moody A, He MX, et al. (2021). Integrative molecular characterization of sarcomatoid and rhabdoid renal cell carcinoma. Nature Communications 12, 808. [DOI] [PMC free article] [PubMed] [Google Scholar]
- Best SA, Souza DPD, Kersbergen A, Policheni AN, Dayalan S, Tull D, Rathi V, Gray DH, Ritchie ME, McConville MJ, et al. (2018). Synergy between the KEAP1/NRF2 and PI3K Pathways Drives Non-Small-Cell Lung Cancer with an Altered Immune Microenvironment. Cell Metabolism 27, 935–943.e4. [DOI] [PubMed] [Google Scholar]
- Boilève A, Carlo MI, Barthélémy P, Oudard S, Borchiellini D, Voss MH, George S, Chevreau C, Landman-Parker J, Tabone M-D, et al. (2018). Immune checkpoint inhibitors in MITF family translocation renal cell carcinomas and genetic correlates of exceptional responders. J. Immunotherapy Cancer 6, 159. [DOI] [PMC free article] [PubMed] [Google Scholar]
- Boyer NP, Monkiewicz C, Menon S, Moy SS, and Gupton SL (2018). Mammalian TRIM67 Functions in Brain Development and Behavior. ENeuro 5. [DOI] [PMC free article] [PubMed] [Google Scholar]
- Brady SW, Liu Y, Ma X, Gout AM, Hagiwara K, Zhou X, Wang J, Macias M, Chen X, Easton J, et al. (2020). Pan-neuroblastoma analysis reveals age- and signature-associated driver alterations. Nat Commun 11. [DOI] [PMC free article] [PubMed] [Google Scholar]
- Braun DA, Hou Y, Bakouny Z, Ficial M, Sant’ Angelo M, Forman J, Ross-Macdonald P, Berger AC, Jegede OA, Elagina L, et al. (2020). Interplay of somatic alterations and immune infiltration modulates response to PD-1 blockade in advanced clear cell renal cell carcinoma. Nat Med 26, 909–918. [DOI] [PMC free article] [PubMed] [Google Scholar]
- Braun DA, Street K, Burke KP, Cookmeyer DL, Denize T, Pedersen CB, Gohil SH, Schindler N, Pomerance L, Hirsch L, et al. (2021a). Progressive immune dysfunction with advancing disease stage in renal cell carcinoma. Cancer Cell 39, 632–648.e8. [DOI] [PMC free article] [PubMed] [Google Scholar]
- Braun DA, Bakouny Z, Hirsch L, Flippot R, Van Allen EM, Wu CJ, and Choueiri TK (2021b). Beyond conventional immune-checkpoint inhibition — novel immunotherapies for renal cell carcinoma. Nat Rev Clin Oncol 18, 199–214. [DOI] [PMC free article] [PubMed] [Google Scholar]
- Caliò A, Segala D, Munari E, Brunelli M, and Martignoni G (2019). MiT Family Translocation Renal Cell Carcinoma: from the Early Descriptions to the Current Knowledge. Cancers (Basel) 11. [DOI] [PMC free article] [PubMed] [Google Scholar]
- Campbell PJ, Getz G, Korbel JO, Stuart JM, Jennings JL, Stein LD, Perry MD, Nahal-Bose HK, Ouellette BFF, Li CH, et al. (2020). Pan-cancer analysis of whole genomes. Nature 578, 82–93. [DOI] [PMC free article] [PubMed] [Google Scholar]
- Canela L, Selga E, García-Martínez JM, Amaral OB, Fernández-Dueñas V, Alberch J, Canela EI, Franco R, Noé V, Lluís C, et al. (2012). Transcriptional profiling of striatal neurons in response to single or concurrent activation of dopamine D2, adenosine A2A and metabotropic glutamate type 5 receptors: Focus on beta-synuclein expression. Gene 508, 199–205. [DOI] [PubMed] [Google Scholar]
- Chanzá NM, Xie W, Bilen MA, Dzimitrowicz H, Burkart J, Geynisman DM, Balakrishnan A, Bowman IA, Jain R, Stadler W, et al. (2019). Cabozantinib in advanced non-clear-cell renal cell carcinoma: a multicentre, retrospective, cohort study. Lancet Oncol 20, 581–590. [DOI] [PMC free article] [PubMed] [Google Scholar]
- Chen F, Zhang Y, Şenbabaoğlu Y, Ciriello G, Yang L, Reznik E, Shuch B, Micevic G, De Velasco G, Shinbrot E, et al. (2016a). Multilevel Genomics-Based Taxonomy of Renal Cell Carcinoma. Cell Reports 14, 2476–2489. [DOI] [PMC free article] [PubMed] [Google Scholar]
- Chen F, Zhang Y, Şenbabaoğlu Y, Ciriello G, Yang L, Reznik E, Shuch B, Micevic G, De Velasco G, Shinbrot E, et al. (2016b). Multilevel Genomics-based Taxonomy of Renal Cell Carcinoma. Cell Rep 14, 2476–2489. [DOI] [PMC free article] [PubMed] [Google Scholar]
- Choueiri TK, and Motzer RJ (2017). Systemic Therapy for Metastatic Renal-Cell Carcinoma. New England Journal of Medicine 376, 354–366. [DOI] [PubMed] [Google Scholar]
- Choueiri TK, Lim ZD, Hirsch MS, Tamboli P, Jonasch E, McDermott DF, Dal Cin P, Corn P, Vaishampayan U, Heng DYC, et al. (2010). Vascular endothelial growth factor-targeted therapy for the treatment of adult metastatic Xp11.2 translocation renal cell carcinoma. Cancer 116, 5219–5225. [DOI] [PMC free article] [PubMed] [Google Scholar]
- Clark J, Lu Y-J, Sidhar SK, Parker C, Gill S, Smedley D, Hamoudi R, Linehan WM, Shipley J, and Cooper CS (1997). Fusion of splicing factor genes PSF and NonO (p54nrb) to the TFE3 gene in papillary renal cell carcinoma. Oncogene 15, 2233–2239. [DOI] [PubMed] [Google Scholar]
- Clerici S, and Boletta A (2020). Role of the KEAP1-NRF2 Axis in Renal Cell Carcinoma. Cancers 12, 3458. [DOI] [PMC free article] [PubMed] [Google Scholar]
- Conway JR, Lex A, and Gehlenborg N (2017). UpSetR: an R package for the visualization of intersecting sets and their properties. Bioinformatics 33, 2938–2940. [DOI] [PMC free article] [PubMed] [Google Scholar]
- Crowdis J, He MX, Reardon B, and Van Allen EM (2020). CoMut: visualizing integrated molecular information with comutation plots. Bioinformatics 36, 4348–4349. [DOI] [PMC free article] [PubMed] [Google Scholar]
- Cunningham JL, Díaz de Ståhl T, Sjöblom T, Westin G, Dumanski JP, and Janson ET (2011). Common pathogenetic mechanism involving human chromosome 18 in familial and sporadic ileal carcinoid tumors. Genes Chromosomes Cancer 50, 82–94. [DOI] [PubMed] [Google Scholar]
- Damayanti NP, Budka JA, Khella HWZ, Ferris MW, Ku S-Y, Kauffman EC, Wood AC, Ahmed K, Chintala VN, Adelaiye-Ogala R, et al. (2018). Therapeutic targeting of TFE3/IRS-1/PI3K/mTOR axis in translocation renal cell carcinoma. Clinical Cancer Research clincanres.0269.2018. [DOI] [PMC free article] [PubMed] [Google Scholar]
- Dempster JM, Rossen J, Kazachkova M, Pan J, Kugener G, Root DE, and Tsherniak A (2019). Extracting Biological Insights from the Project Achilles Genome-Scale CRISPR Screens in Cancer Cell Lines. BioRxiv 720243. [Google Scholar]
- DeNicola GM, Karreth FA, Humpton TJ, Gopinathan A, Wei C, Frese K, Mangal D, Kenneth HY, Yeo CJ, and Calhoun ES (2011). Oncogene-induced Nrf2 transcription promotes ROS detoxification and tumorigenesis. Nature 475, 106–109. [DOI] [PMC free article] [PubMed] [Google Scholar]
- Dobin A, Davis CA, Schlesinger F, Drenkow J, Zaleski C, Jha S, Batut P, Chaisson M, and Gingeras TR (2013). STAR: ultrafast universal RNA-seq aligner. Bioinformatics 29, 15–21. [DOI] [PMC free article] [PubMed] [Google Scholar]
- Durinck S, Stawiski EW, Pavía-Jiménez A, Modrusan Z, Kapur P, Jaiswal BS, Zhang N, Toffessi-Tcheuyap V, Nguyen TT, Pahuja KB, et al. (2015). Spectrum of diverse genomic alterations define non–clear cell renal carcinoma subtypes. Nat Genet 47, 13–21. [DOI] [PMC free article] [PubMed] [Google Scholar]
- Efthimiou O (2018). Practical guide to the meta-analysis of rare events. Evid Based Ment Health 21, 72–76. [DOI] [PMC free article] [PubMed] [Google Scholar]
- Eisenhauer EA, Therasse P, Bogaerts J, Schwartz LH, Sargent D, Ford R, Dancey J, Arbuck S, Gwyther S, Mooney M, et al. (2009). New response evaluation criteria in solid tumours: Revised RECIST guideline (version 1.1). European Journal of Cancer 45, 228–247. [DOI] [PubMed] [Google Scholar]
- Ellrott K, Bailey MH, Saksena G, Covington KR, Kandoth C, Stewart C, Hess J, Ma S, Chiotti KE, McLellan M, et al. (2018). Scalable Open Science Approach for Mutation Calling of Tumor Exomes Using Multiple Genomic Pipelines. Cels 6, 271–281.e7. [DOI] [PMC free article] [PubMed] [Google Scholar]
- Engreitz JM, Agarwala V, and Mirny LA (2012). Three-Dimensional Genome Architecture Influences Partner Selection for Chromosomal Translocations in Human Disease. PLOS ONE 7, e44196. [DOI] [PMC free article] [PubMed] [Google Scholar]
- Ficial M, Jegede OA, Sant’Angelo M, Hou Y, Flaifel A, Pignon J-C, Braun DA, Wind-Rotolo M, Sticco-Ivins MA, Catalano PJ, et al. (2021). Expression of T-Cell Exhaustion Molecules and Human Endogenous Retroviruses as Predictive Biomarkers for Response to Nivolumab in Metastatic Clear Cell Renal Cell Carcinoma. Clin Cancer Res 27, 1371–1380. [DOI] [PMC free article] [PubMed] [Google Scholar]
- Gao Q, Liang W-W, Foltz SM, Mutharasu G, Jayasinghe RG, Cao S, Liao W-W, Reynolds SM, Wyczalkowski MA, Yao L, et al. (2018). Driver Fusions and Their Implications in the Development and Treatment of Human Cancers. Cell Reports 23, 227–238.e3. [DOI] [PMC free article] [PubMed] [Google Scholar]
- Garcia EP, Minkovsky A, Jia Y, Ducar MD, Shivdasani P, Gong X, Ligon AH, Sholl LM, Kuo FC, MacConaill LE, et al. (2017). Validation of OncoPanel: A Targeted Next-Generation Sequencing Assay for the Detection of Somatic Variants in Cancer. Arch Pathol Lab Med 141, 751–758. [DOI] [PubMed] [Google Scholar]
- Garraway LA, Widlund HR, Rubin MA, Getz G, Berger AJ, Ramaswamy S, Beroukhim R, Milner DA, Granter SR, Du J, et al. (2005). Integrative genomic analyses identify MITF as a lineage survival oncogene amplified in malignant melanoma. Nature 436, 117–122. [DOI] [PubMed] [Google Scholar]
- Ghandi M, Huang FW, Jané-Valbuena J, Kryukov GV, Lo CC, McDonald ER, Barretina J, Gelfand ET, Bielski CM, Li H, et al. (2019). Next-generation characterization of the Cancer Cell Line Encyclopedia. Nature 569, 503–508. [DOI] [PMC free article] [PubMed] [Google Scholar]
- Groenewoud MJ, and Zwartkruis FJT (2013). Rheb and Rags come together at the lysosome to activate mTORC1. Biochemical Society Transactions 41, 951–955. [DOI] [PubMed] [Google Scholar]
- Gu Z, Eils R, and Schlesner M (2016). Complex heatmaps reveal patterns and correlations in multidimensional genomic data. Bioinformatics 32, 2847–2849. [DOI] [PubMed] [Google Scholar]
- Hänzelmann S, Castelo R, and Guinney J (2013). GSVA: gene set variation analysis for microarray and RNA-Seq data. BMC Bioinformatics 14, 7. [DOI] [PMC free article] [PubMed] [Google Scholar]
- Harrer M, Cuijpers P, Furukawa T, and Ebert D (2019). Doing meta-analysis in R: A hands-on guide. PROTECT Lab Erlangen.
- Harris IS, Endress JE, Coloff JL, Selfors LM, McBrayer SK, Rosenbluth JM, Takahashi N, Dhakal S, Koduri V, Oser MG, et al. (2019). Deubiquitinases Maintain Protein Homeostasis and Survival of Cancer Cells upon Glutathione Depletion. Cell Metab 29, 1166–1181.e6. [DOI] [PMC free article] [PubMed] [Google Scholar]
- Hayes M, Peckova K, Martinek P, Hora M, Kalusova K, Straka L, Daum O, Kokoskova B, Rotterova P, Pivovarčikova K, et al. (2015). Molecular-genetic analysis is essential for accurate classification of renal carcinoma resembling Xp11.2 translocation carcinoma. Virchows Arch 466, 313–322. [DOI] [PubMed] [Google Scholar]
- Heng DYC, Xie W, Regan MM, Warren MA, Golshayan AR, Sahi C, Eigl BJ, Ruether JD, Cheng T, North S, et al. (2009). Prognostic factors for overall survival in patients with metastatic renal cell carcinoma treated with vascular endothelial growth factor-targeted agents: results from a large, multicenter study. J Clin Oncol 27, 5794–5799. [DOI] [PubMed] [Google Scholar]
- Heng DYC, Xie W, Regan MM, Harshman LC, Bjarnason GA, Vaishampayan UN, Mackenzie M, Wood L, Donskov F, Tan M-H, et al. (2013). External validation and comparison with other models of the International Metastatic Renal-Cell Carcinoma Database Consortium prognostic model: a population-based study. Lancet Oncol 14, 141–148. [DOI] [PMC free article] [PubMed] [Google Scholar]
- Hershey CL, and Fisher DE (2004). Mitf and Tfe3: members of a b-HLH-ZIP transcription factor family essential for osteoclast development and function. Bone 34, 689–696. [DOI] [PubMed] [Google Scholar]
- Hoadley KA, Yau C, Hinoue T, Wolf DM, Lazar AJ, Drill E, Shen R, Taylor AM, Cherniack AD, Thorsson V, et al. (2018). Cell-of-Origin Patterns Dominate the Molecular Classification of 10,000 Tumors from 33 Types of Cancer. Cell 173, 291–304.e6. [DOI] [PMC free article] [PubMed] [Google Scholar]
- Hoek KS, Schlegel NC, Eichhoff OM, Widmer DS, Praetorius C, Einarsson SO, Valgeirsdottir S, Bergsteinsdottir K, Schepsky A, Dummer R, et al. (2008). Novel MITF targets identified using a two-step DNA microarray strategy. Pigment Cell & Melanoma Research 21, 665–676. [DOI] [PubMed] [Google Scholar]
- Huang FW, Hodis E, Xu MJ, Kryukov GV, Chin L, and Garraway LA (2013). Highly recurrent TERT promoter mutations in human melanoma. Science 339, 957–959. [DOI] [PMC free article] [PubMed] [Google Scholar]
- Huang H, Wu Y, Fu W, Wang X, Zhou L, Xu X, Huang F, and Wu Y (2019). Downregulation of Keap1 contributes to poor prognosis and Axitinib resistance of renal cell carcinoma via upregulation of Nrf2 expression. Int J Mol Med. [DOI] [PMC free article] [PubMed] [Google Scholar]
- Inamura K, Fujiwara M, Togashi Y, Nomura K, Mukai H, Fujii Y, Yamamoto S, Yonese J, Fukui I, and Ishikawa Y (2012). Diverse Fusion Patterns and Heterogeneous Clinicopathologic Features of Renal Cell Carcinoma With t(6;11) Translocation. The American Journal of Surgical Pathology 36, 35–42. [DOI] [PubMed] [Google Scholar]
- Jansen CS, Prokhnevska N, Master VA, Sanda MG, Carlisle JW, Bilen MA, Cardenas M, Wilkinson S, Lake R, Sowalsky AG, et al. (2019). An intra-tumoral niche maintains and differentiates stem-like CD8 T cells. Nature 576, 465–470. [DOI] [PMC free article] [PubMed] [Google Scholar]
- Ji S, Xiong Y, Zhao X, Liu Y, and Yu LQ (2019). Effect of the Nrf2-ARE signaling pathway on biological characteristics and sensitivity to sunitinib in renal cell carcinoma. Oncology Letters 17, 5175–5186. [DOI] [PMC free article] [PubMed] [Google Scholar]
- Kauffman EC, Ricketts CJ, Rais-Bahrami S, Yang Y, Merino MJ, Bottaro DP, Srinivasan R, and Linehan WM (2014). Molecular genetics and cellular features of TFE3 and TFEB fusion kidney cancers. Nat Rev Urol 11, 465–475. [DOI] [PMC free article] [PubMed] [Google Scholar]
- Kim H, Kim T, Jeong B-C, Cho I-T, Han D, Takegahara N, Negishi-Koga T, Takayanagi H, Lee JH, Sul J-Y, et al. (2013). Tmem64 modulates calcium signaling during RANKL-mediated osteoclast differentiation. Cell Metab 17, 249–260. [DOI] [PMC free article] [PubMed] [Google Scholar]
- Kryukov GV, Wilson FH, Ruth JR, Paulk J, Tsherniak A, Marlow SE, Vazquez F, Weir BA, Fitzgerald ME, Tanaka M, et al. (2016). MTAP deletion confers enhanced dependency on the PRMT5 arginine methyltransferase in cancer cells. Science 351, 1214–1218. [DOI] [PMC free article] [PubMed] [Google Scholar]
- Krzywinski M, Schein J, Birol İ, Connors J, Gascoyne R, Horsman D, Jones SJ, and Marra MA (2009). Circos: An information aesthetic for comparative genomics. Genome Res. 19, 1639–1645. [DOI] [PMC free article] [PubMed] [Google Scholar]
- Lachmann A, Xu H, Krishnan J, Berger SI, Mazloom AR, and Ma’ayan A (2010). ChEA: transcription factor regulation inferred from integrating genome-wide ChIP-X experiments. Bioinformatics 26, 2438–2444. [DOI] [PMC free article] [PubMed] [Google Scholar]
- Lancaster AK, Nutter-Upham A, Lindquist S, and King OD (2014). PLAAC: a web and command-line application to identify proteins with prion-like amino acid composition. Bioinformatics 30, 2501–2502. [DOI] [PMC free article] [PubMed] [Google Scholar]
- Lee C-H, Voss MH, Carlo MI, Chen Y-B, Reznik E, Knezevic A, Lefkowitz RA, Shapnik N, Tassone D, Dadoun C, et al. (2021). Nivolumab plus cabozantinib in patients with non-clear cell renal cell carcinoma: Results of a phase 2 trial. JCO 39, 4509–4509. [Google Scholar]
- Li B, and Dewey CN (2011). RSEM: accurate transcript quantification from RNA-Seq data with or without a reference genome. BMC Bioinformatics 12, 323. [DOI] [PMC free article] [PubMed] [Google Scholar]
- Li L, Shen C, Nakamura E, Ando K, Signoretti S, Beroukhim R, Cowley GS, Lizotte P, Liberzon E, Bair S, et al. (2013). SQSTM1 Is a Pathogenic Target of 5q Copy Number Gains in Kidney Cancer. Cancer Cell 24, 738–750. [DOI] [PMC free article] [PubMed] [Google Scholar]
- Liberzon A, Birger C, Thorvaldsdóttir H, Ghandi M, Mesirov JP, and Tamayo P (2015). The Molecular Signatures Database (MSigDB) hallmark gene set collection. Cell Syst 1, 417–425. [DOI] [PMC free article] [PubMed] [Google Scholar]
- Lin C, Yang L, Tanasa B, Hutt K, Ju B, Ohgi KA, Zhang J, Rose DW, Fu X-D, Glass CK, et al. (2009). Nuclear Receptor-Induced Chromosomal Proximity and DNA Breaks Underlie Specific Translocations in Cancer. Cell 139, 1069–1083. [DOI] [PMC free article] [PubMed] [Google Scholar]
- Linehan WM (2012). Genetic basis of kidney cancer: role of genomics for the development of disease-based therapeutics. Genome Res 22, 2089–2100. [DOI] [PMC free article] [PubMed] [Google Scholar]
- Linehan WM, Schmidt LS, Crooks DR, Wei D, Srinivasan R, Lang M, and Ricketts CJ (2019). The Metabolic Basis of Kidney Cancer. Cancer Discov 9, 1006–1021. [DOI] [PubMed] [Google Scholar]
- Lipson EJ, Tawbi HA-H, Schadendorf D, Ascierto PA, Matamala L, Gutiérrez EC, Rutkowski P, Gogas H, Lao CD, Janoski de Menezes J, et al. (2021). Relatlimab (RELA) plus nivolumab (NIVO) versus NIVO in first-line advanced melanoma: Primary phase III results from RELATIVITY-047 (CA224–047). JCO 39, 9503–9503. [Google Scholar]
- Liu J, Lichtenberg T, Hoadley KA, Poisson LM, Lazar AJ, Cherniack AD, Kovatich AJ, Benz CC, Levine DA, Lee AV, et al. (2018). An Integrated TCGA Pan-Cancer Clinical Data Resource to Drive High-Quality Survival Outcome Analytics. Cell 173, 400–416.e11. [DOI] [PMC free article] [PubMed] [Google Scholar]
- Liu L, Dilworth D, Gao L, Monzon J, Summers A, Lassam N, and Hogg D (1999). Mutation of the CDKN2A 5’ UTR creates an aberrant initiation codon and predisposes to melanoma. Nature Genetics 21, 128–132. [DOI] [PubMed] [Google Scholar]
- Liu W, Xie Y, Ma J, Luo X, Nie P, Zuo Z, Lahrmann U, Zhao Q, Zheng Y, Zhao Y, et al. (2015). IBS: an illustrator for the presentation and visualization of biological sequences. Bioinformatics 31, 3359–3361. [DOI] [PMC free article] [PubMed] [Google Scholar]
- Malouf GG, Camparo P, Oudard S, Schleiermacher G, Theodore C, Rustine A, Dutcher J, Billemont B, Rixe O, Bompas E, et al. (2010). Targeted agents in metastatic Xp11 translocation/TFE3 gene fusion renal cell carcinoma (RCC): a report from the Juvenile RCC Network. Ann. Oncol 21, 1834–1838. [DOI] [PubMed] [Google Scholar]
- Malouf GG, Monzon FA, Couturier J, Molinié V, Escudier B, Camparo P, Su X, Yao H, Tamboli P, Lopez-Terrada D, et al. (2013). Genomic heterogeneity of translocation renal cell carcinoma. Clin. Cancer Res 19, 4673–4684. [DOI] [PMC free article] [PubMed] [Google Scholar]
- Malouf GG, Su X, Yao H, Gao J, Xiong L, He Q, Compérat E, Couturier J, Molinié V, Escudier B, et al. (2014). Next-Generation Sequencing of Translocation Renal Cell Carcinoma Reveals Novel RNA Splicing Partners and Frequent Mutations of Chromatin-Remodeling Genes. Clin Cancer Res 20, 4129–4140. [DOI] [PMC free article] [PubMed] [Google Scholar]
- Marchler-Bauer A, Derbyshire MK, Gonzales NR, Lu S, Chitsaz F, Geer LY, Geer RC, He J, Gwadz M, Hurwitz DI, et al. (2015). CDD: NCBI’s conserved domain database. Nucleic Acids Res 43, D222–226. [DOI] [PMC free article] [PubMed] [Google Scholar]
- Marcon J, DiNatale RG, Sanchez A, Kotecha RR, Gupta S, Kuo F, Makarov V, Sandhu A, Mano R, Silagy AW, et al. (2020a). Comprehensive Genomic Analysis of Translocation Renal Cell Carcinoma Reveals Copy-Number Variations as Drivers of Disease Progression. Clin. Cancer Res [DOI] [PMC free article] [PubMed] [Google Scholar]
- Marcon J, DiNatale RG, Sanchez A, Kotecha RR, Gupta S, Kuo F, Makarov V, Sandhu A, Mano R, Silagy AW, et al. (2020b). Comprehensive Genomic Analysis of Translocation Renal Cell Carcinoma Reveals Copy-Number Variations as Drivers of Disease Progression. Clin Cancer Res 26, 3629–3640. [DOI] [PMC free article] [PubMed] [Google Scholar]
- Mavrakis KJ, McDonald ER, Schlabach MR, Billy E, Hoffman GR, deWeck A, Ruddy DA, Venkatesan K, Yu J, McAllister G, et al. (2016). Disordered methionine metabolism in MTAP/CDKN2A-deleted cancers leads to dependence on PRMT5. Science 351, 1208–1213. [DOI] [PubMed] [Google Scholar]
- McConnell M, Feng S, Chen W, Zhu G, Deng L, and Li Y-P (2015). Atp6v1c1 Facilitates Breast Cancer Growth and Bone Metastasis through the mTORC1 Pathway. The FASEB Journal 29, 284.8. [Google Scholar]
- McDermott DF, Lee J-L, Ziobro M, Suarez C, Langiewicz P, Matveev VB, Wiechno P, Gafanov RA, Tomczak P, Pouliot F, et al. (2021). Open-Label, Single-Arm, Phase II Study of Pembrolizumab Monotherapy as First-Line Therapy in Patients With Advanced Non-Clear Cell Renal Cell Carcinoma. J Clin Oncol 39, 1029–1039. [DOI] [PMC free article] [PubMed] [Google Scholar]
- McFarland JM, Ho ZV, Kugener G, Dempster JM, Montgomery PG, Bryan JG, Krill-Burger JM, Green TM, Vazquez F, Boehm JS, et al. (2018). Improved estimation of cancer dependencies from large-scale RNAi screens using model-based normalization and data integration. Nat Commun 9, 4610. [DOI] [PMC free article] [PubMed] [Google Scholar]
- McGregor BA, McKay RR, Braun DA, Werner L, Gray K, Flaifel A, Signoretti S, Hirsch MS, Steinharter JA, Bakouny Z, et al. (2020). Results of a Multicenter Phase II Study of Atezolizumab and Bevacizumab for Patients With Metastatic Renal Cell Carcinoma With Variant Histology and/or Sarcomatoid Features. J Clin Oncol 38, 63–70. [DOI] [PMC free article] [PubMed] [Google Scholar]
- Menegon S, Columbano A, and Giordano S (2016). The Dual Roles of NRF2 in Cancer. Trends in Molecular Medicine 22, 578–593. [DOI] [PubMed] [Google Scholar]
- Meyers RM, Bryan JG, McFarland JM, Weir BA, Sizemore AE, Xu H, Dharia NV, Montgomery PG, Cowley GS, Pantel S, et al. (2017). Computational correction of copy number effect improves specificity of CRISPR-Cas9 essentiality screens in cancer cells. Nat Genet 49, 1779–1784. [DOI] [PMC free article] [PubMed] [Google Scholar]
- Moch H, Cubilla AL, Humphrey PA, Reuter VE, and Ulbright TM (2016). The 2016 WHO Classification of Tumours of the Urinary System and Male Genital Organs—Part A: Renal, Penile, and Testicular Tumours. European Urology 70, 93–105. [DOI] [PubMed] [Google Scholar]
- Motzer RJ, Escudier B, McDermott DF, George S, Hammers HJ, Srinivas S, Tykodi SS, Sosman JA, Procopio G, Plimack ER, et al. (2015). Nivolumab versus Everolimus in Advanced Renal-Cell Carcinoma. New England Journal of Medicine 373, 1803–1813. [DOI] [PMC free article] [PubMed] [Google Scholar]
- Motzer RJ, Banchereau R, Hamidi H, Powles T, McDermott D, Atkins MB, Escudier B, Liu L-F, Leng N, Abbas AR, et al. (2020). Molecular Subsets in Renal Cancer Determine Outcome to Checkpoint and Angiogenesis Blockade. Cancer Cell 38, 803–817.e4. [DOI] [PMC free article] [PubMed] [Google Scholar]
- Naqash AR, O’Sullivan Coyne GH, Moore N, Sharon E, Takebe N, Fino KK, Ferry-Galow KV, Hu JS, Van Tine BA, Burgess MA, et al. (2021). Phase II study of atezolizumab in advanced alveolar soft part sarcoma (ASPS). JCO 39, 11519–11519. [Google Scholar]
- Newman AM, Steen CB, Liu CL, Gentles AJ, Chaudhuri AA, Scherer F, Khodadoust MS, Esfahani MS, Luca BA, Steiner D, et al. (2019). Determining cell type abundance and expression from bulk tissues with digital cytometry. Nature Biotechnology 37, 773–782. [DOI] [PMC free article] [PubMed] [Google Scholar]
- Ooi A, Wong J-C, Petillo D, Roossien D, Perrier-Trudova V, Whitten D, Min BWH, Tan M-H, Zhang Z, Yang XJ, et al. (2011). An Antioxidant Response Phenotype Shared between Hereditary and Sporadic Type 2 Papillary Renal Cell Carcinoma. Cancer Cell 20, 511–523. [DOI] [PubMed] [Google Scholar]
- Pignon J-C, Jegede O, Shukla SA, Braun DA, Horak CE, Wind-Rotolo M, Ishii Y, Catalano PJ, Grosha J, Flaifel A, et al. (2019). irRECIST for the Evaluation of Candidate Biomarkers of Response to Nivolumab in Metastatic Clear Cell Renal Cell Carcinoma: Analysis of a Phase II Prospective Clinical Trial. Clin Cancer Res 25, 2174–2184. [DOI] [PMC free article] [PubMed] [Google Scholar]
- Ramos AH, Lichtenstein L, Gupta M, Lawrence MS, Pugh TJ, Saksena G, Meyerson M, and Getz G (2015). Oncotator: cancer variant annotation tool. Hum Mutat 36, E2423–2429. [DOI] [PMC free article] [PubMed] [Google Scholar]
- Rees MG, Seashore-Ludlow B, Cheah JH, Adams DJ, Price EV, Gill S, Javaid S, Coletti ME, Jones VL, Bodycombe NE, et al. (2016a). Correlating chemical sensitivity and basal gene expression reveals mechanism of action. Nat Chem Biol 12, 109–116. [DOI] [PMC free article] [PubMed] [Google Scholar]
- Rees MG, Seashore-Ludlow B, Cheah JH, Adams DJ, Price EV, Gill S, Javaid S, Coletti ME, Jones VL, Bodycombe NE, et al. (2016b). Correlating chemical sensitivity and basal gene expression reveals mechanism of action. Nat Chem Biol 12, 109–116. [DOI] [PMC free article] [PubMed] [Google Scholar]
- Rezaei KA, Chen Y, Cai J, and Sternberg P (2008). Modulation of Nrf2-Dependent Antioxidant Functions in the RPE by Zip2, a Zinc Transporter Protein. Invest. Ophthalmol. Vis. Sci 49, 1665–1670. [DOI] [PubMed] [Google Scholar]
- Ricketts CJ, De Cubas AA, Fan H, Smith CC, Lang M, Reznik E, Bowlby R, Gibb EA, Akbani R, Beroukhim R, et al. (2018a). The Cancer Genome Atlas Comprehensive Molecular Characterization of Renal Cell Carcinoma. Cell Reports 23, 313–326.e5. [DOI] [PMC free article] [PubMed] [Google Scholar]
- Ricketts CJ, De Cubas AA, Fan H, Smith CC, Lang M, Reznik E, Bowlby R, Gibb EA, Akbani R, Beroukhim R, et al. (2018b). The Cancer Genome Atlas Comprehensive Molecular Characterization of Renal Cell Carcinoma. Cell Rep 23, 313–326.e5. [DOI] [PMC free article] [PubMed] [Google Scholar]
- Rini BI, Powles T, Atkins MB, Escudier B, McDermott DF, Suarez C, Bracarda S, Stadler WM, Donskov F, Lee JL, et al. (2019). Atezolizumab plus bevacizumab versus sunitinib in patients with previously untreated metastatic renal cell carcinoma (IMmotion151): a multicentre, open-label, phase 3, randomised controlled trial. The Lancet 393, 2404–2415. [DOI] [PubMed] [Google Scholar]
- Ritchie ME, Phipson B, Wu D, Hu Y, Law CW, Shi W, and Smyth GK (2015). limma powers differential expression analyses for RNA-sequencing and microarray studies. Nucleic Acids Res 43, e47. [DOI] [PMC free article] [PubMed] [Google Scholar]
- Roix JJ, McQueen PG, Munson PJ, Parada LA, and Misteli T (2003). Spatial proximity of translocation-prone gene loci in human lymphomas. Nature Genetics 34, 287–291. [DOI] [PubMed] [Google Scholar]
- Romero R, Sánchez-Rivera FJ, Westcott PMK, Mercer KL, Bhutkar A, Muir A, González Robles TJ, Lamboy Rodríguez S, Liao LZ, Ng SR, et al. (2020). Keap1 mutation renders lung adenocarcinomas dependent on Slc33a1. Nature Cancer 1, 589–602. [DOI] [PMC free article] [PubMed] [Google Scholar]
- Rua Fernández OR, Escala Cornejo R, Navarro Martín M, García Muñoz M, Antunez Plaza P, García Dominguez AR, and Cruz Hernández JJ (2018). Renal Cell Carcinoma Associated With Xp11.2 Translocation/TFE3 Gene-fusion: A Long Response to mammalian target of rapamycin (mTOR) Inhibitors. Urology 117, 41–43. [DOI] [PubMed] [Google Scholar]
- Sato Y, Yoshizato T, Shiraishi Y, Maekawa S, Okuno Y, Kamura T, Shimamura T, Sato-Otsubo A, Nagae G, Suzuki H, et al. (2013). Integrated molecular analysis of clear-cell renal cell carcinoma. Nature Genetics 45, 860–867. [DOI] [PubMed] [Google Scholar]
- Seashore-Ludlow B, Rees MG, Cheah JH, Cokol M, Price EV, Coletti ME, Jones V, Bodycombe NE, Soule CK, Gould J, et al. (2015). Harnessing Connectivity in a Large-Scale Small-Molecule Sensitivity Dataset. Cancer Discov 5, 1210–1223. [DOI] [PMC free article] [PubMed] [Google Scholar]
- Sequist LV, and Neal JW (2021). Personalized, genotype-directed therapy for advanced non-small cell lung cancer. UpToDate.
- Sidhar SK, Clark J, Gill S, Hamoudi R, Crew AJ, Gwilliam R, Ross M, Linehan WM, Birdsall S, Shipley J, et al. (1996). The t(X;1)(p11.2;q21.2) translocation in papillary renal cell carcinoma fuses a novel gene PRCC to the TFE3 transcription factor gene. Hum Mol Genet 5, 1333–1338. [DOI] [PubMed] [Google Scholar]
- Sondka Z, Bamford S, Cole CG, Ward SA, Dunham I, and Forbes SA (2018). The COSMIC Cancer Gene Census: describing genetic dysfunction across all human cancers. Nature Reviews Cancer 18, 696–705. [DOI] [PMC free article] [PubMed] [Google Scholar]
- Sporn M, and Liby K (2012). NRF2 and cancer: the good, the bad and the importance of context. Nature Reviews. Cancer 12. [DOI] [PMC free article] [PubMed] [Google Scholar]
- Star EN, Zhu M, Shi Z, Liu H, Pashmforoush M, Sauve Y, Bruneau BG, and Chow RL (2012). Regulation of retinal interneuron subtype identity by the Iroquois homeobox gene Irx6. Development 139, 4644–4655. [DOI] [PMC free article] [PubMed] [Google Scholar]
- Suarez-Merino B, Hubank M, Revesz T, Harkness W, Hayward R, Thompson D, Darling JL, Thomas DGT, and Warr TJ (2005). Microarray analysis of pediatric ependymoma identifies a cluster of 112 candidate genes including four transcripts at 22q12.1-q13.3,. Neuro-Oncol 7, 20–31. [DOI] [PMC free article] [PubMed] [Google Scholar]
- Subramanian A, Tamayo P, Mootha VK, Mukherjee S, Ebert BL, Gillette MA, Paulovich A, Pomeroy SL, Golub TR, Lander ES, et al. (2005). Gene set enrichment analysis: a knowledge-based approach for interpreting genome-wide expression profiles. Proc. Natl. Acad. Sci. U.S.A 102, 15545–15550. [DOI] [PMC free article] [PubMed] [Google Scholar]
- Sukov WR, Hodge JC, Lohse CM, Leibovich BC, Thompson RH, Pearce KE, Wiktor AE, and Cheville JC (2012). TFE3 rearrangements in adult renal cell carcinoma: clinical and pathologic features with outcome in a large series of consecutively treated patients. Am J Surg Pathol 36, 663–670. [DOI] [PubMed] [Google Scholar]
- Sun M, Luong G, Plastikwala F, and Sun Y (2020). Control of Rab7a activity and localization through endosomal type Igamma PIP 5‐kinase is required for endosome maturation and lysosome function. FASEB j. 34, 2730–2748. [DOI] [PMC free article] [PubMed] [Google Scholar]
- Takahashi N, Cho P, Selfors LM, Kuiken HJ, Kaul R, Fujiwara T, Harris IS, Zhang T, Gygi SP, and Brugge JS (2020). 3D Culture Models with CRISPR Screens Reveal Hyperactive NRF2 as a Prerequisite for Spheroid Formation via Regulation of Proliferation and Ferroptosis. Molecular Cell 80, 828–844.e6. [DOI] [PMC free article] [PubMed] [Google Scholar]
- Taylor AM, Shih J, Ha G, Gao GF, Zhang X, Berger AC, Schumacher SE, Wang C, Hu H, Liu J, et al. (2018). Genomic and Functional Approaches to Understanding Cancer Aneuploidy. Cancer Cell 33, 676–689.e3. [DOI] [PMC free article] [PubMed] [Google Scholar]
- The Cancer Genome Atlas Network (2016). Comprehensive Molecular Characterization of Papillary Renal-Cell Carcinoma. New England Journal of Medicine 374, 135–145. [DOI] [PMC free article] [PubMed] [Google Scholar]
- Trpkov K, Hes O, Williamson SR, Adeniran AJ, Agaimy A, Alaghehbandan R, Amin MB, Argani P, Chen Y-B, Cheng L, et al. (2021). New developments in existing WHO entities and evolving molecular concepts: The Genitourinary Pathology Society (GUPS) update on renal neoplasia. Mod Pathol 34, 1392–1424. [DOI] [PubMed] [Google Scholar]
- Tsherniak A, Vazquez F, Montgomery PG, Weir BA, Kryukov G, Cowley GS, Gill S, Harrington WF, Pantel S, Krill-Burger JM, et al. (2017). Defining a Cancer Dependency Map. Cell 170, 564–576.e16. [DOI] [PMC free article] [PubMed] [Google Scholar]
- Turajlic S, Xu H, Litchfield K, Rowan A, Chambers T, Lopez JI, Nicol D, O’Brien T, Larkin J, Horswell S, et al. (2018). Tracking Cancer Evolution Reveals Constrained Routes to Metastases: TRACERx Renal. Cell 173, 581–594.e12. [DOI] [PMC free article] [PubMed] [Google Scholar]
- Veroniki AA, Jackson D, Viechtbauer W, Bender R, Bowden J, Knapp G, Kuss O, Higgins JP, Langan D, and Salanti G (2016). Methods to estimate the between‐study variance and its uncertainty in meta‐analysis. Res Synth Methods 7, 55–79. [DOI] [PMC free article] [PubMed] [Google Scholar]
- Viswanathan SR, Nogueira MF, Buss CG, Krill-Burger JM, Wawer MJ, Malolepsza E, Berger AC, Choi PS, Shih J, Taylor AM, et al. (2018). Genome-scale analysis identifies paralog lethality as a vulnerability of chromosome 1p loss in cancer. Nat Genet 50, 937–943. [DOI] [PMC free article] [PubMed] [Google Scholar]
- Viswanathan VS, Ryan MJ, Dhruv HD, Gill S, Eichhoff OM, Seashore-Ludlow B, Kaffenberger SD, Eaton JK, Shimada K, Aguirre AJ, et al. (2017). Dependency of a therapy-resistant state of cancer cells on a lipid peroxidase pathway. Nature 547, 453–457. [DOI] [PMC free article] [PubMed] [Google Scholar]
- Vokes NI, Liu D, Ricciuti B, Jimenez-Aguilar E, Rizvi H, Dietlein F, He MX, Margolis CA, Elmarakeby HA, Girshman J, et al. (2019). Harmonization of Tumor Mutational Burden Quantification and Association With Response to Immune Checkpoint Blockade in Non–Small-Cell Lung Cancer. JCO Precision Oncology 1–12. [DOI] [PMC free article] [PubMed] [Google Scholar]
- Walker GJ, Flores JF, Glendening JM, Lin A (Hsui-T., Markl IDC, and Fountain JW (1998). Virtually 100% of melanoma cell lines harbor alterations at the DNA level within CDKN2A, CDKN2B, or one of their downstream targets. Genes, Chromosomes and Cancer 22, 157–163. [DOI] [PubMed] [Google Scholar]
- Wang X, Fang R, Zhang R, Ye S, Li R, Wang X, Pan R, Liu C, Chen J, Zhao M, et al. (2020). Malignant melanotic Xp11 neoplasms exhibit a clinicopathologic spectrum and gene expression profiling akin to alveolar soft part sarcoma: a proposal for reclassification. J. Pathol 251, 365–377. [DOI] [PubMed] [Google Scholar]
- Wang X-T, Xia Q-Y, Ye S-B, Wang X, Li R, Fang R, Shi S-S, Zhang R-S, Tan X, Chen J-Y, et al. (2018). RNA sequencing of Xp11 translocation-associated cancers reveals novel gene fusions and distinctive clinicopathologic correlations. Mod. Pathol [DOI] [PubMed] [Google Scholar]
- Xia Q-Y, Wang X-T, Ye S-B, Wang X, Li R, Shi S-S, Fang R, Zhang R-S, Ma H-H, Lu Z-F, et al. (2018). Novel gene fusion of PRCC–MITF defines a new member of MiT family translocation renal cell carcinoma: clinicopathological analysis and detection of the gene fusion by RNA sequencing and FISH. Histopathology 72, 786–794. [DOI] [PubMed] [Google Scholar]
- Xie Z, Bailey A, Kuleshov MV, Clarke DJB, Evangelista JE, Jenkins SL, Lachmann A, Wojciechowicz ML, Kropiwnicki E, Jagodnik KM, et al. (2021). Gene Set Knowledge Discovery with Enrichr. Current Protocols 1, e90. [DOI] [PMC free article] [PubMed] [Google Scholar]
- Xu L, Yang R, Gan W, Chen X, Qiu X, Fu K, Huang J, Zhu G, and Guo H (2015). Xp11.2 translocation renal cell carcinomas in young adults. BMC Urology 15, 57. [DOI] [PMC free article] [PubMed] [Google Scholar]
- Xue D, Zhou X, and Qiu J (2020). Emerging role of NRF2 in ROS-mediated tumor chemoresistance. Biomed Pharmacother 131, 110676. [DOI] [PubMed] [Google Scholar]
- Yang W, Lee K-W, Srivastava RM, Kuo F, Krishna C, Chowell D, Makarov V, Hoen D, Dalin MG, Wexler L, et al. (2019). Immunogenic neoantigens derived from gene fusions stimulate T cell responses. Nature Medicine 25, 767–775. [DOI] [PMC free article] [PubMed] [Google Scholar]
- Zehir A, Benayed R, Shah RH, Syed A, Middha S, Kim HR, Srinivasan P, Gao J, Chakravarty D, Devlin SM, et al. (2017). Mutational landscape of metastatic cancer revealed from prospective clinical sequencing of 10,000 patients. Nature Medicine 23, 703–713. [DOI] [PMC free article] [PubMed] [Google Scholar]
- Zhong M, De Angelo P, Osborne L, Keane-Tarchichi M, Goldfischer M, Edelmann L, Yang Y, Linehan WM, Merino MJ, Aisner S, et al. (2010). Dual-color, Break-apart FISH Assay on Paraffin-embedded Tissues as an Adjunct to Diagnosis of Xp11 Translocation Renal Cell Carcinoma and Alveolar Soft Part Sarcoma. The American Journal of Surgical Pathology 34, 757–766. [DOI] [PMC free article] [PubMed] [Google Scholar]
- Zhong M, De Angelo P, Osborne L, Paniz-Mondolfi AE, Geller M, Yang Y, Linehan WM, Merino MJ, Cordon-Cardo C, and Cai D (2012). Translocation renal cell carcinomas in adults: a single-institution experience. Am J Surg Pathol 36, 654–662. [DOI] [PMC free article] [PubMed] [Google Scholar]
Associated Data
This section collects any data citations, data availability statements, or supplementary materials included in this article.
Supplementary Materials
Related to Figure 3. List and legend of functional domains used in the annotation of MiT/TFE and partners genes in Figures 3D-E.
Related to Figure 6. Sample-level data for the multiparametric immunofluorescence cohort.
Related to Figure 1. List of samples in the NGS datasets included in the analysis.
Related to Figure 4. List of genes that are in the TFE3-fusion-specific transcriptional signature developed in Figure 4A.
Related to STAR Methods. Sample-level MAF (Table S5B) and gene-level copy number (Table S5B) data for the OncoPanel cohort.
Related to Figure 4. RSEM expected counts (Table S3A) and transcript-per-million (TPM; Table S3B) derived from the RNA-sequencing of the cell lines in the in vitro experiment represented in Figure 4A.
Data Availability Statement
RNA-seq data have been deposited in the Gene Expression Omnibus (GEO) and are publicly available as of the date of publication. Accession numbers are listed in the key resources table.
The list of samples used (including the data types available) and sequencing platform used for DNA-sequencing (WGS, WES, or panel) are provided in Table S1. The expression matrix (RSEM expected counts and TPMs) derived from the RNA-sequencing of the cell lines in the in vitro experiment represented in Figure 4A is provided in Table S3. For the OncoPanel cohort, sample-level data (mutation, copy number, and clinical metadata) are provided in Table S5. Sample-level data from the multiparametric immunofluorescence cohort are provided in Table S6.
This paper analyzes existing, publicly available data, links to the datasets used are listed in the key resources table.
All other data reported in this paper will be shared by the lead contact upon request.
Algorithms used for data analysis are all publicly available from the indicated references in the STAR Methods section. This paper does not report original code.
Any additional information required to reanalyze the data reported in this paper is available from the lead contact upon request.
KEY RESOURCES TABLE